dynamic response of single crystalline copper subjected to
TRANSCRIPT

A
csdDicttP
K
1
ioucoto[dlplp(
0d
Materials Science and Engineering A 463 (2007) 249–262
Dynamic response of single crystalline copper subjectedto quasi-isentropic, gas-gun driven loading
H. Jarmakani a,∗, J.M. McNaney b, B. Kad a, D. Orlikowski b,J.H. Nguyen b, M.A. Meyers a
a Materials Science Program, Mechanical and Aerospace Engineering Department, University of California,San Diego, La Jolla, CA 92093 0418, United States
b Lawrence Livermore National Laboratory, Livermore, CA 94550, United States
Received 10 June 2006; received in revised form 21 September 2006; accepted 21 September 2006
bstract
A transmission electron microscopy study of quasi-isentropic gas-gun loading (peak pressures between 18 and 52 GPa) of [0 0 1] monocrystallineopper was carried out. The defect substructures at these different pressures were analyzed. Current experimental evidence suggests a deformationubstructure that transitions from slip to twinning, where twinning occurs at the higher pressures (∼52 GPa), and heavily dislocated laths andislocation cells take place at the intermediate and lower pressures. Evidence of stacking faults at the intermediate pressures was also found.islocation cell sizes decreased with increasing pressure and increased with distance away from the surface of impact. The results from the quasi-
sentropic experiments are compared with those for flyer-plate and laser shock experiments reported in the literature. The Preston–Tonks–Wallace
onstitutive description is used to model both quasi-isentropic and shock compression experiments and predict the pressure at which the slip-winning transition occurs in both cases. The model predicts a higher twinning transition pressure for isentropic than for shock experiments, andhat twinning should not take place in the quasi-isentropic compression experiments given the loading paths investigated.ublished by Elsevier B.V.ts; La
1pm
eaqiwtdp
eywords: Isentropic compression; Twinning transition; Microstructural defec
. Introduction
The response of copper to very high strain-rate deformations reasonably well understood. In particular, shock experimentsn copper have been carried out for over 50 years. Techniquessing explosives and flyer plates were first employed to create theompressive pulse in the material, and pressures attained weren the order of tens of GPa with accompanying strain rates onhe order of 104 s−1 with durations on the order of microsecondsr fractions thereof. Early experiments by Johari and Thomas1] investigated defect substructures generated in explosivelyeformed copper and copper–aluminum alloys. More recently,
aser pulses have been used to study shock compression in cop-er. The rapid heating and thermal expansion of the surfaceayers causes a shock to propagate through the material. Shockressures higher than planar impact set-ups can be achievedup to 75,000 GPa), and the strain rates attained are as high as∗ Corresponding author. Tel.: +1 858 534 6091; fax: +1 858 534 5698.E-mail address: [email protected] (H. Jarmakani).
taptEccw
921-5093/$ – see front matter. Published by Elsevier B.V.oi:10.1016/j.msea.2006.09.118
ser shock; Gas-gun; Copper
09 to 1011 s−1. A basic difference is that the duration of theulse in laser-shock is on the order of nanoseconds rather thanicroseconds.In this work, however, quasi-isentropic compression
xperiments via gas-gun, are carried out on [0 0 1] copper,nd the recovered deformation substructure is analyzed. Theuasi-isentropic compression experiments (ICE) the quasi-sentropic compression experiments is a shockless processhere very high pressure conditions can be accessed, and
he accompanying temperature rise is much less severe thanuring shock experiments. The main motivation behind such arocess is that the solid state of a material can be retained dueo the lower temperatures experienced, and an understandingnd characterization of the material response is, therefore,ossible. In fact, quasi-isentropic experiments come very closeo simulating conditions that occur in the depths of planets [2].
ntropy, the measure of the randomness of a system, does nothange with depth in planets. Only temperature and pressurehanges are experienced. ICE experiments in the early 1970sere aimed at mimicking these conditions.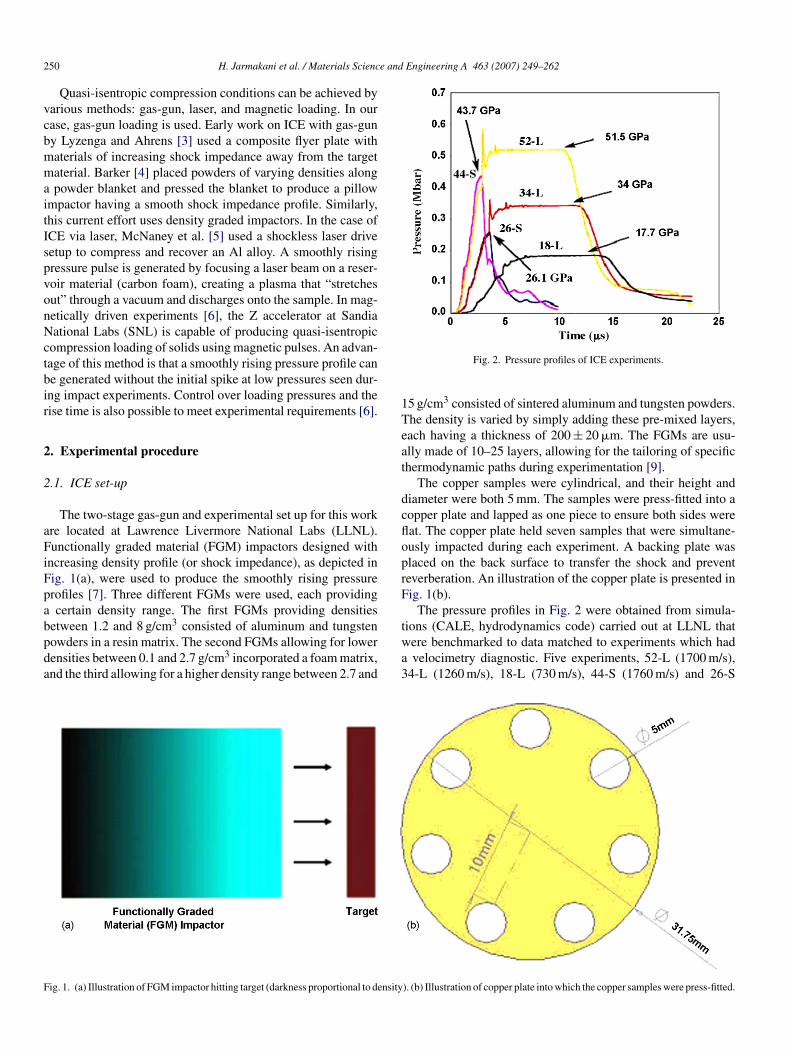
2 e and Engineering A 463 (2007) 249–262
vcbmmaitIspvonNctbir
2
2
aFiFpabpda
1Teat
dcfloprF
F
50 H. Jarmakani et al. / Materials Scienc
Quasi-isentropic compression conditions can be achieved byarious methods: gas-gun, laser, and magnetic loading. In ourase, gas-gun loading is used. Early work on ICE with gas-guny Lyzenga and Ahrens [3] used a composite flyer plate withaterials of increasing shock impedance away from the targetaterial. Barker [4] placed powders of varying densities alongpowder blanket and pressed the blanket to produce a pillow
mpactor having a smooth shock impedance profile. Similarly,his current effort uses density graded impactors. In the case ofCE via laser, McNaney et al. [5] used a shockless laser driveetup to compress and recover an Al alloy. A smoothly risingressure pulse is generated by focusing a laser beam on a reser-oir material (carbon foam), creating a plasma that “stretchesut” through a vacuum and discharges onto the sample. In mag-etically driven experiments [6], the Z accelerator at Sandiaational Labs (SNL) is capable of producing quasi-isentropic
ompression loading of solids using magnetic pulses. An advan-age of this method is that a smoothly rising pressure profile cane generated without the initial spike at low pressures seen dur-ng impact experiments. Control over loading pressures and theise time is also possible to meet experimental requirements [6].
. Experimental procedure
.1. ICE set-up
The two-stage gas-gun and experimental set up for this workre located at Lawrence Livermore National Labs (LLNL).unctionally graded material (FGM) impactors designed with
ncreasing density profile (or shock impedance), as depicted inig. 1(a), were used to produce the smoothly rising pressurerofiles [7]. Three different FGMs were used, each providingcertain density range. The first FGMs providing densities
etween 1.2 and 8 g/cm3 consisted of aluminum and tungstenowders in a resin matrix. The second FGMs allowing for lowerensities between 0.1 and 2.7 g/cm3 incorporated a foam matrix,nd the third allowing for a higher density range between 2.7 and
twa3
ig. 1. (a) Illustration of FGM impactor hitting target (darkness proportional to density
Fig. 2. Pressure profiles of ICE experiments.
5 g/cm3 consisted of sintered aluminum and tungsten powders.he density is varied by simply adding these pre-mixed layers,ach having a thickness of 200 ± 20 �m. The FGMs are usu-lly made of 10–25 layers, allowing for the tailoring of specifichermodynamic paths during experimentation [9].
The copper samples were cylindrical, and their height andiameter were both 5 mm. The samples were press-fitted into aopper plate and lapped as one piece to ensure both sides wereat. The copper plate held seven samples that were simultane-usly impacted during each experiment. A backing plate waslaced on the back surface to transfer the shock and preventeverberation. An illustration of the copper plate is presented inig. 1(b).
The pressure profiles in Fig. 2 were obtained from simula-
ions (CALE, hydrodynamics code) carried out at LLNL thatere benchmarked to data matched to experiments which hadvelocimetry diagnostic. Five experiments, 52-L (1700 m/s),4-L (1260 m/s), 18-L (730 m/s), 44-S (1760 m/s) and 26-S
). (b) Illustration of copper plate into which the copper samples were press-fitted.

H. Jarmakani et al. / Materials Science an
Table 1Pressure profile data: strain, strain-rate, peak pressure
Set no. Velocity(km/s)
Equivalentplastic strain (ε)
Strain rate(ε̇ (s−1))
Peak pressure(GPa)
A 1.7 −0.3 6.49 × 10⁴ 52D 1.76 −0.23 5.67 × 10⁴ 44B 1.26 −0.21 3.69 × 10⁴ 34E 4
C
(poafi1(itpoiTdS“iott
ftpasSiS
2
mafaiw
2p
tmpsfu1H
3
3
iidahpbpa
1.26 −0.15 4.44 × 10 260.73 −0.11 1.80 × 10⁴ 18
1260 m/s), were carried out, with 52-L experiencing the highestressure of 52 GPa and 18-L experiencing the lowest pressuref 18 GPa. Table 1 shows the pressures, strains and strain rateschieved in the different experiments. Two distinct pressure pro-les were attained, one having a hold-time of approximately0 �s (“long pulse”—L) and one having relatively no hold timeor a “short pulse”—S). The long-pulse samples belong to exper-ments 52-L, 34-L and 18-L, and the short-pulse samples belongo 44-S and 26-S. It should be noted that the “long-pulse” sam-les 52-L and 34-L exhibited a slight spike or shock at thenset of the pulse duration due to the experimental setup caus-ng a deviation from the desired quasi-isentropic conditions.he likely effect on the microstructural deformation process isiscussed in Section 3. In the case of experiments 44-S, 26-and 18-L that were closest to the desired isentropic ideal,
shocking-up”, which is the steepening of the isentropic wavento a shockwave as it propagates through the sample, did notccur in the CALE simulations. This was concluded by studyinghe temperature profiles generated by CALE, and a “jump” inemperature was not observed.
The as-recovered samples belonging to each batch were in theorm of cylindrical specimens having an average diameter andhickness of 6 and 3.6 mm, respectively. Analysis of these sam-les enabled the comparison of the deformation mechanismsctivated at this broad range of pressures. The strain rate ver-us pressure plot for these ICE experiments is given in Fig. 3.
4 −1
train rates achieved were on the order of 10 s . A compar-son of the current data with shock experiments is provided inection 4.Fig. 3. Strain rate vs. pressure for ICE.
3
eSwtspthswiDasew
d Engineering A 463 (2007) 249–262 251
.2. Micro-hardness measurements
Microhardness measurements were performed on allonocrystalline samples. After polishing to eliminate the heat
ffected zone (∼50 �m on each side) and provide a smooth sur-ace, the impacted surface was indented using a Vickers tipttached to a Leco: M-400-H1 microhardness machine. Tenndents were taken on each polished surface, and the load appliedas by a mass of 200 g, with a hold time of 15 s.
.3. The transmission electron microscopy (TEM) samplereparation
Cylindrical cuts having a diameter of 3 mm were madehrough the center of each specimen by electrical discharge
achining (EDM). Fig. 4 shows a typical as-recovered sam-le. TEM specimens were then sliced from each cylinder (ashown in Fig. 4). An average of four TEM foils was extractedrom each sample. The specimens were further polished downsing 1200, 2400, and 4000 grit paper, respectively, to about00 �m. The foils were electropolished using a solution of 7%2SO4 in methanol for TEM imaging.
. Results and discussion
.1. Microhardness results
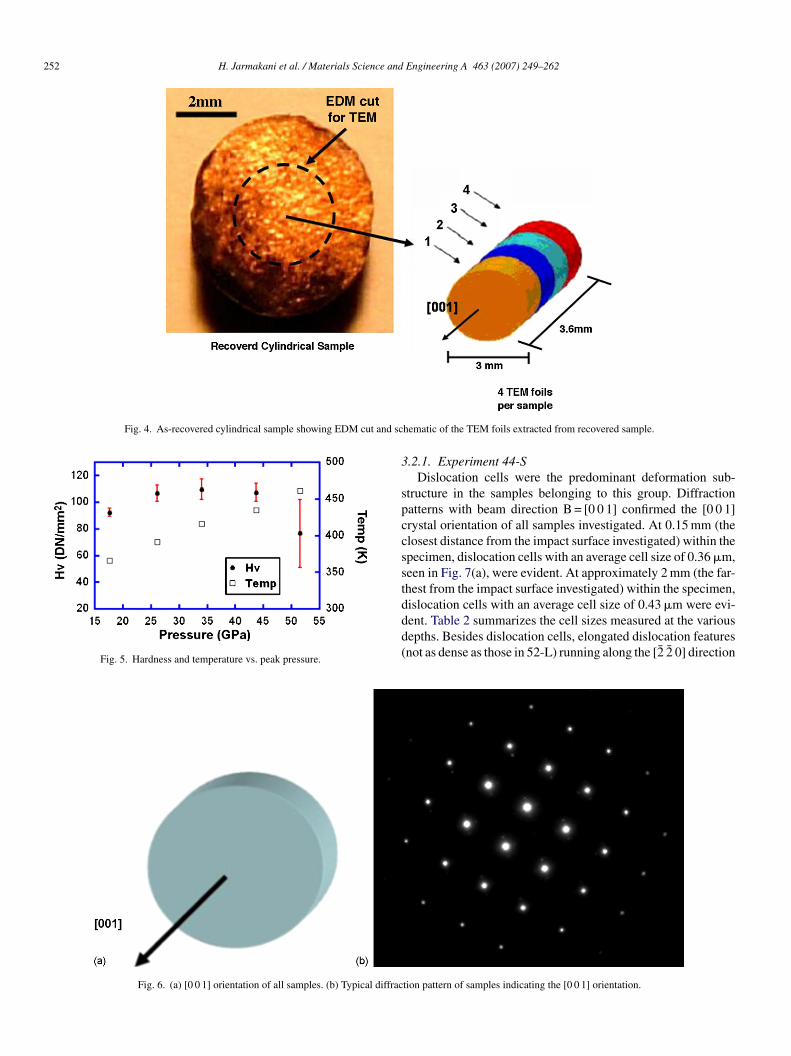
An interesting trend in hardness was observed. The valuencreases with peak pressure until approximately 45 GPa, asllustrated in Fig. 5. It then saturates and begins to drop offramatically. It can be seen that the hardness value at 52 GPa islmost two-thirds that of the intermediate pressure samples. It isypothesized that the drop in hardness may be due to recoveryrocesses taking place at the impact surface. This may be causedy the elevated temperature rise occurring at the higher peak-ressure conditions. Fig. 5 also shows this rise in temperatures the peak pressure increases.
.2. TEM results
TEM results are presented next with an emphasis on thexperiments closest to the intended quasi-isentropic ideal: 44-, 26-S and 18-L. Although other deformation microstructuresere observed, it should be noted that dislocation substruc-
ures such as cells and laths were most abundant in our TEMtudy. Twins and stacking faults were observed at the higherressure experiments (52 and 44 GPa, respectively). These fea-ures can sometimes be indistinguishable without the use ofigh-resolution TEM. Our operative definition of twinning istrictly based on the formation of a twin diffraction pattern. Ife do not see a twin diffraction pattern, but rather “fringes”
n our images, then we conclude the defect is a stacking fault.iffraction patterns taken from all samples investigated revealed
[0 0 1] crystal orientation, as seen in Fig. 6, confirming thatample orientation is not a variable in this study. This is to bexpected as all impacted samples (from all five experiments)ere cut out from the same [0 0 1] copper crystal.
252 H. Jarmakani et al. / Materials Science and Engineering A 463 (2007) 249–262
Fig. 4. As-recovered cylindrical sample showing EDM cut and sc
Fig. 5. Hardness and temperature vs. peak pressure.
3
spccsstddd(
Fig. 6. (a) [0 0 1] orientation of all samples. (b) Typical diffrac
hematic of the TEM foils extracted from recovered sample.
.2.1. Experiment 44-SDislocation cells were the predominant deformation sub-
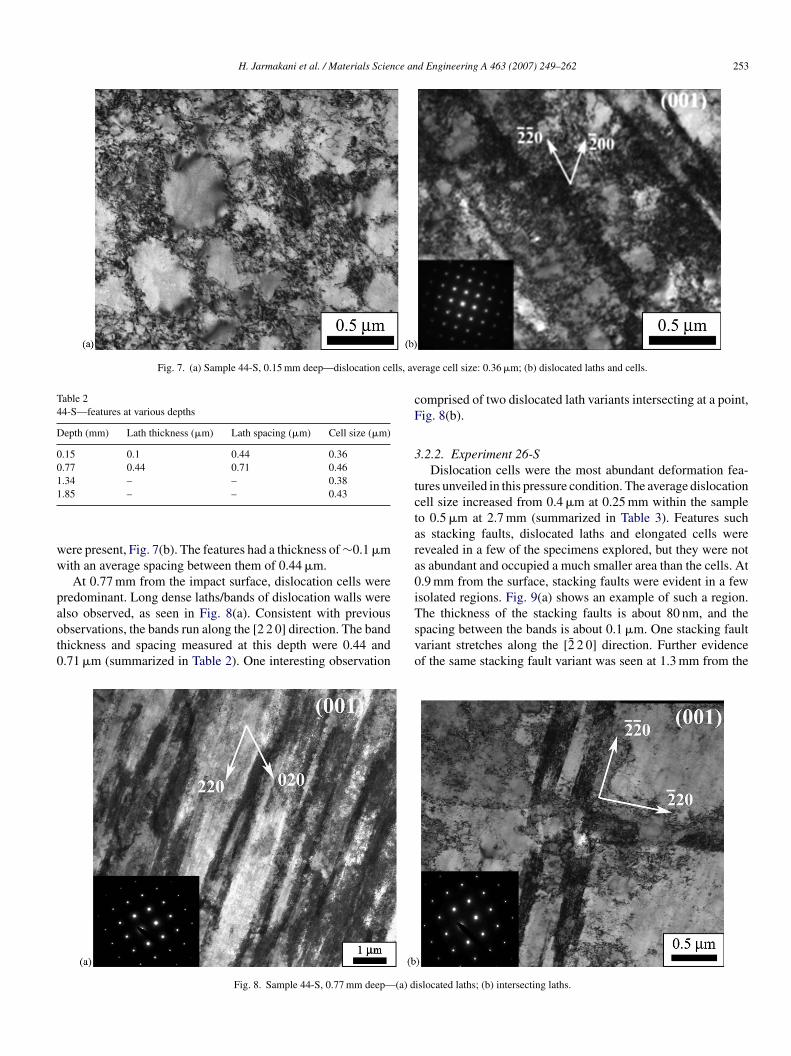
tructure in the samples belonging to this group. Diffractionatterns with beam direction B = [0 0 1] confirmed the [0 0 1]rystal orientation of all samples investigated. At 0.15 mm (thelosest distance from the impact surface investigated) within thepecimen, dislocation cells with an average cell size of 0.36 �m,een in Fig. 7(a), were evident. At approximately 2 mm (the far-hest from the impact surface investigated) within the specimen,
islocation cells with an average cell size of 0.43 �m were evi-ent. Table 2 summarizes the cell sizes measured at the variousepths. Besides dislocation cells, elongated dislocation featuresnot as dense as those in 52-L) running along the [2̄ 2̄ 0] directiontion pattern of samples indicating the [0 0 1] orientation.
H. Jarmakani et al. / Materials Science and Engineering A 463 (2007) 249–262 253
Fig. 7. (a) Sample 44-S, 0.15 mm deep—dislocation cells, av
Table 244-S—features at various depths
Depth (mm) Lath thickness (�m) Lath spacing (�m) Cell size (�m)
0.15 0.1 0.44 0.360.77 0.44 0.71 0.461.34 – – 0.381
ww
paot0
cF
3
tctara0iThe thickness of the stacking faults is about 80 nm, and the
.85 – – 0.43
ere present, Fig. 7(b). The features had a thickness of ∼0.1 �mith an average spacing between them of 0.44 �m.At 0.77 mm from the impact surface, dislocation cells were
redominant. Long dense laths/bands of dislocation walls werelso observed, as seen in Fig. 8(a). Consistent with previous
bservations, the bands run along the [2 2 0] direction. The bandhickness and spacing measured at this depth were 0.44 and.71 �m (summarized in Table 2). One interesting observationsvo
Fig. 8. Sample 44-S, 0.77 mm deep—(a) d
erage cell size: 0.36 �m; (b) dislocated laths and cells.
omprised of two dislocated lath variants intersecting at a point,ig. 8(b).
.2.2. Experiment 26-SDislocation cells were the most abundant deformation fea-
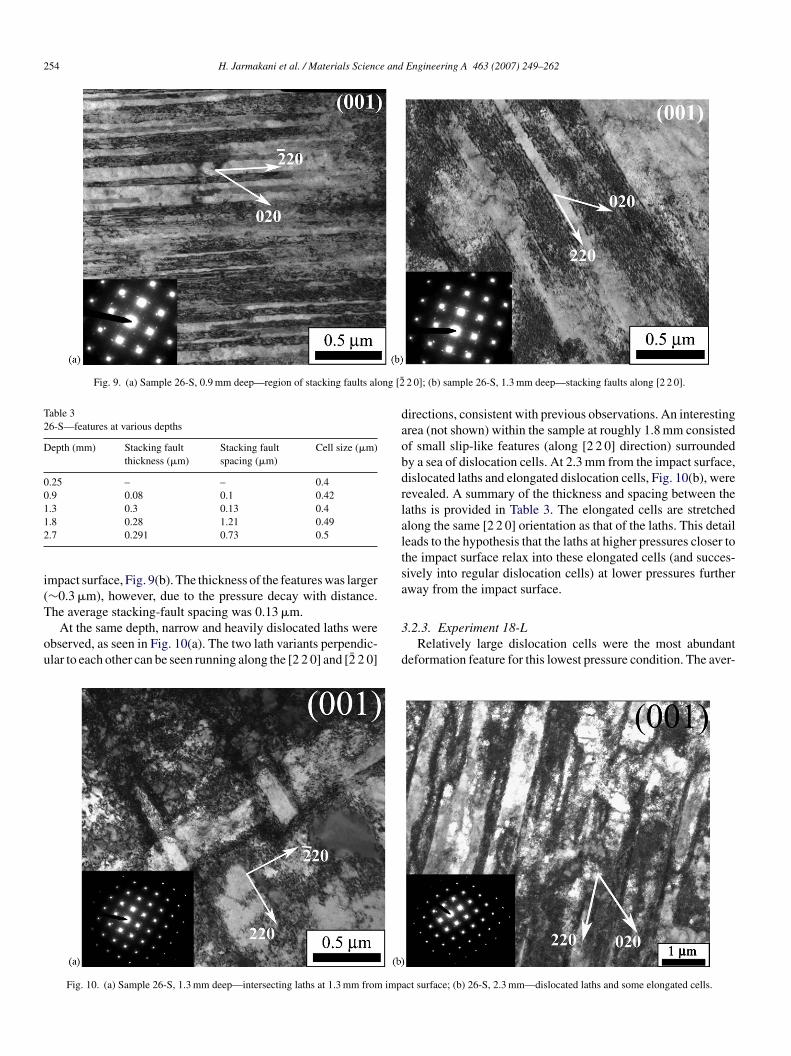
ures unveiled in this pressure condition. The average dislocationell size increased from 0.4 �m at 0.25 mm within the sampleo 0.5 �m at 2.7 mm (summarized in Table 3). Features suchs stacking faults, dislocated laths and elongated cells wereevealed in a few of the specimens explored, but they were nots abundant and occupied a much smaller area than the cells. At.9 mm from the surface, stacking faults were evident in a fewsolated regions. Fig. 9(a) shows an example of such a region.
pacing between the bands is about 0.1 �m. One stacking faultariant stretches along the [2̄ 2 0] direction. Further evidencef the same stacking fault variant was seen at 1.3 mm from the
islocated laths; (b) intersecting laths.
254 H. Jarmakani et al. / Materials Science and Engineering A 463 (2007) 249–262
Fig. 9. (a) Sample 26-S, 0.9 mm deep—region of stacking faults along [2̄
Table 326-S—features at various depths
Depth (mm) Stacking faultthickness (�m)
Stacking faultspacing (�m)
Cell size (�m)
0.25 – – 0.40.9 0.08 0.1 0.421.3 0.3 0.13 0.412
i(T
ou
daobdrlaltsa
.8 0.28 1.21 0.49
.7 0.291 0.73 0.5
mpact surface, Fig. 9(b). The thickness of the features was larger∼0.3 �m), however, due to the pressure decay with distance.
he average stacking-fault spacing was 0.13 �m.At the same depth, narrow and heavily dislocated laths werebserved, as seen in Fig. 10(a). The two lath variants perpendic-lar to each other can be seen running along the [2 2 0] and [2̄ 2 0]
3
d
Fig. 10. (a) Sample 26-S, 1.3 mm deep—intersecting laths at 1.3 mm from imp
2 0]; (b) sample 26-S, 1.3 mm deep—stacking faults along [2 2 0].
irections, consistent with previous observations. An interestingrea (not shown) within the sample at roughly 1.8 mm consistedf small slip-like features (along [2 2 0] direction) surroundedy a sea of dislocation cells. At 2.3 mm from the impact surface,islocated laths and elongated dislocation cells, Fig. 10(b), wereevealed. A summary of the thickness and spacing between theaths is provided in Table 3. The elongated cells are stretchedlong the same [2 2 0] orientation as that of the laths. This detaileads to the hypothesis that the laths at higher pressures closer tohe impact surface relax into these elongated cells (and succes-ively into regular dislocation cells) at lower pressures furtherway from the impact surface.
.2.3. Experiment 18-LRelatively large dislocation cells were the most abundant
eformation feature for this lowest pressure condition. The aver-
act surface; (b) 26-S, 2.3 mm—dislocated laths and some elongated cells.

H. Jarmakani et al. / Materials Science an
Table 418-L—features at various depths
Depth (mm) Cell size (�m)
0.13 0.440.15 0.550.67 0.620.72 0.641.3 0.411.9 0.63
F
awmlcF
Bgca
3
taftoTstdhdthobcwdri
dsatpones observed by Gray [9] in specimens where the residual strain
F
ig. 11. Sample 18-L, 0.13 mm—dislocation cells and laths/elongated cells.
ge dislocation cell size varied from about 0.44 �m at 0.13 mmithin the specimen to 0.6 �m at 2 mm. Table 4 provides a sum-ary of the cell sizes with distance. Elongated cells and some
ath-like activity were noticed in some regions, in particularlosest to the impact surface at about 0.1 mm within the sample.ig. 11 perfectly exemplifies the findings in this pressure group.
wms
ig. 12. Sample 52-L, 0.1 mm deep—(a) twinned regions showing dislocated laths an
d Engineering A 463 (2007) 249–262 255
oth cells and dislocated lath-like features relaxing into elon-ated cells can be seen. The orientation of the laths/elongatedells is along the [2 2 0] direction. This orientation is the sames that of the laths observed in the previous experiments.
.2.4. Experiment 52-LTEM samples analyzed from 52-L revealed various deforma-
ion substructures. Dense dislocation substructures were mostbundant. The size of dislocation cells close to the impact sur-ace was too small to be discernable. At about 0.1 mm fromhe impact surface, the microstructure predominantly consistedf dislocation activity with some limited evidence of twining.he deformation features were rather inhomogeneous. Fig. 12(a)hows very clear twinned regions. The extra spots in the diffrac-ion pattern confirmed the existence of these twins. At a beamirection B = [0 1 1], both small and large twins were observedaving (1̄ 1̄ 1) twin habit planes. These micro-twins are embed-ed within dislocated laths running along the same direction ashe twins (labeled in Fig. 12(a)). The smallest twins measuredad a length of approximately 80 nm, and the longest twins weren the order of 1.5 �m. Longer twins existed in the TEM images,ut they ran across the entire image and their full length was notaptured. More TEM images at 0.1 mm from the surface takenith B = [0 0 1] showed stacking faults running along the [2 2 0]irection, Fig. 12(b). Their thickness and spacing are summa-ized in Table 5. In certain areas, dislocated laths were capturedntersecting each other (not shown) at 90◦.
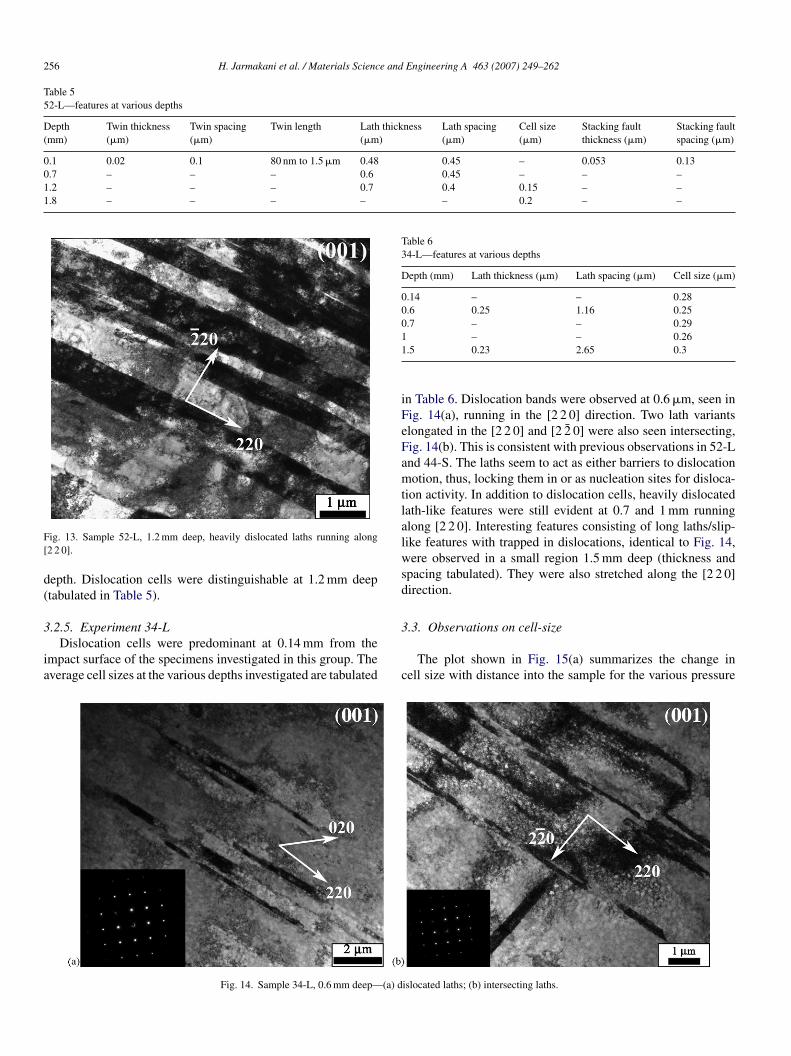
Heavily dislocated laths were observed at 0.7 and 1.2 mmeep. Lath thickness and spacing are tabulated in Table 5. Fig. 13hows laths 1.2 mm deep at a beam direction B = [0 0 1] runninglong the [2 2 0] direction. These features are in agreement withhe “wavy sub-grains” observed after high-pressure shock com-ression of copper by Murr [8]. They are also analogous to the
as high. It is suggested that the substructures are due to ther-al recovery of the microstructure. Additionally, twinning (not
hown), confirmed by a diffraction pattern, was evident at this
d micro-twins, B = [0 1 1]; (b) stacking faults running along [2̄ 2 0], B = [0 0 1].
256 H. Jarmakani et al. / Materials Science and Engineering A 463 (2007) 249–262
Table 552-L—features at various depths
Depth(mm)
Twin thickness(�m)
Twin spacing(�m)
Twin length Lath thickness(�m)
Lath spacing(�m)
Cell size(�m)
Stacking faultthickness (�m)
Stacking faultspacing (�m)
0.1 0.02 0.1 80 nm to 1.5 �m 0.48 0.45 – 0.053 0.130.7 – – – 0.6 0.45 – – –1.2 – – – 0.7 0.4 0.15 – –1.8 – – – – – 0.2 – –
F[
d(
3
ia
Table 634-L—features at various depths
Depth (mm) Lath thickness (�m) Lath spacing (�m) Cell size (�m)
0.14 – – 0.280.6 0.25 1.16 0.250.7 – – 0.2911
iFeFamtlalwsd
ig. 13. Sample 52-L, 1.2 mm deep, heavily dislocated laths running along2 2 0].
epth. Dislocation cells were distinguishable at 1.2 mm deeptabulated in Table 5).
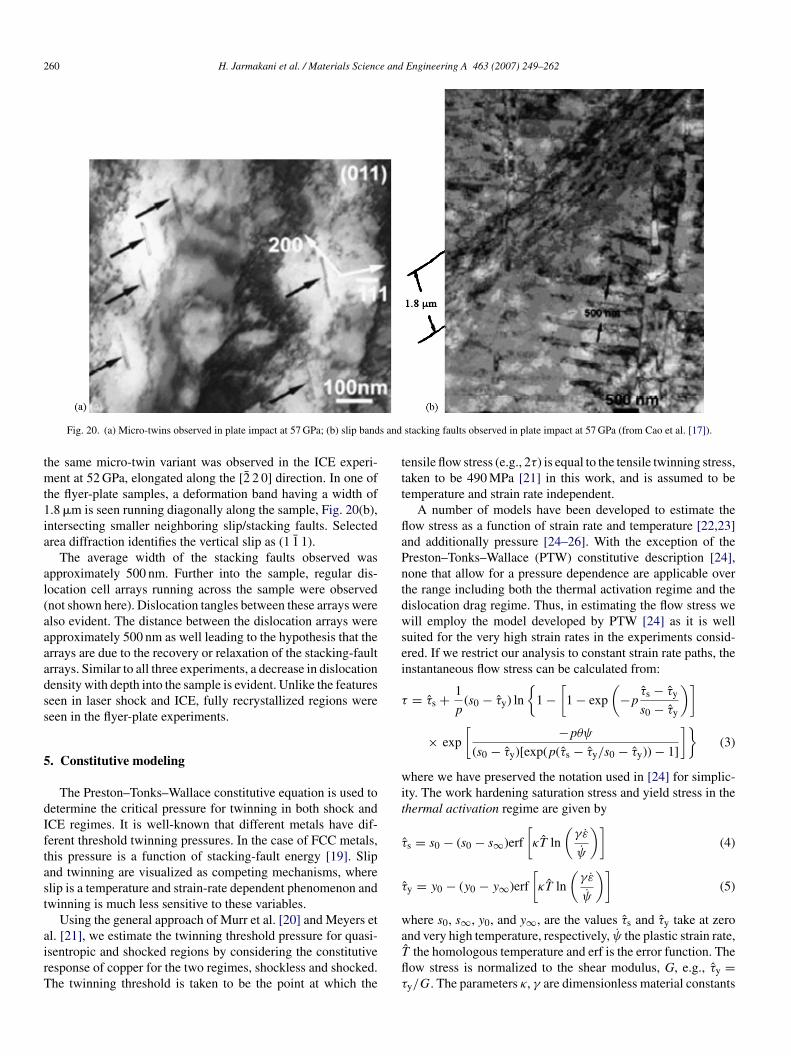
.2.5. Experiment 34-LDislocation cells were predominant at 0.14 mm from the
mpact surface of the specimens investigated in this group. Theverage cell sizes at the various depths investigated are tabulated
3
c
Fig. 14. Sample 34-L, 0.6 mm deep—(a) d
– – 0.26.5 0.23 2.65 0.3
n Table 6. Dislocation bands were observed at 0.6 �m, seen inig. 14(a), running in the [2 2 0] direction. Two lath variantslongated in the [2 2 0] and [2 2̄ 0] were also seen intersecting,ig. 14(b). This is consistent with previous observations in 52-Lnd 44-S. The laths seem to act as either barriers to dislocationotion, thus, locking them in or as nucleation sites for disloca-
ion activity. In addition to dislocation cells, heavily dislocatedath-like features were still evident at 0.7 and 1 mm runninglong [2 2 0]. Interesting features consisting of long laths/slip-ike features with trapped in dislocations, identical to Fig. 14,ere observed in a small region 1.5 mm deep (thickness and
pacing tabulated). They were also stretched along the [2 2 0]irection.
.3. Observations on cell-size
The plot shown in Fig. 15(a) summarizes the change inell size with distance into the sample for the various pressure
islocated laths; (b) intersecting laths.

H. Jarmakani et al. / Materials Science and Engineering A 463 (2007) 249–262 257
ure co
cieiae5dalraem
m4itsstpso
cidst(ciItacTps
rm
4
qsfloogIfeTo0isutrrt5t
S
ε
ws
ε
Fig. 15. (a) Cell size vs. distance from surface for all press
onditions considered. It can be seen that the cell size graduallyncreases with distance away from the impact surface forach pressure condition. This is consistent with previousnvestigations by [8–10]. In comparing the relative cell sizes ofll the pressure conditions, two specifics that interfere with idealxperimental conditions need to be noted. First, experiments2-L, 34-L and 18-L were subjected to a much longer pulseuration than that of 44-S and 26-S. The pulse duration waspproximately 10 �s for 52-L, 34-L and 18-L as compared toess than 1 �s for 44-S and 26-S. Second, the CALE simulationseveal that 52-L and 34-L exhibit an unfavorable phenomenon;
slight shock at the onset of the pulse duration (due to thexperimental setup). Experiments 44-S and 26-S are, therefore,uch closer to the desired isentropic ideal that was intended.The average cell size measured for 44-S is not consistent with
easurements from the other experiments. Note that although4-S experiences a higher peak pressure (44 GPa) than 34-L,t has larger cells. The cells in 44-S are also very close in sizeo those of 26-S, the other “short-pulse” experiment. Fig. 15(b)hows the change in cell size as a function of strain. The cell-izes clearly decrease with increasing strain as is expected (withhe exception of 44-S). Bassim and coworkers [11–14] haveerformed studies on the decrease in dislocation cell size withtrain on copper and steel, and their work is consistent with ourbservations.
The “long-pulse” experiments, 52-L, 34-L, and 18-L, show alear decrease in the average dislocation cell size with increas-ng peak pressure, consistent with prior work on high strain rateeformation of metals [8–10]. Sencer et al. [15] subjected copperamples to both a triangular and square-top shock wave to studyhe effect of pulse duration on the deformation microstructurepeak pressures were the same). They observed little variation inell size in either case but noted that the dislocations were morerregular in shape in the triangle-top than in the square-top wave.n their work, Meyers and coworkers [8,16] note that disloca-ion cell structures are mostly dependent upon peak pressurend the time available to move these dislocations into arrays
haracterized by cell dimensions and wall size and structure.he dislocation cell size is, therefore, determined by the peakressure whereas the wall structure and recognition of the celltructure are determined to a degree by the pulse duration whichiotb
nditions; (b) cell size vs. strain for all pressure conditions.
elates to the available time for dislocations to reorganize intoore stable energy configurations.
. Comparison: ICE versus shock
A comparison of the recovered microstructure revealed in theuasi-isentropic compression experiments is made with that ofhock compressed copper achieved via both explosively drivenyer plates and direct laser drives. The work of Cao et al. [17]n flyer-plate shock and Schneider et al. [10] on laser-shockf [0 0 1] copper is drawn upon. The peak pressures investi-ated in both cases are within the range of that studied in theCE experiments (approximately 20–60 GPa) and are suitableor comparison purposes. In the case of flyer plate impact, anxplosion drives a plate that impacts a target at a known velocity.he strain rates typically achieved and reported in literature aren the order of 106 s−1, and pulse durations are on the order of.1–0.2 �s. This long pulse duration (also experienced in exper-ments 52-L, 34-L, and 18-L of the ICE experiments) allowshock generated defects to reorganize into lower energy config-rations and allows more time for annealing and recrystallizationo take place. Laser shock, on the other hand, is achieved by theapid heating created by laser pulses illuminated on the mate-ial’s surface. Strain rates reported in these experiments are onhe order of 109 s−1, and the pulse durations are on the order ofns. Due to the very short pulse duration, the pressure decay in
he sample is very rapid and post-shock heating is minimized.Shock experiments are dictated by the following
wegle–Grady [18] expression:
˙ (s−1) = 7.84 × 10⁻³³P4 (1)
hereas the isentropic experiments have the following relation-hip derived from results of CALE simulations:
˙ (s−1) = 1.17 × 10⁻⁷P1.1 (2)
Fig. 16(a) compares the different strain rate regimes attained
n shock and ICE. It is clear that strain rates achieved in shock aren the order of 109 s−1, 104 to 105 orders of magnitude higherhan ICE experiments. Fig. 16(b) shows the temperature rise inoth cases. Clearly, the temperature rise is more severe in shock
258 H. Jarmakani et al. / Materials Science and Engineering A 463 (2007) 249–262
F(
artr
4
dAdci[Msc
Ffl
mdtcoat(Ccwp
4
rlsacmc(adatogfdaab
t
ig. 16. (a) Comparison of the strain rate regimes attained in shock and ICE;b) comparison of the temperature rise in shock and ICE.
t higher peak pressures as compared to ICE. The temperatureise for the ICE experiments was obtained from CALE simula-ion, and the rise for shock was calculated from thermodynamicelations and known equation of state parameters for copper.
.1. Comparison of deformation substructures: 18–30 GPa
As discussed previously, dislocation activity was the maineformation behavior in the quasi-ICE experiments at 18 GPa.t 20 GPa, laser shock experiments exclusively contain well-efined cellular dislocations (not shown here) with an averageell size diameter between 0.2 and 0.3 �m [10]. This result isn accordance with previous investigations on shock by Murr
8]. The pulse duration was, however, 10–100 times higher inurr’s work. The plot in Fig. 17 shows that the dislocation cell-ize in laser shock is significantly lower than in quasi-isentropicompression (0.25 �m versus 0.5 �m). This is attributed to the
[wep
ig. 17. Comparison of cell sizes at different pressures: ICE, laser-shock andyer-plate impact.
uch higher strain-rates achieved during laser-shock. The pulseuration is much longer in the ICE experiments, allowing forhe defect substructures to relax and form a more stable energyonfiguration, and hence, larger dislocation cells. Some evidencef stacking faults (Fig. 9), as previously reported, was observedt 26 GPa in the ICE experiments. Stacking faults were seen athe higher pressure regimes in both flyer plate and laser shockdiscussed next), but not between 18 and 30 GPa. In their work,ao et al. [17] carry out experiments at 30 GPa and above. Aomparison of the defect substructure for this pressure groupith flyer-plate experiments is not made because of the lack ofublished data.
.2. Comparison of deformation substructures: 30–40 GPa
Some similarity between all three cases was found in thisange. In laser shock, this pressure regime produced dense dis-ocation tangles, stacking faults, and micro-twins. Fig. 18(a)hows stacking faults and dislocation tangles marked as DTnd SF. There are no readily discernable dislocation cells, alear indication of the pressure dependence of the deformationechanisms. All four stacking fault variants viz. the partial dislo-
ations (1 1 1̄)1/6[1 1 2], (1 1 1)1/6[1̄ 1̄ 2], (1̄ 1 1)1/6[1 1̄ 2], and1 1̄ 1)1/6[1̄ 1 2] are observed. The stacking fault variants arelong the same orientation in all three cases. Given the inci-ent energy input as parallel to [0 0 1], it is not surprising thatll four stacking fault variants are activated in laser shock sincehey have the same critical resolved shear stress. The density ofccurrence of the stacking faults along the [2̄ 2 0] is, however,reater than along [2 2 0] in laser shock. In ICE, the stackingaults and laths that are most abundant run along the [2 2 0]irection. However, their occurrence is less frequent and not asbundant as in laser shock and flyer plate experiments. This isttributed to the difference in the strain rate regime in ICE (lessy a factor of 10–100).
For the flyer plate experiments, stacking fault patterns similaro shock are observed at 30 GPa. Two sets of stacking faults along
2̄ 2 0] and [2 2 0] in the (0 0 1) plane are shown in Fig. 18(b),here the TEM electron beam direction is [0 0 1]. These ori-ntations are consistent with ICE experiments, since the sameartial dislocations are active in both cases. The average spac-

H. Jarmakani et al. / Materials Science and Engineering A 463 (2007) 249–262 259
F et al.a
ifia
4
s(aatsthttn
tt
caildrTasti
ig. 18. (a) Stacking faults at 40 GPa in laser-shocked sample (from Schneiderl. [17]).
ng between the stacking faults is between 230 and 450 nmor laser shock and between 180 and 220 nm for flyer-platempact. The spacing in the ice experiments ranges between 100nd 500 nm.
.3. Comparison of deformation substructures: 40–60 GPa
In laser shock, the deformation microstructure at 55 GPa con-ists of a high density of micro-twins (Fig. 19(a)) and lathsFig. 19(b)). Two sets of micro-twins are observed when imagedt B = [0 0 1]. They appear at exactly 90◦ from one anotherligned along [2 2 0] (set A) and [2̄ 2 0] (set B) directions, respec-ively, and they are present roughly in same proportion (nothown here). When imaged in the edge orientation at B closeo [1̄ 0 1], Fig. 19(a), the micro-twins from set A have the (1 1 1)
abit plane and are elongated along [1 2̄ 1]. This set of micro-wins exhibits a wide range of lengths, from as small as 70 nmo as large as 1 �m. In contrast, the set B micro-twins have aear uniform length of 70 nm. Correspondingly, these two samemtos
Fig. 19. (a) Micro-twins observed in laser shock at 55 GPa; (b) laths
[10]); (b) stacking faults at 30 GPa in flyer-plate impacted sample (from Cao et
win variants running along [2 2 0] [2̄ 2 0] were also captured inhe ICE experiments at 52 GPa.
Unlike the micro-twins, the laths in laser-shock are elongatedlose to 〈2 2 0〉. In some regions they are aligned along [2̄ 2 0]nd in others along [2 2 0]. Given the curvature of the laths its unlikely that they conform to any single habit plane. Theath interface plane is parallel to [0 0 1] and therefore uniquelyifferent from micro-twins. This microstructure represents theecovered state of a heavily twinned and dislocated structure.hese laths are similar to those observed in the ICE experimentst 52 GPa, 0.7 and 1.2 mm from the impact surface. A strikingimilarity can be seen between the laths shown in Fig. 19(b) andhose in Fig. 13. The laths are oriented along the [2 2 0] directionn both cases.
The flyer-plate samples shocked at 57 GPa revealed defor-
ation bands, slip bands, recrystallized regions, dislocationangles and some micro-twins. Only one set of micro-twins wasbserved having a (1̄ 1̄ 1) habit plane, as seen in Fig. 20(a). Theize of the micro-twins varies from 80 to 180 nm. Interestingly,
observed in laser shock at 55 GPa (from Schneider et al. [10]).
260 H. Jarmakani et al. / Materials Science and Engineering A 463 (2007) 249–262
s and
tmt1ia
al(aaaadss
5
dIftast
airT
ttt
flaPntdwsei
τ
wit
τ
τ
w
Fig. 20. (a) Micro-twins observed in plate impact at 57 GPa; (b) slip band
he same micro-twin variant was observed in the ICE experi-ent at 52 GPa, elongated along the [2̄ 2 0] direction. In one of
he flyer-plate samples, a deformation band having a width of.8 �m is seen running diagonally along the sample, Fig. 20(b),ntersecting smaller neighboring slip/stacking faults. Selectedrea diffraction identifies the vertical slip as (1 1̄ 1).
The average width of the stacking faults observed waspproximately 500 nm. Further into the sample, regular dis-ocation cell arrays running across the sample were observednot shown here). Dislocation tangles between these arrays werelso evident. The distance between the dislocation arrays werepproximately 500 nm as well leading to the hypothesis that therrays are due to the recovery or relaxation of the stacking-faultrrays. Similar to all three experiments, a decrease in dislocationensity with depth into the sample is evident. Unlike the featureseen in laser shock and ICE, fully recrystallized regions wereeen in the flyer-plate experiments.
. Constitutive modeling
The Preston–Tonks–Wallace constitutive equation is used toetermine the critical pressure for twinning in both shock andCE regimes. It is well-known that different metals have dif-erent threshold twinning pressures. In the case of FCC metals,his pressure is a function of stacking-fault energy [19]. Slipnd twinning are visualized as competing mechanisms, wherelip is a temperature and strain-rate dependent phenomenon andwinning is much less sensitive to these variables.
Using the general approach of Murr et al. [20] and Meyers et
l. [21], we estimate the twinning threshold pressure for quasi-sentropic and shocked regions by considering the constitutiveesponse of copper for the two regimes, shockless and shocked.he twinning threshold is taken to be the point at which theaT
flτ
stacking faults observed in plate impact at 57 GPa (from Cao et al. [17]).
ensile flow stress (e.g., 2τ) is equal to the tensile twinning stress,aken to be 490 MPa [21] in this work, and is assumed to beemperature and strain rate independent.
A number of models have been developed to estimate theow stress as a function of strain rate and temperature [22,23]nd additionally pressure [24–26]. With the exception of thereston–Tonks–Wallace (PTW) constitutive description [24],one that allow for a pressure dependence are applicable overhe range including both the thermal activation regime and theislocation drag regime. Thus, in estimating the flow stress weill employ the model developed by PTW [24] as it is well
uited for the very high strain rates in the experiments consid-red. If we restrict our analysis to constant strain rate paths, thenstantaneous flow stress can be calculated from:
= τ̂s + 1
p(s0 − τ̂y) ln
{1 −
[1 − exp
(−p τ̂s − τ̂y
s0 − τ̂y
)]
× exp
[ −pθψ(s0 − τ̂y)[exp(p(τ̂s − τ̂y/s0 − τ̂y)) − 1]
]}(3)
here we have preserved the notation used in [24] for simplic-ty. The work hardening saturation stress and yield stress in thehermal activation regime are given by
ˆs = s0 − (s0 − s∞)erf
[κT̂ ln
(γε̇
ψ̇
)](4)
ˆy = y0 − (y0 − y∞)erf
[κT̂ ln
(γε̇
ψ̇
)](5)
here s0, s∞, y0, and y∞, are the values τ̂s and τ̂y take at zero
nd very high temperature, respectively, ψ̇ the plastic strain rate,ˆ the homologous temperature and erf is the error function. Theow stress is normalized to the shear modulus, G, e.g., τ̂y =y/G. The parameters κ, γ are dimensionless material constants

ce and Engineering A 463 (2007) 249–262 261
a
ε
waG
mTd
τ
τ
wtri
τ
w
τ
τ
Ta
ifi〈is[reshssaarc
FI
tlat
σ
wmtasdtsitptct
6
•
•
•
H. Jarmakani et al. / Materials Scien
nd ε̇ is given by
˙ = 1
2
(4πρ
3M
)1/3√G
ρ(6)
here M is the atomic mass and ρ is the density. The temper-ture dependence of the shear modulus was approximated as(ρ, T ) = G0(ρ)(1 − αT̂ ), where G0(ρ) is the zero temperatureodulus as a function of density and α is a material constant.he pressure dependence of the model is due to the pressureependence of the shear modulus.
In the strong shock regime the behavior is given by
ˆs = s0
(ψ̇
γε̇
)β(7)
ˆy = s0
(ψ̇
γε̇
)β(8)
hereβ is a material constant and s0 and γ are employed for con-inuity. In order to accommodate the observed increase in strainate sensitivity at moderate strain rates an additional dependencys included as
ˆy = y1
(ψ̇
γε̇
)y2
(9)
here y1 and y2 are the material constants.The complete model is
ˆs = max
{s0 − (s0 − s∞)erf
[κT̂ ln
(γε̇
ψ̇
)], s0
(ψ̇
γε̇
)β}(10)
ˆy = max
{y0 − (y0 − y∞)erf
[κT̂ ln
(γε̇
ψ̇
)],
× min
[y1
(ψ̇
γε̇
)y2
, s0
(ψ̇
γε̇
)β]}(11)
he model provides a smooth transition between the thermalctivation regime and the strong shock regime.
In using the model to describe the 〈1 0 0〉 single crystal usedn this investigation the model parameters were slightly modi-ed to match the low strain rate work hardening behavior for1 0 0〉 copper displayed in [19]. In particular the work harden-ng rate, θ, was adjusted to a value of 0.01 and saturation stress,0, to a value of 0.0045. All other parameters are as given in24]. Although the flow behavior is a function of strain, strainate, and temperature, at very high strain rates the flow stress isssentially at the saturation value for all values of strain. In thehockless region, the temperature, strain, and strain rate from theydrodynamic solution previously presented were used. In thehocked region, the temperature and strain were taken from theimulations while the strain rates were determined as outlined
bove (Eq. (1)). It has also been assumed that the flow stressnd twinning stress, being dependent on the atomic energy bar-ier, scale with the shear modulus, as is typical in high pressureonstitutive models.•
ig. 21. Flow stress of [1 0 0] oriented copper vs. peak pressure in shock andCE.
Results of these calculations are presented in Fig. 21 wherehe flow stress, as a function of peak drive pressure, for the shock-ess and shocked region are plotted. The twinning threshold wasssumed to vary with pressure (or equivalently density) throughhe density dependence of G:
T(P) = σ0TG(T, P)
G0(12)
here σ0T and G0 are the twinning threshold stress and shear
odulus at ambient pressure, respectively. It can be seen fromhe figure that the slip-twinning transition in shock loading ispproximately 18 GPa, in agreement with literature [2]. Theteep shock loading curve arises due to the high strain-rateependence on both the shock pressure and flow stress [7]. Onhe other hand, the isentropic gas-gun condition does not tran-ition into the twinning regime and a critical twinning stresss, therefore, not reached. This is inconsistent with experimen-al observations, since twinning was observed at ∼52 GPa. Theresence of the shock at the start of the shock pulse (Fig. 2) forhis pressure condition creates a deviation from quasi-isentropiconditions and may account for the presence of the observedwins.
. Conclusions
The deformation features seen in the quasi-isentropiccompression experiments of monocrystalline copper are con-sistent with those seen in laser and flyer plate shock [1,2], butthe pressures where the features dominate the response arequite different. For instance, the formation of stacking faultsand twins occurs at lower pressures in shock as compared toICE.The cell sizes in ICE are also uniformly larger than those leftbehind from shock (laser and flyer plate) even where the holdtimes are commensurate.The trend in cell size measurements obtained from the gas-gunICE samples undergoing the long and short pulses reinforces
previous observations that pulse duration may not be playinga key role in determining cell size.Our observations on cell size lead to the proposition that theloading path during ICE, through the lower strain rates and
2 e and
•
•
•
•
A
DL4O
R
[
[[
[[[[
[
[
[
[
[
62 H. Jarmakani et al. / Materials Scienc
temperatures attained, are having a real effect on the materialresponse and causing production of fewer dislocations.The slight shock in experiments 52-L and 34-L caused a devi-ation from ideal quasi-isentropic conditions and may havebeen the reason there was a slight inconsistency in the peakpressure–cell size relationship.Experiments 44-S and 26-S that were closest to the quasi-isentropic ideal did not exhibit twins, but rather stackingfaults, dislocated laths and cells.Modeling of the quasi-isentropic compression condition,using the Preston–Tonks–Wallace constitutive equation,revealed that twinning should not occur under the pressureregime investigated in these experiments.The presence of twinning in the experiments is attributed tothe occurrence of an undesirable shock at the onset of the pulseduration due to the experimental set-up. This shock impartslarger strains and strain-rates, hence, causing twinning.
cknowledgements
This work was performed under the auspices of the U.S.epartment of Energy by University of California, Lawrenceivermore National Laboratory under Contract W-7405-Eng-8. All TEM work was performed under the SHaRE program atak Ridge National Labs.
eferences
[1] O. Johari, G. Thomas, Acta Metall. 2 (1964) 113–1159.[2] N. Holmes, Science and Technology Review, LLNL, Livermore, CA, 2000.
[3] G.A. Lyzenga, T.J. Ahrens, in: W.J. Nellis, L. Seaman, R.A. Graham (Eds.),American Institute of Physics Conference Proceedings No. 78, 1982, pp.231–235.
[4] L.M. Barker, in: J.R. Asay, R.A. Graham, G.K. Straub (Eds.), Shock Wavesin Condensed Matter, Elsevier Sci. Pub., Amsterdam, 1984.
[[[[[
Engineering A 463 (2007) 249–262
[5] J.M. McNaney, M.J. Edwards, R. Becker, K.T. Lorenz, B.A. Remington,Met. Trans. A 35A (2004) 265.
[6] C.A. Hall, J.R. Asay, M.D. Knudson, W.A. Stygar, R.B. Spielman, T.D.Pointon, Rev. Scientific Instrum. 72 (2001) 3587.
[7] J.H. Nguyen, D. Orlikowski, F.H. Streitz, N.C. Holmes, J.A. Moriarty,in: M.D. Furnish, L.C. Chhabildas, R.S. Hixson (Eds.), AIP Conf. Proc.,Melville, New York, 2004.
[8] L.E. Murr, in: M.A. Meyers, L.E. Murr (Eds.), Shock Waves and High-Strain Rate Phenomena in Metals, Plenum Press, New York, 1981, pp.607–673.
[9] G.T. Gray III, in: M.A. Meyers, L.E. Murr, K.P. Staudhammer (Eds.), ShockWave and High Strain Rate Phenomena in Materials, Marcel Dekker, NewYork, 1992, pp. 899–911.
10] M.S. Schneider, B.K. Kad, D.H. Kalantar, B.A. Remington, M.A. Meyers,Metall. Trans. A 35 (2004) 263.
11] M.N. Bassim, R.J. Klassen, Mater. Sci. Eng. 81 (1986) 163.12] M.N. Bassim, M.R. Bayoumi, Proceedings of the International Confer-
ence on Low-Energy Dislocation Structures, University of Virginia, August10–13, 1986, pp. 317–324.
13] M.N. Bassim, L.B. Huang, Mater. Sci. Eng. 96 (1988) 159.14] M.N. Bassim, R.J. Klassesn, Scr. Metall. 21 (1987) 625.15] B.H. Sencer, S.A. Maloy, G.T. Gray III, Acta Mater. 53 (2005) 3293–3303.16] M.A. Meyers, L.E. Murr, in: M.A. Meyers, L.E. Murr (Eds.), Shock Waves
and High-Strain Rate Phenomena in Metals, Plenum Press, New York,1981, pp. 487–530.
17] B.Y. Cao, D.H. Lassila, M.S. Schneider, B.K. Kad, C.X. Huang, Y.B. Xu,D.H. Kalantar, B.A. Remington, M.A. Meyers, Mater. Sci. Eng. A 409(2005) 270–281.
18] J.W. Swegle, D.E. Grady, in: Y.M. Gupta (Ed.), shock Waves in CondensedMatter-1985, Plenum Press, New York, 1986, p. 353.
19] M.A. Meyers, F. Gregori, B.K. Kad, M.S. Schneider, D.H. Kalantar, B.A.Remington, G. Ravichandran, T. Boehly, J.S. Wark, Acta Mater. 51 (2003)12122.
20] L.E. Murr, M.A. Meyers, C.-S. Niou, Y.-J. Chen, S. Pappu, C. Kennedy,Acta Mater. 45 (1997) 157.
21] M.A. Meyers, O. Voehringer, V.A. Lubarda, Acta Mater. 49 (2001) 4025.
22] F.J. Zerilli, R.W. Armstrong, J. Appl. Phys. 61 (1987) 1816.23] P.S. Follansbee, U.F. Kocks, Acta Metall. 36 (1988) 81.24] D.L. Preston, D.L. Tonks, D.C. Wallace, J. Appl. Phys. 93 (2003) 211.25] D.J. Steinberg, S.G. Cochran, M.W. Guinan, J. Appl. Phys. 51 (1980) 1496.26] D.J. Steinberg, C.M. Lund, J. Appl. Phys. 65 (1989) 1528.