dynamic characterisation of rubber mounts characterisation of rubber mounts ... the results...
TRANSCRIPT
DYNAMIC CHARACTERISATION OF RUBBER MOUNTSRavindra Vangipuram, Chandramouli Padmanabhan and Parag RavindranMachine Design Section, Department of Mechanical Engineering, Indian Institute of Technology Madras,Chennai – 600036, Indiaemail: [email protected]
In this paper a simple time domain based experimental identification procedure is proposed toevaluate the frequency dependent rubber mount stiffness and damping characteristics by using themeasured hysteresis loops obtained from the cyclic tests. Using these characteristics, the dynamicresponse calculations of the rubber mount system, treating the mount as a viscoelastic elementare carried out. The study shows a huge variation in the rubber mount stiffness and captures thefrequency dependent damping quite well. By applying the evaluated properties, the simulatedresponse of a typical automotive engine seems to improve as opposed to that of constant propertymodels.
1. Introduction
Rubber materials have been widely used in the damping applications. Because of the viscoelasticbehaviour of the rubber material, dynamic properties depend on static pre-load, vibration amplitude,excitation frequency and temperature [1]. Hence, understanding of viscoelastic behaviour is essen-tial for the efficient use and proper design of these materials for damping applications. The neededdata has to be determined by the designer because it is typically not available. In this context, sev-eral researchers proposed different ways to characterise the rubber isolators. The determination oflinear viscoelastic material parameters is typically based on dynamic mechanical thermal analysis(DMTA). The complex modulus is measured at several temperatures over a certain frequency range.The frequency response function and the dynamic stiffness of rubber mounts are measured from thesine swept frequency test using an electromagnetic shaker in [2]. Impact test technique, which pro-vides a quick and easy way to evaluate the frequency dependent stiffness and damping characteristicsof rubber isolators is presented in [3]. Two approximate methods for the determination of dynamicproperties of vibration isolators or similar components exhibiting elastic and damping nonlinearitieswithout the need for dedicated hardware are demonstrated in [4]. The objective of this research isto evaluate the frequency dependent rubber mount stiffness and damping characteristics by using thehysteresis loops obtained from the cyclic tests.
2. Mathematical formulation
The equation of motion of a rubber-mass system considered in this study can be written in thefollowing form:
mx+ c(ω)x+ k(ω)x = p(t) (1)
wherem is the rigid mass, c(ω), k(ω) are the viscous damping and the stiffness respectively whichare frequency dependent and p(t) is the external force acting on the single degree of freedom (SDOF)system.
1

The 23rd International Congress of Sound and Vibration
Transformation of Eq. (1) to the frequency domain gives the following form:
P (ω) = H(ω)X(ω) (2)
where P , X are the Fourier transforms of p, x respectively and the complex functionH(ω) knownas dynamic stiffness relating P and X in Eq. (2) is given by,
H(ω) = k(ω) −mω2 + jc(ω)ω (3)
Now, a quantity loss factor η(ω) which is frequency dependent is defined as follows:
η(ω) =c(ω)ω
k(ω)(4)
3. Results and discussion
The rubber mount, tested in a cyclic testing machine is subjected to a harmonic deformation at asingle frequency and the corresponding frequency dependent quantities k(ω) and η(ω) are estimatedby fitting the measured force deflection data to the following equation.
F = k(ω)x+ c(ω)x (5)
Figure 1 depicts the measured load deflection data at 15 Hz and is fit to Eq. (5). The frequencydependent quantities obtained are k = 122 N/mm and c = 0.6 N-s/mm.
Figure 1: Force versus deflection.
The variation of frequency dependent stiffness over the frequency range 15-40 Hz is shown in Fig.2. This is the usual working range of a typical automotive engine mount. The stiffness increases withfrequency, but the rate of change of slope is negative till 20 Hz. The slope is almost zero in the rangeof about 20-30 Hz and after that the rate of change of slope is positive representing a cubic nature
2 ICSV23, Athens (Greece), 10-14 July 2016
The 23rd International Congress of Sound and Vibration
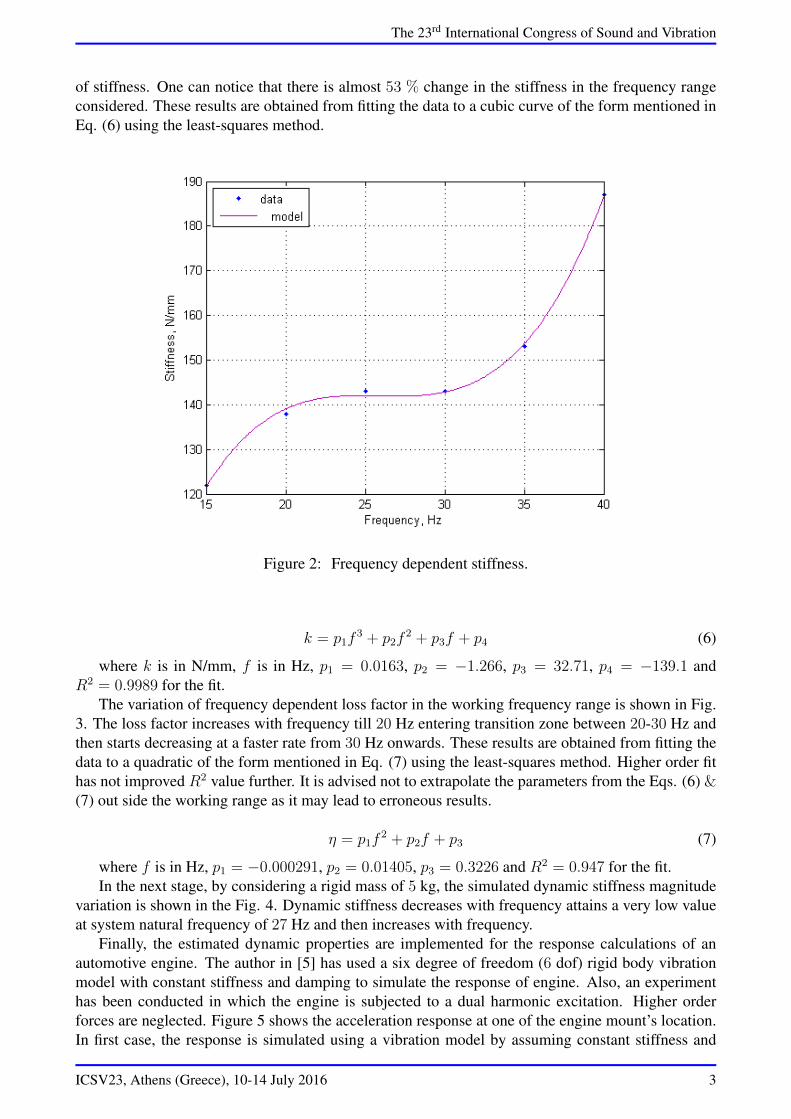
of stiffness. One can notice that there is almost 53 % change in the stiffness in the frequency rangeconsidered. These results are obtained from fitting the data to a cubic curve of the form mentioned inEq. (6) using the least-squares method.
Figure 2: Frequency dependent stiffness.
k = p1f3 + p2f
2 + p3f + p4 (6)
where k is in N/mm, f is in Hz, p1 = 0.0163, p2 = −1.266, p3 = 32.71, p4 = −139.1 andR2 = 0.9989 for the fit.
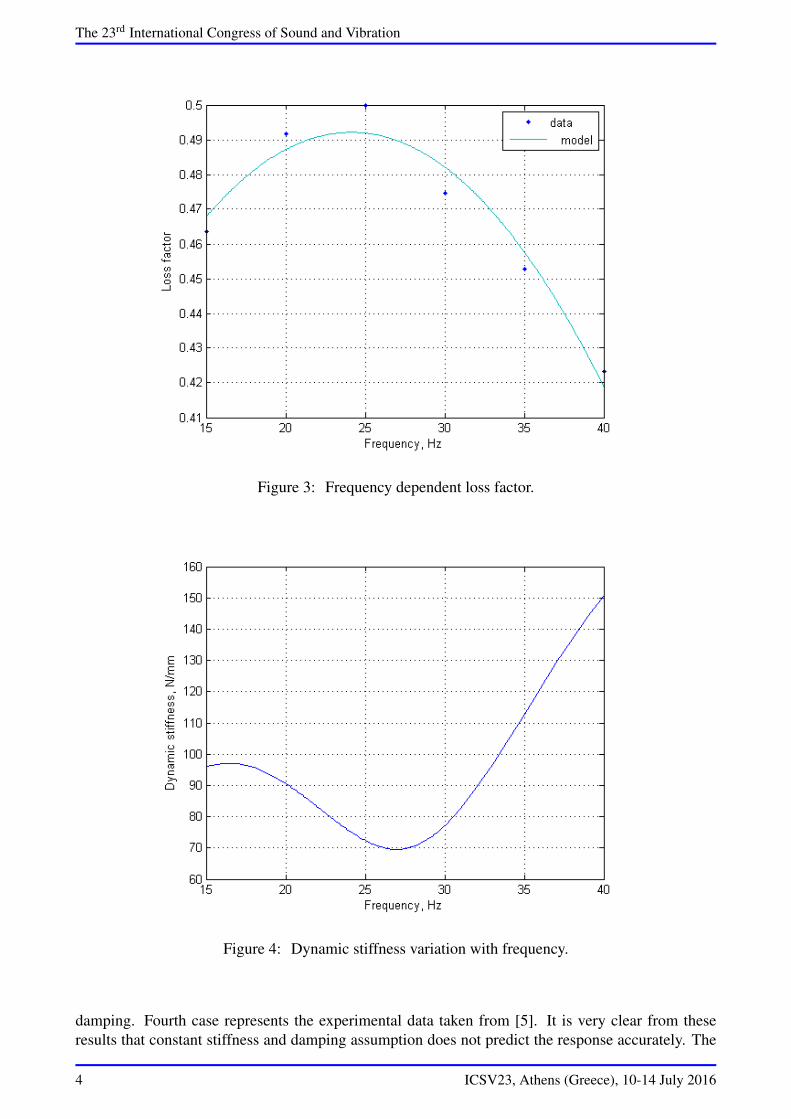
The variation of frequency dependent loss factor in the working frequency range is shown in Fig.3. The loss factor increases with frequency till 20 Hz entering transition zone between 20-30 Hz andthen starts decreasing at a faster rate from 30 Hz onwards. These results are obtained from fitting thedata to a quadratic of the form mentioned in Eq. (7) using the least-squares method. Higher order fithas not improved R2 value further. It is advised not to extrapolate the parameters from the Eqs. (6) &(7) out side the working range as it may lead to erroneous results.
η = p1f2 + p2f + p3 (7)
where f is in Hz, p1 = −0.000291, p2 = 0.01405, p3 = 0.3226 and R2 = 0.947 for the fit.In the next stage, by considering a rigid mass of 5 kg, the simulated dynamic stiffness magnitude
variation is shown in the Fig. 4. Dynamic stiffness decreases with frequency attains a very low valueat system natural frequency of 27 Hz and then increases with frequency.
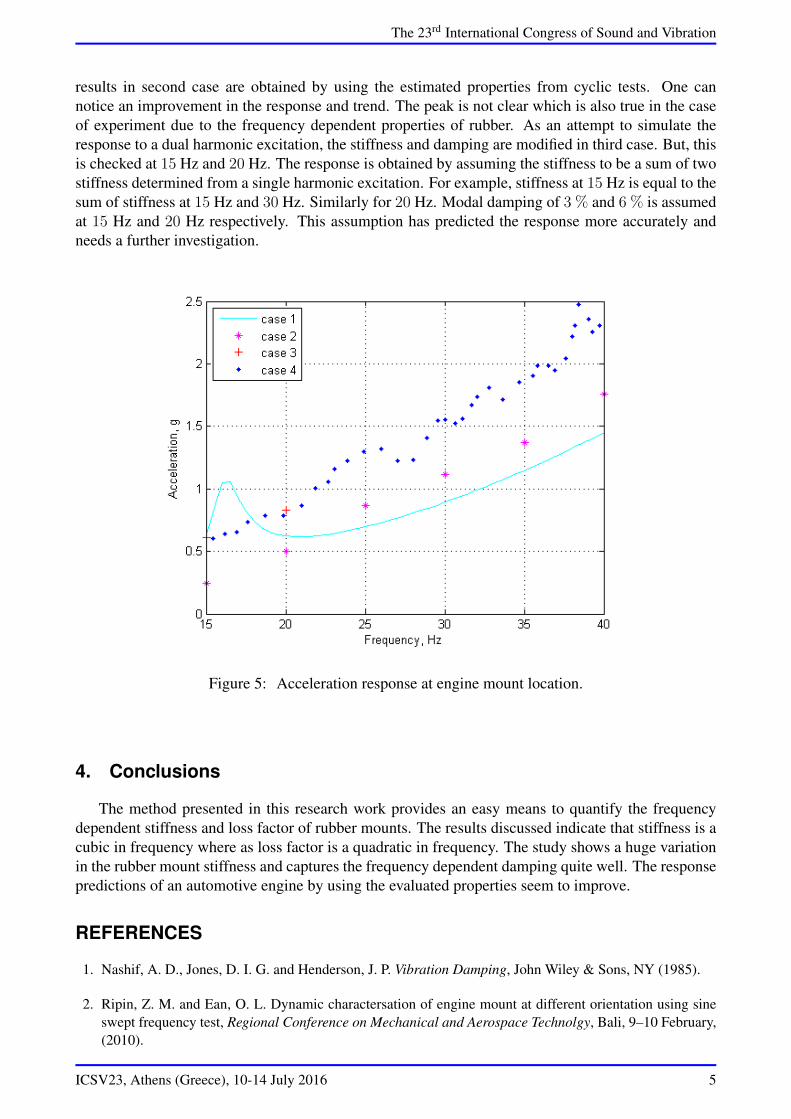
Finally, the estimated dynamic properties are implemented for the response calculations of anautomotive engine. The author in [5] has used a six degree of freedom (6 dof) rigid body vibrationmodel with constant stiffness and damping to simulate the response of engine. Also, an experimenthas been conducted in which the engine is subjected to a dual harmonic excitation. Higher orderforces are neglected. Figure 5 shows the acceleration response at one of the engine mount’s location.In first case, the response is simulated using a vibration model by assuming constant stiffness and
ICSV23, Athens (Greece), 10-14 July 2016 3
The 23rd International Congress of Sound and Vibration
Figure 3: Frequency dependent loss factor.
Figure 4: Dynamic stiffness variation with frequency.
damping. Fourth case represents the experimental data taken from [5]. It is very clear from theseresults that constant stiffness and damping assumption does not predict the response accurately. The
4 ICSV23, Athens (Greece), 10-14 July 2016
The 23rd International Congress of Sound and Vibration
results in second case are obtained by using the estimated properties from cyclic tests. One cannotice an improvement in the response and trend. The peak is not clear which is also true in the caseof experiment due to the frequency dependent properties of rubber. As an attempt to simulate theresponse to a dual harmonic excitation, the stiffness and damping are modified in third case. But, thisis checked at 15 Hz and 20 Hz. The response is obtained by assuming the stiffness to be a sum of twostiffness determined from a single harmonic excitation. For example, stiffness at 15 Hz is equal to thesum of stiffness at 15 Hz and 30 Hz. Similarly for 20 Hz. Modal damping of 3 % and 6 % is assumedat 15 Hz and 20 Hz respectively. This assumption has predicted the response more accurately andneeds a further investigation.
Figure 5: Acceleration response at engine mount location.
4. Conclusions
The method presented in this research work provides an easy means to quantify the frequencydependent stiffness and loss factor of rubber mounts. The results discussed indicate that stiffness is acubic in frequency where as loss factor is a quadratic in frequency. The study shows a huge variationin the rubber mount stiffness and captures the frequency dependent damping quite well. The responsepredictions of an automotive engine by using the evaluated properties seem to improve.
REFERENCES
1. Nashif, A. D., Jones, D. I. G. and Henderson, J. P. Vibration Damping, John Wiley & Sons, NY (1985).
2. Ripin, Z. M. and Ean, O. L. Dynamic charactersation of engine mount at different orientation using sineswept frequency test, Regional Conference on Mechanical and Aerospace Technolgy, Bali, 9–10 February,(2010).
ICSV23, Athens (Greece), 10-14 July 2016 5
The 23rd International Congress of Sound and Vibration
3. Lin, T. R., Farag, N. H. and Pan, J. Evaluation of frequency dependent rubber mount stiffness and dampingby impact test, Applied Acoustics, 66, 829–844, (2005).
4. Mustafa, E. L. and Kenan, Y. S. Charactersation of vibration isolators using vibration test data, Proceedingsof the 10th International Congress on Sound and Vibration, Stockholm, Sweden, 7–10 July, (2003).
5. Vishnu, K. K. S., Three Wheeler Engine Mount Configuration for Reduced Vibration, Master of TechnologyReport, Automotive Technology, Indian Institute of Technology, Madras, (2013).
6 ICSV23, Athens (Greece), 10-14 July 2016