développement des micro-entreprises au vietnam · pdf fileteaching and research...
TRANSCRIPT

HAL Id: tel-00592223https://tel.archives-ouvertes.fr/tel-00592223
Submitted on 11 May 2011
HAL is a multi-disciplinary open accessarchive for the deposit and dissemination of sci-entific research documents, whether they are pub-lished or not. The documents may come fromteaching and research institutions in France orabroad, or from public or private research centers.
L’archive ouverte pluridisciplinaire HAL, estdestinée au dépôt et à la diffusion de documentsscientifiques de niveau recherche, publiés ou non,émanant des établissements d’enseignement et derecherche français ou étrangers, des laboratoirespublics ou privés.
Développement des micro-entreprises au VietnamThi Quynh Trang Do
To cite this version:Thi Quynh Trang Do. Développement des micro-entreprises au Vietnam. Economies et finances.Université Paris-Est, 2010. Français. <NNT : 2010PEST3006>. <tel-00592223>
UNIVERSITE PARIS EST
ECOLE DOCTORALE EGEE
Doctorat
Sciences Economiques
Thi Quynh Trang DO
Titre:
Développement des micro entreprises au Vietnam
Thèse dirigée par: M. le Professeur Gérard DUCHÊNE
Soutenue le: 09 septembre 2010
Jury
M. Philippe ADAIR Maître de conférences, HDR, UPEC
M. Gérard DUCHÊNE Professeur des universités, UPEC
M. Alexandre KOLEV Maître de conférences associé, HDR, UPEC
M. Marc LAUTIER Maître de conférences, Université Paris 13
Mme. Mathilde MAUREL Directeur de recherche au CNRS, Université Paris 1
Mme. Thi Anh Dao TRAN-RIEBER Maître de conférences, HDR, Université de Rouen

ii

Remerciements
Tout d'abord je tiens mes remerciements à mon Directeur de thèse, Professeur Gérard
Duchêne, qui m'a initié à la recherche puis a dirigé mes travaux tout en me laissant
autonomie et indépendance. Il a su prendre son temps et de son énergie pour m'apprendre
tous les aspects du métier de chercheur.
Je remercie très chaleureusement Mme Mathilde Maurel et Mme Thi Anh Dao Tran-
Rieber d'avoir accepté la lourde tâche de rapporteur. Je remercie également M. Philippe
Adair, M. Alexandre Kolev et M. Marc Lautier d'avoir pris leur temps pour assister à la
soutenance de ma thèse.
Pour �nancer ma thèse, j'ai béné�cié d'une bourse Ei�el de l'EGIDE puis d'un poste
d'ATER à l'Université Paris Est - Créteil Val de Marne. J'en remercie donc les représen-
tants.
Finalement, je veux remercier mes collègues, mes amis et particulièrement ma famille
pour leur soutien et leur a�ection tout au long de cette thèse.
iii

iv
Résumé
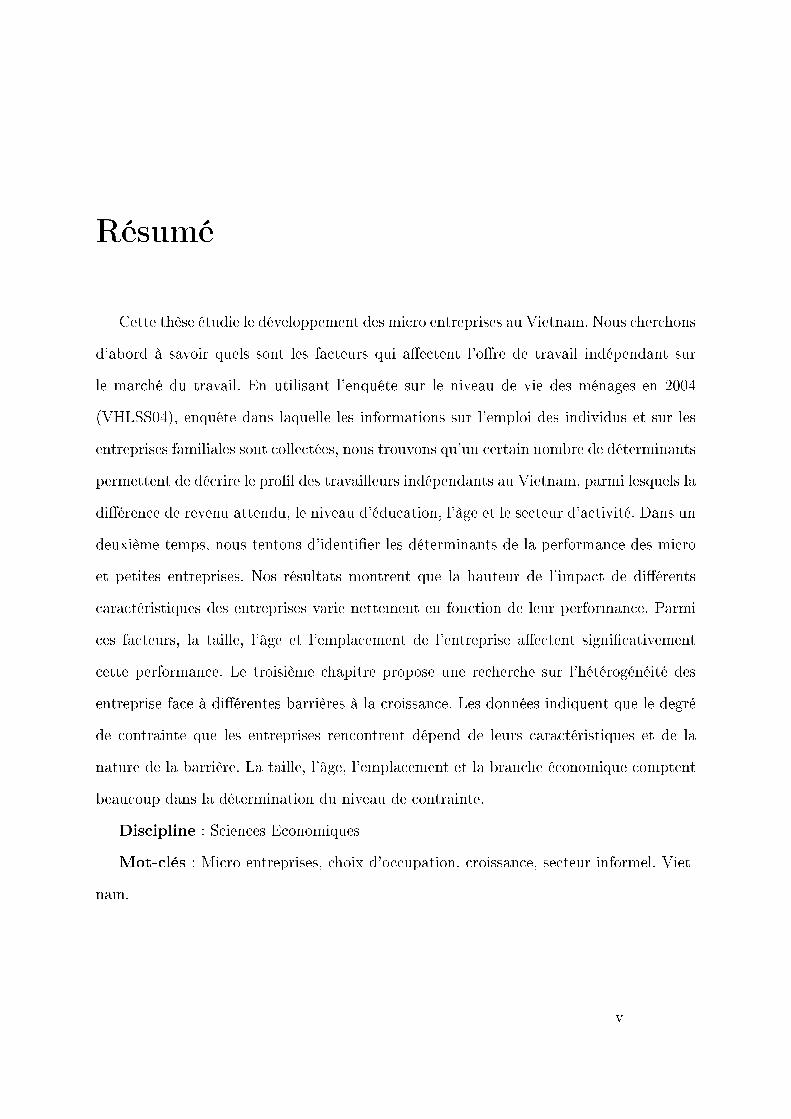
Cette thèse étudie le développement des micro entreprises au Vietnam. Nous cherchons
d'abord à savoir quels sont les facteurs qui a�ectent l'o�re de travail indépendant sur
le marché du travail. En utilisant l'enquête sur le niveau de vie des ménages en 2004
(VHLSS04), enquête dans laquelle les informations sur l'emploi des individus et sur les
entreprises familiales sont collectées, nous trouvons qu'un certain nombre de déterminants
permettent de décrire le pro�l des travailleurs indépendants au Vietnam, parmi lesquels la
di�érence de revenu attendu, le niveau d'éducation, l'âge et le secteur d'activité. Dans un
deuxième temps, nous tentons d'identi�er les déterminants de la performance des micro
et petites entreprises. Nos résultats montrent que la hauteur de l'impact de di�érents
caractéristiques des entreprises varie nettement en fonction de leur performance. Parmi
ces facteurs, la taille, l'âge et l'emplacement de l'entreprise a�ectent signi�cativement
cette performance. Le troisième chapitre propose une recherche sur l'hétérogénéité des
entreprise face à di�érentes barrières à la croissance. Les données indiquent que le degré
de contrainte que les entreprises rencontrent dépend de leurs caractéristiques et de la
nature de la barrière. La taille, l'âge, l'emplacement et la branche économique comptent
beaucoup dans la détermination du niveau de contrainte.
Discipline : Sciences Economiques
Mot-clés : Micro entreprises, choix d'occupation, croissance, secteur informel, Viet-
nam.
v

Abstract
This thesis investigates the development of micro enterprises in Vietnam. We seek to
know what factors a�ect the self-employment supply on the labour market. Using data
from the survey on household living standards in 2004 (VHLSS04) in which information
on employment of individual and household businesses are collected, we �nd a certain
number of determinants explaining the pattern of self-employed in Vietnam : earnings
di�erentials, educational level, age and business sector. In the second chapter, we seek
to identify the determinants of micro and small �rm performance. Our results show
that impact of di�erent factors on �rm performance varies signi�cantly across its growth
state. Among them, size, age and �rm location matters a lot to �rm growth. The third
chapter aims at analyzing the heterogeneity of �rms across di�erent barriers to growth.
Our empirical evidence reveals that the level of constraint met by �rms depends on the
�rm characteristics and the nature of barrier to growth. Size, age, location and industrial
sector constitute important determinants of constraint level.
Discipline : Economics
keywords : Micro entreprise, occupational choice, �rm growth, informal sector, Viet-
nam.
vi

Table des matières
Remerciements . . . . . . . . . . . . . . . . . . . . . . . . . . . . . . . . . . . iii
Résumé . . . . . . . . . . . . . . . . . . . . . . . . . . . . . . . . . . . . . . . v
Abstract . . . . . . . . . . . . . . . . . . . . . . . . . . . . . . . . . . . . . . . vi
Table des matières . . . . . . . . . . . . . . . . . . . . . . . . . . . . . . . . . vii
Liste des tableaux . . . . . . . . . . . . . . . . . . . . . . . . . . . . . . . . . . xi
Liste des abréviations . . . . . . . . . . . . . . . . . . . . . . . . . . . . . . . . xiii
1 Introduction et Résumé 1
1 Introduction générale . . . . . . . . . . . . . . . . . . . . . . . . . . . . . 1
2 L'Economie du Vietnam et l'enquête VHLSS 2004 . . . . . . . . . . . . . 10
2.1 Panorama macroéconomique . . . . . . . . . . . . . . . . . . . . . 10
2.2 L'enquête VHLSS2004 . . . . . . . . . . . . . . . . . . . . . . . . 12
2.3 Marché du travail . . . . . . . . . . . . . . . . . . . . . . . . . . . 15
2.4 Les micro entreprises . . . . . . . . . . . . . . . . . . . . . . . . . 18
3 Brève présentation des chapitres de la thèse . . . . . . . . . . . . . . . . 22
3.1 Les déterminants du travail indépendant . . . . . . . . . . . . . . 22
3.2 Les facteurs qui déterminent la performance des micro entreprises 27
3.3 Hétérogénéité des micro entreprises face aux contraintes sur leur
croissance . . . . . . . . . . . . . . . . . . . . . . . . . . . . . . . 35
2 Occupational choice between self-employment and salaried employment 45
1 Introduction . . . . . . . . . . . . . . . . . . . . . . . . . . . . . . . . . . 45
2 The private labour market in Vietnam . . . . . . . . . . . . . . . . . . . 47
vii

3 Occupational choice literature reviews . . . . . . . . . . . . . . . . . . . . 50
4 Econometric methods . . . . . . . . . . . . . . . . . . . . . . . . . . . . . 54
4.1 The model . . . . . . . . . . . . . . . . . . . . . . . . . . . . . . . 54
4.2 Statistical procedure . . . . . . . . . . . . . . . . . . . . . . . . . 57
5 Data and variables . . . . . . . . . . . . . . . . . . . . . . . . . . . . . . 58
5.1 Data . . . . . . . . . . . . . . . . . . . . . . . . . . . . . . . . . . 58
5.2 Variables . . . . . . . . . . . . . . . . . . . . . . . . . . . . . . . . 59
6 Empirical results and discussion . . . . . . . . . . . . . . . . . . . . . . . 60
6.1 Characteristics of workers in the sample . . . . . . . . . . . . . . 60
6.2 Reduced-form probit choice equation . . . . . . . . . . . . . . . . 63
6.3 Earnings equations . . . . . . . . . . . . . . . . . . . . . . . . . . 64
6.4 Earnings di�erentials . . . . . . . . . . . . . . . . . . . . . . . . . 67
6.5 Structural Probit equation . . . . . . . . . . . . . . . . . . . . . 69
7 Conclusion . . . . . . . . . . . . . . . . . . . . . . . . . . . . . . . . . . . 71
3 Determinants of MSEs growth 83
1 Introduction . . . . . . . . . . . . . . . . . . . . . . . . . . . . . . . . . . 83
2 Theoretical and empirical framework . . . . . . . . . . . . . . . . . . . . 85
3 Empirical model and data . . . . . . . . . . . . . . . . . . . . . . . . . . 91
3.1 Model . . . . . . . . . . . . . . . . . . . . . . . . . . . . . . . . . 91
3.2 Data . . . . . . . . . . . . . . . . . . . . . . . . . . . . . . . . . . 93
4 Variables and descriptive analysis . . . . . . . . . . . . . . . . . . . . . . 94
4.1 Variables . . . . . . . . . . . . . . . . . . . . . . . . . . . . . . . . 94
4.2 Descriptive analysis . . . . . . . . . . . . . . . . . . . . . . . . . . 97
5 Results . . . . . . . . . . . . . . . . . . . . . . . . . . . . . . . . . . . . . 99
5.1 Speci�cation and IIA tests . . . . . . . . . . . . . . . . . . . . . . 99
5.2 Estimated equation . . . . . . . . . . . . . . . . . . . . . . . . . . 100
6 Conclusions . . . . . . . . . . . . . . . . . . . . . . . . . . . . . . . . . . 104
7 Appendix . . . . . . . . . . . . . . . . . . . . . . . . . . . . . . . . . . . 106
viii

4 How �rm characteristics a�ect the level of growth constraints 119
1 Introduction . . . . . . . . . . . . . . . . . . . . . . . . . . . . . . . . . . 119
2 Theoretical and empirical underpinnings . . . . . . . . . . . . . . . . . . 121
3 Data . . . . . . . . . . . . . . . . . . . . . . . . . . . . . . . . . . . . . . 123
3.1 Some background features . . . . . . . . . . . . . . . . . . . . . . 123
3.2 Data description . . . . . . . . . . . . . . . . . . . . . . . . . . . 125
4 Variables and descriptive analysis . . . . . . . . . . . . . . . . . . . . . . 126
4.1 Variables and de�nition . . . . . . . . . . . . . . . . . . . . . . . 126
4.2 Descriptive statistics of the data . . . . . . . . . . . . . . . . . . . 130
5 Results and discussion on robustness test . . . . . . . . . . . . . . . . . . 132
5.1 Empirical results . . . . . . . . . . . . . . . . . . . . . . . . . . . 132
5.2 Test of robustness . . . . . . . . . . . . . . . . . . . . . . . . . . . 139
6 Conclusion . . . . . . . . . . . . . . . . . . . . . . . . . . . . . . . . . . . 140
7 Appendix . . . . . . . . . . . . . . . . . . . . . . . . . . . . . . . . . . . 143
5 General conclusion 157
Bibliographie 161
ix

x

Liste des tableaux
1.1 Indicateurs de développement du Vietnam . . . . . . . . . . . . . . . . . 10
1.2 Caractéristiques de la population du Vietnam en 2004 . . . . . . . . . . . 14
1.3 Niveau d'éducation de la population active du Vietnam en 2004 . . . . . 14
1.4 Distribution des travailleurs (Valeur en %) . . . . . . . . . . . . . . . . . 16
1.5 Caractéristiques des travailleurs appartenant à un seul catégorie de tra-
vailleurs . . . . . . . . . . . . . . . . . . . . . . . . . . . . . . . . . . . . 17
1.6 Distribution des travailleurs . . . . . . . . . . . . . . . . . . . . . . . . . 18
1.7 Distribution des entreprises familiales . . . . . . . . . . . . . . . . . . . . 19
1.8 Taux de participation des femmes dans les entreprises en 2005 . . . . . . 20
1.9 Taux d'enregistrement des micro entreprises par secteur . . . . . . . . . . 21
1.10 Résultat récapitulatif du chapitre 2 . . . . . . . . . . . . . . . . . . . . . 27
1.11 Résultat récapitulatif du chapitre 3 . . . . . . . . . . . . . . . . . . . . . 35
1.12 Résultat récapitulatif du chapitre 4 . . . . . . . . . . . . . . . . . . . . . 43
2.1 Employed population distribution by Ownership (%) . . . . . . . . . . . 48
2.2 Employed population distribution by kind of economic activities (%) . . 49
2.3 Employed population distribution by workers' status (%) . . . . . . . . . 50
2.4 Descriptive statistics . . . . . . . . . . . . . . . . . . . . . . . . . . . . . 74
2.5 Reduced probit equation . . . . . . . . . . . . . . . . . . . . . . . . . . . 75
2.6 Earnings equations . . . . . . . . . . . . . . . . . . . . . . . . . . . . . . 77
2.7 Absolute earnings di�erentials between self-employed and employees . . 79
2.8 Decomposition earnings di�erentials between self-employed and employees 79
xi

2.9 Structural probit equation . . . . . . . . . . . . . . . . . . . . . . . . . 80
3.1 Firm distribution by size and legal status and growth . . . . . . . . . . . 106
3.2 Firm distribution by owner educational level and growth . . . . . . . . . 106
3.3 Descriptive statistics . . . . . . . . . . . . . . . . . . . . . . . . . . . . . 107
3.4 Firm distribution by age and growth . . . . . . . . . . . . . . . . . . . . 108
3.5 Firm distribution by gender and growth . . . . . . . . . . . . . . . . . . 108
3.6 Wald test and LR test for combining outcomes . . . . . . . . . . . . . . 109
3.7 IIA test results . . . . . . . . . . . . . . . . . . . . . . . . . . . . . . . . 109
3.8 �Up� state vs. �Unchanged� state of sales growth . . . . . . . . . . . . . 110
3.9 �Down� state vs. �Unchanged� state of sales growth . . . . . . . . . . . . 112
3.10 �Up� state vs. �Unchanged� state of sales growth . . . . . . . . . . . . . . 114
3.11 �Down� state vs. �Unchanged� state of sales growth . . . . . . . . . . . . 116
4.1 Employed population distribution . . . . . . . . . . . . . . . . . . . . . . 143
4.2 Firm distribution by size in 2006 . . . . . . . . . . . . . . . . . . . . . . 144
4.3 Number of �rms by type . . . . . . . . . . . . . . . . . . . . . . . . . . . 145
4.4 Net turnover in 2006 by ownership . . . . . . . . . . . . . . . . . . . . . 146
4.5 Firm owners' evaluation of constraints to growth . . . . . . . . . . . . . . 147
4.6 Simple correlation of constraints to �rm growth . . . . . . . . . . . . . . 149
4.7 Rotated factor loadings and unique variances . . . . . . . . . . . . . . . . 150
4.8 Descriptive statistics of the sample . . . . . . . . . . . . . . . . . . . . . 151
4.9 Average value of constraints level by �rm performance status . . . . . . . 152
4.10 Institutional constraints . . . . . . . . . . . . . . . . . . . . . . . . . . . 153
4.11 FIN-TAX-License constraints . . . . . . . . . . . . . . . . . . . . . . . . 154
4.12 Social instability constraints . . . . . . . . . . . . . . . . . . . . . . . . . 155
4.13 Infrastructure constraints . . . . . . . . . . . . . . . . . . . . . . . . . . . 156
xii

Liste des abréviations
ACP : Analyse en composantes principalesASEAN : AssociationEO : Entrepreneurial orientationGDP : Gross Domestic ProductGNI : Gross National IncomeGSO : General statistics O�ceIIA : Independant of Irrelevent AlternativesMCO : Moindre Carré OrdinaireMNL : Multinomial LogitMSE : Micro and Small enterpriseOCDE : Organisation de coopération et de développement économiquesOE : Orientation EntrepreneurialeOECD :Organisation for economic cooperation and developmentOLS : Ordinarie Least SquarePCA : Principal Component AnalysisPED : Pays en voie de DéveloppementPIB : Produit Intérieur BrutPME : Petite et Moyenne EntrepriseR&D : Recherche et Développement ;
: Research and DevelopmentSOEs : State Owner's EnterprisesVAT : Value Added TaxVHLSS :Vietnam Household Living Standard Survey
xiii

xiv

Chapitre 1
Introduction et Résumé
1 Introduction générale
L'idée selon laquelle l'entrepreneuriat et la croissance économique sont intiment liés
et se renforcent mutuellement remonte aux travaux de Schumpeter (1911). Schumpe-
ter a�rme que la création de nouvelles entreprises constitue un moteur de la croissance
économique. Cet e�et résulterait de l'expression concrète de la nature de l'entrepreneur
(présentée ci-après) et, plus précisément, de sa propension à innover. Schumpeter a dé-
composé cette activité en cinq composants : "(1) l'introduction d'un nouveau bien ou
d'un bien de meilleure qualité, (2) l'introduction d'une nouvelle méthode productive ou
commerciale, (3) l'ouverture d'un nouveau marché, (4) la conquête de nouvelles sources
de matières ou de biens intermédiaires, (5) la réalisation de nouvelles organisations indus-
trielles (Schumpeter, 1961, p66). Par l'innovation, l'entrepreneur Schumpeterien recherche
la création de nouvelles opportunités de pro�t. Celles-ci peuvent découler d'accroissements
de productivité. De plus, l'innovation introduite par l'entrepreneur constitue une source
de déséquilibre créative. Alors que certaines entreprises adoptent l'innovation, celles qui
sont moins e�caces sont forcées de quitter le marché jusqu'à ce que le nouvel équilibre soit
atteint. Dans ce cas, la relation avec la croissance économique apparaît assez clairement.
Pourtant, bien que la contributions de Schumpeter soit fondamentale, son impact sur
les politiques publiques semble assez limité. Pendant plusieurs décennies, les politiques
1

visant la création d'entreprises et en particulier les petites entreprises conçues comme le
moteur de la croissance économique, sont restés très limitées. Dans leur ouvrage �Entre-
preneurship and economic growth�, Audrestch et al. (2006) indiquent que :
"Only few years earlier the policy debate focusing on growth and employment
had looked to the macroeconomic instruments of �scal and monetary policy on
the one hand and the size and scale economies yielded by the large corporation
on the other.�
En e�et, le rôle de l'entrepreneuriat dans l'économie a été largement sous-estimé pen-
dant la première moitié du 20 ème siècle. L'importance de l'entrepreneuriat a diminué
pendant la période après la Seconde Guerre Mondiale, où le modèle de croissance de
Solow (1956) basé sur la fonction de production néoclassique est largement utilisé pour
expliquer la croissance économique. Deux principaux facteurs de production, le capital
physique et la main d'oeuvre, sont économétriquement utilisés dans le modèle comme les
déterminants de la croissance. Dans son modèle, Solow(1956) reconnaît le rôle du progrès
de technique dans la croissance économique mais il le considère comme un facteur exo-
gène. De ce fait, une grande partie non expliquée par les deux facteurs de production dans
la variation du taux de croissance entre les pays est expliquée par un résidu exogène -
la di�érence de niveau technologique. D'après ce modèle, c'est l'investissement en capital
physique qui est la clé de la croissance économique et de la hausse de productivité des
travailleurs. En conséquence, la littérature économique et les décideurs se concentrent
sur les instruments, à savoir les politiques économiques, qui sont favorables à l'inves-
tissement en capital physique, et entraînent par la suite la croissance économique. Au
niveau des implications microéconomiques, ce modèle de croissance engendre des débats
sur l'organisation des entreprises et du marché. Les arguments théoriques suggèrent que
l'utilisation du capital physique est plus e�cace dans les grandes entreprises susceptibles
d'exploiter des économies d'échelle. L'exploitation des économies d'échelle quant à elle,
entraîne la concentration du marché et des situations d'oligopole,avec un petit nombre
de producteurs sur le marché. Il n'y a donc plus de rôle de l'entrepreneuriat dans ce cas.
2

Les travaux empiriques 1 a�rment l'e�cacité des économies d'échelle dans la promotion
de la croissance économique. Par conséquent, sous l'in�uence du modèle de croissance
de Solow, le rôle de l'entrepreneuriat dans la croissance économique est rabaissé aux
yeux des autorités et de nombreux économistes. De fait, pendant la période de l'après
Guerre, le nombre des entrepreneurs a diminué dans plusieurs pays développés du monde
(Audrestch et al., 2006).
Comme nous l'avons présenté ci-dessus, une part importante de la di�érence de taux
de croissance entre les pays est expliquée dans le modèle de Solow par l'écart du progrès
technologique qui est considéré comme un facteur exogène. Dans le modèle de croissance
de Romer (1986), ce facteur est introduit comme une variable endogène. Cependant,
l'entrepreneuriat et les petites entreprises sont ici encore considérés comme moins avan-
tageux, comme dans le modèle de Solow, par rapport à l'investissement technologique
et par la suite dans la création de nouvelles technologies. Cette conclusion semble être
con�rmée par les études de Acs et Audretsch (1990) qui ont trouvé que la corrélation
entre l'investissement dans la recherche (R&D) et le développement et le nombres des
innovations est positive. Toutefois, des études récentes montrent que les petites entre-
prises ne se trouvent pas dans une situation désavantageuse. Certes, en valeur absolue,
les dépenses de R&D dans les grandes entreprises sont plus importantes mais en valeur
par tête, les données empiriques ne montrent pas la même tendance (Arvanitis, 1997 et
Castany et al., 2005). De plus, les études de Yang et Huang (2005) montrent que les
dépenses en R&D entraînent un taux de croissance plus élevé pour les petites entreprises
sur un échantillon d'entreprises Taiwanais dans le secteur électronique (Yang et Huang,
2005). Les dépenses en R&D ne peuvent ainsi être utilisées comme une mesure unique
de la capacité d'innovation. Le nombre des brevets est également un indice fréquent pour
1. Pratten (1971) trouve que les petites entreprises sont moins e�caces que les grandes. Les étudesde Alvarez et Crespi, 2003, Caves et Barton, 1990, Gumbau-Albert and Maudos, 2002, Torii, 1992 etMeeusen and van Den Broeck, 1977 montrent que l'e�cacité de l'entreprise augmente avec sa taille.Plusieurs études sur l'écart de revenus des travailleurs à travers la taille de l'entreprise révèlent que lesplus petites et les plus jeunes entreprises payent moins leurs employées (Brown et Medo�, 1989 et 2003,Winter-Ebmer et Zweimuller, 1999, Wunnava et Ewing, 2000). Voir Van Praag et Versloot (2007) pourun revue détaillé sur le rôle de l'entrepreneuriat dans l'économie.
3

mesurer le niveau d'innovation de l'entreprise. Avec cette mesure, les données empiriques
indiquent souvent que des grandes compagnies produisent plus de brevets que leurs rivales
(Acs et Audrestch, 1990, Almeida et Kogut, 1997). Love et Ashcroft (1999) trouvent que
le nombre de brevets augmente avec la taille des entreprises sur un échantillon de �rmes
écossaises. Pourtant, en utilisant le nombre des innovations par tête pour mesurer le ni-
veau d'innovation de l'entreprise, les résultats montrent que les PME sont plus e�caces
dans la création de brevets (deux fois plus dans les études de Acs et Audrestch (1990)) ; la
relation avec la taille de l'entreprise est négative dans Love et Ashcroft (1999). D'autres
résultats très intéressant de Almeida et Kogut (1997) sont que les PME produisent plus de
brevets dans les champs soit disant moins exploités tandis que les grandes se concentrent
dans les champs plus exploités et que le nombre des citations des brevets des PME n'est
pas inférieur à celui des grandes �rmes. Dans une certaine mesure, ces résultats montrent
l'importance de l'entrepreneuriat et les PME dans la création d'innovations et la crois-
sance économique.
De fait, Lazear (2003) souligne le rôle important de l'entrepreneur dans l'économie
moderne dans la première ligne de ses études : �The entrepreneur is the single most im-
portant player in a modern economy�. Contrairement à la prédiction selon laquelle la
mondialisation de l'économie pourrait créer un environnement plus hostile au dévelop-
pement des PME, l'entrepreneuriat �ré-émerge� comme une force vitale de la croissance
économique dans les pays développés. D'un côté, il est vrai que la mondialisation entraîne
des coûts �xes concernant l'étude des marchés étrangers, la négociation avec les gouver-
nements étrangers, qui rendent di�cile l'accès des PME au marché. Les grandes �rmes
susceptibles d'exploiter des économies d'échelle pourraient amortir ces coûts et ainsi de-
venir plus compétitives par rapport à leurs rivales. Pourtant, de l'autre côté, depuis l'ère
de la mondialisation (à partir des années 80 du 20 ème siècle), on constate la renaissance
de l'entrepreneuriat dans l'économie mondiale. Le rôle relatif des PME augmente dans
les pays développés de l'Amérique du Nord comme de l'Europe. Leur contribution dans
le PIB du pays, leur part de marché, croissent suite une longue période de diminution
4

après la Guerre (Audretsch et al., 2006). De plus, l'émergence de l'entrepreneuriat se
manisfeste par sa capacité de création d'emplois. Baldwin (1998) trouve que la part des
employés dans les entreprises les plus petites (dont l'e�ectif est inférieur à 100) augmen-
tait tandis que celle des grandes diminuait pendant la période 1973-1992 au Canada. Les
résultats similaires sont remarqués aux Etats Unis pendant la période 1972-1988 dans
les recherches de Davis et al. (1996), au Royaume Uni dans Gallagher et Stewart (1986)
pendant la période 1971-1981, dans Carree et Thurik (1998) pour treize pays européens
pendant le période 1990-1994. Heshmati (2001) montre que la création d'emploi est néga-
tivement liée à la taille de l'entreprise sur des données des entreprises Suédoises. Konings
et al.(1996) trouvent que les PME créent plus d'emploi par rapport à leurs rivales dans
un pays en transition (cas de la Pologne). Babetski et al. (2004) trouvent également le
même résultat dans une études sur le marché de travail au Kyrghyzstan. Les petites en-
treprises créent plus d'emplois. Il faut noter que dans les pays en voie de développement,
les PME occuppent souvant une part très importante, et même dominante, sur le marché
du travail (Tybout, 2000). Ainsi, le rôle de l'entrepreneur dans la création des nouveaux
emplois est non négligeable.
En ce qui concerne la liaison économétrique, les études utilisant les données au niveau
d'entreprises - pour examiner la relation entre la taille et l'âge de l'entreprise et le taux
de création d'emploi - sont inspirées de la loi de Gibrat 2 (1931). Sur le plan empirique,
les résultats des études montrent que dans la plupart des cas, le taux de croissance de
l'e�ectif est plus important dans les moins grandes entreprises, à la fois pour tous les
secteurs et dans un secteur donné(van Praag et Versloot, 2007). La tentative d'in�rmer
ou de con�rmer la loi de Gibrat sur la relation entre le taux de croissance de l'entreprise
et sa taille entraîne l'élargissement du concept de croissance de l'entreprise. Il ne se limite
plus au taux de croissance du nombre d'employé mais aussi au taux de croissance de
la productivité par travailleur, au taux de croissance de la valeur ajoutée, des actifs ou
du chi�re d'a�aire etc. De Kok et al. (2005) trouvent que la relation entre le taux de
2. La loi de Gibrat postule notamment que le taux de croissance de la �rme est indépendant de sonrang dans la distribution des tailles.
5

croissance de la productivité en termes de valeur ajoutée et la taille de l'entreprise est
négative. Autrement dit, les plus petites entreprises présentent un taux de croissance de
la valeur ajoutée plus important. Un résultat similaire est présenté dans les études de
Rodriguez et al. (2003). La loi de Gibrat n'est donc pas véri�ée.
Le retour de l'entrepreneuriat comme un moteur de croissance dans l'économie mon-
diale fait l'objet de plusieurs travaux. Ceux ci cherchent à l'expliquer et développer les
modèles théoriques de base appliqués à cette relation. Sur le plan empirique, la compa-
raison entre les performances des PME et des grandes entreprises intéresse également
beaucoup de chercheurs. Majumdar (1997), utilisant le niveau de productivité (le ratio
entre la valeur ajouté et le coût de production) et le niveau de rentabilité pour mesurer la
performance des entreprises, montre que les grandes entreprises sont plus rentables mais
moins productives que les PME. L'e�et de débordement (spillover e�ect) dans l'économie
de la connaissance est utilisé pour expliquer pourquoi les petites entreprises, en investis-
sant moins en R&D, pourraient se procurer des �knowledge input� pour leur production
(Audretsch et al. , 2006) et semblent ainsi plus e�cace étant données que le ratio entre
leur dépenses en R&D et leurs brevets est inférieur à celui des grandes. De plus, la qualité
de leurs innovations n'est pas sans doute inférieure à celle des grandes entreprises (Van
Praag et Verlost, 2007).
Vu le rôle de �single most important player in modern economic� (Lazear, 2003) on
pourrait poser un grand nombre de questions concernant l'entrepreneur. Qui est l'entre-
preneur ? Qui pourrait le devenir et pourquoi ? Quelles sont les caractéristiques qui font
d'un individu un entrepreneur réussi ? Bien que l'entrepreneuriat soit largement reconnu
comme un moteur dans le développement économique, il manque encore de consensus
sur les motivations des activités entrepreneuriales. Ceci entraîne di�érents mesures de
l'entrepreneuriat et beaucoup de complexité dans l'indenti�cation de l'entrepreneur (Au-
dretsch et al., 2006). Les études sur ce sujet recourent à un certain nombre de mesures,
y compris le taux de travailleurs indépendants (le nombre des travailleurs indépendants
sur la population active), le nombre des activités commerciales (ou en d'autres termes
6

le nombre des micro entreprises), le taux de nouvelles entreprises (le nombre de nou-
velles entreprises sur le nombre des entreprises total) . Parmi plusieurs mesures, le taux
de travailleurs indépendants est collecté dans plusieurs pays, et il est largement utilisé
pour mesurer le niveau entrepreneurial a�n de faciliter la comparaison entre les pays et à
travers le temps. Etant donné leur importance économique, des politiques concernant les
activités de l'entrepreneur se sont développés ces dernières années. De ce fait, il semble
évident que les autorités ont besoin d'être informées sur la dynamique de l'entrepreneur
et sur les déterminants de sa croissance et des régulations correspondantes.
Dans les pays développés, les deux dernières décennies voient l'émergence d'études
théoriques et empiriques sur la relation entre les caractéristiques de l'individu et de l'en-
treprise et l'entrée dans le secteur du travail indépendant, sur la survie et la croissance
des petites et micro-entreprises. Pourtant, en dépit de l'attention pourtée aux petites et
micro-entreprises par les politiques de développement, il y a encore peu d'études systé-
matiques pour tester si la dynamique des PME et micro-entrenprises dans les pays en
voie de développement ressemble à celle des pays développés (Fajnzylber et al., 2006).
Si les di�érences ne sont pas trop importantes, les autorités auront à leur disposition un
cadre d'analyse puissant sur les activités des PME et les politiques concernant l'entrepre-
neuriat. De plus, dans ce cas, cette similitude entre le parcours des PME dans les pays en
voie de développement (PED) et dans les pays développés, pourrait fournir des preuves
additionnelles au débat sur le rôle des PME et des micro-entreprises dans la croissance
des PED. Dans les pays développés, l'ouverture d'un �business� et devenir travailleur
indépendant constitue souvent une alternative préférable chez les salariés. Cependant,
dans les PED, une proportion importante des travailleurs indépendants est informelle.
Ils sont considérés comme incapables de trouver un travail dans le secteur salarié et ainsi
choisissent le travail indépendant par défaut. Ils sont caractérisés par un niveau faible
de productivité et d'e�cacité. Ces deux regards sur le secteur du travail indépendant
dans les PED et les pays développés entraînent di�érentes implications sur l'entrée, la
dynamique et la règlementation des micro et petites entreprises. De plus, dans les PED
7

où l'économie informelle est un phénomène courant, selon que les micro-entreprises infor-
melles seraient complémentaires ou substituables aux entreprises formelles, les politiques
correspondantes di�èrent (Adair, 2002).
De fait, nous avons trois objectifs dans cette thèse.
Notre premier objectif est d'identi�er ce qui pousse une personne à choisir le tra-
vail indépendant plutôt qu'un emploi salarié. Il s'agit d'un sujet largement abordé dans
la littérature entrepreuriale mais d'un champ d'étude encore peu étudié pour le cas du
Vietnam. Les travailleurs indépendants occupent une part très importante sur le marché
de travail du Vietnam. En gérant les micro et petites entreprises, les travailleurs indé-
pendants contribuent à une o�re d'emploi importante sur marché, non seulement pour la
personne qui crée l'entreprise mais aussi pour d'autres sur le marché du travail. Pour cette
raison, leur rôle dans la création d'emploi ainsi que dans la lutte contre la pauvreté est
bien reconnu par les économistes. Il est donc important de savoir qui sont ces travailleurs
et quel pourrait être le facteur qui les pousse à choisir le travail indépendant au lieu d'un
travail salarié. Nous mettons l'accent sur le rôle de l'écart de revenus dans la décision des
travailleurs.
Notre deuxième objectif dans cette thèse est d'étudier les facteurs qui in�uencent
la performance des micro entreprises. En terme d'e�ectifs, les micro et petites entreprises
représentent la majorité des entreprises en général et elles absorbent également une part
très importante de la main d'oeuvre sur le marché du travail. En terme de croissance
économique, il s'agit des entités les plus dynamiques de l'économie. Ces entreprises contri-
buent pour une part non négligeable à la forte croissance économique du Vietnam. Vu que
l'économie du Vietnam va aborder l'étape "e�ciency-driven " 3 dans laquelle les écono-
mies d'échelle jouent un rôle primordial dans l'e�cacité de la production et donc dans la
croissance économique, on s'interroge sur la performance des micro et petites entreprises.
Dans la perspective où ces entreprises de petite taille pourraient devenir plus grandes,
3. Selon Schwab et al. (2002) la compétitivité d'un pays se di�érencie par le niveau du développementde l'économie qui se compose de trois étape spéci�que : (1) factor - driven stage, (2) e�ciency-drivenstage et (3) innovation-driven stage ; et deux périodes de transition entre ces trois étapes. Voir Acs et al.(2008) pour les dé�nitions détaillées de ces étapes et périodes de transition.
8
plus compétitives et plus puissantes dans l'avenir, des mesures visant à promouvoir la
croissance de ces entreprises ont été promulguées. A�n d'aider les autorités à o�rir des
politiques correspondant mieux aux besoins des entreprises, nous tenons ainsi à montrer
empiriquement les déterminants de la performance des micro et petites entreprises.
Dans le cadre des travaux empiriques, les analyses portant sur les déterminants de
la croissance des entreprises sont nombreuses, de toute évidence beaucoup plus pour le
cas des pays développés mais avec le temps, le cas des pays en voie de développement
reçoit également une attention croissante des économistes. Toutefois, malgré le fait que
les entreprises ne sont pas homogènes face aux barrières de croissance, les travaux em-
piriques qui ont pour but de quanti�er l'impact des déterminants du développement de
l'entreprise sont assez modestes. En e�et, les entreprises ne s'exposent pas de même façon
aux barrières à la croissance, la � solution unique à appliquer en toute circonstance� - �one
size �ts all policy�- a été ainsi remise en cause. De ce fait, notre troisième objectif est
de présenter une étude empirique sur l'hétérogénéité des entreprises à l'égard de di�érents
obstacles de la croissance. Nous montrons que le degré de contrainte auquel l'entreprise
doit faire face varie en fonction des caractéristiques de l'entreprise et selon les barrières
auxquelles elles font face.
Cette thèse porte sur un pays particulier, le Vietnam. Nous utilisons dans nos ana-
lyses une seule base de données, l'enquête du niveau de vie des ménages -VHLSS 2004.
Avant de présenter en détail les apports de la thèse, nous présentons une brève descrip-
tion du contexte socio-économique dans lequel fonctionnent les micro-entreprises et nous
décrivons en général 4 l'enquête utilisée.
4. Les caractéristiques détaillés des données utilisées pour chaque analyse sont présentés dans leschapitres correspondants.
9

2 L'Economie du Vietnam et l'enquête VHLSS 2004
2.1 Panorama macroéconomique
Le Vietnam est un pays d'Asie du Sud Est membre de l'ASEAN (l'Association des
Nations de l'Asie du Sud-Est, organisation politique, économique et culturelle) depuis
1995. Avec une super�cie d'environ 330 mille km2, le Vietnam se situe au 13 ème rang du
monde en ce qui concerne la population avec environ 86 millions d'habitants en 2008. Le
pays est jeune, plus de la moitié de la population est âgée de moins de 27 ans. Le taux
de croissance de la population annuel est de 1,2 pour cent. Plus d'une vingtaine d'années
après la réforme économique de 1986 qui marque le début de la transition vietnamienne,
le PIB par tête est de 890 dollars américains à prix courants. Le taux de croissance du
PIB, variant entre 6 et 8 pour cent par an, classe le Vietnam parmi les pays ayant le
rythme de croissance le plus important du monde. Le tableau (1.1) présente quelques
indicateurs récents du développement du Vietnam.
Tableau. 1.1 � Indicateurs de développement du Vietnam
2000 2008 Monde 2008Population Million 77 86 6692
Taux de croissance annuel % 1,2 1,2PNB Par tête (USD)* 390 890 8613PIB Taux de croissance annuel % 6,8 6,2 2,0
Milliard (USD) 31,2 90,0 60587.0Espérence de vie Années 69 74 69Taux de pauvreté*** % de la population 37,4 ** 16,0(+)Valeur ajoutée (% of PIB) Agriculture 24,5 22,1
Industrie 36,7 39,7Services 38,7 38,2
* : Valeur au prix courant
** : Valeur en 1998
*** : Les taux de pauvretés sont estimés en fonction du seuil de pauvreté déterminé par
GSO et la Banque Mondiale
+ : Valeur en 2006
Sources : GSO et La Banque Mondiale (WDI)
10

Figure 1.1 �
Avant la transition économique, le secteur privé n'existait pas au Vietnam. Seul le sec-
teur étatique, y compris les entreprises étatiques et les co-opératives, apparaissait comme
créateur formel de l'emploi. Face à une grave crise socio-économique, le gouvernement
du Vietnam a procédé à une profonde réforme économique vers la �n des années 80 5.
La transition économique du Vietnam de l'économie plani�ée à l'économie du marché est
largement étudiée dans la littérature. Nous pouvons citer entre autres : Au�ret (2003) ;
Arkadi et Do(2004), Justino et Litch�eld (2003), Brassard (2004), Hemlin et al. (1998),
Tran et al. (2009). Le secteur privé a ainsi vu le jour il y a environ 20 ans. Dès lors,
parallèlement à l'arrivée des investissements directs étrangers, la structure économique
du Vietnam change graduellement.
Les graphiques 1.1 et 1.2 nous montrent le taux de la croissance du PIB et l'évolution
de l'ouverture internationale du Vietnam de 1986 à 2008. La part des exportations et des
importations dans le PIB du Vietnam augmente sans cesse pendant 22 ans.
Le taux de croissance rapide déclenché par cette réforme a permis une augmentation
5. Pour les informations détaillé sur la réforme économique voir Tamara, 2006
11

Figure 1.2 �
Source : World Development Indicators
importante du revenu par tête et une forte diminution du taux de pauvrété 6. Les résultats
préliminaires du processus de transition permettent l'amélioration nette du niveau de vie
des ménages au Vietnam surtout pour le segment le plus pauvre 7.
2.2 L'enquête VHLSS2004
Nous utilisons dans cette thèse l'enquête du niveau de vie des ménages en 2004
(VHLSS 2004) menée par l'O�ce de statistiques générales du Vietnam (GSO) sous l'as-
sistance technique de la Banque Mondiale. Il s'agit d'une enquête tirée d'une série de
cinq faites tous les deux ans au Vietnam de 2002 à 2010. Les deux dernières enquêtes
ont été réalisées en 2006 et en 2008 mais elles n'ont pas été publiées entièrement pour
le momment. Une autre raison pour laquelle nous utilisons l'enquête 2004 sera évoquée
6. Le taux de pauvreté est estimé via les dépenses moyennes mensuelles par tête selon le seuil depauvreté calculé par GSO et la Banque Mondiale comme suit : 1998 : 149 milles dongs et 2006 : 213 millesdongs. Dong : monnaie domestique du Vietnam ; Taux de change dong/ dollar américain (VND/USD)est de 16000 VND/ 1 USD en 2006
7. Pour plus de détail sur la réduction de pauvreté au Vietnam pendant le début du processus de tran-sition, voir Vietnam Poverty Analysis, prepared for the Australian Agency for International Developmentby the Centre for International Economics" (2002).
12

Figure 1.3 �
Source : GSO
un peu plus loin. L'approche de ces enquêtes correspond aux normes utilisées dans les
enquêtes sur le niveau de vie de la Banque Mondiale. L'échantillon est représentatif de
l'ensemble du pays et re�ète la situation de huit régions économiques.
Chaque enquête comprend un questionnaire sur les ménages et un sur les communau-
tés. Le questionnaire sur les communautés comprend des questions sur les caractéristiques
démographiques et physiques, les activités et les conditions économiques générales, le ni-
veau de développement de l'infrastructure physique, les informations sur le transport, la
production agricole etc. au niveau de communauté.
Le questionnaire sur les ménages couvre un champ large d'informations concernant les
individus et les ménages, comme les caractéristiques démographiques, le niveau d'édu-
cation, l'emploi, la santé, le revenu, les dépenses, l'épargne, le logement et l'accès aux
services publics etc.
Etant conçue initialement pour étudier la pauvreté et l'inégalité, l'enquête VHLSS
est largement utilisée pour analyser plusieurs autres aspects de l'économie, y compris les
activités économiques familiales. La version de 2004 est la seule dans la série de cinq
13
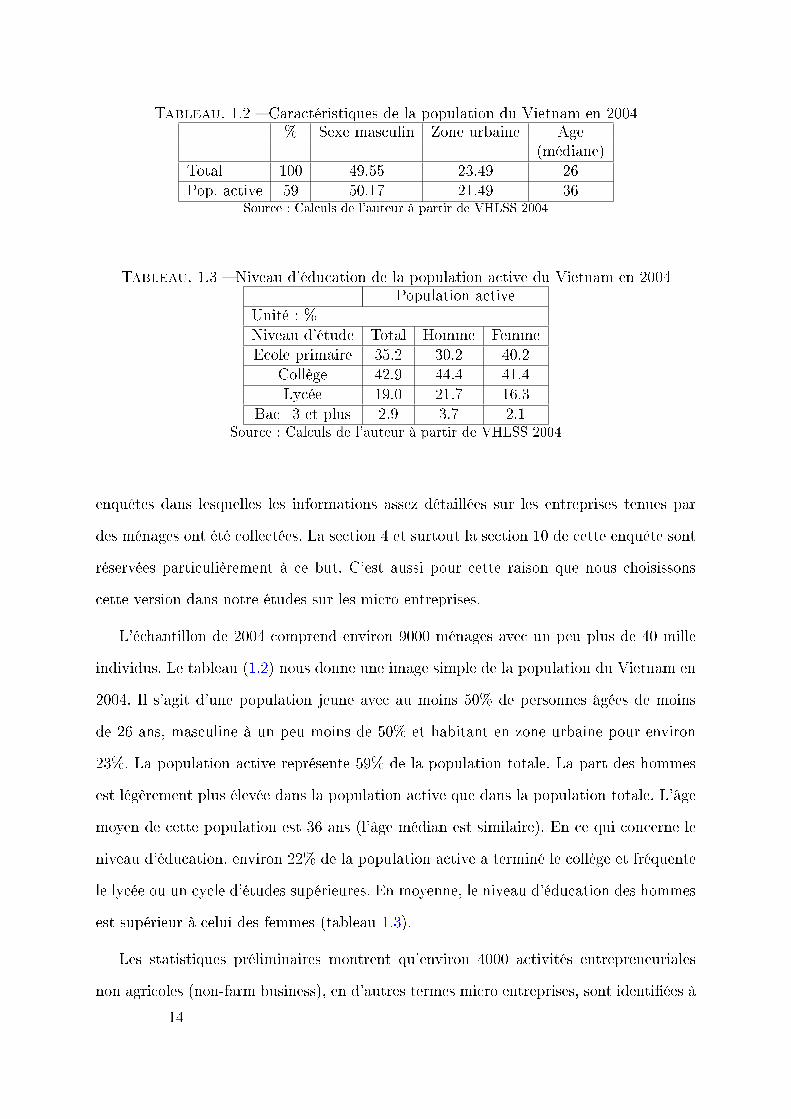
Tableau. 1.2 � Caractéristiques de la population du Vietnam en 2004% Sexe masculin Zone urbaine Age
(médiane)Total 100 49.55 23.49 26Pop. active 59 50.17 21.49 36
Source : Calculs de l'auteur à partir de VHLSS 2004
Tableau. 1.3 � Niveau d'éducation de la population active du Vietnam en 2004Population active
Unité : %Niveau d'étude Total Homme FemmeEcole primaire 35.2 30.2 40.2
Collège 42.9 44.4 41.4Lycée 19.0 21.7 16.3
Bac+3 et plus 2.9 3.7 2.1Source : Calculs de l'auteur à partir de VHLSS 2004
enquêtes dans lesquelles les informations assez détaillées sur les entreprises tenues par
des ménages ont été collectées. La section 4 et surtout la section 10 de cette enquête sont
réservées particulièrement à ce but. C'est aussi pour cette raison que nous choisissons
cette version dans notre études sur les micro entreprises.
L'échantillon de 2004 comprend environ 9000 ménages avec un peu plus de 40 mille
individus. Le tableau (1.2) nous donne une image simple de la population du Vietnam en
2004. Il s'agit d'une population jeune avec au moins 50% de personnes âgées de moins
de 26 ans, masculine à un peu moins de 50% et habitant en zone urbaine pour environ
23%. La population active représente 59% de la population totale. La part des hommes
est légèrement plus élevée dans la population active que dans la population totale. L'âge
moyen de cette population est 36 ans (l'âge médian est similaire). En ce qui concerne le
niveau d'éducation, environ 22% de la population active a terminé le collège et fréquente
le lycée ou un cycle d'études supérieures. En moyenne, le niveau d'éducation des hommes
est supérieur à celui des femmes (tableau 1.3).
Les statistiques préliminaires montrent qu'environ 4000 activités entrepreneuriales
non agricoles (non-farm business), en d'autres termes micro entreprises, sont identi�ées à
14

partir de l'enquête 2004. Ces activités sont ménées par 3500 ménages aux environs. Ainsi,
par un simple calcul, nous trouvons que les activités commerciales de taille familiale sont
très répandues au Vietnam : au moins un tiers des ménages est concerné par les activités
commerciales non agricoles.
2.3 Marché du travail
En dix ans, le nombre des travailleurs au Vietnam est passé de 37,6 millions en 2000 à
44,9 millions en 2008, soit une augmentation de 19,4%. Le secteur privé emploie 87% de
la main d'oeuvre sur le marché en 2008. Par rapport à l'an 2000, cette proportion a baissé
légèrement. L'évolution de la main d'oeuvre dans le secteur étatique suit une courbe en
cloche. Après une légère hausse de 2000 à 2003, on observe une diminution marquée à
partir de 2006. Cette évolution s'explique en partie par l'augmentation permanente de la
main d'oeuvre dans certains services publics tel que la santé, l'éducation, l'intermédiation
�nancière, l'administration publique et la défense, ainsi que les activités du Parti et des
associations. Après 2003, cette hausse ne pouvait plus compenser la forte réduction des
travailleurs dans d'autres secteurs d'activités comme agriculture, sylviculture, transfor-
mation, commerce etc. Bien qu'il ne représente que 3,37% de la main d'oeuvre totale en
2008, le secteur à participation étrangère connaît une forte croissance, avec une hausse
de 350% de l'e�ectif par rapport à l'an 2000 8.
En allant plus en détail, on trouve que la classi�cation des travailleurs, que ce soit en
fonction des secteurs d'activités ou en fonction de la propriété (ownership), est compli-
quée. L'enquête VHLSS 2004 montre que le multi-emploi (ou pluri-activité) est un phé-
nomène assez courrant chez les travailleurs. Plus de 40% des travailleurs déclarent d'avoir
deux emplois ou plus. Les statistiques dans le (tableau 1.4). est représentatif au niveau
du pays. Le secteur agricole demeure le secteur qui absorbe le plus de main d'oeuvre,
que ce soit pour le premier ou le deuxième emploi. Pour les personnes qui sont salariées
dans leur premier emploi, les activités agricoles constituent une deuxième activité qui
8. Source : GSO ; http ://www.gso.gov.vn
15

améliore signi�cativement le revenu. Près de 9% des travailleurs qui sont salariés dans
leur premier emploi déclarent avoir un deuxième emploi dans le secteur de l'agriculture.
Dans le couple inverse "salarié-paysan", les paysans qui sont salariés dans leur deuxième
emploi représentent 8,5 % de la population active. Les personnes qui ont un emploi dans
Tableau. 1.4 � Distribution des travailleurs (Valeur en %)2ème emploi
1er emploi Salarié Paysan Travailleur Ind. TotalSalarié 17.24 1.25 8.95 1.16 28.61Paysan 29.46 8.56 10.93 4.88 53.84Travailleur Ind. 10.39 0.77 5.65 0.75 17.55Total 57.09 10.58 25.54 6.78 100.00
Travailleur Ind. : Travailleur indépendant
Source : Calculs de l'auteur à partir de VHLSS2004
le secteur agricole et un autre dans le secteur du travail indépendant représentent plus
de 10 % de la population active : 4,88% pour celles qui sont paysans en premier emploi
et 5,65 % pour celles qui sont travailleurs indépendants en premier emploi.
Pour les personnes qui n'ont qu'un seul emploi, les salariés et les travailleurs indé-
pendants non agricoles représentent respectivement 17,2% et 10,4% de la population
active. Les salariés et les travailleurs indépendants sont les moins nombreux à disposer
d'un deuxième emploi dans le secteur correspondant. La part des "salarié - travailleur
indépendant" occupe une part très modeste dans la main d'oeuvre, moins de 2 %.
Les travailleurs indépendants
Le tableau 1.5 nous permet de comparer les caractéristiques démographiques selon
les catégories de travailleurs. Seules, les personnes appartenant uniquement à une caté-
gorie de travailleurs sont retenues pour cette comparaison. L'échantillon est ainsi réduit
à 16791 sur un total de 23775 observations. Le nombre des travailleurs indépendants,
salariés et paysan est de 2697, 4514 et 9580 personnes respectivement, soit 16%, 27% et
57%. A première vue, on trouve facilement que le pro�l des travailleurs n'est pas similaire.
Les femmes dominent le secteur du travail indépendant. Elles s'occupent 59,5% des tra-
vailleurs indépendants. La part des femmes dans le secteur agricole est aussi supérieure
16

Tableau. 1.5 � Caractéristiques des travailleurs appartenant à un seul catégorie detravailleurs
Catégorie de travailleurs % du catégorie Age-moyen EducationTravailleur Ind. Homme 40.5 40.38 2.2*
Femme 59.5 40.46 1.9*Salarié Homme 59 33* 2.3*
Femme 41 31* 2.2*Paysan Homme 45 33.26* 1.8*
Femme 55 31.62* 1.6*N.B. : les travailleurs appartenant à plusieurs catégories de travailleurs se sont pas
comptés dans les calculs.
Travailleur Ind. : Travailleur indépendant
* : indique que les moyennes des hommes et des femmes sont statistiquement di�érentes.
Niveau d'éducation : 1 : école élémentaire ; 2 : collège ; 3 : lycée ; 4 :école supérieure
Source : Calculs de l'auteur à partir de VHLSS 2004
(55%), mais la di�érence est moins importante. Les hommes dominent le secteur salarial.
Leur part est de 59% . Les travailleurs indépendants semblent plus âgés que les autres.
Ceci s'explique par le fait que les travailleurs indépendants restent plus longtemps au tra-
vail tandis que les salariés, étant donné les réglementations, doivent arrêter de travailler
à un certain âge. De plus, les personnes plus âgées rencontrent plus de concurrence de la
part des jeunes quand elles recherchent un emploi salarial. Les statistiques nous montrent
également que les paysans arrêtent de travailler plus tôt. Leur âge moyen est de 33 et
33,5 ans respectivement pour les hommes et les femmes. Finalement, en ce qui concerne le
niveau d'éducation, celui des travailleurs indépendants est supérieur à celui des paysans,
et on trouve que pour les trois catégories de travailleurs, le niveau d'études des hommes
est plus élevé que celui des femmes.
En bref, le travail indépendant devient une source importante de la création d'emploi.
Avec plus de 20 % de la population active travaillant dans le secteur de travail indé-
pendant, que ce soit dans le premier ou le second emploi, ce secteur mérite une bonne
position dans les politiques de développement de l'Etat.
17

2.4 Les micro entreprises
Avec la réforme économique, le secteur des entreprises non étatiques connaît une forte
croissance en ce qui concerne le nombre des entreprises, le nombre d'emplois créés ou le
chi�re d'a�aire. Le tableau 1.6 montre l'évolution de la distribution des employés selon
les types d'entreprises. Les résultats sont tirés d'une enquête d'entreprises menée par le
GSO.
Tableau. 1.6 � Distribution des travailleurs2000 2004 2007
Total en millions de personne 3,5 5,8 7,5
Entreprises etatiques 59 40 24Entreprises non-étatiques 29 43 53Collective 5.15 2.74 2.02Privée 6.68 7.48 6.95Coopérative 0.00 0.01 0.01SARL 14.61 24.15 26.28SA avec participation étatique 1.75 3.19 5.89SA sans participation étatique 1.23 5.33 12.13Entreprises à participation étrangère 12 18 22Total en pourcentage 100.00 100.00 100.00
Source : GSO
Depuis l'an 2000, la part des employés recrutés par les entreprises non étatiques aug-
mente de 29,4% à 53,2 % en 2007. Le secteur non-étatique est ainsi devenu le secteur
qui crée le plus de travail salarié. Dans ce secteur, les entreprises à responsabilité limi-
tée (SARL) embauchent le plus de personnel, plus de 26% de l'emploi du secteur des
entreprises. La croissance la plus importante appartient aux sociétés par action sans par-
ticipation de l'Etat. Sa part dans l'e�ectif total des employés monte de 1,23% à 12% en
sept ans, de 2000 à 2007. Cette augmentation s'explique d'une part par la privatisation
des entreprises étatiques, d'autre part par la croissance des entreprises non étatiques elles
mêmes.
En ce qui concerne le nombre des entreprises, les SARL et les entreprises privées re-
présentent plus de 75% du total des entreprises, soit plus de cent mille entreprises en
18

2006. Pourtant, il faut noter que les statistiques ci-dessous ne concernent que le secteur
formel. Les entreprises individuelles, autrement dit les entreprises familiales, ne sont pas
comptées dans les entreprises ci-dessous. Dans les recherches récentes, on trouve que les
activités économiques familiales constituent également une source importante d'emploi,
surtout dans le cas les travailleurs indépendants. L'enquête sur les entreprises familiales
non agricoles (ci-après appelées micro entreprises) (tableau 1.7), menée indépendamment
de l'enquête d'entreprises, montre que entreprises individuelles jouent un rôle très im-
portant dans la création d'emplois. Près de 5,6 millions de personnes travaillent dans
les entreprises familiales en 2005, contre 5,6 millions dans les entreprises non familiales
(y compris les entreprises non étatiques et les entreprises à participation étrangère). Le
tableau (1.7) présente brièvement la taille et la distribution des micro entreprises selon
le secteur d'activité. Les entreprises familiales sont en général très petites. Il s'agit sou-
vent de travailleurs indépendants. La taille moyenne est de 1,8 personnes par entreprise
y compris le chef d'entreprise. Les entreprises se concentrent sur le secteur des services
et du commerce (75%), et en particulier du commerce avec 44% des entreprises et 35%
de la main d'oeuvre.
Tableau. 1.7 � Distribution des entreprises familiales2002 2003 2004 2005
Unité : 1000
Nombre d'entreprises 2619 2712 2914 3053Nombre de personnes engagées 4437 4843 4988 5584Secteur d'activité Industrie et constructionNombre d'entreprises 757 788 760 767Nombre de personnes engagées 1699 1987 1843 1956Secteur d'activité Commerce, servicesNombre d'entreprises 1863 1925 2154 2286Nombre de personnes engagées 2738 2855 3145 3628
Source : GSO
Les femmes représentent jusqu'à 44,5% de la main d'oeuvre des entreprises familiales
et le taux de participation varie en fonction des activités économiques. Il est plus impor-
tant dans les secteurs " traditionnellement " réservés aux femmes, à savoir le commerce,
la restauration, l'hôtellerie. Le taux de participation global des femmes n'est pas très
19

di�érent entre les deux groupes d'entreprises familiales et non familiales (44,5% contre
43%). Pourtant, en fonction des secteurs, il y a des di�érences remarquables (tableau
1.8). La participation des femmes des entreprises familiales est plus élevée que celle des
entreprises non familiales dans certains secteurs : commerce, services de réparation de
moto, hôtellerie et restauration, formation et éducation. Une petite remarque mérite d'en
parler ici, la participation des femmes est calculée pour l'ensemble des activités commer-
ciales et pour les services de réparation des motos. On peut en déduire donc que ce taux
élevé est dû principalement à la participation des femmes au commerce. La participation
est plus faible dans les industries de transformation, la fourniture de l'électricité, du gaz
et de l'eau, le transport et la communication etc.
Tableau. 1.8 � Taux de participation des femmes dans les entreprises en 2005Micro enterprise Enterprise
Total 44.5 43.0Exploitation minière 22.3 22.5Transformation 35.1 58.4Alimentation en électricité, gaz et eau 10.8 18.0Construction 34.2 13.2Commerce, services de réparation des motos... 46.8 38.8Hôtellerie and Restauration 68.7 52.6Transport et communication 14.1 24.5Intermédiation �nancière 52.1 52.4Consultance et services immobiliers 44.6 25.6Formation et éducation 74.4 51.0Santé et a�aires sociaux 39.0 60.5Culture et activités sportives 53.9 43.8Services publics ou privés 52.5 49.7
Source : GSO
Etant donné la taille très petite, le revenu souvent faible et/ou l'absence de lieu de
travail �xe, une partie de ces entreprises familiales ne sont pas enregistrées auprès des
autorités concernées (ou n'ont pas à l'être). Selon l'enquête sur les entreprises familiales
menée par le GSO, globalement, environ 38% des micro entreprises sont enregistrées
(tableau 1.9). Le taux d'enregistrement des entreprises varie fortement en fonction des
activités. En utilisant l'enquête ménages VHLSS 2004, nous trouvons un taux d'enregis-
20
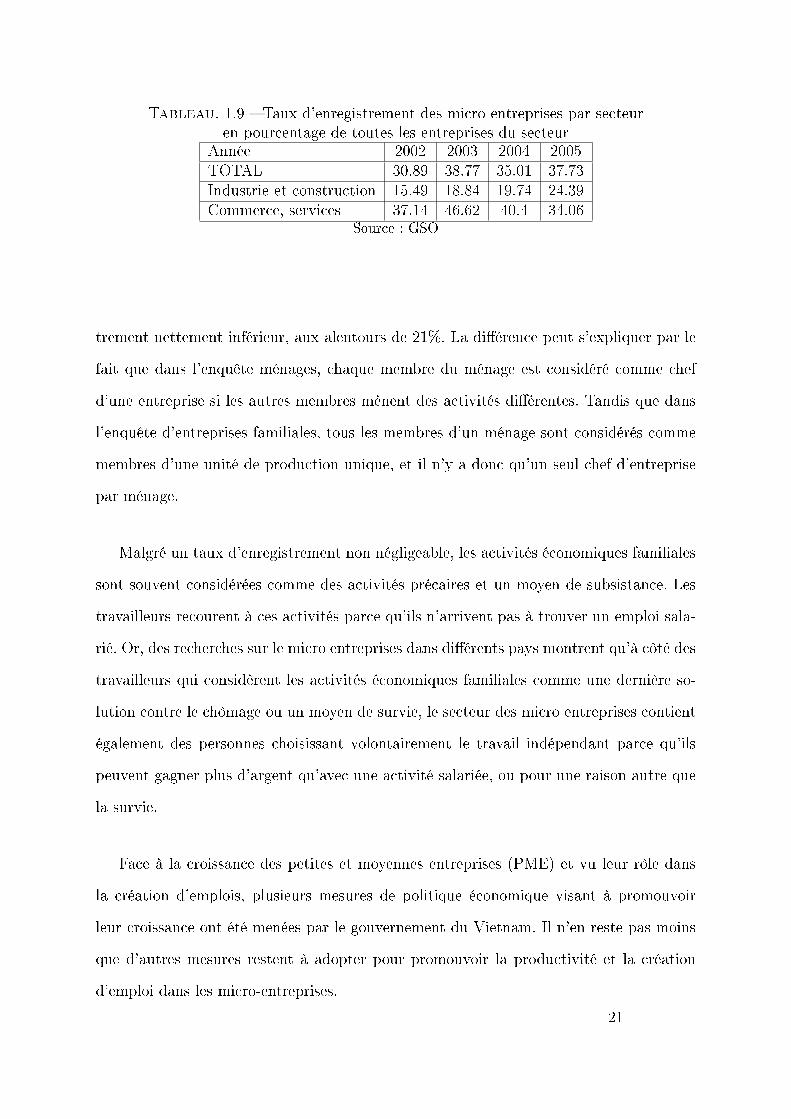
Tableau. 1.9 � Taux d'enregistrement des micro entreprises par secteuren pourcentage de toutes les entreprises du secteur
Année 2002 2003 2004 2005TOTAL 30.89 38.77 35.01 37.73Industrie et construction 15.49 18.84 19.74 24.39Commerce, services 37.14 46.62 40.4 34.06
Source : GSO
trement nettement inférieur, aux alentours de 21%. La di�érence peut s'expliquer par le
fait que dans l'enquête ménages, chaque membre du ménage est considéré comme chef
d'une entreprise si les autres membres mènent des activités di�érentes. Tandis que dans
l'enquête d'entreprises familiales, tous les membres d'un ménage sont considérés comme
membres d'une unité de production unique, et il n'y a donc qu'un seul chef d'entreprise
par ménage.
Malgré un taux d'enregistrement non négligeable, les activités économiques familiales
sont souvent considérées comme des activités précaires et un moyen de subsistance. Les
travailleurs recourent à ces activités parce qu'ils n'arrivent pas à trouver un emploi sala-
rié. Or, des recherches sur le micro entreprises dans di�érents pays montrent qu'à côté des
travailleurs qui considèrent les activités économiques familiales comme une dernière so-
lution contre le chômage ou un moyen de survie, le secteur des micro entreprises contient
également des personnes choisissant volontairement le travail indépendant parce qu'ils
peuvent gagner plus d'argent qu'avec une activité salariée, ou pour une raison autre que
la survie.
Face à la croissance des petites et moyennes entreprises (PME) et vu leur rôle dans
la création d'emplois, plusieurs mesures de politique économique visant à promouvoir
leur croissance ont été menées par le gouvernement du Vietnam. Il n'en reste pas moins
que d'autres mesures restent à adopter pour promouvoir la productivité et la création
d'emploi dans les micro-entreprises.
21

3 Brève présentation des chapitres de la thèse
3.1 Les déterminants du travail indépendant
Dans le chapitre 2 de la thèse, nous présentons une application empirique du modèle
d'o�re de travail indépendant au Vietnam. Nous recourons à la méthode de Heckman
pour estimer l'impact des facteurs sur le choix d'occupation des travailleurs.
Dans l'ouvrage �Entrepreneurship and Economic growth� 9, Audretsch et al. ont révélé
le retour de l'entrepreunariat dans l'évolution de l'économie mondiale. Par l'expression
�Small has become beautiful again�, ils stipulent que suite une long période où ll'entre-
preneuriat est tombé dans l'oubli après la Seconde Guerre Mondiale, depuis quelques
dernières décennies, l'idée que l'entrepreneuriat et des petites entreprises joue un rôle
comme moteur du développement socio-économique se répand à travers le monde entier.
Leurs travaux portent principalement sur la relation entre l'entrepreneuriat et la crois-
sance économique dans les pays développés mais on peut en retirer de nombreuses idées
sur cette relation pour le cas des pays envoie de développement.
De nombreuses questions se posent autour de la relation fondamentaile entre l' en-
trepreneuriat et la croissance économique. En particulier, il y a la question de ce qui
détermine �l'o�re d'entrepreneuriat� ou en d'autres termes l'o�re de travail indépendant .
L'étude de l'o�re de travail indépendant ou d'entrepreneur - dans le cadre de cette thèse,
ces deux termes seront utilisés de façon équivalente- remonte jusqu'aux décisions indi-
viduelles d'entreprendre. Celles-ci peuvent apparaître comme le résultat d'un arbitrage
entre di�érentes occupations professionnelles (être entrepreneur ou salarié), arbitrage qui
est fait en fonction des rémunérations relatives attendues et des caractéristiques spéci-
�ques à chaque agent.
Les déterminants et leur e�et attendu
Education
9. Audretsch et al., (2006)
22

Le rôle de l'éducation dans la décision des travailleurs est analysé dans la plupart des
recherches portant sur le sujet (Rees et Shah, 1986 ; Gill, 1988 ; Evans et Jovanovic, 1989 ;
De Wit, 1993 , Bernhardt 1994 ), Kolev (1998). Selon Le (1999), l'éducation a�ecte la
décision d'entreprendre via plusieurs canaux de transmission. D'une part, elle pourrait
renforcer la capacité de management de l'individu et favoriser l'entrée dans le secteur du
travail indépendant. D'autre part, une éducation de niveau élevé est susceptible d'encou-
rager les gens à chercher un emploi salarié quali�é et baisser la probabilité d'entreprendre.
Les résultats empiriques semblent être aussi divergents que les arguments théoriques. Cer-
tains travaux con�rment une relation positive entre le niveau d'éducation et le choix de
l'entreprise (Rees et Shah, 1986 ; Borjas et Bronars, 1989 et Evans et Leighton, 1989),
tandis que d'autres montrent une direction opposée (Evans et Jovanovic, 1989 ; De Wit,
1993 ; Kidd, 1993 ; Destré et Henrard, 2004). Cette non convergence pourrait être résultat
de la méthode d'échantillonnage ou de la spéci�cation du modèle d'estimation.
Expérience
Parallèlement à l'éducation académique, la capacité de management pourrait être
acquise par l'expérience. Sur le plan empirique, l'impact de l'expérience sur la déci-
sion de l'individu semble être plus important que celui du niveau d'éducation. De plus,
les travailleurs acquièrent au cours des années non seulement les connaissances et les
savoir-faire mais aussi le capital nécessaire pour créer leur entreprise. L'étude de Rees
et Shah (1986) montre l'impact positif de l'expérience sur la probabilité de devenir
travailleur indépendant. Cependant, en introduisant la variable mesurant la capacité �-
nancière de l'individu dans le modèle, l'impact devient non signi�catif. Ceci implique que
l'expérience devrait être considérée comme une variable mesurant le capital �nancier plus
tôt comme une variable mesurant le capital humain.
Conditions familiales
Tandis que les économistes mettent l'accent sur l'impact des variables �traditionnelles�,
les psychologues et dans une certaine mesure, les sociologues proposent d'inclure l'e�et de
variables qui relèvent des caractéristiques internes et des conditions familiales de l'individu
23

dans choix d'occupation (Fairlie et Robb, 2004). Le statut marital et le nombre des enfants
à charge sont les premiers facteurs à prendre en compte. Rees et Shah (1986) trouvent
que les gens mariés sont mieux préparés pour prendre des risques et la famille pourrait
moralement soutenir les travailleurs indépendants. Le travail du conjoint joue également
un rôle important dans le sens où une personne est plus prête à prendre le risque d'obtenir
une marge de revenu plus importante si son conjoint a un travail (De Wit, 1993).
Perception du risque
Toujours dans De Wit (1993), le rôle de la perception du risque est bien analysé
dans le cadre d'un modèle théorique. Il s'agit d'un facteur important qui a�ecte le choix
du travailleur. Les recherches empiriques de Cramer et al. (2002) et Kan et Tsai (2006)
montrent qu'un individu ayant un niveau d'aversion au risque moins élevé a plus de
probabilité d'être entrepreneur. Toutefois, il faut bien noter que les études empiriques sur
ce déterminant sont assez limitées du fait du manque des données.
Capital initial
Le rôle du capital initial dans la création de l'entreprise attire une attention parti-
culière chez les économistes. Nombre d'études 10 montrent que la contrainte �nancière
exerce un impact important sur la perspective d'être entrepreneur.
Revenu relatif attendu
Le revenu relatif attendu constitue un des facteurs importants qui in�uencent l'o�re de
travail. L'hypothèse primordiale qui se cache derrière cette déclaration est que l'individu
est considéré comme connaissant sa capacité et est rationnel. Ainsi, il choisirait le travail
qui lui rendrait le plus d'utilité. Par conséquence, l'écart de revenu entre deux occupations
qu'un individu pourrait choisir - le travail indépendant versus le travail salarié- va avoir
une corrélation positive avec la probabilité d'entreprendre 11.
10. A savoir Evans et Jovanovic (1989) ; Kidd (1993) ; Bernhardt (1994) ; Blanch�ower et Os-wald (1998) et Constant et Zimmermann (2006)11. Voir Bernhardt (1994) ; Johansson (2000) ; Constant et Zimmermann (2006) pour les résultats
empiriques concernés
24

Méthodologie et résultats obtenus pour le Vietnam
Méthodologie
Dans ce chapitre, nous menons une analyse empirique sur les déterminants de l'o�re de
travail indépendant inspirée des recherches citées ci-dessus. Nos données sont extraites de
l'enquête VHLSS2004. Cette question a été mentionné partiellement dans les recherches de
Vijverberg et Haughton (2002). Pourtant ils se sont concentrés sur la survie des entreprises
et non sur le choix des statuts. Dans le cadre de notre étude, nous proposons une analyse
structurelle sur le choix de travailleur en utilisant la méthode de Heckman en deux étapes.
Nous estimons le revenu attendu du travailleur pour les deux occupations en corrigeant le
biais de sélection. Il s'agit du biais dans les résultats des estimations du à la participation
non aléatoire des travailleurs au secteur préféré. L'écart de revenu attendu est ensuite
calculé et introduit dans l'équation de participation comme une variable expliquée.
Résultats obtenus
A�n d'obtenir l'écart du revenu attendu des travailleurs dans les deux secteurs, nous
estimons l'équation de revenu attendu selon de modèle de Mincer. Les résultats montrent
que l'e�et de l'âge sur le revenu correspond au modèle de Mincer. La relation entre le
revenu et l'expérience n'est pas linéaire. L'e�et du niveau de l'éducation sur le revenu est
positif et signi�catif. Les données empiriques indiquent également que le statut marital
porte un impact positif sur le revenu des hommes. Par contre, le coe�cient n'est pas
signi�catif chez les femmes. L'emplacement géographique et les branches économiques
a�ectent signi�cativement le niveau de revenu des hommes. Les hommes dans les grandes
agglomérations gagnent plus. Le niveau de revenu est plus important pour certaines
branches économiques. Cependant, le revenu des femmes ne varie pas selon les branches
économiques.
A partir de l'estimation de revenu des deux secteurs, secteur de travail indépendant
et de travail salarié, nous trouvons que le revenu estimé des salariés hommes dans les
deux secteurs est plus élevé que celui des travailleurs indépendants. Ceci implique que les
salariés ont un avantage en ce qui concerne le revenu dans tous les deux secteurs, que ce
25

soit dans quel secteur, les salariés gagnent plus que les travailleurs indépendants. Nous
faisons une simple décomposition de l'écart de revenu chez les salariés et travailleurs indé-
pendants selon la méthode de Blinder (1973) et de Oaxaca (1973). Le résultat montre que
l'écart de revenu des travailleurs dans les deux secteurs est expliqué par des déterminants
inobservables dans le modèle.
Après avoir calculé l'écart des revenus attendus dans les deux secteurs, nous l'intro-
duisons dans l'équation de participation comme une variable explicative. L'écart positif
signi�e que le revenu estimé du travail indépendant d'un individu est plus important que
son revenu estimé du travail salarié. L'impact positif de l'écart de revenu sur la proba-
bilité d'entreprendre implique que la di�érence de revenu est une motivation du choix
d'occupation.
Les résultats montrent que l'e�et des variables varie selon le sexe des travailleurs.
L'écart de revenu attendu a�ecte positivement le choix des hommes. Tandis que chez les
femmes, les gains monétaires semblent ne pas être l'objectif primordial. L'e�et signi�catif
des facteurs �nanciers chez les hommes devient non signi�catif chez les femmes. Nous
trouvons que l'e�et de l'expérience est positif et fortement signi�catif pour l'homme et la
femme même si le facteur capital est inclus dans le modèle. Ceci explique dans une certaine
mesure que l'accumulation du capital humain constitue un déterminant important du
choix du travailleur. Le niveau d'éducation exerce un impact négatif sur le choix des
travailleurs mais signi�catif seulement pour les hommes. Nos résultats sont conformes
aux conclusions de Le (1999), l'impact du niveau d'éducation sur le choix devient négatif
quand le statut d'occupation est introduit dans le modèle.
Le coe�cient de certaines proxy du statut d'occupation est positif et signi�catif. Ceci
implique que la probabilité de créer une petite entreprise est plus élevée dans certains
secteurs d'activité à savoir : commerce, restaurent, transport.
26

Tableau. 1.10 � Résultat récapitulatif du chapitre 2E�et marginal des caractéristiques des travailleurs sur la probabilité de choisir le
travail indépendant au lieu de travail salarié.Caractéristiques des travailleurs Homme FemmeEcart du revenu potentiel + -Age + +Niveau d'éducation - NonFormation professionnelle - -Enfant à charge Non +Propriétaire immobilier + NonAutres revenus - NonRégion économique (Plusieurs variables dichotomiques) Oui OuiSecteur d'activités (plusieurs variables dichotomiques) Oui Oui
3.2 Les facteurs qui déterminent la performance des micro en-
treprises
Suite aux analyses concernant les déterminants de l'o�re des travails indépendant,
nous pouvons maintenant nous tourner vers la croissance des entreprises. La deuxième
étude de cette thèse, le chapitre 3, est consacrée à étudier les facteurs qui in�uencent
la performance des micro et petites entreprises au Vietnam. Par le terme performance,
on peut penser à plusieurs concepts tels que l'e�cacité de la production, le rapport coût-
e�cacité, le taux de croissance du chi�re d'a�aires, du nombre de travailleurs etc. Dans
le cadre de notre étude, nous utilisons un concept qualitatif de performance qui permet
de classer les entreprises selon �l'état de croissance� de leur chi�re d'a�aires par rapport à
celui des deux années précédentes : les entreprise dont le chi�re d'a�aires est �croissant�,
�décroissant� ou �inchangé�. Il serait évidemment préférable de traiter la question avec
une mesure de performance plus quantitative mais le problème souvent rencontré dans
les pays en voie de développement - le manque des statistiques, ne permet pas de réaliser
notre ambition. Vu notre concept de performance, dans le cardre de cette thèse, sauf
autre explication complémentaire, le terme performance sera utilisé de façon équivalente
au terme croissance.
La relation entre la performance de l'entreprise et ses caractéristiques génère un grand
27

nombre de recherches théoriques et empiriques dans la littérature de l'économie et du ma-
nagement. En premier lieu, il faut rappeler de la fameuse loi de Gibrat (Gibrat, 1931)
qui stipule que la croissance est un processus aléatoire et qu'il n'y a donc pas de relation
entre la taille initiale de l'entreprise et sa croissance au cours d'une période. Si les entre-
prises ont la même probabilité de croître, l'écart absolu entre des petites et les grandes
entreprises aura tendance à se creuser. Il n'y aura pas de �convergence� entre les plus
grandes entreprises et les plus petites. De nombreuses analyses empiriques ont cherché
à con�rmer ou in�rmer cette loi de Gibrat (pour une synthèse, cf. Sutton, 1997). Les
résultats empiriques montrent que la cette loi ne peut être appliquée telle quelle mais
il faut ajouter plusieurs conditions et qu'une tendance de �rattrapage� des grandes par
les plus petites entreprises de di�érents secteurs d'industrie est observée dans plusieurs
études (Lotti et al., 2003).
Les déterminants de la performance de l'entreprise
Taille de l'entreprise
Sur le plan théorique, l'impact de la taille de l'entreprise sur sa performance se pro-
page via des voies di�érentes. Les grandes entreprises peuvent diversi�er leurs capacités
pour exploiter l'économie d'envergure. Ceci permet aux grandes entreprises de générer
plus d'e�cacité et donc plus de performance que les petites (Audretsch, 2006). Néan-
moins, les petites entreprises sont plus �exibles en ce qui concerne à la fois la localisation
géographique et la capacité à s'adapter aux changements de l'environnement économique.
Les études empiriques sur un échantillon d'entreprises survivantes pendant la période ob-
servée aux Etats Unis par Evans (1987a, b) et Audretsch (1995), montrent que la taille
de l'entreprise est négativement corrélée à leur taux de croissance pour les petites et
moyennes entreprises (PME). Sur un échantillon des entreprises fabriquant des ordina-
teurs en Inde, Das (1995) trouve un résultat similaire. Toutefois, une corrélation positive
apparait dans certaines études rapportées par Hesmati (2001). Dans une des rares re-
cherches sur la croissance des PME au Vietnam, Hansen et al. (2004) trouvent que la
28

taille est négativement corrélée au taux de croissance de l'entreprise.
Age de l'entreprise
En ce qui concerne l'âge de l'entreprise, il est largement accepté que les �old �rms�
possèdent plus d'expériences et sont donc plus performantes que les jeunes entreprises. De
l'autre côté, elles sont moins �exibles que les jeunes face aux changements sur le marché.
Par conséquent, il est fortement conseillé de ne pas évaluer la relation entre l'âge de l'en-
treprise et sa performance en référant exclusivement aux arguments théoriques. En e�et,
les recherches empiriques con�rment cette suggestion. Jovanovic (1982), Evans (1987a,
b), Ericson et Pakes (1995) montrent que la relation en question est négative. Tandis que
Das (1995) trouve le résultat opposé. Selon Hesmati (2001), cette relation est sensible au
concept de performance. En contrôlant par le taux de croissance des employés, il trouve
que l'âge de l'entreprise a un e�et négatif sur la performance. En revanche, en utilisant
le taux de croissance du chi�re d'a�aires ou de l'actif, cet e�et devient positif. Sur un
échantillon d'entreprises indiennens, Majumdar (1997) trouve que l'âge de l'entreprise
a�ecte négativement sa rentabilité mais positivement sa productivité. Dans l'étude de
Hansen et al. (2004) sur les PME au Vietnam, l'âge semble être sans rapport avec la
performance de l'entreprise.
L'ambiguïté dans les résultats, selon Majumdar (1997) peut être causée par l'omission
des caractéristiques institutionnelles dans les recherches. Pour cette raison, il est impor-
tant d'incorporer d'autres facteurs dans l'analyse des déterminants de la performance de
l'entreprises.
Statut juridique
Le statut juridique de l'entreprise semble jouer un rôle important sur la performance
de l'entreprise. Chaque forme juridique dispose d�atouts certains, mais également de
contraintes non négligeables. Le choix du statut juridique de l'entrepreneur re�ète l'éva-
luation de risque encouru par le porteur du projet, le mode de transfert et de �nancement
de son entreprise (Harho� (1998). Chaque statut juridique correspond à un coût di�é-
rent et le choix du statut est considéré comme un problème de minimisation de coût.
29

L'impact empirique du statut juridique de l'entreprise sur sa performance semble assez
ambigu. Dans une étude sur un échantillon de 10000 entreprises allemandes dans 4 sec-
teurs : construction, transformation, commerce et services, Harho� (1998)trouve que les
entreprises à responsabilité limitée (limited liability enteprises) ont une meilleure perfor-
mance par rapport les autres. Néanmoins, sur un échantillon d'entreprises dans le secteur
des services, Nguyen (2004) montre que le statut juridique est sans rapport avec la per-
formance de l'entreprise. Pour le cas des pays en voie de développement, là où l'économie
informelle est un phénomène assez courant, l'impact du statut informel de l'entreprise est
évidemment crucial pour les chercheurs et les autorités. Le statut informel s'accompagne
de certains obstacles 12, à savoir manque de capital humain, utilisation de technologies
obsolètes, accès limité au crédit et aux supports de l'Etat etc., nuisant à la croissance et
la performance de l'entreprise.
Accès au �nancement
L'accès au �nancement est souvent considéré comme un facteur crucial de la crois-
sance des entreprises. Pourtant, l'étude de Brown et al. (2004) montre que le rôle de
l'accès au crédit devrait être révisé pour le cas des pays en transition. Il montre que le
niveau du développement de l'environnement institutionnel pourrait exercer plus d'e�et
sur la croissance des entreprises que l'accès au crédit. De ce fait, il est important d'éva-
luer empiriquement le rôle de l'accès aux ressources �nancières. Des résultats sur 5 pays
en transition similaires à ceux de Brown sont reportés dans les études de Johnson et
al. (2000). Cependant, des conclusions opposées sont trouvées dans l'étude de Pissarides
et al. (2003). Cette diversité dans la littérature semble être conforme à la déclaration de
Majumdar cité ci-dessus.
Caractéristiques de l'entrepreneur
A côté des caractéristiques de l'entreprise, celles de l'entrepreneur jouent aussi un rôle
important dans la performance de l'entreprise, surtout des PME. Selon Parker (2004) ,
12. Voir Morrisson (1995), Arimah (2001), and Klein (2003), Yu (2002), Ishengoma (2005), Loayza(1997), Levenson and Maloney (1998) and Jackle and Li (2003) pour plus de détails sur les obstacles dusecteur informel.
30

l'attitude et les capacités de l'entrepreneur se re�ètent dans les choix stratégiques et dans
la manière dont il gère son entreprise. Intuitivement, un niveau d'études élevé devrait
avoir un e�et positif sur la croissance de l'entreprise. Les résultats empiriques ne nous
donnent pas une réponse précise à ce sujet. Burki et Terrel (1998) trouvent que l'entreprise
dont le propriétaire a un niveau d'éducation plus élevé est plus e�cace. De l'autre côté,
les résultats de Brown et al. (2004) sur les petites entreprises en Roumanie, montrent
que l'e�et du niveau d'éducation sur la croissance est très faible. Pour le cas des pays
en voie de développement, Nichter et Goldmark (2008) indiquent que si on tient compte
du niveau d'éducation moyen du pays, le niveau d'éducation de l'entrepreneur exerce un
e�et positif sur la croissance de l'entreprise.
En général, les femmes chefs d'entreprises sont souvent considérées comme ayant moins
d'opportunités d'accumuler de l'expérience, comme ayant un réseau de contacts profes-
sionnels moins étendu et comme ayant plus de di�culté dans la mobilisation des res-
sources. De plus, les femmes s'orientent plus vers leur famille et sont moins ambitieuses
en ce qui concerne l'agrandissement de leur entreprise. Etant donné ces arguments théo-
riques, ces caractéristiques des femmes ont sans doute un impact négatif sur la croissance
de l'entreprise. En e�et, les données empiriques montrent que le fait d'être une femme
génère un e�et négatif sur la performance, sans que toutefois cela mette en cause la survie
de leur petite entreprise (Cooper et al., 1994).
Localisation et secteur d'industrie
Des facteurs contribuant également à la performance de l'entreprise, tels que la lo-
calisation et le secteur d'industrie, sont souvent introduits dans les modèles empiriques
sur le développement de l'entreprise. Les recherches précédentes montrent que la per-
formance de l'entreprise varie considérablement selon les secteurs. Le taux de croissance
dans les secteurs qui se caractérisent par un niveau élevé d'économies d'échelle est plus
important que celui des autres secteurs (Audretsch, 1995). Le rôle de l'emplacement de
l'entreprise est particulièrement abordé dans l'étude de Liedholm (2002), il indique que
les entreprises situées dans les zones urbaines ont une probabilité de survie plus élevée.
31

Dans celle de Najib (2005), les entreprises dans les gros centres urbains connaissent un
taux de croissance plus important.
Les études présentées montrent que l'impact de di�érents facteurs sur la croissance
de l'entreprise ne devrait pas être étudié en se référant exclusivement à l'exeprérience des
pays développés. Tenant compte des di�érences dans l'environnement institutionnel entre
les pays, des di�érences dans la nature des industries etc. la croissance des entreprises
subira un niveau d'impact di�érent d'un même facteur. Par conséquent, notre étude
empirique vise à étudier l'impact des facteurs souvent abordés dans la littérature sur la
performance des micro et petites entreprises au Vietnam. Notons qu'il est plus facile de
trouver une recherche portant sur les déterminants de la croissance de l'entreprise des
pays développés. Tandis que la nature et le parcours des entreprises dans pays en voie
de développement pourrait être di�érent. Dans pays développés, les petites entreprises
jouent souvent un rôle important dans l'introduction de nouveaux produits, de nouvelles
technologies au marché en créant des innovations. Par contre, dans les pays en voie de
développement, les petites entreprises sont considérés dans la plus part de cas comme un
moyen de survie, un moyen d'échapper le chômage. Vue la di�érent dans le motif d'entrée
dans le secteur de travail indépendant, l'e�et de l'âge, du niveau d'éducation et plusieurs
autres variables sur la croissance, la performance ou la survie de micro entreprises dans
les pays en voie de développement pourrait être di�érent par rapport à celui dans les pays
développés. Ainsi, nos travaux constituent un plus dans la littérature des entreprises aux
pays en voie de développement.
Méthodologie et résultats
Les entreprises dans notre étude sont tirées de l'enquête VHLSS 2004 et sont les micro
et petites entreprises de di�érents secteurs d'activité. Ces entreprises contribuent d'ores
et déjà à une part importante des emplois sur le marché de travail. Avec leur croissance
dynamique, elles constituent également une force non négligeable dans la croissance de
32

l'économie du Vietnam au cours des dernières années.
Méthodologie
Nous utilisons le modèle de logit multinomial dans lequel les facteurs susceptibles
d'avoir un e�et sur la performance sont introduits comme variables explicatives. Notre
indicateur est construit comme la variation du chi�re d'a�aires de l'entreprise par rapport
au résultat obtenu 2 ans avant. Nous distinguons ainsi 3 modalités d'évolution : croissant
(49%), décroissant (15%) et inchangé (36%). Ces trois modalités constituent la variable
de performance à expliquer. Conformément à la nature du modèle de logit multinomial,
une des 3 modalités de croissance de l'entreprise sera utilisée comme modalité de base
et les autres sont comparées avec cette base. Nous choisissons la modalité �inchangé� du
chi�re d'a�aires de l'entreprise comme base. En conséquence, deux séries d'estimation sont
faites pour le couple �croissant-inchangé� et �décroissant-inchangé�. De ce fait, le signe
positif d'un coe�cient d'une variable explicative dans l'estimation du couple � croissant-
inchangé� exprime l'impact positif de la variable correspondant sur la probabilité d'être
en situation de croissance. Pour le couple �décroissant -inchangé�, le signe positif d'une
variable explicative représente l'impact négatif de la variable concernée sur la situation
de croissance de l'entreprise. Ce qui veut dire que l'impact de la variable en question
augmente la probabilité d'être dans la pire des situation de croissance de l'entreprise - la
�décroissance�.
Résultats
Deux variables mesurant la taille de l'entreprise sont utilisées : le revenu en log
(Income) et le nombre de travailleurs réguliers de l'entreprise (Size). Les résultats obtenus
montrent que la taille de l'entreprise mesurée par son revenu génère un e�et positif sur
la performance de l'entreprise. Néanmoins, en ce qui concerne le nombre de travailleurs,
l'interprétation de l'e�et sur la situation de croissance de l'entreprise est plus compliquée.
Dans la paire �croissant - inchangé�, le coe�cient de la variable (Size) est positif et
signi�catif dans l'estimation où le niveau de revenu (Income) est omis. Le coe�cient
devient non signi�catif dans l'équation si l'on y incorpore le revenu de l'entreprise. Dans
33

la paire �décroissant - inchangé�, le coe�cient devient positif et signi�catif. Ce résultat
implique que pour ce couple �décroissant - inchangé�, le nombre de travailleurs exerce
un impact négatif sur la performance de l'entreprise. La non-convergence dans le résultat
suggère que pour les micro et petites entreprises, le nombre de travailleurs est une mesure
très sensible de la taille de l'entreprise.
Contrairement à la taille de l'entreprise, l'e�et de l'âge sur la performance de l'entre-
prise est plus stable. Les jeunes entreprises ont tendance à avoir une meilleure performance
par rapport aux entreprises vieillissantes. Le rôle de l'emplacement sur la performance de
l'entreprise ne correspond pas à celle que l'on attendait. Le fait de se situer dans les zones
urbaines et les grands centres d'économie a�ecte négativement la situation de croissance
de l'entreprise. Nous ne trouvons pas l'impact signi�catif du statut juridique sur la per-
formance de l'entreprise sur le couple �croissant - inchangé� ; pourtant le résultat obtenu
pour le couple �décroissant - inchangé� est assez étonnant : les entreprises informelles ne
sont pas celles qui correspondent à la pire situation de croissance. La probabilité d'être
dans la situation décroissante diminue quand l'entreprise est informelle. L'accès au crédit
ne joue non plus aucun e�et sur la performance de l'entreprise. Ceci con�rme l'idée de
Brown et al. (2004) que dans les pays de développement, l'accès au crédit pourrait ne pas
être un facteur primordial de la croissance de l'entreprise.
Quant aux caractéristiques de l'entrepreneur, nos résultats indiquent qu'un niveau
d'éducation plus élevé n'entraîne pas une meilleure performance. Au contraire, le fait
d'avoir un diplôme de l'enseignement supérieur provoque une augmentation de la proba-
bilité d'être dans la situation de croissance défavorable. Selon Alvarez et Crepsi (2003),
ce résultat pourrait être dû au fait que les entrepreneurs ayant un niveau d'éducation
élevé sont attirés par plusieurs activités et consacrent moins d'e�ort au management de
leur entreprise. Le fait que l'entreprise est gérée par une femme semble ne pas constituer
un handicap. En e�et, les résultats montrent que la probabilité de se trouver dans la si-
tuation décroissante diminue quand l'entreprise est gérée par une femme. Pour le groupe
� croissant - inchangé�, aucune di�érence entre la performance des entreprises gérées par
34

un homme ou par une femme n'est révélée.
Tableau. 1.11 � Résultat récapitulatif du chapitre 3E�et marginal des variales explicatives sur la probabilité d'avoir la meilleure
performance dans le couple de performance de l'entreprise étudié.Caractéristiques Croissant/inchangé* Décroissant/inchangé*Taille + +Grandes villes - -Age de l'entreprise Oui Ouicatégorie de l'entreprise Non ouiNiveau d'éducation de l'entrepreneur Oui Nonaccès au crédit Non NonZone urbaine - -Fonctionnement à temps plein Non +Homme Non -Secteur d'activités Oui OuiRégions économiques (plusieurs dummy) Oui Oui
* : les entreprises ayant le chi�re d'a�aires croissant, décroissant ou inchangé.
3.3 Hétérogénéité des micro entreprises face aux contraintes sur
leur croissance
On trouve fréquement dans les recherches empiriques sur un échantillon d'entreprises
provenant de plusieurs pays que l'e�et des facteurs sur la survie, la croissance ou la per-
formance des entreprises varie selon les pays. Cet e�et non homogène pourrait être causé
soit par le niveau de développement di�érent des pays, soit par la di�érence de compor-
tement d'entreprises di�érentes. Nos résultats sur les déterminants de la performance de
l'entreprise nous permettent de prolonger cette vision de l'hétérogénéité des entreprises
face aux contraintes sur leur croissance. Le chapitre 4 est consacré à une analyse ap-
profondie de l'impact des caractéristiques de l'entreprise sur le degré de contrainte de
croissance auquel l'entreprise doit faire face durant l'évolution.
35

Les obstacles à la croissance
Dans la littérature de l'entrepreneuriat, les facteurs qui a�ectent la création, la crois-
sance et la performance des entreprises sont souvent divisés en trois groupes : les caracté-
ristiques des entreprises, celles des entrepreneurs et l'environnement où fonctionnent les
entrepreneurs et les entreprises.
Barièrre �nancière et règlementation
Les facteurs environnementaux ayant un e�et sur la performance de l'entreprise re-
couvrent souvent les conditions du marché �nancier et des autres marchés, le niveau de
développement de l'infrastructure et du cadre judiciaire, et l'application des règles et
des institutions (Pissarides et al., 2003). La règlementation re�ète les conditions concer-
nant la concurrence sur les marchés en termes de barrières tarifaires et non tarifaires,
la production et la commercialisation des biens au regard de la santé et de l'environ-
nement, la protection des travailleurs. Ces conditions visent à assurer des objectif peu
compatibles : le pro�t des entreprises ainsi que le bien-être des consommateurs et des
travailleurs (Adair, 2009). Par conséquent, le fardeau règlementaire excerce sans doute
des e�ets sur le développement de l'entreprises. L'e�et des contraintes �nancières sur la
croissance et la performance implique la barrière à l'accès au crédit. Les résultats em-
piriques de Rajan et Zingales (1998) à partir d'un large échantillon des pays montrent
que les entreprises ayant besoin de �nancement externe ont tendance à se développer
plus lentement dans les pays où le marché �nancier est moins développé. Des résultats
similaires sont trouvés par Pissarides et al. (2003) sur un échantillon de PME en Russie
et Bulgarie. Pourtant, dans leur étude sur cinq pays en transition, Johnson et al. (2000)
montrent que l'absence du �nancement externe n'empêche pas l'entreprise d'investir et
que l'entreprise pourrait remplacer le �nancement externe par un �nancement interne.
L'e�et moins important du �nancement externe sur la croissance de l'entreprise est éga-
lement prouvé dans les recherches de Johnson et al. (1999) et Brown et al. (2004). Brown
et al. (2004) montrent que, pour les pays en transition, certains aspects de l'environne-
ment institutionnel à savoir les droits de propriété, l'e�cacité des règlements, la mise en
36

application des contrats (contract enforcement), pourraient jouer un rôle plus important
sur la croissance des PME que l'accès au crédit.
Environnement socio-économique
A l'égard des autres facteurs concernant les contraintes de l'environnement socio-
économique, Covin et Slevin (1989) montrent que les facteurs de l'environnement externe
comme le cadre juridiques et l'application des règlements, pourraient exercer des impacts
importants sur la viabilité, la croissance et la performance de l'entreprise. Ils trouvent
également que la performance des PME est positivement liée à �l'orientation entrepre-
neuriale� (OE) de l'entrepreneur. Celle ci est démontrée par le fait que l'entrepreneur
est prête à quel point à prendre des risques lié à l'entreprise, à favoriser le changement
et l'innovations a�n d'obtenir davantage compétitivités et rivaliser plus et concurrencer
plus dynamiquement avec les autres entreprises. Elle est fortement in�uencée par l'envi-
ronnement socio-économique de l'entreprise. L'étude de Wiklund (1999) révèle aussi la
relation positive entre l'OE et la performance de l'entreprise. Il est important d'ajouter
que les travailleurs indépendants n'ont pas tous une orientation entrepreneuriale : celle ci
suppose des actions innovatrices, risquées et proactives. Par conséquent, les déterminants
de l'OE constituent une piste de recherche importante dans la littérature de l'entrepre-
neuriat. Dickson et Weaver (2008) présentent un cadre théorique pour analyser l'impact
de l'environnement institutionnel sur l'évolution de l'orientation entrepreneuriale. Ils in-
diquent que le choix de l'OE est signi�cativement motivé par le système juridique et les
forces de règlement de l'environnement institutionnel.
Développement de l'infrastructure
En général, on considère qu'il existe une relation entre le développement de l'infra-
structure et la croissance économique. Le développement de l'infrastructure est souvent
considéré comme un outil pour baisser les coûts de transport ou de production et pour
favoriser l'accès au marché. En utilisant un panel de pays de 1952 à 1990, Canning et
Pedroni (2008) montrent que le développement de l'infrastructure entraîne la croissance à
long terme et que son e�et sur la croissance varie à travers les pays. Des résultats similaires
37

sont trouvés dans une recherche empirique de Egert et al. (2009) qui mettent l'accent sur
le rôle de l'infrastructure physique, à savoir transport, électricité, télécommunication dans
la croissance économique sur un échantillon de pays de l'OCDE.
Méthodologie et résultats
A partir de la litérature sur les déterminants de la croissance et la performance des
entreprises, nous présentons dans ce chapitre une analyse empirique sur l'hétérogénéité
des micro et petites entreprises face aux barrières qui s'opposent à leur croissance. Nous
utilisons en particulier la section 10 de l'enquête VHLSS 2004 dans notre étude. Dans
cette section, on demande aux entreprises de classi�er les dix sept facteurs qui entravent
leur croissance selon un échelonnement prédé�ni, entre autres : électricité, service pos-
tal et de communication, accès au crédit, impôt, enregistrement, ressources humaines,
corruption et compétition déloyale et etc. Ces facteurs représentent plusieurs aspects me-
surant le degré de contrainte causé par l'environnement socio-économique dans lequel
l'entrepreneur et l'entreprise opèrent.
Méthodologie
Des analyses descriptives sur les réponses nous montrent que les entreprises ne s'ex-
posent pas de même manière en fonction des facteurs. Certains facteurs nuisent les ac-
tivités de l'entreprise plus que les autres. Une partie assez importante des entrepreneurs
semble ne pas s'intéresser à l'environnement dans lequel leur entreprise fonctionne. Le
nombre des entreprises qui subissent de sévères obstacles provenant de l'environnement
économique est très faible. Ces résultats nous empêchent d'utiliser directement la classi�-
cation des obstacles de la croissance sous forme de variable expliquée ordinaire ou même
nominale.
De plus, étant donné que les contraintes rencontrées par les entreprises dans l'enquête
sont mesurées par dix sept facteurs, elles s'articlent en général autour des principaux
axes à savoir infrastructure, régulation de l'Etat, conditions sociales etc. Ainsi, les fac-
teurs peuvent être regroupées pour construire un indice plus général mesurant la hauteur
38

d'un obstacle �synthétique�. De fait, nous faisons une analyse en composantes principales
(ACP) sur ces dix sept aspects et retenons �nalement 4 composantes renommées �In-
frastructure�, �Institution�, �Fin-tax-License� et Social-instability�. Au lieu de dix sept
variables, l' ACP nous permet d'avoir quatre composantes constituant quatre variables
continues. Ces variables sont introduites dans un modèle simple comme variable expli-
quée. Les variables explicatives sont les caractéristiques de l'entreprise. Ainsi, le hauteur
de l'obstacle auquel l'entreprise doit faire face est expliqué par ses caractéristiques. Cette
analyse nous permet de décrire le pro�le des entreprises qui présente plus de plaintes
sur l'environnement économique et par conséquent pourrait être utile dans le ciblage des
soutiens aux micro-entreprises. Notre approche est similaire à celles de Sleuwaegen et
Goedhuys (2002) sur une échantillon d'entreprises Ivoiriennes, de Pissarides et al.(2003)
sur une échantillon de PME en Russie et Bulgarie, de Robson et Obeng (2008) pour les
entreprises du Ghana, de Coad et Tamvada (2008) pour des entreprises en Inde et de
Moghal et Pfau (2008) sur les entreprises pakistanaises. Toutefois, comme nous l'avons
abordé au-dessus, nos données sur le hauteur des obstacles ne nous permettent pas de les
utiliser telles quelles, nous devons les transformer en variables continues par le méthode
ACP et les introduire dans les régression de MCO au lieu de faire un logit multinomial
ou un logit ordinaire comme d'autres chercheurs l'ont fait. Cette méthode n'entraîne pas
de changement dans l'interprétation du résultat.
Nous divisons les entreprises dans notre échantillon en trois groupes selon la moda-
lité de croissance de leur chi�re d'a�aires : les entreprises dont le chi�re d'a�aires est
�croissant�, �décroissant� et �inchangé�. Les analyses descriptives de la distribution des
réponses nous indiquent que le hauteur des obstacles varie selon la modalité de croissance
de l'entreprise. En moyenne, les entreprises �croissantes� expriment des plaintes plus sé-
vères à l'égard des obstacles à la croissance que les autres. Nous supposons ainsi que la
modalité de croissance de l'entreprise pourrait exercer un impact particulier sur l'évalua-
tion des obstacles à la croissance. De plus, nous voulons également mesurer la di�érence
causée dans le degré de contrainte selon les modalités de croissance. Par conséquent, les
39

régressions sont faites séparément selon les modalités de croissance de l'entreprise.
Résultats
Nos résultats sont présentés en fonction de chaque composante des obstacles à la
croissance. En ce qui concerne la première composante construite par des obstacles insti-
tutionnels, que nous dénommons �Institution� , nous trouvons que l'impact des variables
varie fortement selon les modalités de croissance de l'entreprise. La taille de l'entreprise
n'exerce aucun n'impact sur la hauteur de l'obstacle auquel l'entreprise doit faire face.
Par contre, l'âge, l'emplacement géographique et le secteur d'activité jouent un rôle im-
portant dans la variation du niveau de contrainte. Pour le groupe �inchangé�, il semble
que les entreprises plus jeunes rencontrent plus de di�cultés liées aux contraintes institu-
tionnelles. Les coe�cients dans les deux autres groupes ne sont pourtant pas signi�catifs.
Les entreprises du secteur des services déclarent un niveau d'obstacle moins important
par rapport celles du commerce et de l'industrie.
A propose des contraintes causés par l'accès au crédit, le coût de crédit, les problèmes
de taxe et de licence, que nous dénommons �Fin-tax-license� , les résultats montrent
que la taille de l'entreprise joue un rôle particulièrement important. Plus l'entreprise est
grande, plus est sévère le niveau de contrainte auquel elle doit faire face. Il faut préciser
que nos entreprises sont toujours des micro et petites entreprises. Les entreprises dont
la taille est très petite sont en fait incapables d'approcher les canaux de crédit o�ciels
et ainsi ne cherchent pas ce mode de �nancement. En conséquence, les entreprises plus
grandes, qui peuvent approcher les sources de �nancement externe, annoncent plus de
di�cultés en les demandant. Ce résultat est con�rmé par l'e�et signi�catif du statut
juridique sur le niveau d'obstacle. Les entreprises formelles se plaignent plus par rapport
aux entreprises informelles. Les entreprises jeunes dans le groupe �croissant�, annoncent
également un niveau de contrainte plus sévère. Ceci implique, dans une certaine mesure,
que les entreprises jeunes pourraient s'intéresser plus à la croissance et dont avoir besoin
de plus de �nancement externe et avoir plus de préoccupation à l'égard des problèmes de
taxe et licence. Le niveau de contrainte varie également beaucoup selon l'emplacement
40

de l'entreprise. Pour certaines zones économiques, le degré d'obstacle est plus sévère.
La troisième composante des contraintes de l'environnement socio-économique est
l'instabilité de la société, que nous appelons �Social-instability� . Nous trouvons que
les entreprises plus jeunes rencontrent moins de di�cultés concernant la criminalité, le
manque de sécurité, la concurrence déloyale. L'emplacement joue aussi un rôle important
dans la détermination de la hauteur des obstacles. Les résultats empiriques montrent
que les entreprises de la région économiquement la plus développées, rencontrent plus de
di�cultés causées par l'instabilité de la société. Ceci pourrait impliquer que le degré de
compétition dans les grandes agglomérations est plus sévère, et rend plus de di�cultés
au développement de l'entreprise. Les entreprises du secteur commercial présentent plus
de plaintes contre l'instabilité sociale par rapport à celles des deux autres secteurs.
En ce qui concerne les contraintes ressenties du fait de l'infrastructure physique (élec-
tricité, services de communication et transport) (INFRA), les résultats montrent que
l'impact de la taille de l'entreprise (mesurée par le volume du chi�re d'a�aires), sur le
niveau de contrainte à la croissance est positif et signi�catif. Les entreprises plus grandes
a�chent plus de plaintes concernant les 'infrastructure. Par rapport aux plus vieilles, les
entreprises plus jeunes manifestent plus de soucis à l'égard des infrastructures. L'empla-
cement et le secteur d'activité in�uencent également la hauteur d'obstacle évaluée par les
entreprises. L'impact du secteur d'activité sur le niveau de plainte correspond à notre at-
tente. Les entreprises utilisant plus les infrastructures dans leurs productions manifestent
plus de plaintes.
Bien que les micro entreprises fonctionnent dans des conditions de travail précaires et
génèrent une basse productivité, le taux des entreprises déclarant d'avoir des di�cultés
dans leurs activités n'est pas aussi important que celui attendu. De plus, ceux sont les
plus grandes entreprises, en ce qui concerne la taille, et les entreprises formelles qui se
plaignent plus des barrières de la croissance. Le fait que les plus grandes entreprises
sont plus ambitieuses que les plus petites pourrait être l'hypothèse qui se cache derrière
ce phénomène. Les plus grandes entreprises fonctionnent dans une échelle plus large du
41

marché et doivent utiliser plus de l'infrastructure, recourir plus souvent aux services
publics et autres services de soutient aux activités de l'entreprise. Etant plus ambitieuse,
la croissance, performance et l'élargissement deviennent l'intérêt majeur de l'entreprise
au lieu de l'existence. C'est pour cette raison, les plus grandes entreprises expriment
plus des préoccupations au sujet des di�cultés dans les activités de l'entreprise. Ces
préoccupations montrent également le fait que la création d'une micro entreprise n'est
pas seulement une solution contre le chômage pour les une mais un choix volontaire avec
des ambitions pour les autres.
Vue le rôle des micro entreprises dans la création d'emploi et d'une environnement
économique dynamique, il est nécessaire d'avoir des politiques visant à promouvoir la
croissance des micro entreprises d'une part, d'autre part, ces politiques devrait prendre
en compte de l'hétérogénéité des entreprises. Le " one size �ts all " politique ne serait
pas convenable étant donné que les di�érents catégories de micro entreprises rencontrent
di�érentes di�cultés. Les supports de l'Etat vis à vis des micro entreprises apportent
des béné�ces non seulement aux entreprises, qui pourraient avoir les conditions de travail
améliorées et plus encadrées, avoir des soutiens mieux adaptés à leurs besoins, et donc une
hausse de productivité, mais aussi à l'Etat, qui pourrait mieux protéger ses travailleurs
et augmenter sa recette �scale.
42

Tableau. 1.12 � Résultat récapitulatif du chapitre 4E�et des caractéristiques de l'entreprise sur la hauteur des contraintes .
CaratéristiqueObstacle
Institution Tax-Fin-License Social instability InfrastructureCroissance + + + +Taille Non + Non +Enregistrement Non + Non NonAccès au crédit Non Non + NonZone rurale Non Non Non NonMono-activité Non Non Non NonFonctionnement Non Non Non 6à temps pleinAge (dummy) Oui Oui Non OuiRégion économique* Oui Oui Oui OuiSecteur d'activité* Oui Non Oui OuiInchangé - - - -Taille Non + Non +Enregistrement Non + Non NonAccès au crédit Non Non Non NonZone rurale Non Non Non NonMono-activité Non Non Non +Fonctionnement Non Non - Nonà temps pleinAge * Oui Non Non NonRégion économique* Non Oui Oui OuiSecteur d'activité* Oui Oui Oui OuiDécroissance + - + -Taille Non + Non +Enregistrement Non + Non -Accès au crédit Non Non Non NonZone rurale Non Non Non +Mono-activité Non Non Non -Fonctionnement Non Non Non Nonà temps pleinAge* Non Oui Oui NonRégion économique* Oui Oui Oui NonSecteur d'activité* Oui Oui Non Oui
*Plusieurs variables dichotomiques
43

44

Chapitre 2
Occupational choice between
self-employment and salaried
employment
1 Introduction
The economic reform has seen private entrepreneurship emerge as one of the main
forces behind the rapid decline in poverty and growth acceleration in Vietnam. According
to a report carried out by World Bank in 2005, nearly every households in Vietnam
have run a non farm business of one kind or another 1. These small enterprises have
constituted an e�ective tool in combating unemployment and creating welfare. Alongside
the vast number of household businesses, the uno�cial ones in particular, there has been
a boom in the number of registered enterprises; the number of private formal enterprises
quadrupled between 1999 and 2005. Survey analysis show that many registered �rms
have been "upgraded" from household businesses while others have been registered by
people working illegally or uno�cially in the same industry for years.
In perspective, the development of small successful businesses will provide for the
1. It should be note that this estimation includes all non-farm self employment activities regardlessof how signi�cant they may be and also includes non farm activities of farm households in low season.
45

beginning of giant corporation. Many policies, aimed at encouraging the development of
private entrepreneurship, have been carried out in Vietnam in recent years. The provision
of better knowledge in this sector, has allowed policy makers to give more suitable support
in promoting the growth of private business, therefore this sector has attracted many re-
searchers. However, in spite of paying much attention to this business sector, the question
of who are the business leaders remains an under-researched area in the case of Vietnam.
The characteristics of the self-employed and the motivation behind self-employment have
been widely mentioned in economic literature. Nevertheless, most of these studies have
been carried out on the self-employed population of industrialized countries, whilst in the
case of developing countries it may need to be interpreted di�erently.
We acknowledge that, the determinants of self-employment in Vietnam have been
brie�y reported in the research of Vijverberg and Haughton (2002). They draw more
attention to the survival and growth of household enterprises, than the important factors
which determine self-employment. By using most the recent survey data in the household
living standards of 2004, this chapter aims at providing more detailed discussions on the
determinants and characteristics of self-employment in Vietnam. The stress is laid upon
the business leader rather than on the household, as in Vijverberg and Haughton (2002).
We focus on the role of expected earnings as important motivation for self-employment
and the aim of investigating business start-up constraints. In our attempt to distinguish
the e�ect of di�erent determinants on gender, we will examine separately the impact of
these factors on each gender.
We organize our chapter as follows: Section 2 provides some background information
on the labour market of Vietnam. A brief review of the literature on occupational choice
will be presented in section 3. Section 4 discusses the econometric background method
used throughout this chapter. In sections 5 and 6, we present a descriptive analysis of
our data and our resulting estimation. Finally we conclude in section 7.
46

2 The private labour market in Vietnam
Before the transition, there was no private sector in Vietnam. The state sector, includ-
ing state-owned enterprises (SOEs) and co-operatives, was the only formal employment
provider. Self-employed casual workers, who were not farmers, existed; however, as they
were not numerous there were no statistics 2.
Faced with the increase of the socio economic crisis, the Government of Vietnam had
to conduct a program of economic reforms in the late 1980s 3. The private business sector,
therefore, saw the light of day around 20 years ago. Since this time and with the arrival
of direct foreign investment, the economic structure in general and the structure of the
labour market in particular, have gradually changed.
In the �rst stage of the transition, the share of state employment, especially that of
the SOEs, declined sharply (McCarty, 1999). In recent years, it has been rather stable
and �uctuated a little below 10 per cent (GSO). One may be interested to know why
the state sector has increased in recent years. In fact, the number of workers in the
production section of the state sector has continued to decrease but the development of
public services, such as health care and education, has absorbed many other workers. We
can see the labour structure changes in the table (2.1). Contrarily, the share of non-state
employment saw a rapid increase in the �rst years, and then stabilized. In recent years
it has decreased by 3 per cent, to around 90 per cent of total employed during 2000 and
2008. It should be noted that even now, agriculture is still Vietnam's most important
source of employment. The proportion of farm workers is higher in total to that of the
non state employed. The foreign investment sector has captured more and more of the
labour force since it started; a total of 3.7 per cent in 2008 compared with 1 per cent in
2000. The statistics in 2004 are compatible with those in VLSS-2004 which we use in
this study.
Rapid economic growth has also resulted in job mobility. Some interesting information
2. See: �The informal economic sector: Realities and problems for the management, Vietnam NationalUniversity, Hanoi� for more details
3. For more details see: Tamara (2006)
47

Table 2.1: Employed population distribution by Ownership (%)
2000 2001 2002 2003 2004 2005 2006 2007 2008State sector 9.3 9.3 9.5 9.9 9.8 9.7 9.11 9.02 9.07Non-state sector 89.7 89.5 89.0 88.1 87.8 87.8 87.81 87.44 87.20FIS 1 1.2 1.5 1.9 2.3 2.7 3.08 3.54 3.73FIS :Foreign investment sector
Statistics from GSO, Vietnam: www.gso.gov.vn
could be gained from the employment distribution by economic activities of all over the
country. The share of farm employment gradually reduced, by around 10 per cent between
2000 and 2008. We can deduce that this decline was primarily due to a decrease in
agricultural employment in the non-state sector because those of the state sector formed
less than 1.5 per cent of the total of agricultural workers. From 1990 to 1997, the share of
industrial employment stagnated at around 10 per cent. From 2000 to 2008, this sector
absorbed 5 per cent more than during the previous period. It should be noted that
this increase was most likely due to the development of foreign investment at this time.
Foreign investors have not invested in any other areas, apart from industry and service
activities. No signi�cant increase has been found in non-state industrial employment
in recent years. Nevertheless, the share of non-state and non-agricultural employment
increased, mostly in the service and trade sectors. Le & al. (2001) claim that the shift of
workers from other sectors to the service and trade sectors, rather than industrial sector,
was caused by the lack of capital endowment and business knowledge of the Vietnamese
entrepreneurs. They prefer small-scale businesses in trade and service, which do not
require as much capital endowment as in industry and/or construction.
The decline in farm employment has been compensated by an increase in the share
of salaried jobs; relatively minor in the state sector, but considerably higher in the pri-
vate sector, including those in foreign investment. Now, household businesses, registered
private domestic enterprises and companies with foreign investment provide salaried em-
ployment to more than 22 per cent of the employed population (World Bank, Vietnam
business report, 2006 ).
48

Table 2.2: Employed population distribution by kind of economic activities (%)
2000 2001 2002 2003 2004 2005 2006 2007 2008Agriculture & forestry 62.46 60.65 58.66 56.98 55.37 53.61 51.78 50.20 48.87Fishing 2.63 2.81 3.25 3.27 3.38 3.49 3.59 3.70 3.75Industries* 10.34 11.05 11.54 12.28 12.73 13.50 14.30 14.84 15.50Construction 2.77 3.35 3.86 4.16 4.62 4.70 4.93 5.13 5.33Trade 10.36 10.54 10.84 11.17 11.46 11.60 11.80 11.98 11.96Hotels, restaurant 1.82 1.82 1.81 1.82 1.82 1.80 1.81 1.84 1.85Transport** 3.12 3.06 2.99 2.94 2.89 2.84 2.80 2.76 2.72Education & training 3.60 3.67 3.79 3.90 3.99 4.06 4.17 4.25 4.31Other services*** 2.90 3.06 3.27 3.47 3.74 4.40 4.82 5.30 5.71
*: Industries include Mining and quarrying, Manufacturing, Electricity, gasand water supply.**: Transport, storage and communication***: Other services include Financial intermediation, Scienti�c activities andtechnology, Real estate, renting and business activities, Public administrationand defence; compulsory social security, Activities of Party and of membershiporganisations, Community, social and personal service activities and privatehousehold with employed persons.
Statistics from GSO, Vietnam: www.gso.gov.vn
It should be noted that it is di�cult to classify the status of workers in employment
in Vietnam because there is a group of employees who are both self-employed as well as
being salaried; also within the self-employed population, it is di�cult to distinguish the
self-employed farmers from the non-farm workers. The VLSS survey of 2004 reveals that
42 per cent of workers responded "yes" to the question asking whether or not they had
a second job: 29 per cent had two di�erent employment statuses.
Table (2.3) shows the distribution of workers, by employment status. Statistics for
the �rst two years are taken from Le & al. (2001). Those of 2004 are obtained from
our own calculations of VLSS 2004. In our calculations, we classify workers according to
their primary job status, in other words, that which consumes most of their time.
In line with the decline in agricultural workers, the share of self-employed farmers
decreased by 15 per cent between 1992 and 2004; salaried employment increased to around
49

Table 2.3: Employed population distribution by workers' status (%)
1992 1998 2004Self-employed farm 66.35 61.07 51.45Self-employed non farm 15.75 18.45 18.63Wage employment 17.9 19.48 29.92
Statistics for 1992 and 1998 from Le & al. (2001) ;
for 2004 from own calculation from data of VHLSS-2004 survey, Vietnam
30 per cent. As for the self employed non-farm workers, their share rose to more than 18
per cent of the total workforce in the Vietnamese labour market in 2004.
3 Occupational choice literature reviews
Given the importance in the role of self-employment to the economy (De Wit, 1993),
research into self-employment has received great attention since the last decade. Among
many research tracks, the determinants of occupation choice between self - employed and
employees have emerged as the important one 4. Theoretical and empirical studies of the
�eld marked out many determinants which have an in�uence on the choice between the
self-employment and the salaried employment of an individual. We present in this section
some main factors widely used in the model of occupational choice.
Nearly all researchers have considered the in�uence of educational attainment on the
decision of the worker (Rees and Shah, 1986 ; Gill, 1988 ; Evans and Jovanovic, 1989 ; De
Wit, 1993 , Bernhardt 1994 ). It is argued by Le (1999) that there are several channels
through which educational attainment in�uences the possibility of being self-employed.
On the one hand, education can enhance the managerial ability of a person which
facilitates entry into the self-employment sector. On the other hand a higher educational
level is more favourable when looking for salaried employment, which then decreases the
probability of becoming self-employed. Le (1999) also claims that the in�uence of the
educational level on the propensity to become self-employed should be empirically rather
4. See Le (1999) and Blanch�ower and Oswald (1998) for survey of earlier research
50

than a priori considered. Empirical evidence involving this question was followed by
two opposing arguments. The empirical research of Rees and Shah (1986); Borjas and
Bronars (1989) and Evans and Leighton (1989) , support the �rst argument: a more
educated person has a higher probability than a lesser educated person of choosing self-
employment. Nevertheless, the negative relationship between the level of education and
the propensity to be self-employed is found in the studies of Evans and Jovanovic (1989) ;
De Wit (1993) ; Kidd (1993) ; Destré and Henrard (2004) . These mixed in�uences
of educational level in making choice decisions may arise because of di�erences in the
sampling method and the speci�cation of the model ((Le, 1999). In the equations that
control the occupational status 5, the level of education has a negative impact on the
possibility to become self-employed while in those without the occupational status, the
impact is positive or weakly negative.
In addition to academic formation, managerial ability may also be acquired through-
out the working period. It seems that knowledge accumulated during the working period
is more important in making occupational choice than that during formal education be-
cause of its pragmatic characters. From this perspective, market experiences are then
expected to have a positive impact on the possibility of choosing self-employment. An-
other interpretation of the in�uence of experiences on choice may be that whilst working,
people accumulated not only the knowledge and skills of their �eld, but also the capital
required to create their own business. Thus, more experienced individuals have a better
possibility of choosing self-employment (Kidd, 1993). Another variable closely related to
experience is age. It can be used as proxy in market experience; an older person usu-
ally has more experience given his/her training period, or as attitude toward risk, older
people are less willing to take a risk and therefore less likely to become self-employed.
Empirical results by Rees and Shah (1986) support this positive relation; however, Bern-
5. The work undertaken by an individual, e.g. individuals employed in agriculture, sales, hotel,repairs, craft, managerial or professional occupations. The occupational status should be positivelycorrelated with both educational attainment and the probability to be self-employed. The introductionor omission of theses variables would modify the relationship between educational attainment and theprobability to be self-employed. As the omitted variables bias the education coe�cient, and do notcontrol it, the occupational status will be positive (Le, 1999).
51

hardt (1994) estimates this as non-signi�cant. The reason is likely due to the introduction
of the �nancial capital factor in the model, alongside the work experience variable. This
outcome suggests that we should consider the experience variable as a �nancial capital
variable rather than a human capital variable.
The role of �nancial factors in the setting up of businesses has also drawn particular
attention from researchers. Using di�erent measures of �nancial capital, Evans and Jo-
vanovic (1989) ; Kidd (1993) ; Bernhardt (1994) ; Blanch�ower and Oswald (1998) and
Constant and Zimmermann (2006) , have found a signi�cant in�uence of liquidity con-
straints on the propensity to become self-employed. They all claim that �nancial capital
is an important barrier to self-employment. It should be noted that wealth is assumed to
be a barrier of entry into self-employment whilst it might be the fruit of self-employment
as well. Actually, many studies have used �nancial endowment as a determinant of the
self-employment status rather than a constraint at the moment of setting up the business;
this may have biased the interpretation of the role of �nancial endowment as an entry
barrier.
Rees and Shah (1986) study, among other factors; the in�uence of earnings di�eren-
tials, between self-employment and salaried employment, in occupational choice. They
claim that people will choose the occupation which yields the highest earning potential
for them. The di�erence in earnings will therefore, be positively correlated with the
propensity to being self-employed. Their empirical results, together with those of Bern-
hardt (1994); Johansson (2000); Constant and Zimmermann (2006) may support this
argument.
A number of variables concerning individual and familial characteristics are also in-
troduced in the model of choice. Marital status, the number of dependant children and
the spouse's job are usually used to measure dependence, stability, attitude toward risk
and even the availability of someone's �nancial capital.
It is likely that a married person is more prepared to take risks as their family can
support them mentally during self-employment (Rees and Shah, 1986 ). However, it
52

is also argued that married people with children have more responsibilities, and are less
willing to take risks. Among these variables, the spouse's work is evaluated as a more
important determinant of occupational choice, in Le (1999). According to De Wit (1993),
a person is more likely to take risks in order to get higher bene�t if his/her spouse works.
Empirical evidence of Blanch�ower and Oswal (1998) and Bernhardt (1994) con�rm this
interpretation.
Family background is also considered in the research of determinants of occupational
choice. Many researchers stressed on the impact of the father's job and the mother's edu-
cation on the propensity of becoming self-employed. They found a signi�cant in�uence of
father's job on children occupation. A person would have higher probability of becoming
self-employed if his father had been self-employed. However, if the father had stopped
being self-employed, this would have no signi�cant impact on the individual's decision
(De Wit , 1993 ).
Certain factors such as ethnic group, race, native/immigrant group and mother tongue
also play, to a certain extent, an important role in determining choice. The empiri-
cal results suggest a signi�cant in�uence of ethnic groups and races on the choice of
work (Borjas and Bronars, 1989). The behaviour of native/immigrant groups in the self-
employment sector became a well researched �eld, especially in industrialized countries
such as the UK, US, Canada and Australia 6.
Last but not least, we want to talk about the role of attitude towards risk, in the
choice of being self-employed. It is widely accepted that the returns of entrepreneurs
are more variable and uncertain, than the wages of employees. The self-employed are
seen as risk bearers in De Wit (1993). In his paper, he reports theoretical models of
self-employment, in which the role of attitude toward risk, entrepreneurial ability, risk
involving self-employment, capital requirements and taxation are considered. Brief re-
views on empirical analysis, based on these models are then presented but no empirical
evidence on the role of attitude towards risk is found in his survey. Later, in an excellent
6. See Le (1999b) for more details on previous analysis
53

empirical survey of self-employment by Le (1999), the role of attitude towards risk is,
once again, not mentioned. Cramer & al. (2002) claim that the lack of empirical tests
on the role of attitude towards risk in determining entrepreneurship, is mainly due to the
lack of data measuring the individual's risk attitude. They have conducted this empirical
test and found that people with a lower risk aversion have a higher propensity to choose
self-employment. The same results are found in Kan & Tsai (2006), who use a di�erent
measure of risk aversion.
4 Econometric methods
4.1 The model
The analysis in our study considers the behaviour of full-time workers, in the labour
market, towards occupational choice. A large number of researches into occupational
choice have focused on the workforces in developed countries, while in the case of devel-
oping countries, these areas are studied less. In this chapter, we apply the model widely
used in the literature of choice behaviour to explain the decisions of workers in the Viet-
namese labour market. Our models are similar to those of Rees and Shah ((1986), Evan
and Jovanovic (1989), Bernhardt (1994), Blanch�ower and Oswald (1998) , Johansson
(2000), Constant and Zimmermann 2006.
At the beginning we assume that only two occupations which are available in the
market are self-employment and salaried employment, and that workers are rational and
know the implications of their choice. They know their own characteristics including
the values of variables that are not seen by others. Thus, ceteris paribus, an individual
chooses to work in either the self-employed or the salaried sector of the labour market
which yields the highest bene�ts in term of utility. The utility obtained in each job is
a�ected by the individual's characteristics and by the earnings from the two employment
sectors. Let Usi the utility of individual i if he/she work in self-employment sector and
Uwi in employee sector. The self-employment will be chosen if:
54

(Usi − Uwi) ≡ α(lnYsi − lnYwi) + βXi + εi > 0 (2.1)
where Uji(j = s, w) represents the utility an individual i can expect to receive from
employment in sector j. Yji represents earnings from two occupational statuses and
α is a parameter to be estimated (it is expected to be positive). Xi is a vector of
individual characteristics and variables that in�uence the occupational choice between
self-employment and wage employment for individual i. β is a vector of parameters to
be estimated. Lastly εi is the error term. The function (2.1) can be written in the form
of a probit model such that an individual will choose self-employment if :
Prob (Usi − Uwi > 0) = Prob [α(lnYsi − lnYwi) + βXi + εi > 0] (2.2)
and
εi : N(0;σ2i ) (2.3)
The major di�culty of the function (2.2) is that we only know the earnings of one
person, in correspondence with her/his choice between self-employment and salaried em-
ployment, at any given time; but not both of them, so the earnings di�erential can not
be observed. To overcome this di�culty, separate earnings equations for the employed
and the self-employed are estimated to predict the individual's expected earnings in each
sector. Up to this stage, the second di�culty involving the selection bias is raised from
the consideration that workers in a sub-sample of self-employment or salaried employ-
ment may behave di�erently from the rest, in that they have the advantage of comparing
the two situations and hence choose their status. In other words, the selection rule allo-
cates individuals into sub-samples according to their greatest utility and not according
to random rules. To solve the second di�culty we use the two-stage estimation methods
presented by Heckman (1979) or Maddala (1986), in which the earnings equations are
estimated simultaneously on a set of control variables as in the human capital Mincer
model, and on selection terms calculated from reduced form probit equations. These
55

earnings equations are then used to predict the individual's expected earnings in each
sector. The reduced form probit choice equation may be written as:
I∗ = Xiβ + ui
≥ 0 if self-employment is chosen
< 0 if wage employment is chosen(2.4)
Where ui is error term and assumed to be normally distributed with zero mean and
constant variances. β and Xi are similar as in function (2.2). The self-employment
sector will be chosen if I∗ > 0 and the wage sector otherwise. The expected earnings of
individual i are then:
E(lnYsi|Zi, I∗ > 0) = γsZi + δsλsi + ηsi (2.5)
E(lnYwi|Zi, I∗ < 0) = γwZi + δwλwi + ηwi (2.6)
where Zi is a vector capturing the observed in�uences on earnings and following Mincer
type model, consist of human capital variables, personal attributes and other control
variables. γ and δ are vectors of parameter to be estimated. η is error term and η:
N(0;σ2). λsi and λwi are selection terms calculated from reduced form probit equation
(equation 2.4), where:
λsi =f(−Xiβ/σu)
[1− F (−Xiβ/σu)](2.7)
λwi =[−f(−Xiβ/σu)
F (−Xiβ/σu)](2.8)
where f(−Xiβ/σu) and F (−Xiβ/σu) are respectively standard normal density function
and standard normal cumulative density function of evaluated at (−Xiβ/σu). The sample
selection terms enable consistent estimation of the earnings equations.
The estimation of these equations bases mainly on the normality assumption of error
term, while as mentioned in Heckman (1979), Maddala (1986), Lee (1982) and Bern-
hardt(1994) the earnings equations estimated by OLS are not log normal. The errors
terms in two equations are not normally distributed. However, Lee(1982) proved that
56

the two stage method will yield consistent parameter estimates unless the assumption of
normality of the error term in sector choice equation is correct and thus the estimates
of sample selection term is consistent. That earnings equation errors are not normal
does not imply that selection equation error is not normal. The holding of the normality
assumption in the selection equation is depends mainly on �t. The problem is that the
standard choice model: logit, probit, arctan give similar �ts, sometime it is di�cult to
choose among them. Furthermore, in 1985 and 1990, Heckman and Sedlacek, used a
more general function form for the potential earnings than log normal in a maximum
likelihood function of a model that similar to the model we used here and they found
that if the potential earnings distributions are not too far from normal we might take the
errors in the choice equation as being normally distributed and earnings estimations by
OLS are still consistent.
4.2 Statistical procedure
Our estimation takes place in three stages. Firstly, the reduced form probit equation,
equation (2.4), is estimated. The results of this estimation show the in�uences of indi-
vidual's characteristics on the selection into self-employment and are used to calculated
the selection terms λji. In the second stage, earnings equations of two employment sta-
tuses are estimated, equation (2.5) and (2.6), in which selection terms are introduced to
yield unbiased expected earnings of two employment sectors. Finally, we estimate the
structural probit equation, equation (2.1), in which the expected earnings di�erential is
introduced as an explicative variable. Thus, an individual will choose the self-employment
sector if:
Usi − Uwi > 0⇔ α(lnYsi − lnYwi) + βXi + εi > 0 (2.9)
or in term of structural probit function form:
Prob(Usi − Uwi > 0) = Prob[α(lnYsi − lnYwi) + βXi + εi > 0] (2.10)
57

where lnYsi and lnYwi are respectively the earnings predicted by Heckman or Maddala
methods of individual i in the two employment statuses.
5 Data and variables
5.1 Data
In this study we use data from the Vietnam household living standards survey of 2004
conducted by the General Statistics O�ce (GSO) of Vietnam.
In comparison with the 2002 round, the sample in 2004 is rather smaller with 9200
households, but the 2004 survey contains more details on histories of business activities
within the household. The questionnaire is made up of 3 categories of worker: salaried
worker, farmer and self-employed. The de�nition of self-employed includes all persons who
work for a business enterprise or profession organized and managed by their household
at the time of the interview.
We consider in this analysis the behaviour of the full time worker in an urban area
so that we exclude from the sample part time workers (less than 40 hours per week),
those in agriculture - by the nature of the questionnaire, and those in rural areas. The
self-employed workers who have no �xed work location are also excluded from our sample
to build a sample of self-employment as homogeneous as possible. Important attention
must be paid here, in that, the practice of multi-job holder is rather popular in Vietnam;
we also exclude from our sample, workers who have jobs in the two di�erent categories
cited above (self-employed / salaried worker). Unlike many articles 7, we do not restrict
our sample to the head of the household due to the tradition of Vietnamese families, more
than two generally of working age and/or "basic- families" living in a household.
Our �nal sample consists of 2527 people, between 16 and 70 years old, both male and
female workers, of which 1622 are salaried and 905, are self-employed workers in urban
areas of the 64 provinces of the country. The sample of self-employment in our studies is
7. See: Bernhardt (1994) ; Destré and Henrard (2004).
58

larger than those in studies of Rees and Shah (1986), Bernhardt (1994), Kolev (2000),
Gill (1988), Le (1999b), whose proportions of self-employment are around 10% of the
sample. However, if we deal with a male only sample, this proportion drops to 28% in
comparison to 36% in the full sample.
5.2 Variables
The explanatory variables used in the study consist of explainers of earnings as in
the Mincer model and of choice decision. Among these variables, some may a�ect both
potential earnings and the occupational choice of workers.
Academic educational attainment is captured by a set of dummy variables indicating
the number of years spent at school, education levels ( 1-5 ; 6-9 ; 10-12 years). The under-
graduate level is a dummy for people who have an undergraduate and postgraduate degree
equivalent to at least 15 years of education. A dummy variable is included for workers
who have professional training (Vocation).
We use (AGE ) as proxy of potential experiences in the labor market. Following the
human capital theory, we assume the usual concave shape of earnings over cycle life.
This consideration implies that quadratic term of age (AGE2 ) should be included in the
earnings function and accounts for the decreasing return to labor market experience.
Vietnam is decomposed into 8 economic regions, from the North to the South; regional
dummy variables are used therefore to capture these eight economic regions. A big city
dummy variable (CITIES ) is included for those who live in the �ve big cities classi�ed
by economic weight in GDP of Vietnam. Economic branches are captured by a series of
industrial dummies. Marital status variable (Married) is quoted one if the individual is
married, zero otherwise.
Included in the selection equation are variables which a�ect choice decision. In line
with the studies of Bernhardt (1994), Evans and Jovanovic (1989) and Blanch�ower
and Oswald (1998), we assume that the setting up of a business activity is subject to the
constraint of �nancial sources, we thus introduce a variable re�ecting �nancial endowment
59

in the selection equation: a dummy variable for whether or not they own their home
(HOME ). We consider also the role of the reservation wage on the propensity to becoming
self-employed; a log of other household earnings (OTHERincome) is then included in our
models. Other earnings than wage or income from business activities may be familial
aid from within the country or from overseas, incomes from capitals, real state renting
and even pension for retired persons. We also adopt the assumption that the existence of
children a�ects the employment of parents. We therefore use three variables classi�ed by
the age groups of children: number of children aged 5 years of less (CHILD0-5 ); number
of children from 6 to 10 years (CHILD6-10 ); number of children from 11 to 15 years
(CHILD11-15 ).
As we presented above, self-employed females remain less studied in the literature of
self-employment. We therefore, distinguish estimations for male from female employment
in our chapter. Our aim is to give separate information on the determinants of the self-
employment sector for men and women. We can make some interesting comparisons from
the result of male and female estimation.
6 Empirical results and discussion
6.1 Characteristics of workers in the sample
Descriptive statistics of our sample are presented in (table 2.4). At �rst glance, we can
see that the average earnings of the self-employed are higher than those of the salaried
worker for men only. The di�erentials, even though they are rather small, are statistically
di�erent from zero. Whilst for women, the average earnings of self-employment are a little
less than those of employees. The standard deviations of income of the self-employed are
also higher than those of employees, as much as twice those of employees. The �nding in
male statistics support the argument that the self-employed are those who are willing to
take more risks in order to gain more out of their job, therefore their incomes are higher
and more disperse than those of salaried workers. With respect to the female workforce,
60

it suggests a priory that that higher gains in term of earnings may not be women's self-
employment targets. Nevertheless, other incomes (earnings from activities other than
business activities for the self-employed, earnings other than wage/salary from paid work
for employees) of the self-employed are less than those of employees.
The statistics show that on average; those in the self-employment sector are older and
less well educated than those in the wage earning sector. Some interesting divergences
in the distribution of workers by age are also worth noticing. As we can see in the �gure
(2.1), the same patterns are found for both sexes in the two employment groups. Both of
the sexes have experienced lower shares of young workers and a higher share of workers
over the age of 35 years old in the self-employment sector rather than in the wage/salary
sector. It must be noted that the conventional retirement age of the salaried workforce is
60 years old for men and 55 years old for women, in Vietnam. The percentage of workers
over the age of 50 declines quickly. In summary, younger workers have a tendency to
choose the wage sector, while mature workers have a tendency to choose self-employment.
In regard to marital status, the majority of self-employed are married, while the share
of married people in employees sector is lower. The number of children under 5 years old
of the self-employed is lower than those of the employees, whereas the number of children
from 6 to 16 years old is higher. These results are in line with the statistics of workers age.
Young workers have a tendency to work in the salary sector and young people usually
have younger children. The number of young children of employees is therefore higher
than those of the self-employed.
Concerning educational level; the percentage of the self-employed at under-graduate
level is particularly lower than those of the salaried worker. Only 6.39 % compared with
28.92% of men and 3.49% compared with 26.16% of women have an under-graduated or
graduated degree in the self-employment sector. Workers with 10-12 years of educations
(12 years for baccalaureate level) take the �rst rank in the salaried sector and the second
in self-employment sector. Around 65% of the workers in the salaried sector have 10
years or more of education, compared with only 44% of men and 33% of women in self-
61

employment. We also note that in the self-employment sector the educational level of
men is higher than that of women. The educational level of employees is similar for
both men and women. The proportion of male workers who participated in a vocational
training course is similar (27.31/22.78). With regard to women, the proportion in the
self-employment sector is twice as that of the salaried sector (28.32/12.48).
The distribution of the workforce across industrial branches di�ers a lot according
to sector and sex. Trade (wholesale and retail trade) is the branch which draws the
most workers in the self-employment sector, especially for women. The second and third
ranks consist of two �elds of the service sector (restaurant and hotel; transport and other
services). The quantity of business activities in the industrial sector in general, is the
lowest, especially for women. These results in the self-employment sector of Vietnam are
similar to those of many other developing countries
As for the wage sector, around 45% of employees work in transport and other services
branches. Unlike the self-employment sector, the rate of workers in the restaurant and
hotel service is particularly low for men. Industrial branches which are di�erent from
food processing and confection, leather and shoes take the second rank in drawing in
workers. The rate of male workers in these branches is twice as high as that of the
females. Industrial branches, such as confection, leather and shoes draw more female
than male workers (about 4 times higher).
The last group of variables consists of a set of regional dummy variables. The distri-
bution of workers according to sector and sex is similar for the 8 regions.
The discussion of the earnings functions estimation result proceeds in three steps. In
the �rst step, the reduced form probit equation for the male and female choice equation
is displayed. In the second step, the results of OLS estimation of the earnings functions
corrected to selection bias are presented. The last step consists of structural probit of
choice decision.
62

6.2 Reduced-form probit choice equation
The reduced form selection equation is shown in table (2.5). Although the role of
this regression is to obtain estimation of the selectivity terms, it yields some preliminary
results worth looking through.
The �rst interesting result is that the sign of the variable measuring the �nancial
resources is signi�cant at 5 per cent level in male choice equation. Home owners have a
higher propensity to become self-employed than those who are not. Reservation wages
(OTHER income) however, exercise a negative in�uence on the status of employment.
The higher the secondary source of income is, the lower the possibility becomes to enter
into self-employment. These results seem di�erent from existing literature. It should be
noted that reservation wages mainly consist of remittances from Vietnamese overseas,
and it has been found that this capital �ow has been channelled into the setting up of
registered companies as well as investment into real state and capital market. We can
deduce that reservation wages are used to create formal enterprises rather than informal
ones while our sample is made up of a great number of informal ones. It is therefore,
suggested that the in�uence of reservation wages in the setting-up of businesses should
have been scaled down in our equation.
For female employment, the signs of these two variables are similar to those in the
male equation, but neither of these variables is signi�cant. A similar outcome concerning
the role of homeownership in male employment is found in Constant and Zimmermann
(2006) with a sample of male German workers.
As for educational attainment, the coe�cient of education is negatively signi�cant at
10 percent at the most for male with 10 to 12 years of education or an undergraduate
degree, compared with people who have 5 years of education or less. The in�uence
of educational level on the female status experiences a similar trend with the level of
signi�cant of 5 per cent at the most. Thus, the results suggest that persons who have
less years of education have higher propensity to choose self-employment sector. This
result is consistent with the empirical statistics of our sample. Highly educated people
63

tend to work in salaried employment sector. Vocational training courses (Vocation) have
signi�cant and negative impacts on the decision of becoming self-employed. Individuals
who follow these courses have less probability to work as self-employed as individuals who
do not.
The impact of the numbers of dependant children di�ers across children's age group.
The coe�cient is positively signi�cant for male who have children aged from 6 to 10 years
old and women who have children aged from 11 to15 years old. Marital status has no
signi�cant in�uence on the decision of male worker while it is signi�cant at 5 percent for
female worker.
All dummy variables for economic branches are signi�cant at 5 percent for both men
and women (dichotomous variable for other industries is omitted). In other word, persons
who work in these sectors have more propensities for being self-employed.
6.3 Earnings equations
The earnings equations are shown in table (2.6). The dependent variable in the
earnings equations is the log of annual earnings. As we presented in section 3, the
earnings model is based on the theory of earnings developed by Mincer (1974), in which
the earnings of an individual depended on educational attainment and work experience.
Mincer acknowledged that other factors, beside these two variables, also in�uence earnings
and consequently an extended version of the Mincer model that includes a range of
personal characteristics and structural factors, is widely used.
Look �rst at the in�uence of unmeasured variables on the earnings (Lambda) for male
employment. The coe�cients of selection correction [−f(−Xiβ/σu)/F (−Xiβ/σu)] is neg-
ative in earnings equations of employees, the coe�cient f(−Xiβ/σu)/[(1−F (−Xiβ/σu)]
is positive in earnings equation of self-employed. The signs of these coe�cients are in
line with our expectation but they are however not signi�cant at conventional level. It
means, in our sample, any selection bias is found for male in other word, those who work
in one sector have not comparative advantages in that sector than persons working in
64
other sectors. It is noted that our results in male self-employment sector are di�erent
from those of Bernhardt (1994) and Le (1999b) who found a negative selection into
self-employment in their sample.
In regard of female employment, the selection coe�cients are both negative but signif-
icant at only 1 per cent for persons working in the salaried sector. The fact that selection
terms are not signi�cant in the self-employed equation indicates that self-employed work-
ers are a random sample of all workers. Nevertheless, the signi�cantly negative sign of
the selection coe�cient of female employees implies the positive selection into this em-
ployment status. This result suggests that compared to other workers, people who work
in the salaried sector have more comparative advantages in this sector. Therefore, the
predicted earnings of these salaried people are higher than those of a person with the
same observable characteristics who is randomly chosen from the sample of all workers.
Our result is in line with those of Bernhardt (1994), De Wit (1993); Le (1999b) who
found positive signi�cant selection bias in the salaried employment of male workforce.
We now consider the in�uence of measured variables on worker's earnings. In general,
the results are particularly strong (in term of signi�cance) for male workers except for
regional and industrial dummy variables. Regarding the potential work experience, the
results found in this study are consistent with Mincer's model, in which the relationship
between experience in workforce and earnings is non linear. The sign of square age is
signi�cantly negative for both sexes at the level of 10 per cent at the most. The same
signs are found in the earnings equations of Moock & al. (1998) ; Liu (2006) and Pham
& Reilly (2006), who use the VLSS 1992-1993, 1997-1998 and 2002 in their studies. For
self-employed men, an extra year of age increases the earnings to9 per cent for the self-
employed and to 6 per cent for employees. Our results are partial in contrast with those
of Rees and Shah (1986), Le (1999b) to the extent that in their studies, experience
in the labour market has a bigger in�uence over the earnings of employees than the
self-employed.
As for educational level; the empirical evidences show that it plays an important role
65

in the determination of earnings. The returns to education have increased with years of
education. For self-employed men, who have 10 to 12 years of education; earn 40.7 per
cent higher than those having equal or less than 5 years of education, and 83 per cent
for under-graduate level in the self-employment sector. A similar trend is found in the
wage sector but the extent to which educational levels in�uence the earnings is lower. In
both equations, empirical evidence shows that the in�uence of educational attainment
on people with 6 to 9 years of education is not signi�cantly di�erent than those having
less than 5 years of schooling. In comparison with the results regarding the return to
education on earnings in Moock (1998) and Liu (2006) , we �nd an increasing return to
education in term of earnings throughout the transition in the labour market of Vietnam.
In addition to academic education, the reward to vocational training course on earn-
ings is strongly signi�cant for employees at the level of 1 per cent. Individuals who take
vocational training course earn 17.2 per cent more than an individual who does not.
However, it does not have any signi�cant role in the self-employed sector or amongst
women workers either. The empirical results show that married people earn signi�cantly
more than non-married ones, an extra of 39.2 per cent in the self-employment sector and
18.9 percent in the salaried sector. These results are in line with the ideas that married
men, who have family responsibilities, may be put under greater pressure to succeed.
Hence, it is assumed that a married man may be more productive than an unmarried
man. This rule seems not to be applied for female workers. Marital status does not play
any signi�cant impact on female earnings.
A part from human capital characteristics, many researchers added geographic loca-
tion dummy variables into the earnings equation (e.g. Borjas and Bronas (1989) ; Kidd
(1993) ; Le (1999b)). The in�uences of these variables on earnings di�ers across equation
speci�cations 8. In our model, we introduce a dummy variable for 5 big cities, and a set
of 8 regional dummies. The variable Cities is positively signi�cant at 5 per cent in max-
imum in earnings equations for both of sexes. The earnings of the self-employed living
8. See : Le 1999b for more details
66

in these cities are 20.1 per cent higher than those who do not. A similar percentage of
30 per cent was fount for employees. Respectively the rate for women are 44.5 and 30
per cent. Among regional dummy variables, at least one of these dummies is statistically
signi�cant in each equation. It means that the income of people living in the South East
region of Vietnam are higher than those of people living in the Red river Delta region ,at
the signi�cant level of 10 per cent at most.
We include also in our earnings model, dummies for economic branches. Empirical
results show that economic branches play a signi�cant in�uence on earnings except for
self-employed women. No dummy is signi�cant in earnings equation for self-employed
women.
6.4 Earnings di�erentials
As in Bernhardt (1994) , we compute the absolute earnings di�erentials in the two
sectors by estimating the expected earnings of self-employed workers in salaried employ-
ment and self-employment sector, and the expected earnings of employees in these two
sectors as well. These values are shown in table (2.7). We can see that for male workers,
employees have higher potential earnings in both sectors compared with those of the self-
employed. The statistical tests show that the di�erentials between predicted earnings of
two worker groups in each situation are signi�cantly di�erent from zero. These results
imply the comparative advantages of worker in each section in term of pecuniary gains.
However, these advantages, represented by selection term are not signi�cant in earnings
equations.
With regard to female workers, the potential earnings of employees in the self-employment
sector are higher than the potential earnings of the self-employed in their sector. This
gap is also di�erent from zero. However, no signi�cant di�erential in the expected wage
between the self-employed and the employees is found in the salaried sector. These re-
sults suggest that wage earners have more comparative advantages in the self-employment
sector than do self-employed workers. It is argued by Bernhardt (1994) that there is an
67

entry barrier to self-employment which protects less productive workers. Therefore, in
the case of Vietnam, although female salaried workers have more comparative advantages
in self-employment, they are constrained to stay in salaried sector.
The analysis of earnings di�erential based on the methodology developed by Blinder
(1973) and Oaxaca (1973) provide some more details on the determinants of this di�eren-
tial among worker groups. The average absolute earnings di�erential between two groups
is decomposed into an endowment and a residual component. From equation ( 2.5 ) and
( 2.6 ), with weight equal zero (W=0) the earnings di�erential can be decomposed as:
Ys − Yw = (Zs − Zw)γw + Zs(γs − γw) (2.11)
or for (W= 1) as:
Ys − Yw = (Zs − Zw)γs + Zw(γs − γw) (2.12)
Where bars on variable indicate means and hats denote estimated coe�cients, the
exogenous variables are valued at their mean value (or in the case of dummy variables,
the respective share in the sample). These values are then weighted with the estimated
coe�cients of the earnings function to calculate the projected earnings (in logarithmic
scale). This allows the overall average di�erential in wages between two worker categories
to be decomposed into a part, attributable to di�erences in observed characteristics of
human capital and other control variables, the explained or endowment e�ect, and an at-
tributable part to di�erences in the estimated relationship between the self-employments
and employees: the unexplained or residual e�ect. The endowment e�ect is decomposed
by the �rst group (Zs − Zw)γw and residual e�ect the second group Zs(γs − γw).
The results are displayed in table (2.8). The endowment e�ect of male worker is equal
to 0.0013 while the residual e�ect is 0.186 (for W equal to 1). The results for females are
0.016 and −0.154 respectively. As we can see a major part of the di�erentials between
two worker-categories in potential earnings for both male and female workers are due to
the e�ect of unobserved determinants.
68

6.5 Structural Probit equation
Using the estimated equation ( 2.5 ) and ( 2.6 ) we can compute expected earnings
di�erentials (DIFF = Ysi − Ywi) for each individual i. By introducing this variable into
the reduced probit equation, the structural probit equation can be estimated, and the
results are displayed in table (2.9). We drop out of these estimations, workers who have
never gone to school. Data analysis show that, in our sample in particular, almost all
male workers without education have higher expected earnings in the alternative sector,
which they do not belong to in reality. This result leads to the fact that the e�ect of
expected earnings di�erentials is biased due to this group of workers. With regard to
females, the estimation results do not change considerably if this group of worker is left
out. We prefer to present the dropped out version to facilitate the comparison between
gender 9.
The Chi2 test rejects the constrained model in which all coe�cients except the con-
tents term are set equal zero at the level of 1 per cent. Compared to the reduced form
approach, the insertion of the earnings di�erentials as explicative variable in structural
probit equation does not lead to important changes in the coe�cients of other control
variables in the male equation, while for female employment, the role of academic edu-
cational level and marital status become irrelevant determinants of the self-employment
choice. Like Johansson (2000), we also perform some regressions in which years of ed-
ucation dummy variables or marital status are alternatively dropped, in the structural
equation, to test the robustness of earnings di�erentials. The checks show that our results
are not sensitive to the equation speci�cation as in Johansson's one. The reason consist
perhaps in the sampling method of Johansson . He pulled together male and female
workers in an equation and captured the gender di�erence by a dichotomous variable.
Regarding the earnings di�erentials variable, the sign of DIFF is positively signi�cant
in male equation, the structural choice equation. This result suggests that the di�erence
in expected earnings of two sectors is a major determinant of occupational choice for men
9. Results of full regression will be communicated by contacting authors
69

in term of coe�cient's absolute value. Our �ndings are in line with those of Rees and
Shah (1986) with a sample of UK man worker, Bernhardt (1994) with a sample of while
Canadian man, Destré and Henrard (2004) with a sample of Columbian man; Constant
and Zimmermann (2006) with a sample of German man.
As for female employment, it seems not surprising to �nd that the coe�cient of
earnings di�erential is negatively signi�cant at 1 per cent. As we can see in the section
above, self-employed women have higher predicted earnings in the alternative sector.
These results may imply that pecuniary gain should not be a signi�cant motivation which
encourages women to go into self-employment. On the contrary, they accept to work in
this sector and receive lower earnings than they would have if working in wage sector.
The negative association may be caused by the fact that the earnings of self-employed
women have been under reported compared with those of wage earners. This �nding
suggests also that there should be non pecuniary gain that a�ects the choice of women.
Another reason might consist in the fact that a group of female workers have been forced
to go into the self-employment sector they couldn't �nd work in the salaried sector.
Therefore, they have to run a low productivity business to survive. It is then suggested
that unemployment risk should be included in our model. Our result is similar to that of
Gill (1988) [57] who found a negative and signi�cant coe�cient of earnings di�erentials
in a sample of US men aged from 20 to 30 years old. It is argued by Gill (1988) that the
predicted earnings di�erentials do not adequately represent the expected lifetime earnings
di�erentials between the two sectors and that wage growth di�ers across sector.
Education attainment still has an negative in�uence on the probability of being self
employed in both male and female equations. It probably suggests that formal education
does not necessarily supply appropriate quali�cations for being self-employed (Lentz and
Laband, (1990) ). That the negative signs are more important for those who have high
level of education or professional education, con�rms that education is more appreciated
in the employee sector than in self-employment sector (de Wit, (1993) ). Further more,
it is interesting to note that educational attainment plays positive impact on earnings
70

from self-employment. This may imply that the wage sector would o�er some unknown
opportunities for highly educated persons that would not be found in the self-employment
sector.
As regard the e�ect of age on the probability of being self-employed, the signs are
signi�cantly positive in two equations. The relation between age and propensity to be self-
employed is suggested to be linear because age square is not signi�cant while introduced
in the structural equation. This result is consistent with the practice in Vietnam that,
individuals do not leave the labor market at conventional retirement age, but prefer to
enter to the self-employed sector, probably due to low pension.
7 Conclusion
In this chapter, we investigate the determinants that might a�ect the workers' decision
to go into the self-employment sector in Vietnam. The results show that our variables
are more relevant in the estimations of male workers sample.
Our main �ndings are summarized as follow. Predicted earnings di�erentials have a
positive e�ect on the propensity of being self-employed for men only. While for females, it
plays a negative role. Educational attainment also has a negative e�ect on the probability
of being self-employed for men only. Age has a signi�cant positive in�uence on the occu-
pational choice. Marital status and dependant children are not signi�cant determinants
for self-employment for male workers at all. Whilst for women, the number of dependant
children plays a positive impact on the propensity to go into self-employment sector, but
the impact di�ers across children's age. With regard to �nancial endowment variables,
homeownership has a positive e�ect on the probability of becoming self-employed. How-
ever, reservation wages have a negative e�ect. There two variables are signi�cant for male
workers only.
These results suggest that there exist unknown factors which encourage highly ed-
ucated people to choose salaried sector despite their higher predicted earnings in the
self-employment sector. With respect to female workers, unknown pecuniary gain and
71

unemployment risk are assumed to be important in determining the choice between self-
employment and salaried-employment.
Given the important role of self-employment sector in the labor market of Vietnam
and in the creating of powerful and dynamic domestic enterprises, this study provides
a basis for understanding the determinants of this employment status. This might be
helpful for authorities in making adequate policies in the sector.
72

Figure 2.1: Age distribution of male worker in Vietnam in 2004
Figure 2.2: Age distribution of female worker in Vietnam in 2004
73

Table 2.4: Descriptive statistics
Male FemaleVariables Self-employed Employees Self-employed Employees
Mean Std Mean Std Mean Std Mean Std
Income 9.83 0.87 9.609 .602 9.39 0.811 9.401 .551Age 43.60 10.14 37.24 10.82 42.66 9.92 35.02 10.32Other-income 6.702 2.989 7.328 2.776 7.081 2.687 7.368 2.702CHILD 0-5 .247 .253 .172 .183CHILD 610 .311 .237 .251 .213CHILD 1115 .481 .327 .489 .242
Cities (value in %) 26.38 38.27 29.70 43.60Married (value in %) 91.66 72.25 91.3 66.6Industry dummies (Value in percent)Industries 10.83 37.53 1.83 18.06Trade 42.78 10.00 55.96 10.12Restaurant & hotel 13.61 1.61 21.65 4.62Transport and otherservices
22.22 43.87 9.17 46.97
Food processing 5.83 3.12 4.77 5.35Confection, leather &shoes
4.72 3.87 6.61 14.88
Years of education dummies (Value in percent)1-5 years 15.56 7.96 22.94 8.386-9 years 39.72 27.2 42.94 22.6910-12 years 38.33 35.91 30.64 42.77Under-graduate 6.39 28.92 3.49 26.16Vocation 22.78 27.31 12.48 28.32
Regional dummies (Value in percent)River Red Delta 18.33 21.83 17.43 24.13North Est 9.17 13.33 10.64 11.13North West 1.67 1.40 1.28 2.89North Central Coast 6.11 7.63 8.26 5.64South Central Coast 13.06 12.15 14.31 11.85Central High Land 5.00 3.76 8.07 2.17South Est 24.44 27.10 23.12 29.77Mekong River Delta 22.22 12.80 16.88 12.43
Observation 360 960 545 692Std: standard deviation
74

Table 2.5: Reduced probit equation
COEFFICIENT Male Female(1) (2)
Age 0.001*** 0.0191***(0.0017) (0.0025)
Years of education dummies (1-5 years: omitted)
6-9 years -0.0364 0.0465(0.044) (0.062)
10-12 years -0.0737* -0.152**(0.044) (0.061)
Under-graduate -0.258*** -0.375***(0.027) (0.044)
Vocation -0.0847*** -0.186***(0.028) (0.046)
Child 0-5 0.0344 0.0743(0.030) (0.048)
Child 6-10 0.0459* 0.0326(0.025) (0.042)
Child 11-15 0.0193 0.105***(0.021) (0.035)
Home 0.0929** 0.0941(0.044) (0.072)
Other -0.0138*** -0.00716(0.0045) (0.0072)
Married 0.0679 0.140**(0.046) (0.059)
Regional dummies (Red river Delta: omitted)
North Est -0.0474 0.0548(0.043) (0.074)
North West 0.0136 0.0765(0.11) (0.14)
North Central coast -0.0747 0.140(0.046) (0.092)
South Central coast -0.0203 0.0860(0.044) (0.069)
High Central Land -0.0377 0.372***
Continued on next page
75

Table 2.5 � continued from previous page
COEFFICIENT Male Female(1) (2)
(0.061) (0.094)
South Est -0.0495 0.0196(0.036) (0.057)
Mekong River Delta 0.0410 0.158**(0.047) (0.069)
Industry dummies (Other industries: omitted)
Trade 0.559*** 0.762***(0.042) (0.038)
Restaurant& hotel 0.657*** 0.629***(0.052) (0.039)
Transport & other services 0.121*** 0.204**(0.038) (0.082)
Food processing 0.296*** 0.414***(0.083) (0.079)
Confection, leather & shoes 0.371*** 0.429***(0.084) (0.071)
Observations 1290 1237Standard errors in parentheses
*** p<0.01, ** p<0.05, * p<0.1
Marginal e�ects are reported
76

Table 2.6: Earnings equations
Male FemaleCOEFFICIENT Self-employment Employees Self-employment Employees
(1) (2) (1) (2)
Age 0.0920*** 0.0642*** 0.0513** 0.0380***(0.033) (0.012) (0.024) (0.013)
Age2 -0.114*** -0.0740*** -0.0593** -0.0327*(0.042) (0.015) (0.031) (0.018)
Married 0.392** 0.189*** -0.000491 0.0750(0.24) (0.052) (0.17) (0.051)
Years of education dummies (1-5 years: omitted)
6-9 years 0.166 0.168** 0.130 0.186***(0.16) (0.066) (0.11) (0.070)
10-12 years 0.407*** 0.303*** 0.369*** 0.313***(0.18) (0.070) (0.12) (0.069)
Under-graduate 0.830** 0.681*** 0.872*** 0.611***(0.40) (0.091) (0.28) (0.081)
Vocation 0.172 0.166*** -0.177 0.0764(0.15) (0.045) (0.14) (0.051)
Cities 0.201* 0.301*** 0.445*** 0.300***(0.13) (0.041) (0.096) (0.041)
Regional dummies (Red river Delta: omitted)
North Est 0.148 0.108* 0.579*** 0.126*(0.22) (0.062) (0.16) (0.069)
North West -0.207 0.0228 0.0229 0.150(0.41) (0.14) (0.35) (0.11)
North Central coast -0.270 0.0228 0.226 -0.0944(0.25) (0.073) (0.17) (0.085)
South Central Coast -0.0867 -0.0661 0.394*** -0.0486(0.18) (0.058) (0.14) (0.062)
Central High Land 0.0336 0.146 0.678*** 0.0504(0.26) (0.093) (0.19) (0.13)
South Est 0.479*** 0.322*** 0.742*** 0.325***(0.16) (0.048) (0.12) (0.049)
Mekong River Delta 0.0715 0.0604 0.430*** 0.0691(0.17) (0.063) (0.14) (0.066)
Continued on next page
77

Table 2.6 � continued from previous pageMale Female
COEFFICIENT Self-employment Employees Self-employment Employees(1) (2) (1) (2)
Industry dummies (Other industries: omitted)
Trade 0.0990 -0.0724 0.208 0.185(0.45) (0.11) (0.46) (0.11)
Restaurant & hotel 0.108 0.140 0.323 0.0160(0.50) (0.18) (0.44) (0.12)
Transport & other services -0.247 -0.0954** 0.0797 -0.0552(0.22) (0.041) (0.32) (0.052)
Food processing 0.301 -0.0930 -0.0732 0.159*(0.35) (0.11) (0.40) (0.092)
Confection, leather & shoes -0.0976 -0.181* 0.0749 -0.0643(0.39) (0.097) (0.37) (0.068)
Constant 6.913*** 7.651*** 7.976*** 7.955***(1.31) (0.21) (1.10) (0.23)
lambda 0.0146 -0.0677 0.0771 -0.271***(0.37) (0.15) (0.27) (0.10)
Observations 1290 1290 1237 1237
Standard errors in parentheses;
*** p < 0.01, ** p< 0.05, * p < 0.1
78

Table 2.7: Absolute earnings di�erentials between self-employed and employees
Male FemaleGroup Self-employment Wage sector Self-employment Wage sector
Employees 10.15 9.64 9.43 9.5Self-employed 9.97 9.57 9.36 9.52Di�erence 0.174 0.076 -0.074 -0.021Signi�cant test ( -6.0769)** ( 3.7192)*** (- 3.0032)*** (-1.2401)
Value in natural logarithms of predicted earnings at group means
***: Earnings di�erentials is signi�cant as 0.01 percent
Table 2.8: Decomposition earnings di�erentials between self-employed and employees
Male FemaleW = 1 W = 0 W = 1 W = 0
Explained 0.0013 -0.090 0.016 -0.068Unexplained 0.186 0.277 -0.1542 -0.0703
Ys 9.818 9.356Yw 9.630 9.494Di�erence 0.188 -0.139z 0.76 1.24P> z 0.447 0.217
Ys: Expected earnings of self-employed in self-employment sector
Yw: Expected earnings of employees in Wage/salary sector
Value in natural logarithms of predicted earnings at group means
W= 0: Ys − Yw = (Zs − Zw)γs + Zw(γs − γw)W= 1: Ys − Yw = (Zs − Zw)γw + Zs(γs − γw)
79

Table 2.9: Structural probit equation
COEFFICIENT Male Female(1) (2)
DIFF 0.739*** -1.076***(0.25) (0.32)
Age 0.0168*** 0.0111***(0.0030) (0.0034)
Years of education dummies (1-5 years: omitted)
6-9 years -0.0843* -0.00270(0.043) (0.064)
10- 12 years -0.203*** -0.0798(0.051) (0.067)
Under-graduate -0.376*** -0.159(0.037) (0.11)
Vocation -0.122*** -0.384***(0.029) (0.060)
Child 0-5 0.0329 0.0817*(0.030) (0.049)
Child 6-10 0.0362 0.0457(0.026) (0.042)
Child 11-15 0.00248 0.112***(0.022) (0.036)
Home 0.0875* 0.0750(0.046) (0.074)
OtherINCOME -0.0122*** -0.00540(0.0046) (0.0073)
Married -0.0728 0.0716(0.078) (0.066)
Regional dummies (Red river Delta: omitted)
North Est -0.0998** 0.431***(0.040) (0.11)
North West 0.121 -0.143(0.15) (0.13)
North Central coast 0.0813 0.381***(0.094) (0.10)
South Central coast -0.0187 0.500***
Continued on next page
80
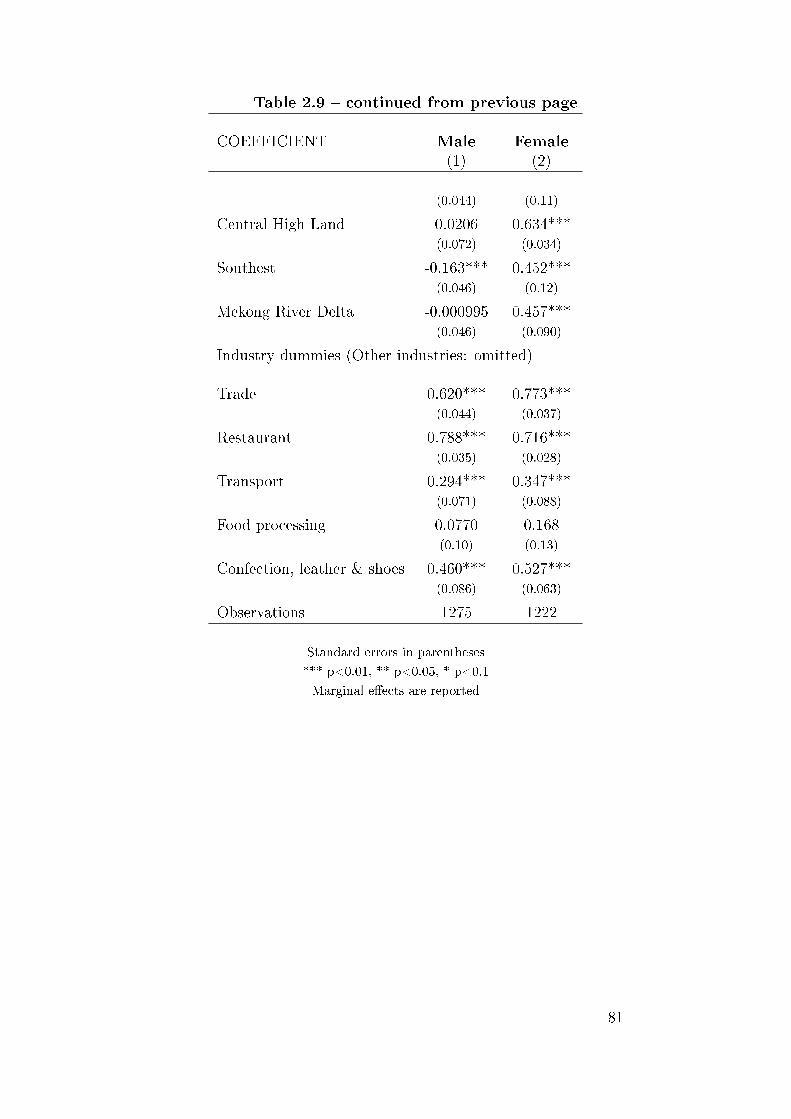
Table 2.9 � continued from previous page
COEFFICIENT Male Female(1) (2)
(0.044) (0.11)
Central High Land 0.0206 0.634***(0.072) (0.034)
Southest -0.163*** 0.452***(0.046) (0.12)
Mekong River Delta -0.000995 0.457***(0.046) (0.090)
Industry dummies (Other industries: omitted)
Trade 0.620*** 0.773***(0.044) (0.037)
Restaurant 0.788*** 0.716***(0.035) (0.028)
Transport 0.294*** 0.347***(0.071) (0.088)
Food processing 0.0770 0.168(0.10) (0.13)
Confection, leather & shoes 0.460*** 0.527***(0.086) (0.063)
Observations 1275 1222
Standard errors in parentheses
*** p<0.01, ** p<0.05, * p<0.1
Marginal e�ects are reported
81

82

Chapitre 3
Determinants of MSEs growth
1 Introduction
Research on �rm performance has been widely explored in economic literature. Whilst,
a large number of economists have concentrated on the �rm e�ciency aspect, which are
often production and cost e�ciency, we use another concept of �rm performance, which
will be discuss further in this chapter, and provide empirical analysis of determinants of
�rm performance for a sample of micro and small enterprises in Vietnam.
To our knowledge, empirical analysis has often emphasized more on medium and large
�rms and neglected micro and to some extent small �rms. In the same way, the man-
ufacturing industry is the one which has attracted the most attention in the �eld. In
recent years, micro and small �rms have renewed attention in the research area. The role
of micro and small businesses in economic growth has been valorised among economists
and policy makers. Heshmati(2001), in his research on micro and small �rms of Swe-
den, regards small businesses as key role players in the generation of job, new ideas,
and encouragement of entrepreneurial activity; they are a major contributor to the well
being of nations. In fact, in �the Economics of Self-employment and Entrepreneurship�,
Parker(2003), states that owner-managers of small enterprises run the majority of busi-
ness in most countries. These enterprises provide goods and services that are ignored by
large enterprises. They also step up competition, thereby increasing economic e�ciency.
In a few cases, some of these micro and small enterprises may grow to become giant
corporations in the future.
83

In the case of Vietnam, the development of the private sector and the micro-small
enterprise sector, in particular, is regarded as one of the forces behind its rapid growth,
after the economic reform in 1986. At the beginning of the reform, the agricultural sector
is the �rst to have bene�ted from this economic restructuring and has seen a spectacular
growth in term of productivity. Time goes b; in the recent years the growth of the non
farm private sector has become a centre of interest. By creating jobs and welfare, business
activities in non farm sector, they are considered as an e�ective tool in the battle against
the poverty in Vietnam and in the creation of the dynamic of economic structure.
In early 1990s, private enterprises in Vietnam did not receive the worthy attention of
policy makers. State owner enterprises have played major roles in the economy. Whereas,
according to a survey carried out by the World Bank in Vietnam (World-Bank, 2005), the
Vietnamese enterprises' community has grown rapidly since early 1990's and the process of
formalized and expanding sped up, particularly from 2000 onwards. They account for 33
per cent value of manufacturing production. However, there is a �gap� between the group
of large enterprises, which are often SOEs, or joint-venture enterprises, and the group
of micro or small enterprises. Gradually the �missing� group is �lled in. Nevertheless,
it reveals the question of how economic policies promote the development of medium
enterprises. Which constraints do enterprises face while expanding their businesses from
small to medium scale? This chapter does not aim to answer directly this kind of question
but contributes to clarify the determinants of micro and small enterprise development.
On the one hand, this chapter reports the results of empirical study, investigating the
impacts of �rms characteristics, particularly size and age, two principal factors a�ecting
growth in the literature, and entrepreneur characteristics, especially education level on the
performance of �rm. In addition, the chapter provides empirical evaluations of the role
of the legal status, the formalization of enterprises in particular, and �nancial access on
�rm performance. Furthermore, in the present study, we contribute to the understanding
of determinants of micro and small �rm performance in a particular context, the case of
Vietnam. We do not restrict our analysis to manufacturing �rms but include all non-
84

farm businesses in the country. There have been several research 1 on Vietnamese micro
and small �rms; however, we have not found any studies which examine the question on
determinants of �rm performance.
Our main results show that �rm size in term of income is positively and signi�cantly
related to �rm performance. However, in term of regular labor number, controlled for
Income, this is negatively related to �rm performance. Young �rms are more successful
than older �rms but not the very young. Being in rural area plays a positive role on
�rm performance. The e�ect of credit access and legal status are rather irrelevant. With
regard to owner characteristics, gender seems not to be a determinant of sales increase
but decrease. A positive e�ect of owner educational level is not found. In contrast, having
a highly educated owner is found to harm the �rm performance.
Our chapter is presented as follow. In section 2, we brie�y discuss the theoretical and
empirical concept of our analysis. Section 3 introduces the econometric model used in the
chapter. Detail information on data and statistical description of variables are presented
in the section 4. A presentation and discussion of the results follow in section 5. We
conclude in �nal section.
2 Theoretical and empirical framework
The relationship between the �rm's performance and its characteristics has generated
a large number of theories, as well as, empirical researches in the economic and manage-
ment disciplines. In one of the �rst studies on �rm dynamic, Gibrat(1931) has claimed
that �rm's growth is a random process or in other word, it's independent of size . This
assertion became the very famous Gibrat'law. Since then on, many theoretic and empiri-
cal studies, aimed at examining this law, have been carried out and the results are pretty
much equivocal 2.
In the �rst model proposed by Gibrat, �rm growth or performance is de�ned as em-
1. For more detail see: Hemlin and al.(1998), Vijverberg and Haughton (2002), Rand(2005),Hansen(2004), Sakai and Takada(2000); Citation would not be exhaustive.
2. For more detail see the excellent survey of Sutton (1997), or that of Coad (2007)
85
ployment growth rate. Some other measurements of �rm performance have been used
in its derivative models, which are sales or assets growth rate, sales or valued added per
employee (citation should not be exhausted). To some extents, none of the measurements
of �rm performance is ideal and has often been subjected to certain criticism. Neverthe-
less, the variety of performance measure will allow sensitive analysis of the results while
di�erent de�nitions of performance are used. Due to the lack of data, which is a usual
phenomenon in empirical study, researchers must satisfy with the measure in their hand
rather than have nothing. Furthermore, in the case of micro and small �rm performance
analysis, that the percentage change in employment is highly negative function of size
would be avoided. We begin the theoretic concept with two well mentioned factors in
�rm dynamic literature: size and age. Further, theoretic and empirical frameworks of
other variables in our chapter are presented.
Beside the Gibrat's law, the size of a �rm a�ects performance in other ways. Large
�rms can diversify their capabilities and abilities to exploit the economy of scale and
scope. This allows large �rms to generate higher performance relative to small �rms.
Otherwise, the small �rms are more �exible than the large ones, both in terms of geo-
graphical localization and their abilities to adapt to a changing economic environment.
A number of empirical studies reveal that Gibrat's law can not be held, as it is, and it
should be used with particular attention regarding �rm properties, in term of size, age,
industries and so on. Evans(1987a, b), Audretsch(1995) �nd negative relationship, con-
ditional upon its survival, between growth rate and size of �rms in the U.S. for both large
and small/medium �rms. Das(1995) found similar results for Indian computer �rms; Na-
jib (2005),using a sample of SME �rms in Morocco, found that size has negative e�ect
on growth. Positive relationship has been found in some studies cited in Hesmati(2001).
Studies of Niskanen and Niskanen (2007) on SMEs indicate that the Gibrat law can not
be rejected for �rms with more than 10 employees. Majumdar(1997), by using two dif-
ferent measurements of �rm performance, �rm productivity and pro�tability level; large
�rms are more pro�table but less productive than small �rms. In one the few researches
86

on Vietnamese �rm growth, Hansen and al.(2004) �nd that size is negatively related to
the growth of Vietnamese �rms, but the relationship between �rm size and survive is not
signi�cant. It should be noted that this study is also carried on a sample of small and
medium �rms in Vietnam, but only in certain provinces.
With respect to the impact of age, it is well known that due to learning e�ects, old
�rms possess more experience in production than young �rms and enjoy the bene�ts
of learning and can, therefore, have superior performance. On the other hand, it is
suggested that old �rms are less �exible to make rapid adjustments to adapt to changes
in market environments. As a result, a theoretical prediction for the impact of age on
�rm performance is impossible a priori. Jovanovic (1982), Evans(1987a, b), Ericson and
Pakes (1995) �nd that age has a positive e�ect on the survival and a negative e�ect on
growth. By contrast, Das(1995) �nds that age has a positive e�ect on �rm growth in
a study of the Indian computer industry. The e�ect of age on growth is sensitive to
the growth de�nition in the study of Heshmati(2001) on small �rms in Sweden. While
using employment growth, the relationship between age and �rm growth is negative and
becomes positive while assets and sales growth are used in the models. Nichter and
Goldmark (2008) claim that this relationship is particularly strong for micro and small
�rms in the developing countries. By using sample of small �rm in some Africa and
Latina America, Liedholm(2002) �nds that �rm age is negatively related to �rm growth.
However, for the case of Vietnamese �rms, it seems that age seems to be relatively
irrelevant to �rm growth (Hansen and al., 2004).
As claimed in Majumdar (1997), it is feasible that the ambiguity in the literature
arises because of institutional issues, which might contain country-speci�cs, have not
been taken on to account. Empirical literature also indicates that �rm characteristics,
other than size and age, may also play important roles in the performance of a �rm.
Amongst others things are the legal status of �rm, credit access, sector, location and the
demographics characteristics of entrepreneur, such as educational level, gender.
The legal status of �rm is seen as a potentially important determinant of �rm per-
87

formance. According to Harho�(1998), the choice of the legal status of a �rm re�ects its
evaluation risk and determines its mode of �nancing, its type of responsibility and its
mode of ownership transfer. Each legal status implies di�erent cost and the choice of legal
status can be regarded as a cost minimized problem. By using a sample of 10,000 German
�rms in four sectors (manufacturing, construction, trade and service), Harho�(1998) show
that limited liability �rms have a higher growth rate and a larger insolvency rate than
�rms with other legal status. Similar results were found in the study of Najib (2005) in a
sample of SME �rms in Morocco. Whilst, by using a sample of �rms in the service related
sector, Nguyen(2004) �nd an insigni�cant impact of legal status on �rm performance. In
developing countries, where informal economy is a well known phenomenon, the question
on how this informal status a�ects �rm growth should be of interest. In the framework
of our studies, informal are �rms that are not registered at central or local authorized
o�ce. Informality associates with some characteristics that a�ect the performance of
�rm. In general, informal �rms are subjected to limited production expansion compared
with formal �rms due to, e.g., constraints in �nancial access or lack of assistance from law
enforcement agencies. Fajnzylber et al. (2006b), in a sample of micro �rms in Mexico,
estimate the impact of paying taxes as a dummy of being formal on �rm performance.
They �nd that �rms that pay taxes exhibit signi�cantly higher pro�ts. Similarly, Mcken-
zie and Sakho (2007) �nd evidence of a positive e�ect of tax formality on pro�t in the
case of Bolivian small �rms. However, they also �nd that e�ects of tax formality on �rm
pro�t is heterogeneous. Tax registration is found to increase pro�ts for the mid-sized
�rms in their sample, �rms with 2 to 5 workers, but to lower pro�ts for both the smaller
and larger �rms than this.
Financial access is often regarded as a crucial factor in promoting �rm's growth.
Otherwise, in the study of Brown and al.(2004) the role of �nancial access in �rm perfor-
mance has been revised for the case of a transition economy, the Romania. They reveal
the possibility that some aspects of institutional environment - property rights, contract
enforcement, e�cient regulation- may be important determinants of small �rm growth
88
and perhaps more important than �nancial access. In this way, the role of �nancial ac-
cess should be empirically examined rather than a priori done and the country speci�c
should be taken into account. In line with the suggestion of Brown, the empirical research
of Johnson and al.(2000) on �rms of 5 transition economies show that a lack of exter-
nal �nancial does not seem to a�ect the private �rms' growth. Whilst, Pissarides and
al.(2003) �nd that constraints on external �nancing limit, in an important way, the abil-
ity to expand production in the case of Russian and Bulgarian small and medium �rms.
Once again, these results reminds us of the claim of Majumdar(1997) on the role of the
institutional e�ect and country speci�c in identifying determinants of �rms' growth.
Economic literature has not agreed about the de�nition of entrepreneur in large �rms,
which are often incorporate �rms. As a result, it is found that in empirical studies, the
role of entrepreneurs is, to some extent, less mentioned in case of large �rms. Nevertheless,
the role of entrepreneurs has been emphasized in small scale enterprises. The theories 3
recognize that the attitudes and abilities of the business owner have an important impact
on �rm growth and will be re�ected in strategic choices and the way in which he or she
operated the business.
Intuitively, one might expect a higher level of formal education to support �rm growth
by enhancing �rm capabilities. Formal education may provide entrepreneurs with a
greater capacity to learn about new production processes and product designs,and may
increase owners' �exibility. Burki and Terrel (1998) �nd that �rms with better educated
owners and managers are more e�cient. On the other hand , the studies of Brown and
al. (2004) on a sample of Romanian small �rms, shows that entrepreneurial skills have
a weak e�ect on growth. A great complexity emerges when the role of educational level
on �rm performance in developing countries is examined. While, those with a high level
of education have greater propensity to be "self-employed" in developed countries, in
the developing ones it is often observed that the poor run a micro-small business to sur-
vive, due to a lack of opportunities in the alternative employment sector. Nichter and
3. For more detail about the theories of entrepreneur see Parker(2004)
89

Goldmark (2008) provide a brief survey of the role of educational level on �rm growth
in developing countries. They report that �rms owned by highly educated entrepreneurs
tend to growth more quickly, conditional to the educational threshold of the country.
It has been proposed in the literature, that women may have fewer opportunities to
develop relevant experience, may have fewer networks to get assistance and may have
greater di�culty in assembling resources. Women may also be more family oriented and
have less ambition in pursuing economic goals related to expansion of the �rm. These
characteristics seem, without doubt, to a�ect �rm growth and performance. In fact,
empirical evidences suggest that being female has a negative impact on the growth of
small �rms but had no impact on �rm survival(Cooper and al., 1994).
Other control factors, some of which are �rm location, industry sector and province,
should be introduced as explicative factors in the empirical model of �rm performance.
Previous studies of �rm performance have revealed substantial di�erences among indus-
tries. In reality, the share of �rms in small scale varies clearly by sector. The share of
small business in industries characterized by a high degree of economies of scale is rela-
tively low. Further more, �rms in this sector are expected to exhibit higher growth rates
than �rms in industries where scale economies are relatively unimportant (Audretsch,
1995). By contrast, the share of �rms in retail and personal service is substantially high
due to the possibility of low barrier entry. However, this industry is characterized by an
intense competitive pressure. The studies of Liedholm(2002) on small �rms shows that
the risk of closure is signi�cantly higher in these industries.
The role of �rm location is particularly emphasized in the research of Liedholm(2002).
He �nds that locating in urban areas constitutes a substantial determinant of survive of
small �rms. Hansen and al. (2004) �nd also that �rms in rural areas have higher prob-
ability of survive in Vietnam but lower growth rate in term of revenue. Also, di�erences
among provinces in the distribution of �rm size or �rms' industries may generate the
di�erences in growth performances of micro-small �rm across provinces (Papadaki and
Chami, 2002)
90

In the rest of this chapter, we empirically examine the impact of size, age, legal status,
credit access and entrepreneur's characteristics on the performance of micro-small �rms
in the non farm business sector in Vietnam.
3 Empirical model and data
3.1 Model
In our study we use the multinomial logit model to investigate the relationship between
�rm performance and �rm characteristics. A time series approach will be ideal to study
the dynamic of enterprises. However, as we have only cross section data of enterprises to
hand, a static approach is the best thing that can be done. The model is presented as
below (see Greene, 2003):
Let zij = 1 if the ith enterprise is in the jth alternative and let zij = 0 otherwise,
where j = 1, 2, 3 equivalence to three outcomes of �rm performance which are "up",
"unchanged" and "down" respectively. Prob(zij = 1) = πij is the probability that
ithenterprise is in jth alternative and since the probabilities must sum to unity we have:
πi1 + πi2 + πi3 = 1.
The multinomial logit in this case may be expressed (for the simple relationship αj +
βjXj) as:
πij =exp(aj + βjXij)
exp(a1 + β1Xi) + exp(a2 + β2Xi) + exp(a3 + β3Xi)(3.1)
where j = 1, 2, 3; α and β are coe�cients to be estimated; X is a vector of �rm character-
istics. We assume that the vector of characteristics X observed in �rm i can in�uence the
probability that �rm i is in the outcome jth. Imposing the identifying restriction β2 = 0
and then exp(0) = 1, we obtain the following expression :
πi1 =exp(a1 + β1Xi)
1 +∑exp(aj + βjXij)
(3.2)
91

πi2 =1
1 +∑exp(aj + βjXij)
(3.3)
πi3 =exp(a3 + β3Xi)
1 +∑exp(aj + βjXij)
(3.4)
where now j=2,3. Taking log(odds ratio) = ln(πi1
πi2) or ln(πi3
πi2) , we have:
ln(πi1πi2
) = α1 + β1X (3.5)
ln(πi3πi2
) = α3 + β3X (3.6)
Now equation 3.5 and 3.6 are ready for running statistic procedures. As one can see
at these equations, their estimated coe�cients can not be used directly to interpret the
in�uence of some characteristics on the probability of belonging to one or other outcomes
but only on logarithm of odds ratio. That's why marginal e�ects are usually reported
to investigate the impact of �rm characteristics on �rm performance. This is written as
follow:
δjk =∂πj∂X
= πj(βj −∑
βkπk) (3.7)
where j = 1, 2, 3 and k = 1; 3.
The sign of the marginal e�ect depends on the expression in the bracket and di�er
across observations. For simplicity, marginal e�ect in our study is computed at sample
mean. For a dichotomous variable, the di�erence in the probability for the values 0 to 1
has to be computed.
In the multinomial logit model, outcomes are assumed to be independent among
others. It is known as �independence of irrelevant alternatives - IIA� property. This
becomes a particular problem when the outcomes are close substitutes for one another.
To test the IIA assumption, we refer to the Hausman and McFadden test (Hausman and
92

McFadden, 1984) and Small-Hsiao test (Small and al., 1985). The intuition for the tests
is that, under the IIA assumption, there should be no di�erences in parameter estimates
if we arbitrarily exclude a category.
The Hausman - McFadden test compares the estimators of the same parameters in two
slightly di�erent models. One model is restricted, comprising all alternatives of dependent
variable, the other model is restricted, one or more alternatives being excluded from the
original unrestricted model. If the IIA assumption is held, the exclusion of one or more
outcome should not induce a substantial change in the parameter estimates. However, as
category is excluded arbitrarily, di�erent exclusion may lead to di�erent test results. It is
also possible that the IIA property holds for some groups but not others. Furthermore, the
McFadden-Hausman test may yields negative values and it is not clear how to interpret
such negative results.
In contrast the Small-Hsiao test is based within the classical testing tradition and
always yields a positive test values. The test randomly split sample into sub-sample and
the log likelihood test is calculated based on these sub-samples in which outcomes are
also excluded arbitrarily.
Quiet often two tests can give di�erent results. Long and Freese (2006) suggest that we
can choose a di�erent base category while running the test to verify the IIA assumption
as IIA may hold for some groups of outcomes.
3.2 Data
We use data from the Vietnam household living standard survey in 2004. The 2004
version is the only one of the living standard survey series in Vietnam where information
on household business history is collected. Information from around 9000 households
collected all over the country show that more than 4000 non-farm business activities have
been reported. This means one half of Vietnamese households runs a non farm business
of one kind or other.
In this chapter, the relation between the �rm's characteristics and �rm's performance
93
in the case of small enterprises is considered. We restrict our study to non farm business
activities. It should be noted that within the framework of a household survey, business
activities in our sample are often in small or very small size. A lot of information that
can be collected in the case of large enterprises can not be reported, or are equal to zero
in other words; in the case of small enterprises. Hence, to reduce the missing value of the
data, we exclude from this analysis all business activities which are not carried out in a
�xed location.
It should be noted that, due to the de�nition of the �rm growth in our study, the
�rms that were created from 2002 up to 2004 (the moment of this survey) are left in our
sample.
Our �nal sample consists of 2802 observations covering 8 regions of the country. We
run our analysis on both the urban and rural areas, full time operating as well as non-full
time operating �rms.
4 Variables and descriptive analysis
De�nition and some descriptive statistics of the variables used in our estimations are
presented hereafter.
4.1 Variables
The dependent variable (Growth) in this analysis, measures the qualitative variation
of �rm revenue between 2004 and 2002. It may be not the most suitable measurement of
�rm performance but it is the only one we have to hand. The state of �rm performance is
captured by a nominal variable which is equal (1) if �rm reported an increase in revenue,
(2) if the revenue was unchanged and (3) if the revenue decreased. Consequently, we
obtain 3 dummy variables. As mentioned in the study of Nguyen(2004), we are not able
to take into account some aspects of subjective valuation of the respondent in the �rm
(for example : the answer �unchanged� can correspond in fact to a weak increase.)
94

Included in explicative variables are characteristics of �rm itself and of its entrepreneur.
Academic educational attainment of �rm's entrepreneur is captured by a set of dummy
variables, indicating the number of schooling years in education system (1-5 ; 6-9 ; 10-12
years). Bachelor is a dummy for people who have an undergraduate and postgraduate
degree equivalent to at least 15 years of education. The gender of entrepreneur is modeled
by a dichotomous variable. Gender is equal 1 if the entrepreneur is a man and 0 if a
women.
The �rm age (Age) is represented by a set of dummy variables according to year of
birth interval (table 3.3). Two important benchmarks according to which �rm age interval
is chosen should be of interest. First, in 1986, Vietnam has carried out its program of
economic reform. From then on, the private sector has been formally recognized in
Vietnam. Second, for the last interval of �rm age, we choose the 2000 because the law
concerning enterprises in Vietnam came into force during this year.
We use variable Number to capture the size of �rm in term of regular labourers,
including �rm's owner. One exception should be revealed in particular. That is a �rm
with 112 regular laborers, which is not a �registered� one, is known as an �outlier�, and
is not included in our estimation.
The �rm size in term of revenues is represented by variable Income. As usual, �rm
revenue is measured in logarithm scale. Consequently, �rms which su�er from lost -
negative revenue- can not be used in the sample either. It must be noted that this is one
of several problems which econometric method has not been able to solve yet in empirical
analysis (Parker, 2003).
The survey we use covers registered, not-formally registered and informal �rm. The
second refers to household �rms that are not o�cially registered by provincial authorities
under di�erent establishment and enterprise laws but district authorities. They can but
often neither register their company seal with the local department of Police, nor demand
for a tax code at the local Department of Taxation. Therefore, they can not produce VAT
invoice and consequently their tax payments can not be calculated on the base of their
95

invoices. The amount of tax payments are negotiated between the �owners� and tax
o�cials (Freeman and al., 2005)
It is interesting to note that statistics in this analysis are draw from a household
survey base. Hence, this sample is not really representative of the micro and small �rm
population in the country, including household �rms which are registered or not, private
�rms, limited liability �rms and shareholding �rms. The last form of formally registered
�rms which are shareholding �rms, escaped from this survey. Unfortunately, we do not
have any mechanism, such as a weight value, to correct this sample bias. Hence, the
(Private or Lmd. �rm) variable represents either private �rms or limited liability �rms
as de�ned in the Law of enterprise in Vietnam. The uno�cially registered �rms (Not
O�cially Registered) variable represents all �rms in second category as mentioned above
and (Informal) variable represents the rest.
The �nancial access is captured by a dummy variable. Credit access) is equal 1 if
a household has borrowed only from a bank and 0 otherwise. For this dummy, we are
not able to identify which business activity loans are used in case where there are more
than one businesses operated by household's member, unless they are used for a non
farm business activity. We suppose that the households and �rms satisfy some conditions
imposed by the banking institute in order to get a credit. These conditions might help
enterprises run more e�cient in term of revenue growth.
Vietnam is decomposed into 8 economic regions from the North to the South. Re-
gional dummy variables are used, therefore, to capture these eight economic regions.
Two dummy variables for rural and urban areas (Urban) and �rms located in 5 big cities
(Cities) identi�ed according to the administrative classi�cation of Vietnam are also used
in our equations.
Both full time and part time operating �rms appear in our sample. We consider all
�rms which have been run for more than 20 days per month and 9 months per year as
a full time operating �rm. Hence, a dummy for full time operating �rm (Full-time)is
included in our estimations.
96

Finally, dummies representing economic sectors and provinces are used as controlled
variables.
4.2 Descriptive analysis
This section shows some characteristics of �rms in our sample.
As mentioned above, �rms created between 2002 and 2004 are not used in the sample,
this section only provides statistics on �rms created before 2002 and surviving till the
end of 2004. Consequently, the statistics do not represent exactly characteristics of small
�rm population in Vietnam but �rms over the age of two years old in 2004 .
The table (3.1) shows that 50 per cent of �rms report an increase of total sales. The
share of �rms have had a total sales decrease is 14.7 per cent.
The growth rate, in term of the number of �rm, sharply increased after the economic
reform and particularly in recent years (3.3). Most of �rms were created after 1986 and
about 50 per cent after 1996. The average year of creation is 1990 and the average age
is 13.43 years. If �rms created between 2002-2004 are still included in the sample, the
share of �rm created after 1996 increases to 64 per cent and the average year of birth is
1996. The table (3.4) shows that the share of �down� �rm decreases while year of creation
increases. Young �rms tend to have better growth than old �rms. The share of �up� �rms
created between 1991- 1996 is higher compared with �rms created during other years.
It is worth noting that, �rms in our sample are almost in a very small scale. The
usual size classi�cation in term of employment - 1 − 9 laborers for micro �rms, 10 − 49
for small �rms -is not suitable in this analysis. To facilitate the descriptive analysis,
we gather all �rms whose size is greater than 5 in the group of �rms with 5 regular
laborers. The reason is that the number of �rms with more than 5 regular laborers is
minor in the sample. Two third of enterprises in our sample are one laborer enterprises.
The share of enterprises with more regular laborers drops sharply when the number of
�rm's regular laborers increases. In fact, only 2.9 percent of �rm have more or equal
than 5 regular laborers. In this group of �rms, the number ranges from 5 to 30 labors in
97

general. Regarding �rm size in term of employee numbers and growth relationship , we
can see in the table (3.1) that the share of �up� �rms increases and that of �unchanged�
�rm decreases with �rm size. In comparison with other �rms, the share of �rm with a
decrease in total sales is particularly high for �rm with more than 5 regular laborers.
Concerning legal status (table 3.1), in general the share of informal �rm is the highest
(73.3 per cent). As usual, the share of not o�cially registered and private and Ltd. �rms
increases with the employee number.
A little more than 10 per cent of �rms have used bank credits during 12 recent months.
27.5 per cent of �rms in our sample are seasonal �rms. The shares of �rms in rural and
urban area are 63.7 and 36.2 respectively. 32 per cent of enterprises are run in tertiary
and secondary sector. 46.7 per cent are commercial �rms in detailed sale or wholesale.
Regarding the entrepreneurs' level of education (table 3.3), those with 5 years of
education or less take a large share (45 per cent). More highly educated entrepreneurs
(more than 12 years of education) take only 2.53 per cent and those with 10 to 12 years
about 17 per cent. Table (3.2) shows that the threshold of entrepreneurs' educational
level might be 10-12 years of education. The share of �up� �rms increases with educational
level of entrepreneur, up to this threshold. Beyond 10-12 years of education the share of
�rms in �up� state decreases.
As found in many empirical researches on micro and small �rms in developing coun-
tries, the share of �rms managed by women is higher than that managed by a man in
Vietnam, 56 vs. 40 per cent (table 3.5). However, it seems that man are a little more
successful than woman in terms of management ability. The share of �up� �rms is higher
for man than for woman, 53.24 compared with 48 per cent respectively.
98

5 Results
5.1 Speci�cation and IIA tests
Since, we carry our estimations on a large number of variables, multicollinearity could
be a problem. However, that the correlation coe�cients among the explanatory variables
do not exceed 0.45 in absolute values 4, suggests that multicollinearity is not a major
problem. In addition, we carry the principal component analysis, our �ndings do not
support any important relationship among variables.
The growth model has been estimated using the multinomial logit method (Greene,
2003). As we use two variables to measure the �rm size, analysis of the results is based
on three model speci�cations: (i) a model with �rm size in term of income, (ii) a model
with size in term of regular laborers number and �nally, (iii) the general model with both
variables measuring �rm size. Because our date contains both �rms in operation part
time and full time, two series of estimation have been carried on two kinds of �rms and
on �rms in operation full of time only. The Chi2 test shows that estimated coe�cients
in our equations are statistically di�erent from 0.
As we have three alternative states of sale growth , we test �rstly whether combining
the states in two outcomes is possible in our data. To do so, a series of likelihood ratio
chi-square tests (Wald test and LR test) to determine whether the coe�cient vectors for
each possible pair of outcomes are signi�cantly di�erent. The results show that the null
hypothesis of no di�erence in the coe�cients for each pair can be rejected at better than
1 percent level, or no categories can be combined in other word. Thus, we ran our MNL
model with all three outcomes.
Regarding IIA tests, these sometimes arrive at di�erent conclusions between Hausman
test and Small-Hsiao test (table 3.7). We explore also the multinomial probit model,
which can be also used for multinomial choice estimation, does not su�er from IIA but it
is di�cult to calculate and interpret, we �nd that the results are similar to those obtained
4. Detail results could be provided by contacting authors
99

in multinomial logit model. Furthermore, as we do not have unequivocal information that
the IIA is violated by our data, we believe that the multinomial logit results are reasonable
and we report them here.
5.2 Estimated equation
Table (3.8) and (3.10) present the marginal e�ect of explicative variables on the prob-
ability of being in �up� state compared with �unchanged� state and table (3.9) and (3.11)
on the probability of being in �decreased� state compared with �unchanged� state. Table
(3.10) and (3.11) show the empirical results of full of time operating �rms. In general,
there are not many di�erences among results in the tables (3.8), (3.9) and (3.10), (3.11)
respectively. Particular comments appearing as large di�erences are shown.
Overall, logarithm of income has a positive and signi�cant e�ect on the �rm growth.
The negative sign in equations (1-6) of table(3.9 and 3.11); mean that the propensity for
being in the �down� state is negatively related to the increase of income. In other word,
the �unchanged� state is better than the �down� state; the probability of arriving at a
worse state decreases with increased income. This e�ect is consistent with or without
variable Number and for both full data base and full time �rms only. The probability
of being in the �up� state increases by about 15 per cent in equation in table (3.8) and
(3.10) - �up� state vs. �unchanged� state and the probability of being in the �decreased�
state drops by about 5 per cent while income increases by unity. All these coe�cients
are signi�cant at 1 per cent level. Using similar measurements of �rm size, Vijverberg
and Haughton (2002) have found that large �rms have higher probability of survival than
small �rms.
Regarding the e�ect of variable Number, a positive e�ect of Number on growth at the
signi�cant level of 1 per cent has been found when Income is not included in the model
(equation 2 , table 3.8). The propensity of being in �down� compared with �unchanged�
state decreases but the coe�cient is not signi�cant at conventional level. Overall, Number
is positively related to �rm growth.
100

While both Income and Number are introduced in the equation, the e�ect of Number
on growth has clearly changed. First, the coe�cient of Number becomes insigni�cant
in table 3.9 in which �rm growth switches from the �up� state to the �unchanged� state.
Second, the e�ect of Number becomes positive and signi�cant in the �down-to-unchanged�
equation at the level of 5 per cent. This means Number plays a negative role on �rm
performance as �down� is worse than �unchanged�. This result suggests that for micro
and small �rms, number of employees is a sensitive measurement of �rm size and �rm
�income� might be a more suitable measurement. When other information on �rm size is
controlled, �rm size in term of employee number seems to be irrelevant to �rm growth in
�up -to- unchanged� equation and negatively related to growth in �down-to-unchanged�
equation. The e�ect of Income remains consistent across �rm speci�cation.
In regard to �rm age, young �rms tend to have a better performance than old �rms.
Firms in the medium age group - which were created between 1991-1995- seem to have
a slightly higher level of performance compared with younger �rms - which were created
after 1996. In �up-to unchanged� equation, the coe�cient of �rms created from 1991 to
1995 is the highest, about 11 percent in average, and signi�cant at the level of 5 per
cent. However, in �down to unchanged� equation, coe�cients of �rms created between
1991 and 1995 are negative but not signi�cant. The coe�cient of �rms created between
1996 and 2001 are negative and signi�cant. This is to say that the probability of being in
�worse� state -�down� state, compared with �better� state - �unchanged� state, decreases
for �rms created after 1996.
Being in urban area, variable (Urban) and big cities , variable (Cities) is negatively
related to �rm performance. With regard to (Cities), all coe�cients are signi�cant at 1
per cent. In the �up -to- unchanged� equation, the probability of being in the �up� state
decreases by around 10 per cent (the number is rounded throughout �rm speci�cation)
and increases by 8 to 10 per cent in the �down-to-unchanged� equation, compared with the
propensity for being in the �unchanged� state. Concerning variable Urban, its coe�cient
is not signi�cant in equation without Income. Otherwise, they are signi�cant at the level
101

of 1 per cent. We can interpret this outcome as follow: controlled for income level, �rms
in urban area have worse performance than those in rural area. Nevertheless, while only
the number of labourers is controlled, it seems that there are no signi�cant di�erences
of performance between �rms in urban and rural area. These results support the ideas
that �rm size in term of employee numbers, including the owner, might not be the most
suitable determinant of �rm performance in the case of Vietnamese micro and small �rms.
Our results are, to some extend similar to those of Hansen (2004) who �nds that rural
�rms have a higher probability of survive as competition in rural areas is lower than in
urban ones.
Our empirical results suggest that there is no di�erence of performance between Pri-
vate or Lmd. �rms and uno�cially registered �rms. Coe�cients of Private or Lmd.
are positive but not signi�cant at all, throughout equation speci�cation. The e�ect of
uno�cially registered and informal status on �rm performance is more complex. The
probability of being in the �up� state instead of in the �unchanged� state of informal
�rms decreases by 7.3 per cent compared with uno�cially registered �rms (table 3.8,
equation 2). This means that uno�cially registered �rms have a higher probability of
having an increase in revenue than the informal ones. It should be of interest to note that
while both Income and Number are controlled, variable Informal becomes insigni�cant
(table 3.8, equation 3). Whereas, the propensity that �rms have a decrease in sales fell
by 4.8 per cent for informal �rms compared with uno�cially registered ones(table 3.9,
equation 3). The coe�cient is signi�cant as the level of 1 per cent. Similar results are
also found for �rm in full of time operation (table 3.10 and 3.11). These outcomes suggest
that the �legal status� does not induce signi�cant e�ect of �rm growth in our sample. Our
results are di�erent from the �nding of Hansen (2004). He reveals that household enter-
prises have a signi�cantly lower revenue growth than cooperatives, private and limited
liability companies.
That the coe�cients of Credit access are not signi�cant in all equations is an interest-
ing point. This result implies that having credit from a bank does not play any role in the
102

performance of micro and small �rms. It also reveals the fact that for micro and small
�rms, which often invest less in capital, use of external capital is not popular. When
we increase access to credit by including di�erent creditors other than banks, the results
remain similar.
Regarding the dummy for full of time operating �rms, we �nd that the probability of
having an increase in sales rises by 10 per cent for the aforesaid �rms. Otherwise, the
coe�cients are signi�cant only in equation without variable Income. In comparison with
part time operating �rms, the probability of being in the �down� state , in stead of the
�unchanged� state, decreases by 4.2 per cent (table 3.9). This outcome implies that full
time operating �rms are, to some extent, in better state of growth than part time ones.
With regard to the e�ect of entrepreneur characteristics on �rm performance, appar-
ently more formal education does not induce a higher performance level. In the �up to
unchanged� equation, empirical result shows that the probability of being in the �up�
state decreases for �rms owned by people having bachelor degrees but increases by 6.8
per cent for �rms owned by people having 10 to 12 years of education. In the estimation
of only full time operating �rms, only, coe�cients of Bachelor are negative and signif-
icant at 5 per cent. This controversial results might be explained by the fact that an
owner with higher education is probably distracted by other activities and puts less e�ort
in monitoring their workforce (Alvarez and Crepsi, 2003). In the �down to unchanged�
equations, owner education seems not to a�ect �rm performance.
The results for the relationship between gender and �rm growth show that it is neg-
ative and signi�cant at 5 percent when Income is in control (table 3.9 and 3.11. We can
interpret the outcome as, the probability of being in the �worse� state of growth (down
state) increases by at least 4 per cent when the owners are men. However, between the
�up� state and the �unchanged� state, there is no di�erent between genders , controlled
for Income.
Concerning sector e�ect, we �nd that positive and signi�cant e�ect on �rm growth
are found in retail and wholesale sectors. The probability that �rms have an increase
103

in sales rises by 6.5 per cent when controlled for Income, whilst �rms su�ering from a
reduction in sales, decreases by about 3 per cent. Being in service sector seems to have
no any e�ect on �rm growth.
Finally, we found that the e�ect of geographic zone is signi�cant. Firm performances
are signi�cantly better or worse in some provinces than in others.
6 Conclusions
In this chapter, we investigate factors which may a�ect performance of micro and
small �rms in Vietnam. We use the most recent survey on living standards of Vietnam,
the 2004 version and as it is one of the most recent data base on Vietnamese micro and
small �rms.
Our analysis is carried out on a sample of 2799 observation, all over the country. No
restrictions on economic industries are set. Our measure of �rm performance is a nominal
change in sales during 2004 with respect of sales of 2002. We use the multinomial logit to
study to relationship between �rm characteristics and �rm performance. The speci�cation
tests do not reject this model.
The empirical results, in this chapter show that the size of �rm, in term of revenue
(Income) have a positive and signi�cant e�ect on the �rm performance. However, there
is no absolutely positive relationship between size in terms of employee number (Number)
and �rm performance. While Number is the unique measurement of �rm size, it plays
both a positive and signi�cant role in the probability of being in the �up� state. Whereas,
when both Income and Number are controlled in the model, the e�ect of Number becomes
negatively insigni�cant or negatively signi�cant on �rm performance. Number does not
have signi�cant e�ect on performance while growth state switches from the �down� to
�unchanged� state. This result suggests that regular labourer number might not be the
most suitable measure of �rm size for micro and small businesses. With respect to the �rm
age, we �nd that young �rms tend to have better performance than old �rms. However,
most recently created �rms (from 2000) are not those with the best state of performance,
104

but those created in the 1990s. Credit access does not have a signi�cant e�ect on �rm
performance. The e�ect of legal status is rather weak. Informal �rms seem to be in a
worst state of growth; there is no di�erence in term of performance between uno�cially
registered and Private or Lmd. �rms. Geographic location plays an important role in
�rm growth. Controlled for both measures of size and others explicative variables, �rms
in rural areas are in a better state of growth. Regarding some owner characteristics,
the results show that owner's gender is not related to the increase in sales of �rms but
slightly negative related to its decrease. Higher level of formal education does not induce
to better performance. Finally, sectors and provinces are also signi�cant determinants of
�rm performance.
105

7 Appendix
Table 3.1: Firm distribution by size and legal status and growthLegal status Employee number Total
1 2 3 4 over 5Uno�cially registered 335 215 41 62 42 695
18.82 31.25 48.24 36.69 54.55 24.83
Informal 1,420 463 103 41 24 2,05179.78 67.3 60.95 48.24 33.24 73.28
Private or Ltd. 25 10 4 3 11 531.4 1.45 2.37 3.53 13.75 1.89
Growth TotalUp 834 372 95 56 53 1,410
46.85 54.07 56.21 65.88 68.83 50.38
Unchanged 686 211 48 21 11 97738.54 30.67 28.4 24.71 14.29 31.91
Down 260 105 26 8 13 41214.61 15.26 15.38 9.41 16.88 14.7
Total 1,780 688 169 85 77 2,799Percentage values in italic calculated by column
Panel B: Pearson chi2(8)* = 42.9604 ; Pr = 0.000
*: H0 = rows and columns are independent
Table 3.2: Firm distribution by owner educational level and growthEdu. Level Growth Total
Up Unchanged Down Total1-5 years of edu. 582 490 192 1,264
45.97 38.77 15.17 1006-9 years of edu. 522 330 135 987
52.83 33.43 13.66 10010-12 years of edu. 278 127 73 478
58.16 26.57 15.27 100Bachelor 28 30 12 70
40 42.86 17.14 100Total 1,410 977 412 2,799
50.32 34.91 14.7 100Percentage values in italic calculated by row
Pearson chi2(6) = 31.2770; Pr = 0.000
*: H0 = rows and columns are independent
106

Table 3.3: Descriptive statisticsVariable ValueIncome * Mean 13257.52Firm's regular labor number * Mean 1.57Gender Female 55.88
Male 44.12Educational level < 5 years of edu. 45.15
6 - 9 35.2710 -12 17.05
Bachelor. 2.53Full time operating �rm No 27.53
Yes 72.47Urban area Rural 63.73
Urban 36.27Cities No 86.76
Yes 13.24Y. of birth 1944 - 1980 5.49
1981 - 1985 5.211986 - 1990 10.771991-1995 24.571996 -1999 32.282000-2002 21.66
Credit access No 89.90Yes 10.10
Economic sector Industry 32.35Retail and whole sale 46.75
Service 20.9Economic region River Red Delta 24.07
North Est 12.34North West 1.96
North Central Coast 11.84South Central Coast 10.84Central High Land 5.24
South Est 14.98Mekong River Delta 18.72
Variables without (*) are presented in percentage values
Income in VND, Unit: 1000 VND
107

Table 3.4: Firm distribution by age and growthAge Growth Total
Up Unchanged Down1944-1980 60 63 30 153
38.96 41.18 19.48
1981-1985 63 53 30 14643.15 36.3 20.55
1986-1990 155 96 49 30051.67 32 16.33
1991-1995 369 208 112 68953.56 30.19 16.26
1996-1999 468 324 113 90551.71 35.8 12.49
2000-2003 295 233 78 60648.6 38.45 12.85
Total 1,410 977 412 2,79950.38 34.91 14.72
Percentage values in italic calculated by row
Pearson chi2(10)* = 28.7167 ; Pr = 0.001
*: H0 = rows and columns are independent
Table 3.5: Firm distribution by gender and growthGender Growth Total
Up Unchanged DownWomen 752 605 209 1,566
53.33 61.8 50.73 55.95
Men 658 372 203 1,23346.67 38.08 49.27 44.05
Total 1,410 979 412 2,799
Percentage values in italic calculated by column;
Pearson Chi2(2)∗ = 22.6239; Pr = 0.000
*: H0 = rows and columns are independent
108

Table 3.6: Wald test and LR test for combining outcomesEquation Outcome Wald LR
Chi2 P value Chi2 P value1-3 186.886 0 202.679 0
1 1-2 206.402 0 235.359 03-2 65.599 0 67.628 01-3 101.46 0 105.284 0
2 1-2 126.282 0 144.097 03-2 64.39 0 66.001 01-3 188.937 0 204.767 0
3 1-2 204.815 0 235.32 03-2 69.493 0 71.956 01-3 103.356 0 111.874 0
4 1-2 134.433 0 151.679 03-2 54.845 0 57.139 01-3 52 0.001 53.506 0
5 1-2 94.372 0 105.63 03-2 51.907 0.001 53.65 01-3 106.051 0 114.833 0
6 1-2 134.107 0 151.801 03-2 57.38 0 60.425 0Ho: alternatives can be collapsed
1: Up state ; 2: Unchanged state ; 3: Down state
Table 3.7: IIA test resultsHausman-McFadden Small-Hsiao
Equation Down-U Up-U Down-U Up-UChi2 Ho Chi2 Ho Chi2 Ho Chi2 Ho
1 6.248 For 4.811 For 29.982 For 24.881 For2 -2.655 - -0.11 - 32.111 For 38.83 For3 1.693 For 52.573 Agt. 24.441 For 30.349 For4 1.96 For -2.939 - 16.513 For 23.019 For5 -0.628 - 0.623 For 29.25 For 32.311 For6 1.317 For -24.73 - 36.909 For 28.312 For
Ho: IIA assumption can not be violated
U.: Unchanged state ; Agt. : against Ho
109

Table 3.8: �Up� state vs. �Unchanged� state of salesgrowth
COEFFICIENT (1) (2) (3)
Income 0.147*** 0.147***[0.013] [0.014]
Number 0.0304*** 0.00198[0.0081] [0.0075]
Cities -0.133*** -0.0942*** -0.133***[0.033] [0.032] [0.033]
Y. of birth 1981-1986 0.0151 0.035 0.0146[0.062] [0.061] [0.062]
Y. of birth 1986-1990 0.0770 0.1* 0.0762[0.054] [0.052] [0.054]
Y. of birth 1991-1995 0.111** 0.126*** 0.111**[0.049] [0.047] [0.049]
Y. of birth 1996-2000 0.102** 0.109** 0.102**[0.048] [0.046] [0.048]
Y. of birth 2000-2001 0.0883* 0.0942** 0.0889*[0.049] [0.048] [0.049]
Informal �rm -0.0024 -0.0736*** -0.0022[0.026] [0.025] [0.026]
Private or Lmd. Firm 0.0364 0.0011 0.0386[0.078] [0.078] [0.079]
6-9 years of Education 0.00689 0.0350 0.00666[0.024] [0.023] [0.024]
10-12 years of Education 0.0377 0.0686** 0.0357[0.031] [0.030] [0.031]
Over 12 years (Bachelor) -0.1365** -0.0970 -0.136**[0.069] [0.067] [0.069]
Credit access 0.0153 0.0403 0.0157[0.034] [0.034] [0.034]
Urban area -0.0745*** -0.0258 -0.0749***[0.024] [0.023] [0.024]
Full time 0.00611 0.107*** 0.00663[0.026] [0.024] [0.026]
Gender -0.00359 0.0376* -0.00433[0.021] [0.020] [0.021]
Continued on next page
110

Table 3.8 � continued from previous page
COEFFICIENT (1) (2) (3)
Retail and whole sale 0.0654*** 0.104*** 0.0659***[0.024] [0.024] [0.025]
Service -0.0148 0.0356 -0.0146[0.030] [0.029] [0.030]
North Est -0.0539 -0.0561 -0.0527[0.036] [0.035] [0.036]
North West 0.113 0.0664 0.112[0.077] [0.075] [0.077]
North Central Coast 0.0170 0.00442 0.0170[0.036] [0.035] [0.036]
South Central Coast -0.0691* -0.0459 -0.0694*[0.037] [0.036] [0.037]
Central High Land -0.112** -0.0815* -0.112**[0.050] [0.048] [0.050]
South Est -0.207*** -0.122*** -0.207***[0.035] [0.034] [0.035]
Mekong River Delta -0.136*** -0.0962*** -0.136***[0.034] [0.033] [0.034]
Constant -1.157*** -0.0369 -1.156***[0.12] [0.062] [0.12]
Observations 2799 2799 2799Pseudo R2 0.0643 0.04 . 0.0649
Standard errors in brackets
*** p<0.01, ** p<0.05, * p<0.1
111
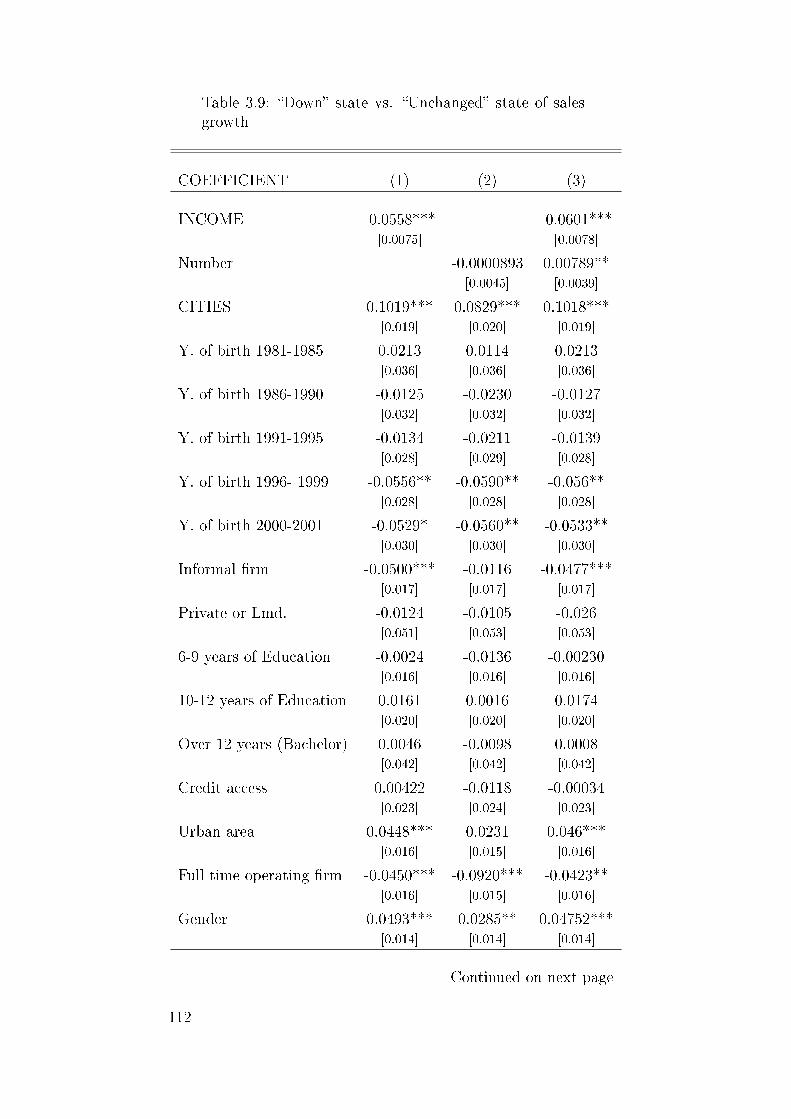
Table 3.9: �Down� state vs. �Unchanged� state of salesgrowth
COEFFICIENT (1) (2) (3)
INCOME -0.0558*** -0.0601***[0.0075] [0.0078]
Number -0.0000893 0.00789**[0.0045] [0.0039]
CITIES 0.1019*** 0.0829*** 0.1018***[0.019] [0.020] [0.019]
Y. of birth 1981-1985 0.0213 0.0114 0.0213[0.036] [0.036] [0.036]
Y. of birth 1986-1990 -0.0125 -0.0230 -0.0127[0.032] [0.032] [0.032]
Y. of birth 1991-1995 -0.0134 -0.0211 -0.0139[0.028] [0.029] [0.028]
Y. of birth 1996- 1999 -0.0556** -0.0590** -0.056**[0.028] [0.028] [0.028]
Y. of birth 2000-2001 -0.0529* -0.0560** -0.0533**[0.030] [0.030] [0.030]
Informal �rm -0.0500*** -0.0116 -0.0477***[0.017] [0.017] [0.017]
Private or Lmd. -0.0124 -0.0105 -0.026[0.051] [0.053] [0.053]
6-9 years of Education -0.0024 -0.0136 -0.00230[0.016] [0.016] [0.016]
10-12 years of Education 0.0161 0.0016 0.0174[0.020] [0.020] [0.020]
Over 12 years (Bachelor) 0.0046 -0.0098 0.0008[0.042] [0.042] [0.042]
Credit access 0.00422 -0.0118 -0.00034[0.023] [0.024] [0.023]
Urban area 0.0448*** 0.0231 0.046***[0.016] [0.015] [0.016]
Full time operating �rm -0.0450*** -0.0920*** -0.0423**[0.016] [0.015] [0.016]
Gender 0.0493*** 0.0285** 0.04752***[0.014] [0.014] [0.014]
Continued on next page
112

Table 3.9 � continued from previous page
COEFFICIENT (1) (2) (3)
Secondary sector -0.0252 -0.0365** -0.0201[0.016] [0.016] [0.016]
Tertiary sector 0.00263 -0.0119 0.00776[0.019] [0.019] [0.019]
North Est -0.00661 0.00153 -0.00417[0.024] [0.024] [0.024]
North West -0.0922 -0.0711 -0.0909[0.059] [0.060] [0.059]
North Central Coast -0.0354 -0.0262 -0.0337[0.026] [0.026] [0.026]
South Central Coast 0.00854 0.00204 0.0103[0.025] [0.025] [0.025]
Central High Land 0.0319 0.0251 0.0344[0.032] [0.032] [0.032]
South Est 0.0595*** 0.0294 0.0624***[0.022] [0.022] [0.022]
Mekong River Delta 0.0378* 0.0249 0.0396*[0.022] [0.022] [0.022]
Constant 0.406*** -0.0385 0.424***[0.070] [0.039] [0.070]
Observations 2799 2799 2799Pseudo R2 0.0643 0.04 0.0649
Standard errors in brackets
*** p<0.01, ** p<0.05, * p<0.1
113

t
Table 3.10: �Up� state vs. �Unchanged� state of salesgrowth
COEFFICIENT (4) (5) (6)
Income 0.135*** 0.1366***[0.016] [0.017]
Number 0.0211** -0.0012[0.0088] [0.0084]
Cities -0.142*** -0.10*** -0.1420***[0.036] [0.035] [0.036]
Y. of birth 1981-1985 -0.00956 0.0081 -0.0096[0.073] [0.071] [0.073]
Y. of birth 1986-1990 0.0410 0.0610 0.0410[0.061] [0.060] [0.061]
Y. of birth 1991-1995 0.106* 0.116** 0.1066*[0.056] [0.054] [0.056]
Y. of birth 1996- 1999 0.1093** 0.110** 0.1099**[0.055] [0.054] [0.055]
Y. of birth 2000-2001 0.06034 0.0560 0.0622[0.058] [0.056] [0.058]
Informal �rm -0.0074 -0.0731*** -0.0076[0.029] [0.027] [0.029]
Private or Lmd. �rm 0.0458 0.0214 0.0560[0.085] [0.085] [0.087]
6-9 years of Education -0.0072 0.0246 -0.0080[0.028] [0.028] [0.028]
10 - 12 years of Education 0.0577* 0.0860** 0.0564[0.035] [0.035] [0.035]
Over 12 years (Bachelor) -0.193** -0.1359* -0.1903**[0.076] [0.074] [0.077]
Credit access 0.0281 0.0498 0.0298[0.040] [0.040] [0.041]
Urban area -0.0631** -0.0213 -0.0639**[0.026] [0.025] [0.026]
Gender 0.010 0.0506** 0.0115[0.025] [0.024] [0.025]
Continued on next page
114

Table 3.10 � continued from previous page
COEFFICIENT (4) (5) (6)
Retail and whole sale 0.0737** 0.0922*** 0.0724**[0.029] [0.029] [0.030]
Service -0.00636 0.0263 -0.00792[0.035] [0.034] [0.035]
North Est -0.0980** -0.0836* -0.0971**[0.046] [0.045] [0.046]
North West 0.165 0.142 0.164[0.12] [0.11] [0.12]
North Central Coast -0.00874 -0.0131 -0.00985[0.045] [0.044] [0.045]
South Central Coast -0.0602 -0.0397 -0.0617[0.043] [0.042] [0.043]
Central High Land -0.145** -0.102* -0.145**[0.059] [0.057] [0.059]
South Est -0.186*** -0.101*** -0.188***[0.040] [0.038] [0.040]
Mekong River Delta -0.120*** -0.0787** -0.121***[0.038] [0.037] [0.038]
Constant -1.046*** 0.0911 -1.057***[0.15] [0.068] [0.16]
Observations 2029 2029 2029Pseudo R2 0.0587 0.0385 0.0596
Standard errors in brackets
*** p<0.01, ** p<0.05, * p<0.1
115

Table 3.11: �Down� state vs. �Unchanged� state of salesgrowth
COEFFICIENT (4) (5) (6)
Income -0.0552*** -0.0603***[0.0090] [0.0093]
Number 0.00167 0.0078**[0.0041] [0.0037]
Cities 0.0989*** 0.0678*** 0.0901***[0.020] [0.020] [0.020]
Y. of birth 1981-1985 0.0355 0.0325 0.0470[0.039] [0.049] [0.039]
Y. of birth 1986-1990 -0.0057 -0.0147 -0.0044[0.035] [0.033] [0.035]
Y. of birth 1991-1995 -0.0025 -0.0071 0.0011[0.031] [0.032] [0.031]
Y. of birth 1996- 1999 -0.0598** -0.0606** -0.0591**[0.032] [0.032] [0.032]
Y. of birth 2000-2001 -0.0410 -0.0387 -0.0402[0.033] [0.034] [0.033]
Informal �rm -0.0607*** -0.0239 -0.0591***[0.017] [0.017] [0.017]
Private or Lmd. �rm 0.0054 0.0003 -0.0140[0.046] [0.049] [0.049]
6-9 years of Education 0.0073 -0.00742 0.0079[0.018] [0.018] [0.018]
10 - 12 years of Education 0.0033 -0.0106 0.0044[0.022] [0.022] [0.022]
Over 12 years (Bachelor) 0.0412 0.0136 0.0353[0.041] [0.042] [0.042]
Credit access 0.0191 0.0039 0.0140[0.024] [0.025] [0.025]
Urban area 0.0289* 0.00987 0.0304*[0.016] [0.016] [0.016]
gender 0.0446*** 0.0232 0.0420***[0.015] [0.015] [0.015]
Continued on next page
116

Table 3.11 � continued from previous page(1) (2) (3)
COEFFICIENT semi4 semi4+1 semi5
Retail and whole sale -0.0320* -0.0341* -0.0262[0.018] [0.019] [0.018]
Service 0.0123 0.00543 0.0173[0.020] [0.021] [0.021]
North Est 0.0250 0.0258 0.0289[0.028] [0.029] [0.028]
North West -0.0415 -0.0368 -0.0406[0.080] [0.083] [0.080]
North Central Coast -0.0381 -0.0327 -0.0355[0.032] [0.033] [0.032]
South Central Coast 0.0211 0.0142 0.0233[0.026] [0.027] [0.026]
Central High Land 0.0615* 0.0459 0.0640*[0.035] [0.036] [0.035]
South Est 0.0586** 0.0241 0.0620***[0.024] [0.024] [0.024]
Mekong River Delta 0.0311 0.0136 0.0327[0.024] [0.024] [0.024]
Constant 0.377*** -0.110*** 0.403***[0.087] [0.041] [0.087]
Observations 2029 2029 2029Pseudo R2 0.0587 0.0385 0.0596
Standard errors in brackets
*** p<0.01, ** p<0.05, * p<0.1
117

118
Chapitre 4
How �rm characteristics a�ect the level
of growth constraints
1 Introduction
The debate on how the size of �rms a�ects �rm growth has become a "classical"
question in economic literature. It leads to many questions concerning how di�erent
large �rms and small �rms a�ect the development of the country. In fact, the role of
entrepreneurship in the economic growth and particularly the role of small enterprises
are well recognized by the literature on entrepreneurship (Audretsch, 1995).
A majority of empirical analysis have concentrated on factors determining the suc-
cess of �rms in business (Majumdar, 1997, Heshmati, 2001, Papadaki and Chami, 2002,
Alvarez and Crepsi, 2003, Brown and al., 2005, Bigsten and Gebreeyesus, 2007). Less
attention has been paid to constraints that entrepreneurs have to encounter with their
business activities. However, we still refer to some analysis of Sleuwaegen and Goedhuys
(2002), Pissarides et al. (2003), Robson and Obeng (2008), Coad and Tamvada (2008),
Moghal and Pfau (2008).
Before, a great number of studies have been carried out for �rms in developed coun-
tries. In recent years, thank to the increasingly important role of developing countries
in the worldwide economy and the availability of data, development of �rms in these
countries have received much more attention of economic researchers.
Beside the critical role in introducing new products and new techniques into the
market, micro and small �rms in developing countries are seen as an e�ective tool in
119
creating job and welfare, therefore a way to run out poverty. However, as a way of
stamping out unemployment, a non-negligible part of entrepreneurs of MSEs might have
not a true "entrepreneur spirits" in the sense that they do not bring about innovations or
reform in stagnant markets (Santarelli and Vivarelli, 2006). Furthermore, in many cases,
small businesses are considered to be a last resort rather than a �rst choice (Beck et al.,
2005), whenever possible, entrepreneur will exit the market to pursue another career path.
Hence, many �rms might be less productive than incumbent, entrepreneurs might not
care about e�ciency, productivity and enlargement of the �rms. Together with barriers
to growth that small scale �rms encounter such as �nancing access, land for production,
lack of management skill etc., this leads to the fact that �rms which start o� small, stay
small and do not have the capability to innovate and invest in new technologies and
growth. Indeed, several researchers have raised the question about the "missing middle"
in the entrepreneurial network with its related consequences.
Given special characteristics of MSEs and their role in economic development, promot-
ing the growth of MSEs has become an important mission of policy makers in developing
countries, Vietnam in particular. However, it is important that the supports of MSEs
should not be identi�ed based on the subjective evaluations of policy makers. Further-
more, that we have several policies that �t the demands of each "group" might be more
e�cient than a "one size �ts all" policy. Consequently, we need to know their objectives,
abilities, di�culties and what aid are needed before give them any assistance.
In order to enlighten this research area, our chapter aims to answer the question of
how characteristics of �rms a�ect the level of growth constraint in business environment
in Vietnam. We use MSEs data base extracted from the survey of living standards
in Vietnam in 2004, in which information on household business have been collected.
The analysis is accomplished by using OLS regression where dependent variables are the
level of constraints facing �rms in several aspects of business conditions, and explicative
variables are �rm characteristics.
Our brief results suggest that �rm characteristics play an important role in determin-
120

ing how serious �rm growth is a�ected by business constraints and that they vary a lot
alongst the type of constraints facing �rms. Firms di�er in size, age, regional location
and sector provide signi�cantly di�erent answers about the level of constraints.
In the section 2, we provide some theoretical and empirical underpinnings of con-
straints to growth. Next, background features of enterprise sector and descriptions of the
data used in this chapter are presented. Section 4 follows with the de�nition of variables
and summary statistics of the sample of �rms. Methodology approach and results are
presented in the section 5 and we conclude in section 6.
2 Theoretical and empirical underpinnings
In theoretical literature dealing with the factors which a�ect the creation and perfor-
mance of �rms, three groups of factors have been de�ned, the characteristics of �rm, of
the entrepreneur and of the environment in which the entrepreneurs and �rms operate.
The issue of what personal characteristics make entrepreneurs is widely reported in both
theoretical and empirical analysis 1. The question of which characteristics of �rm and its
entrepreneur a�ect the �rm performance is also the old one (See Sutton, 1997). From the
theoretical research of Ben Ner et al., 1993 and Holmes and Zimmer, 1994, the impact of
�rm characteristics on performance has been studied via empirical variables such as legal
status, ownership status or variables that control for the governance strategies.
In the context of environmental constraints faced by �rms, the environmental factors
often consist of the existence and functioning of the �nancial and other markets, the
extent of development of infrastructure and the presence of a legal framework , as well as
regulation and institution of enforcement (Pissarides et al., 2003). The e�ect of �nancial
constraints on �rm performance and growth does not simply imply the barrier of access
to credits or credit cost but also are brought about by the underdevelopment of �nancial
market. Levine (1997) has provided a large theoretical survey on the role of �nancial sec-
1. For more information theoretical model see: De Witt (1993), on empirical literature see Blanch-�ower and Oswald (1998), Le (1999). Citation should not be exhaustive.
121

tor development on economic growth through better identi�cation of investment projects,
better availability and lower cost of external �nancing to �rms, improved risk taking, and
technological innovation. Rajan and Zingales (1998) present empirical evidences from a
large sample of countries, which show that �rms needing external �nance tend to develop
more slowly in countries with less-developed �nancial markets. Similarly, Pissarides et
al.(2003) show that constraints on external �nancing limit, in important way, the ability
to expand production in the case of Russian and Bulgarian small and medium �rms.
However, Johnson et al. (2000)(2000) �nd in a survey of private manufacturing �rms
in Poland, Romania, Slovak Republic, Ukraine and Russia, that the absence of exter-
nal �nancing does not prevent �rms from investing. They conclude that the �nancial
constraint is not restrictive in that internal �nance can substitute for external �nance.
Similar results are found in the studies of Johnson et al. (1999) and Brown et al.(2004).
According to Brown et al.(2004), some aspects of institutional environment - property
rights, contract enforcement, e�cient regulation- may be important determinants of small
�rm growth and perhaps more important than �nancial access.
In regard to the e�ect of other components, in the context with environmental con-
straints facing �rms, the legal framework, regulation and institutional enforcement; Covin
and Slevin (1989) state that external environmental factors might have a strong impact
on small �rm viability, growth and performance. They also �nd that the performance of
small �rms is positively related to the entrepreneurial strategic posture or entrepreneurial
orientation (EO) in other word, which, in turn is strongly a�ected by socio-economic en-
vironment of enterprise. The positive relation between the EO and �rm performance
are also found in the study of Wiklund (1999). It should be noted that not all small
entrepreneurs have �EO� which has traditionally been viewed as innovative actions, risk-
taking and proactive, therefore determinants of EO is also an important �eld of research
in entrepreneurial literature. Dickson and Weaver (2008) provide a theoretical frame-
work in which the role of institutional environment in determining �rm behavior towards
entrepreneurial orientation is analyzed. They show that the choice of an EO may be sig-
122

ni�cantly motivated by legal system and regulative forces of institutional environment.
With regard to the role of infrastructure on growth; it is generally accepted that
infrastructural development a�ects economic growth. Infrastructure has often been seen
as increasing productivity and attracting business activity by lowering transport and
production costs and facilitating market access. Canning and Pedroni (2008), using a
panel of cross-countries from 1952 to 1990, �nd that infrastructure development tends to
cause long run growth and the e�ect of infrastructure development on growth varies across
countries. Similar results are found in empirical studies of Egert et al. (2009) who focus
on the role of physical infrastructure e.g. transport, electricity and telecommunication in
economic growth for a sample of OECD countries.
3 Data
3.1 Some background features
Panel A of the table (4.1) provides a simple view of the role of the private sector (or
non-state sector in other words) as a major job-maker in the labor market. It is important
to note that labourers in agricultural activities are included in private sector. Panel
B gives more detailed information on the distribution of non-state workers, including
workers in foreign investment sector, by kind of economic activities. We retain activities
whose share of workers is closed to 1 percent or higher. Unfortunately, we do not have
statistics for the private sector without the foreign investment sector share. Outputs
in panel B are author's calculation from statistics of total employed population and
the distribution of employment in the state sector by kind of economic activities. The
share of workers in agricultural is still dominant but a decrease in trend is observed.
Workers in manufacturing and in wholesale, retained trade, repair of motor vehicles,
motor cycles and personnel and household goods take the second and the third largest
share of employment. The higher growth of employment in manufacturing activity might
be due to the equitation or privatization in other words of state owner enterprises. With
123

regard to the service sector, a majority of labourers are found in 3 kinds of activities: hotel
and restaurants; transport; storage and communication; community, social and personal
service activities. We pay little attention to education and training and health and social
work activities. The share of non-state workers in these activities is small but its growth
rate is rather rapid. From 2000 to 2007, the number of non-state workers in education
and training service was doubled, and that in health and social work increased almost
fourfold. This growth has partially represented the improvement of living standards in
Vietnam.
To some extent, these statistics imply that a larger part of non-farm private labourers
often work in small or medium sized businesses. The table (4.2) and (4.3) provide clearer
evidence of this statement. It has to be noted that �rms in the census all have formal
status. Informal �rms often escape from this kind of survey due to sampling method.
The business society is dominated by non-state �rms in term of number of �rms. Beside
this, the net turnover of non state �rm (table 4.4) has increased signi�cantly between
2000 and 2006, in term of proportion. The share of net turnover of non state �rms has
risen from 25 percent to 41 percent, while that of SOEs has fallen from around 55 to 35.8
percent. In terms of growth rate; during these 7 years, net turnover of non state �rms
in current price have increased more than �vefold and taken the leader role in economic
growth. One can say that this increase has resulted from the privatization process of
SOEs 2. Obviously, this was part of the increase, but the growth rate of net turnover of
limited and private companies, which we can say created mainly by private agents, has
increased more than 5.3 and 3 times respectively, higher than growth rate of state sector.
Furthermore, their share in net turnover of non-state sector is 3 times higher than that
of joins-stock companies, which are partly privatized SOEs. To summarise, the private
sector has played a more and more important role in the economic growth, job creation,
and poverty eradication process in Vietnam.
2. For more detail on privatization of SOEs in Vietnam, see Sjoholm (2006)
124

3.2 Data description
In this study, we use the Vietnam Household Living Standard Survey in 2004 con-
ducted by General Statistics O�ce (GSO) of Vietnam. The 2004 version is the only one
of the living standard survey series in Vietnam, where information on household busi-
ness history is collected, especially in section 10. Among other information, it provides a
ranking of business climate or in other words, barrier to growth of micro and small �rms
in Vietnam. Data collected from around 9000 households all over the country shows
that more than 4000 non-farm business activities have been reported and that multiple
activities can be carried out in some households. Consequently, more than one third of
Vietnamese households run at least one non farm business of one kind or other.
In this chapter, the relation between the �rm's characteristics and barriers to �rm
growth, in the case of micro and small enterprises, is considered. We restrict our study
to non farm business activities. Within the framework of a household survey, business
activities in our sample are often in very small size, therefore the large amount of infor-
mation which can be collected, in the case of large enterprises can not be reported or are
equal to zero, in the case of small enterprises. Hence, to reduce the missing values of the
data, we exclude from this analysis all business activities which are not carried out in a
�xed location, and which are run for less than three months per year.
It should be noted that, due to the de�nition of the �rm growth in our study, the
�rms which were created between 2002 and 2004 (the moment of this survey) are not
included in our sample.
Our �nal sample consists of observations covering 8 regions of the country. We run
our analysis on both the urban and rural areas, full time operating as well as part time
operating �rms.
125

4 Variables and descriptive analysis
De�nition and some descriptive statistics of the variables used in our estimations are
presented hereafter.
4.1 Variables and de�nition
Obstacles that �rms have to face during their growth process are measured by a series
of questions of a 7-point scale. Firms are requested to rank the 17 constraints in ascending
order of hurdle, from 1 "No hurdles" to 5 "Serious hurdles" and the last two answers 6
"Irrelevant" and 7 "Unknown". Summary statistics are provided in the table (4.5).
The table (4.5) shows that the share of �rm ranking a constraint as "major" or
"serious" is very low. The number of �rms reporting a constraint as "irrelevant" or "no
hurdle" is very high. This result seems unsurprising because of the fact that our survey is
consisted of very small sized �rms. As business activity could be a livelihood or a way to
run out of unemployment, �rm owners have less or no concern for business environment.
As we can not determine the rank of "unknown" answer in accordance with the
ascending degree of hurdle, we leave out observations with �unknown� answers. Answers
are re-ranked from 1 "Irrelevant" to 6 "serious hurdles". Our answer system is therefore
close to the Likert-type scale of 6 points.
Although the constraints to micro and small �rm growth can be distinguished by many
single factors, for example: the 17 obstacles in our survey, but without loss of generality,
these factors can be gathered to measure larger compositions of business constraints such
as infrastructure, �nancial access and burden of legal system etc.
In our exploratory data analysis, we �nd that 17 items measuring the level of con-
straints to �rm growth have close relation. The overall Conbrach alpha coe�cient of
these items is 0.9 which is relatively high. Since these answers are closely related, we
doubt the fact that the �rm owner's ranking of constraints to growth is highly in�uenced
by their just previous response.
The simple correlation among 17 items (table 4.6) seems not to con�rm our hypothesis.
126

Even if the correlation coe�cient of a couple of side by side variables is often the highest
coe�cient in the correlation matrix, the di�erence in absolute value with other coe�cients
is not very important in all cases. On the other hand, the number of cases where the
correlation coe�cient is not the highest is not negligible. The table (4.6) also supports our
argument about gathering items into smaller numbers of composition. The correlation
coe�cients among some groups of items are higher.
The principal component analysis (PCA) has been carried and 4 factors have been
retained from the process. The �gure (4.1) shows us the plot of Eigen value of PCA. The
table (4.7) then provides the rotated factor loading and unique variance of 17 items. The
�rst factor (INSTITUTION) represents the level of constraints related to regulations
on trading and custom, inconsistency in economic policies and instability of the macro
economy including in�ation, exchange rate and corruption. That how �nancial access,
�nancial expenditure, taxes and business registration and operation license bothers busi-
ness operation and development is measured by the second factor (FIN−TAX−license).
The third factor (SOCIAL − INSTABILITY ) shows �rms owner's evaluation toward
obstacles caused by crime, lack of security and unfair or unhealthy competition. Con-
straint to �rm growth due to infrastructure conditions including electricity, communica-
tion and postal services, transportation and land for production and business purposes,
is represented by the last factor (INFRA)
To verify the robustness of the PCA results, we have also calculated the Conbrach's
alpha coe�cient for 4 factors. The results are respectively 0.83, 0.79, 0.75 and 0.64 for
factor 1 to factor 4. It should be noted that it is not easy to determine the "should be"
in Conbrach's alpha value. The last value of alpha that we have obtained is relatively
smaller than the conventional value of 0.7. However, we still retain the factor 4 as it
represents clearly the degree of infrastructural constraints encounter �rms.
Included in explicative variables are characteristics of �rms themselves and of their
entrepreneurs.
The �rm age (Age) is represented by a set of dummy variables according to the year
127
of creation interval (table 4.8). Two important benchmarks, according to which �rm
age interval is chosen, should be of interest. Firstly, in 1986, Vietnam has carried out
its program of economic reform. From then on the private sector has been formally
recognized in Vietnam. Secondly, for the last interval of �rm age, we choose the 2000
because the law on enterprises in Vietnam came into force in this year.
As for the role of size in �rm performances, the literature on the role of �rms is not
conclusive. Numerous researchers �nd a negative relationship between age and the growth
of �rms 3; some others however reports a contradictory results 4. The literature on the
relation between the size and the performance and survival of �rms does not provide us
a very simple clear result (Evans, 1987a, b, Audretsch, 1995, McPherson, 1996, Hesmati,
2001, Liedholm, 2002) but still, size is always an important determinant of �rms growth
and of constraints facing �rms in their business (Sleuwaegen and Goedhuys, 2002, Robson
and Obeng, 2008, Coad and Tamvada, 2008, Moghal and Pfau, 2008).
We use variable (LogNumber) to capture the size of �rm in terms of regular labour,
including �rm's owner, in logarithm value. One exception should be revealed in particular.
That is the case of a �rm with 112 regular labourers but not�registered�. This �outlier�
is not included in our estimation.
The �rm size in terms of revenue is represented by variable (Income). As usual, �rm
revenue is measured in logarithm scale. Consequently, �rms su�ering from lost - negative
revenue- can not be used in the sample. It must be noted that this is one of several
problems that econometric method has not been able to solve yet in empirical analysis
(Parker, 2003).
As found in the research of Bartlett and Bukvic (2001), the performance status of
�rm might be associated with some special constraints. The variable (Growth) measures
the qualitative variation of �rm revenue between 2004 and 2002. It could be not the most
suitable measurement of �rm performance but it is the only one we have to hand. The
3. Negative relation between �rm age and �rm growth is found in Liedholm(2002), Dollar et al.(2005), Sleuwaegen and Goedhuys (2002), Coad and Tamvada (2008).
4. Positive relation between �rm age and �rm growth is reported in Das, (1995), Heshmati, (2001),Nichter and Goldmark (2008).
128

state of �rm performance is captured by a nominal variable which is equal (1) if the �rm
reported an increase in revenue, (2) if the revenue was unchanged and (3) if the revenue
decreased. Consequently we obtain 3 dummy variables. As mentioned in the study of
Nguyen(2004), we are not able to take into account some aspects of subjective valuation
of the respondent of the �rm (for example : the answer �unchanged� can correspond in
fact to a weak increase).
The survey that we use covers registered, informally registered and informal �rm.
The second refers to household �rms that are not o�cially registered with provincial
authorities under di�erent establishment and enterprise laws but with district authorities.
They can often neither register their company seal with the local department of Police,
nor demand for a tax code at the local Department of Taxation. Therefore, they can not
produce VAT invoice and consequently their tax payments can not be calculated on the
basis of their invoices. The amount of tax payments are negotiated between the �owners�
and tax o�cials (Freeman and al., 2005)
It is of interest to note that statistics in this analysis are draw from a household
survey base. Hence, this sample is not really representative of the micro and small �rm
population in the country including household �rms registered or unregistered, private
�rms, limited liability �rms and shareholding �rms. Unfortunately, we do not have any
mechanism such as a weight value to correct this sample bias. The dummy variable
(Registered) is used to represent legal status of �rm. It is coded 1 if �rms is registered
(including formally and non formally registered �rms) and otherwise 0 (including informal
�rms)
The �nancial access is captured by a dummy variable. (Credit access) is equal 1 if
household has only borrowed from bank and 0 otherwise. For this dummy, we are not
able to identify in which business activity loans are used in case there are more than one
business operated by household's member but we can only know that they are used for a
non farm business activity. We assume that the households and �rms must comply with
conditions imposed by the banking institute in order to get a credit, as a result these
129

conditions might be related to some particular obstacles to credit access and then to �rm
growth.
Vietnam is decomposed into 8 economic regions from the North to the South. Regional
dummy variables are used therefore to capture these eight economic regions. Dummy
variable for rural and urban areas (Rural) identi�ed according to the administrative
classi�cation of Vietnam is also used in our equations.
Both full-time and part-time operating �rms appear in our sample. We consider full-
time operating �rm as �rms which have been run for more than 20 days per month and 9
months per year. Hence, a dummy for full-time operating �rm (Full-time) is included in
our estimations. Business activities can be carried out within households whose members
run also other businesses than the activities in question. Consequently, to some extend
MSEs results might be a�ected. Entrepreneurs could help each other or learn from family
members. Dummy (Single) is used to represent the fact that observed business activity
is unique business run by members within the household. Finally, dummies representing
economic sectors and provinces are used as control variables.
4.2 Descriptive statistics of the data
Summary statistics of 4 factors or,in other words, 4 dependents variables and explica-
tive variables are presented in the table (4.8).
As mentioned above, �rms created between 2002 and 2004 are left out in this sample,
this section provides only statistics on �rms created before 2002 and still in existence at
the end of 2004. Consequently, the statistics do not represent exactly characteristics of
small �rm population in Vietnam but �rms with more than or equal two years old in
2004.
The �rst four variables are dependent variables. Their average values are close to
zero. The higher value of the dependent variables, the more serious hurdle �rms have to
face. The sizes of �rms are represented respectively by the two following variables which
are in log scale. In terms of decimal scale, the average number of �rms' employees in
130

our sample is 1.75, which range from 1 to 30. Most of �rm (87.5 percent) are one-person
or two-person �rm including the owner (about 60 percent of �rms are one-person �rms).
Regarding the �rm income, it range from 62 thousands (equivalent to 5 USD) to 373380
thousands Vietnamese dong (VND) (equivalent to 23 336 USD) with a median value of
8050 thousands VND 5.
The number of registered �rms in our sample is rather small, 24.5 percent versus 75.5
percent. Similarly, about 9 per cent of �rms have used a bank credits during 12 recent
months. 30 per cent of �rms in our sample are seasonal �rms. The share of �rms in rural
and urban area is 66.7 and 33.7 respectively. 32 per cent of enterprises are run in tertiary
and secondary sector. 46.7 per cent are commercial �rms in detailed sale or wholesale.
Regarding �rm age, the share of �rm younger than 10 years old is about 50 percent.
Most of �rms have been created after the economic reform (1986) and the number of
micro �rm has increasingly risen from then on. It should be noted that the year group
2000 includes only �rms created up until 2002. If we include �rms created in 2003 and
2004, the share of �rms in this group is the highest.
It is interesting to look at the distribution of micro �rms across the country. The River
Red Delta, Mekong River delta and the Southeast are the 3 most important centers of
economic development of the country. The �rst includes the capital of Vietnam, the
third: the biggest center of economic in many aspects. That is why the number of non
farm business activities in these regions is the highest and it should be noted that the
percentage of micro�rms in these regions corresponds to their percentage of population
compared to the country population. It is not surprising to see that the share of �rms
in the Northwest region is the lowest (1.8 percent). This is the region that has had to
deal with many di�culties in economic development. Per capita income in the region is
always at the lowest level of the country. An other crucial reason for the small number of
non farm business is that this region consists of only 4 provinces with roundly 3 percent
of country population compared to the Central High Land, the North and South Center
5. The exchange rate was roundly 16000 VND/USD in 2004
131

Coast with 5.7, 12.8 and 8.5 percent of country population respectively 6.
In regards to the �rm performance, about 49 per cent of �rms report an increase of
total sales. The share of �rms has had a total sales decrease is 14.43 per cent. We sort our
�rm sample into 3 sectors. In general, two third of micro �rms have been run in tertiary
sector. The share of �rms in whole sale and retail is the highest (49.33 percent) and �rms
in service sector take 21 percent. The rest, 33 percent, is run in industrial sectors.
5 Results and discussion on robustness test
5.1 Empirical results
In order to investigate the heterogeneity of �rms across constraints to �rm growth,
the four factors resulted from the factor analysis presented above are used as dependent
variable. As they are considered to be continuous variable, we carry OLS regression in
our analysis. Equation to be estimated is written as follow:
yi = α + βX + ε (4.1)
where the subscribe i = [1, 4] captures four factors; X is a vector of �rms characteristics
as presented in the variables section and �nally ε is residue. Our approach is similar
to Sleuwaegen and Goedhuys (2002) for Ivorinan �rms, Robson and Obeng (2008) for
Ghanain �rms, Coad and Tamvada (2008) for Indian �rms and Moghal and Pfau (2008)
who analyse Pakistani �rms.
As �rms in our sample consist of 3 groups: �rms whose turnovers have increased, have
been unchanged and have decreased compared to 2 years ago (turnover in 2004 vs. 2002).
The small table (4.9) provides us a descriptive relation between the turnover status and
constraints to growth. In terms of average value, the level of constraint to growth varies
a lot across growth status of turnover. In general, �rms having good performance have
reported higher level of constraint compared to other growth status. In term of median
6. Statistics are calculated for 2004 from GSO data at: www.gso.gov.vn
132

value, the di�erence among �rm group is smaller but it should not be ignored. We suppose
that turnover status of �rms must have particular impact on the evaluation of constraint
to �rm growth that dummy variables for each group of �rm could not capture totally
di�erent e�ects of turnover growth status. Furthermore, the test of omitted variable does
not support the use of growth status as dependent variable. Therefore, we run separate
regression for each of group of growth status.
Regression results are presented in the tables (4.10 - 4.13) for four factors respectively.
For some regressions, we include the square of employees number or income as we detect
the nonlinear relation between the level of constraint to �rm growth and the size of �rm.
We discuss principally signi�cant results in regressions.
Institutional constraints
In the table (4.10), the dependent variable is constraint in institutional condition.
In general, it seems that there is not relation between the size of �rm and institutional
constraints including hurdle from regulation on trading and custom, inconsistency in
economy policy, instability of the macro economy including in�ation, exchange rate and
corruption. Other important characteristics of �rms as for: legal status, having credit
access, running in urban location, operating in full time and having only one business
within the household, have any signi�cant relations with institutional barriers.
Variables that have a signi�cant sign are �rm age, geographic location of �rm and
sector of activity. With regard to the �rms having good performance, �rms in three
regions in the North of Vietnam have to face more serious constraints in institution
compared to other regions. It should be noted that the omitted region is the River Red
Delta, one of the most important centers of economic. This result suggests to some
extent that institutional condition in regions encountering more di�culties in economic
development should be less favourable to the �rm growth.
In the group with unchanged turnover, the result reveals that institutional barrier
e�ects are signi�cantly and negatively related to �rm growth for �rms in younger group
133

created from 1996. This outcome suggests some positive sign about the fact that micro
and small �rm have serious concern on their growth. Micro business is not only the way
to lower unemployment or poverty.
Regarding the third signi�cant variable, business sector, �rms in service activities are
less a�ected by institutional constraints. For three groups of �rms, the sign is always
negative but signi�cant only in the good performance group.
Other characteristics of �rms, particularly our variable of interest: size of �rm does
not matter to institutional constraints.
FIN-TAX-LICENSE constraints
Results in table (4.11) explain the barrier of �nancial, tax issues and licensing to
�rm growth alongside �rm characteristics. We �nd that the size of �rm in term of
number of employees matters for the degree of constraint facing �rms. In contrast to
other researchers (Bari et al., 2002 and Moghal and Pfau, 2008),indicate that larger
�rms held advantages because they are in better position to access �nancial credit, to
have investment incentives and to obtain limited government licenses, our results reveal
positive relation between �rm size and constraints of tax, �nancing issues and licensing.
It means bigger �rms face up to more serious burdens. The sign of �rm size in term of
income level however is not signi�cant.
The sign of variable "Registered" is consistent with the outcome above. Registered
�rms complain most about "Fin-Tax-License" issues. As indicated in Moghal and Pfau
(2008), this fact can be explained by several reasons. Smaller �rms and often non regis-
tered �rms believe that they will not be welcomed by �nancial institutions and therefore,
they are discouraged to approach formal credit institutions and �nd other sources of �-
nancing such as self �nancing or borrowing from family or friends. Furthermore, smaller
�rm is less willingness to take risk so avoiding taking any liabilities related to credit.
Bigger and "more formal" �rms, still micro and small �rms, who can apply for credit,
have a lot of di�culties in approaching this source of �nancing.
134

Besides, the result of variable "Credit access" seems to be interesting. Its insigni�cant
sign means that there is not statistical di�erence among �rms having obtained bank
credit and other �rms. Additional information about "Credit access" variable should
be provided. Credits that �rms have obtained are �nanced by the poverty eradication
program and might not bear the same characteristic as credits in general for �rms and
then they might not be accessible to every �rm. However, its non signi�cant sign implies
that even with the "credit access" �rms still complain in the same way.
Regarding the age of �rm, we �nd that the youngest �rms in the good performance
group complain the most about "FIN-TAX-LICENSE" compared to the others. With
the aim of enlarging their business, young �rms have to encounter with more and more
�nancing access, �nancing cost, tax and license issues and might �nd that these conditions
are not very favourable to their targets. One more time, the result implies that micro
�rm owners, particularly younger �rms, have real "entrepreneur spirits" while having
considerable concern for business constraints and that micro and small businesses should
not be always the last choice in the carrier path.
In other group of �rm, �rm age is not an important factor in determining how �rms
evaluate constraints of tax, �nancial issues and licensing.
Burdens of �nancial and tax issues and license di�er statistically signi�cant by �rm
location. Firms in three regions, Northwest, North Central Coast and South Central
Coast complain much less about "Fin-Tax-License" issues in the group having increase
in turnover. The sign is negatively signi�cant in the regression. However, in the group of
worse performance, �rms having decrease in turnovers, the sign of Northwest is positively
signi�cant. This outcome seems contrary to the result of "Growing" regression. In fact,
because of the small number of observations in this category, it is suggested that this
result is strongly bias and not representative for the region. Even though, it reveals the
question on how constraints of �nancial and tax issues and license a�ect the growth of
�rms in the "declining" group in the Northwest region.
In the same group, the "declining" group, controls for others characteristics, �rms in
135

whole sale and retail trades complain signi�cantly most about "Fin-Tax-License" con-
straints. Evaluation of �rms in others groups does not di�er across sectors. For the
purpose of better understanding, which is principle constraints facing �rms among �nan-
cial and tax issues and license, we calculate a simple average value of each item included
in the Fin-Tax-License factor for every sector for �rms in "declining" group. The result
shows that �rms in whole sale and retail trades complain most about access tax issues
and then �nancing access 7.
Social-Instability Constraints
Relationship between complaints against social instability issues including crime, lack
of security, unfair and unhealthy competition and characteristics of �rms is presented in
the table (4.12).
After controlling for other �rm characteristics, we �nd the �rm size does not matter in
the level of constraint facing �rms in the "growing" and "unchanged" groups. Its e�ect,
however seems to be contradictory for �rms in the "declining" group. Bigger �rms, in
terms of number of employees tend to complain less about social-instability constraints,
while in term of income level their complaints are much more severe. It should be noted
that the degree of signi�cance at 10 percent level is not so much strong then outlier might
bias signi�cantly our results. In fact, 4 biggest �rms in term of number of labours report
a relative lower level of constraints, by discarding these observations, the coe�cient of
variable "Number of employees" becomes non signi�cant but still negative, while the level
of signi�cance of �rm income variable does not change. Therefore, the result implies that
the degree of hurdle facing bigger �rms is more serious than small �rm with regard to
income level. In terms of employee number, the result is still ambiguous. Large sample
might allow us to shed more light on these questions.
Still in the group of �rms having bad performance, the age of �rms is a signi�cant
factor to determining the di�erence in complaints by �rms against social instability issues.
It is of interest of repeat that �rm created from 1980 onward are omitted in the regression.
7. Detail results are available by contacting author.
136

So, younger �rms face less constraints of social-instability than the oldest �rms in the
group. It has to be noted that the coe�cient values and degrees of signi�cance do not
change much with �rm age groups. It implies that the di�erence in �rm's evaluation
of constraint level to growth is negligible among �rms created after 1980. One might
reveal a question on why these oldest �rms complain most. In fact, before 1886, private
business was not formally accepted in Vietnam, and then it was di�cult to a private
�rm to operate and grow. Consistent with this statement, we assume that the evaluation
of the oldest �rm's owners is based on their experience in the past and might not be
considered their actual problem.
Regarding geographic location, it is interesting to �nd that �rms in two particular
regions the Northwest and the Southeast of the country complaint signi�cantly less about
social-instability issues with the level of signi�cance of 5 percent at most. Omitted region
is always River Red Delta. Firms in some other regions report also negative coe�cients
but the results are not signi�cant. To some extent, social-instability issues in River Red
Delta are severe constraints of �rms compared with �rms in other regions.
The same results are found in the group with better performance, the "growing" and
unchanged groups. The number of signi�cant variables is even higher, especially in the
"growing" group. Firm age however does not a�ect constraints facing �rms.
In these two groups, �rms in wholesale and retail trades voice louder complaints than
those in industrial and service activities at the level of signi�cance of 1 percent.
With regard to other characteristics which a�ect �rm's complaints against business
conditions, for the group with the best performance, �rms having credit access present
more severe complaints than other �rms. In the "unchanged" performance group, seasonal
or full-time running status a�ects signi�cantly social-instability constraint levels facing
�rms. Firms operating in full-time complain less loudly than the rest. For two other
groups, the result is also negative but not signi�cant. This outcome is similar to that of
the previous section about �nancial, tax issues and licensing. It suggests weak evidence
that �rms operating in full time face fewer burdens due to business conditional than
137

seasonal �rms as coe�cient are not signi�cant for all regressions.
Infrastructure constraints
Table (4.13) shows how �rm characteristics a�ect the Infrastructural constraint level
facing �rms. Infrastructure constraints include burdens caused by electricity, commu-
nication and postal services, transportation, land for production and business purposes
and emitted water and solid disposal treatment. The results show clearly that the size of
�rms matter signi�cantly constraint level of infrastructure to growth.
The number of employees matters only in the �rst regression of the table. The size
of �rm in term of income level is positively signi�cant in all three regressions. The
results seem to be obvious. Bigger �rms voice louder complaints against infrastructural
conditions.
Regarding other �rm characteristics, the outcome varies greatly amongst the groups
of �rms in terms of �rm performance. In the "growing" group, �rms operating for full
time complaint much less about infrastructural constraints. The age of �rms appears
to be an important determinant of how they evaluate this constraint. The majority of
younger �rms than omitted �rms in the regression complain signi�cantly more about
infrastructure. As for two other groups of �rm performance, the age of �rms is only
signi�cant for those created between 1985 and 1990, in the unchanged performance group.
Again, the River Red Delta seems to be an unfavourable region for �rm growth.
For three regressions, some region dummy variables (the Southeast and North Central
Coast) are negatively signi�cant. This means �rms in these regions complaint less about
infrastructural conditions than �rms in the reference region. It should be noted that
these negative signs are found in several other regional variables, but unfortunately with
no signi�cance. This result, coupled with those in the previous sub-section about social
instability constraints, might suggest that �rms in the River Red Delta are somewhat
more severe about business condition or that business environment of the region is really
less favourable to the development of micro �rm compared to other regions, even though
138

this is one of most economically developed areas of the country.
The e�ect of business sector on how �rms view infrastructural constraints corresponds
to our expectation. Firms in business activities other than industry are less constrained by
infrastructural conditions. Dummy variables for activity sectors are negatively signi�cant
in all three regressions.
For the group of �rms having decrease in turnover, the infrastructural burdens facing
registered �rms are less serious. obviously, we �nd that �rm in urban area complaint less
about this issue at the level of signi�cance of 5 percent.
Regarding home based multiple business activities: we �nd di�erent results amongst
the two groups of �rm performance. In the worst performance group, the decreased
group, �rms in household with one business activity, complain less about infrastructure.
Whilst in the unchanged performance group, �rms complain much more.
5.2 Test of robustness
As presented in the above section, we use a factor analysis process before investigating
the heterogeneity of �rms in regards of the barriers against �rm growth. One might
want to know why we do not run an ordered logit (or probit) regression, as some others
researchers have done, with ordered answer data. Firstly, since many of �rms in our
sample are of "tiny" size. Running a business, in the view of the �rm owners, can be seen
as a way to run out of unemployment. Therefore, they might have less "entrepreneur
spirits" than we thought and fewer concerns about growth constraints. Empirical results
in the table(4.5) seem to con�rm the statement. The share of �rms whose answers are
"irrelevant" or "No hurdle" occupies an important part in our sample. The number of
�rms experiencing "important hurdle" or more serious hurdle is very small in comparison
with other answers. Because of the small number of �rms in some categories, the use
of ordered logit or probit regression is not a suitable solution. For the same reason, the
multinomial logit or probit regression could not be used accept gathering some outcomes.
Secondly, the crucial assumption of this econometric method, the "proportional odds
139

assumption" is not valid with our data. Consequently, OLS regression is used in our
analysis.
For each regression, tests for omitted variable have been run and the results show that
there is no omitted variable in our regression.
One should doubt the endogenous relation between barriers to �rm growth and results
of �rm activities in term of income. For the �rst stage of instrumental variable regression,
we run regression of �rm income on several variables including �rm characteristics and
some geographic variables 8. Most of variables in the income regression are signi�cant and
the test of omitted variable supports the absence of omitted variable in the equation. We
then carry the instrumental variable regression with �rm income as instrumented variable
and the test for endogenous. The result does not support the presence of endogeneity in
our regression.
6 Conclusion
This study examines the problem encountered by �rms in the growth process. Dif-
ferent �rm characteristics are found to play signi�cant roles in determining the level
business constraints which they face and the level of signi�cances vary also along the
type of constraints.
For institutional constraints, the �rm age, regional location and sector of activities
are signi�cant variables which determine the di�erence in the level of hurdles facing �rms
in business operations. Firms in three regions in the North of Vietnam, voice louder
complaints against institutional conditions compared to other regions. Younger �rms
tend to complain less than the older ones in the "unchanged" performance group. Lower
level of constraint is reported by �rms in service activities. However, signi�cant di�erences
are found only in the good performance group.
Regarding �nancial, tax and licensing issues, �rm size in terms of employee number,
including the �rm owner, matters signi�cantly the level of burden encountered by �rms.
8. Details on regression are available by contacting author.
140

Bigger �rms voice louder complaints than smaller �rms, it is important to keep in mind
that they are always MSEs. Consistent with this outcome, registered �rms also report
a higher level of constraints than the non-registered ones. Together with these results,
in the group of good performance �rms, the signi�cant higher level of constraints facing
younger �rms suggests that to some extent, micro and small businesses are not always
the last choice in the carrier to run out of employment. The e�ect of regional location
varies signi�cantly amongst �rm performance groups. Firms in some region complain less
about the "Fin-tax-license" issues; it should be noted that these regions are not those in
the best economically developed areas of the country. This result might imply that policy
makers in these regions have done more than in other regions to encourage the growth of
MSEs and perhaps entrepreneurial growth in general. In the "declining turnover" group,
�rms in whole sale and retail trade and service activities complaint signi�cantly more
than �rms in industrial activities.
With regard to the social instability constraints, signi�cant relationships between �rm
size in terms of employee numbers are found only for "declining" performance group. Big-
ger �rms, in terms of income, tend to complain more about social instability constraints
than smaller �rms. However, the e�ect of size of �rm in terms of the number of em-
ployees, remains unequivocal and needs to be re-examined with a larger sample. In other
groups,the size of �rms is irrelevant determinant in the regression. Still in the "declining"
group, the oldest �rms complain most about social instability but their evaluations were
based on past experience rather than actual realities. Region location of �rms is also an
important determinant of the level of social instability constraints. Firms in the River
Red Delta seem to report high levels of hurdle than �rms in some other regions. Sector
of activities, credit access and full time status play signi�cant role as well in determining
the level of constraints facing �rms. However the degree of signi�cance varies according
to their performance group.
As for the last factor of constraints examined in this analysis, �rm size matters sig-
ni�cantly the constraint levels of infrastructure condition. Bigger �rms voice louder com-
141

plaints against infrastructural burdens. E�ects of other �rm characteristics on the level of
constraints usually varies signi�cantly among the groups. Younger �rms report a higher
level of constraint. Again, the River Red Delta is considered to be a less favourable region
for �rm growth than other regions, especially the Southeast and North central Coast. As
we expect, industrial �rms complaint more about infrastructural condition. The same
tendency is found for in rural areas.
Overall, our �ndings support the idea that the one-size-�ts-all policy is not appropri-
ate for improving the business conditions of MSEs in Vietnam. Policy makers need to
understand the level of constraints facing �rms in each economic regions, each group of
�rms in terms of sector of activity, �rm age, �rm size etc. The result implies also that
MSEs might not only be the last resort of unemployment, but another choice and that
micro and small �rm owners have real concern on the growth of their �rms. Therefore,
more and more research on policies aiming to promoting the growth of MSEs in Vietnam
is necessary.
142

7 Appendix
Table 4.1: Employed population distribution
(Value in percentage)
2000 2001 2002 2003 2004 2005 2006 2007Panel A: Total employed population by ownership
State 9.31 9.34 9.49 9.95 9.88 9.50 9.11 9.00Non-state 89.70 89.49 89.01 88.14 87.83 87.84 87.81 87.52Foreign investment 0.99 1.16 1.49 1.91 2.29 2.66 3.08 3.49
Panel B: Employed population of non-state and foreign sector
Agriculture 71.11 69.35 67.77 66.28 64.60 62.54 60.40 58.74Manufacturing 8.40 9.14 9.65 10.48 11.03 12.00 12.83 13.40Construction 1.88 2.47 2.93 3.14 3.71 3.90 4.35 4.62Wholesale 10.86 11.08 11.43 11.96 12.32 12.50 12.71 12.93Hotels, restaurants 1.92 1.91 1.90 1.92 1.92 1.90 1.90 1.95Transport 2.86 2.80 2.75 2.74 2.68 2.62 2.59 2.50Other services 0.72 0.77 0.92 0.72 0.83 1.17 1.43 1.75Education and training 0.43 0.48 0.57 0.63 0.69 0.73 0.86 0.91Community 1.36 1.42 1.45 1.48 1.54 1.81 2.00 2.16Panel A: Statistics from GSO, Vietnam(www.gso.gov.vn)Panel B: Author's calculation from GSO statistics
143
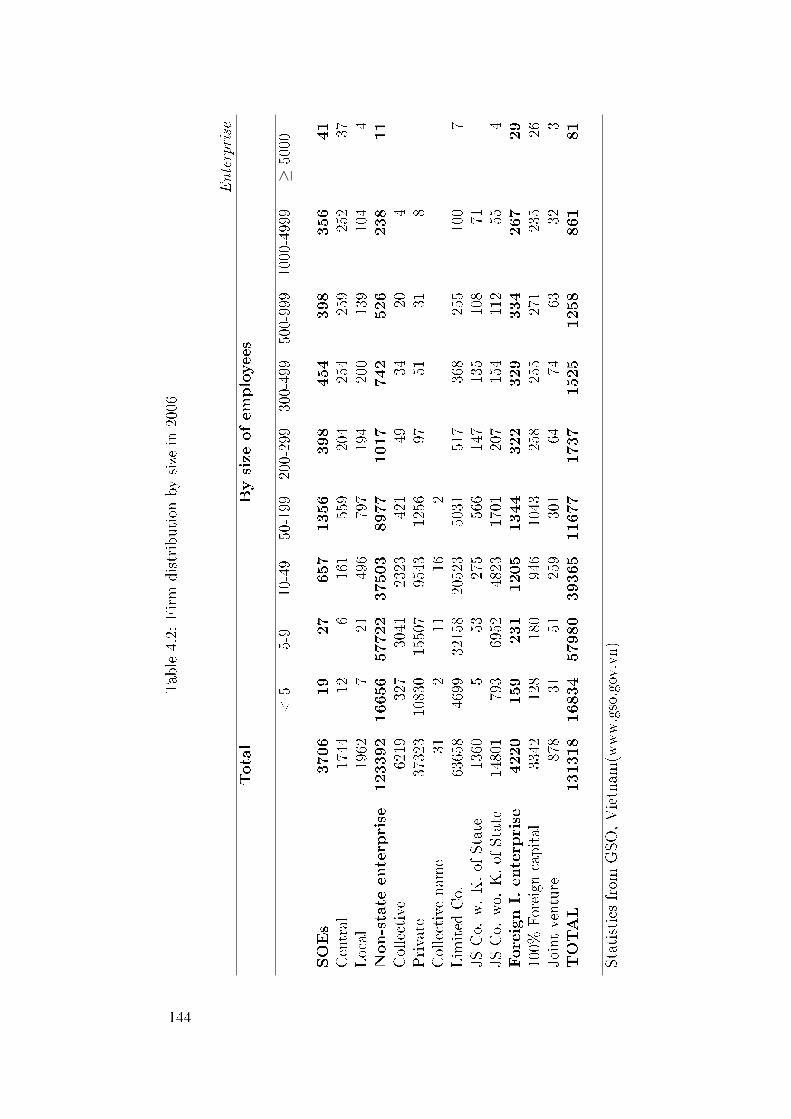
Table4.2:
Firm
distribu
tion
bysize
in2006
Enterprise
Total
Bysize
ofem
ployees
<5
5-9
10-49
50-199
200-299
300-499
500-999
1000-4999
≥5000
SOEs
3706
19
27
657
1356
398
454
398
356
41
Central
1744
126
161
559
204
254
259
252
37Local
1962
721
496
797
194
200
139
104
4Non-state
enterprise
123392
16656
57722
37503
8977
1017
742
526
238
11
Collective
6219
327
3041
2323
421
4934
204
Private
37323
10830
15507
9543
1256
9751
318
Collectivename
312
1116
2Lim
ited
Co.
63658
4699
32158
20523
5031
517
368
255
100
7JS
Co.
w.K.of
State
1360
553
275
566
147
135
108
71JS
Co.
wo.
K.of
State
14801
793
6952
4823
1701
207
154
112
554
ForeignI.enterprise
4220
159
231
1205
1344
322
329
334
267
29
100%
Foreigncapital
3342
128
180
946
1043
258
255
271
235
26Jointventure
878
3151
259
301
6474
6332
3TOTAL
131318
16834
57980
39365
11677
1737
1525
1258
861
81
Statistics
from
GSO
,Vietnam
(www.gso.gov.vn)
144

Table4.3:
Num
berof
�rmsby
type
2000
2001
2002
2003
2004
2005
2006
Enterprise
State
owned
enterprise
5759
5355
5363
4845
4597
4086
3706
Central
2067
1997
2052
1898
1968
1825
1744
Local
3692
3358
3311
2947
2629
2261
1962
Non-state
enterprise
35004
44314
55237
64526
84003
105167
123392
Collective
3237
3646
4104
4150
5349
6334
6219
Private
20548
22777
24794
25653
29980
34646
37323
Collectivename
45
2418
2137
31Lim
ited
Co.
10458
16291
23485
30164
40918
52505
63658
JointstockCo.
having
capitalof
State
305
470
558
669
815
1096
1360
JointstockCo.
without
capitalof
State
452
1125
2272
3872
6920
10549
14801
Foreigninvestm
ententerprise
1525
2011
2308
2641
3156
3697
4220
100%
foreigncapital
854
1294
1561
1869
2335
2852
3342
Jointventure
671
717
747
772
821
845
878
TOTAL
42288
51680
62908
72012
91756
112950
131318
Statistics
from
GSO
,Vietnam
(www.gso.gov.vn)
145

Table4.4:
Net
turnover
in2006
byow
nership
2000
2001
2002
2003
2004
2005
2006
SOEs
54.91
51.24
51.15
46.38
41.21
38.85
35.82
Central
39.13
37.27
39.06
35.13
30.99
30.74
28.75
Local
15.78
13.97
12.08
11.24
10.22
8.11
7.07
Non-state
enterprise
25.09
29.02
30.35
33.57
37.05
39.44
41.96
Collective
1.20
1.12
0.94
0.88
0.67
0.80
0.71
Private
8.78
8.63
7.69
7.22
7.89
7.99
8.15
Collectivename
0.00
0.00
0.23
0.72
0.00
0.00
0.00
Lim
ited
Co.
13.08
15.23
17.01
18.78
20.61
20.52
21.25
JSCo.
w.capitalof
State
1.27
2.45
2.46
2.96
3.64
4.81
5.13
JSCo.
wo.
capitalof
State
0.76
1.59
2.03
3.01
4.23
5.31
6.70
Foreigninvestm
ententerprise
20.00
19.74
18.50
20.05
21.74
21.71
22.22
100%
Foreigncapital
7.34
8.01
8.00
9.00
10.74
10.99
12.31
Jointventure
12.66
11.73
10.51
11.05
11.01
10.71
9.92
TOTAL
100.00
100.00
100.00
100.00
100.00
100.00
100.00
Statistics
from
GSO
,Vietnam
(www.gso.gov.vn)
146

Table4.5:
Firm
owners'evaluation
ofconstraintsto
grow
thIrrelevant
Unknown
Nohurdles
Smallhurdles
Notew
orthyHurdles
Major
Hurdles
SeriousHurdles
Total
var-a
298
222023
344
114
5515
2871
b472
372086
212
4314
52869
c260
291768
505
220
7415
2871
d403
371892
306
146
739
2866
e544
651944
241
4821
22865
f562
103
1694
323
131
455
2863
g595
113
1820
262
4721
42862
h329
741957
358
9748
62869
i350
112
2090
253
4015
52865
j526
138
2049
129
136
22863
k438
107
1730
429
124
325
2865
l780
215
1708
122
248
72864
m606
244
1567
311
104
285
2865
n607
326
1516
279
105
274
2864
o804
234
1606
141
4320
162864
p445
114
1590
444
169
7528
2865
q305
145
1424
576
264
121
302865
Questionto
identify
thedegree
ofconstraint
facing
�rms:
how
does
thefollowingpreventtheoperationanddevel-
opmentof
thisactivity?Var-a:electricity;
Var-b:commun
icationandpostal
services;Var-c:transportation;Var-d:
land
forproduction
andbu
siness
purpose;Var-e:em
ittedwater
andsolid
disposal
treatm
ent;V
ar-f:�n
ancial
access
;Var-g:�n
ancial
expend
itures;Var-h:taxes;Var-i:bu
siness
registration
andoperationlicense;Var-j:laborregula-
tion;V
ar-k:skill
andeducationlevelofw
orker;Var-l:tradingandcustom
erregulation;V
ar-m
:inconsistent
econom
icpolicies;Var-n:instability
ofthemacro
econom
y;Var-o:corrup
tion;V
ar-p:crim
eandlack
ofsecurity;V
ar-q:un
fair
andun
healthycompetition.
147

Figure 4.1: Eigen value plot
148

Table 4.6: Simple correlation of constraints to �rm growthvar-a var-b var-c var-d var-e var-f var-g var-h
var-b 0.41 1var-c 0.2261 0.3939 1var-d 0.2913 0.3716 0.3022 1var-e 0.305 0.4144 0.2578 0.4452 1var-f 0.2313 0.3916 0.2703 0.3605 0.4436 1var-g 0.2552 0.466 0.2542 0.3637 0.4747 0.6751 1var-h 0.2489 0.3003 0.2887 0.3019 0.3541 0.4357 0.4425 1var-i 0.2615 0.3697 0.2392 0.3197 0.3946 0.4231 0.4588 0.6182var-j 0.2909 0.4442 0.2693 0.3481 0.4684 0.4486 0.5008 0.3736var-k 0.3106 0.3777 0.3163 0.3199 0.3409 0.3724 0.3804 0.2611var-l 0.2111 0.4181 0.2468 0.2679 0.4491 0.4449 0.5277 0.3571var-m 0.2608 0.3922 0.2888 0.3366 0.4285 0.4013 0.4373 0.3757var-n 0.2672 0.3971 0.2941 0.3551 0.3846 0.3984 0.434 0.3648var-o 0.2244 0.4164 0.2246 0.2976 0.4066 0.4033 0.4579 0.3087var-p 0.2316 0.3585 0.3445 0.3439 0.3254 0.3278 0.3079 0.3493var-q 0.2155 0.3113 0.3652 0.3016 0.2922 0.3176 0.3051 0.3627
var-i var-j var-k var-l var-m var-n var-o var-p
var-j 0.4844 1var-k 0.3043 0.49 1var-l 0.4133 0.6174 0.3918 1var-m 0.3849 0.4738 0.4409 0.5819 1var-n 0.3339 0.4337 0.4006 0.5354 0.6707 1var-o 0.356 0.506 0.3805 0.578 0.5389 0.5806 1var-p 0.3354 0.3116 0.3232 0.3362 0.4823 0.4652 0.5077 1var-q 0.3238 0.2621 0.3607 0.2367 0.4562 0.4241 0.352 0.61
See explication in table 4.5 for de�nition of items
149

Table 4.7: Rotated factor loadings and unique variancesItem Institution Fin-Tax-license Social instability Infra Uniqueness
var-a 0.1622 0.1726 0.1766 0.4201 0.7362var-b 0.3486 0.2502 0.2241 0.4885 0.527var-c 0.1313 0.1749 0.3611 0.3411 0.7054var-d 0.2177 0.2698 0.2622 0.3889 0.6598var-e 0.3938 0.3536 0.1572 0.3454 0.5759var-f 0.3883 0.5313 0.1267 0.2294 0.4982var-g 0.4731 0.5424 0.0751 0.2487 0.4145var-h 0.1908 0.6274 0.298 0.0568 0.4779var-i 0.2624 0.6301 0.2151 0.1092 0.4759var-j 0.584 0.3534 0.0712 0.2945 0.4423var-k 0.3979 0.1707 0.2471 0.3561 0.6247var-l 0.728 0.2811 0.0853 0.1187 0.3697var-m 0.6289 0.1789 0.4204 0.0999 0.3858var-n 0.6152 0.1458 0.4176 0.1108 0.4136var-o 0.6529 0.1679 0.3046 0.1006 0.4426var-p 0.3003 0.1685 0.655 0.1165 0.4388var-q 0.1835 0.2045 0.6622 0.1324 0.4684
See explication in table 4.5 for de�nition of items
150

Table 4.8: Descriptive statistics of the sampleVariables Min Max Mean SD Obs.
INSTITUTION -2.567 5.773 -0.013 0.846 1949FIN-TAX-LICENSE -3.007 4.955 -0.019 0.795 1949SOCIAL DESTAB. -1.989 3.869 0.002 0.790 1949INFRA -2.623 3.808 -0.002 0.683 1949Income (log scale) 4.143 12.830 8.950 1.127 1948LogNumber 0 4.625 0.359 0.541 1947
Value Freq. PercentRegistered 0 (No) 1903 75.49
1 (Yes) 618 24.51Credit access 0 (No) 2281 90.48
1 (Yes) 240 9.52Rural 0 (No) 1672 66.32
1 (Yes) 849 33.68Full time operating 0 (No) 778 30.86
1 (Yes) 1743 69.14Firm age 1944-1980 113 5.82
1981-1985 103 5.31986-1990 213 10.961991-1995 496 25.531996-1999 622 32.012000-2002 396 20.38
Economic region River Red Delta 495 25.41Northeast 221 11.34Northwest 35 1.8
North Central Coast 234 12.01South Central Coast 208 10.68Central High Land 114 5.85
Southeast 297 15.25Mekong river Delta 344 17.66
Sector Industrial 643 33.01Whole sale and retail trade 895 45.94
Service 410 21.05Growth Growing 961 49.33
Unchanged 706 36.24Declining 281 14.43
151

Table 4.9: Average value of constraints level by �rm performance status
Growth status INS. FIN-TAX-License SOC. DESTAB. INFRA
Growing 0.0264 0.0468 0.0453 0.04390.2432 -0.0610 -0.2542 -0.1124
Unchanged -0.0743 -0.1100 -0.0565 -0.04680.2432 -0.0610 -0.3772 -0.1124
Declining 0.0056 -0.0136 0.0036 -0.04940.2769 -0.0610 -0.2938 -0.1124
Total -0.0131 -0.0188 0.0023 -0.00240.2432 -0.0610 -0.2964 -0.1124
INS: Institution; SOC-DESTAB. : Social instability; INFRA: InfrastructureStandard deviation in normal character
152

Table 4.10: Institutional constraintsVariables Growing Unchanged DecliningLogNumber 0.04 [0.0649] 0.06 [0.0796] -0.113 [0.1178]
Income 0.007 [0.0360] 0.046 [0.0397] 0.033 [0.0562]
Registered 0.096 [0.0693] 0.053 [0.0958] 0.115 [0.1268]
Credit access 0.038 [0.0960] -0.094 [0.1221] 0.125 [0.1340]
Rural -0.097 [0.0607] 0.016 [0.0723] -0.05 [0.1084]
Single -0.072 [0.0844] 0.084 [0.0958] -0.149 [0.1542]
Full-time -0.089 [0.0740] -0.027 [0.0799] -0.119 [0.1311]
Firm-age: �rms created before 1980 are omittedFirmage 1981-1985 0.297* [0.1725] 0.313* [0.1609] 0.291 [0.2478]
Firmage 1986-1990 0.224 [0.1576] 0.119 [0.1619] 0.212 [0.2455]
Firmage 1991 -1995 0.148 [0.1478] 0.208 [0.1385] 0.012 [0.2055]
Firmage 1996-1999 0.225 [0.1477] 0.238* [0.1351] -0.112 [0.2123]
Firmage 2000-2002 0.201 [0.1480] 0.342** [0.1398] -0.064 [0.2303]
Economic region: The River Red Delta is omittedNortheast 0.174* [0.1031] 0.091 [0.1192] -0.199 [0.1926]
Northwest 0.253* [0.1331] -0.314 [0.2204] -0.179 [0.2374]
North Central Coast 0.176* [0.1028] -0.116 [0.1018] 0.407** [0.1998]
South Central Coast -0.041 [0.0915] -0.167 [0.1147] -0.064 [0.1650]
Central High Land 0.158 [0.1000] -0.022 [0.1334] -0.378 [0.2724]
Southeast -0.062 [0.0995] -0.082 [0.1041] -0.207 [0.1487]
Mekong River Delta -0.024 [0.0864] -0.063 [0.0996] -0.267* [0.1554]
Economic sector: The industrial sector is omittedWhole sale and retail -0.101 [0.0779] 0.008 [0.0732] -0.127 [0.1198]
Service -0.275*** [0.0930] -0.142 [0.0941] -0.168 [0.1606]
Constant 0.072 [0.3668] -0.720* [0.3889] 0.193 [0.5831]
R-squared 0.016 0.003 0.029N 958 702 280Omitted variable test
* p<0.1, ** p<0.05, *** p<0.01
153

Table 4.11: FIN-TAX-License constraintsVariables Growing Unchanged DecliningLogNumber 0.193*** [0.0641] -0.168 [0.1555] 0.302*** [0.1136]
Income 0.000 [0.0357] 0.032 [0.0324] 0.038 [0.0619]
Registered 0.286*** [0.0648] 0.424*** [0.0748] 0.325** [0.1329]
Credit access 0.105 [0.0929] 0.017 [0.1218] -0.054 [0.1863]
Rural -0.077 [0.0559] -0.033 [0.0628] -0.007 [0.1056]
Single -0.018 [0.0744] -0.035 [0.0812] -0.046 [0.1319]
Full-time -0.051 [0.0705] 0.046 [0.0655] -0.014 [0.1271]
Firm-age: �rms created before 1980 are omittedFirmage 1981-1985 0.255 [0.1723] 0.02 [0.1242] 0.036 [0.2732]
Firmage 1986-1990 0.239 [0.1647] 0.042 [0.1379] 0.167 [0.2329]
Firmage 1991 -1995 0.218 [0.1560] 0.065 [0.1133] 0.29 [0.2395]
Firmage 1996-1999 0.317** [0.1570] 0.005 [0.1122] 0.219 [0.2524]
Firmage 2000-2002 0.313* [0.1610] 0.104 [0.1136] 0.416* [0.2466]
Economic region: The River Red Delta is omittedNortheast -0.114 [0.0987] -0.031 [0.0925] -0.005 [0.1331]
Northwest -0.332** [0.1362] -0.600*** [0.2206] 0.537** [0.2665]
North Central Coast -0.147* [0.0885] -0.067 [0.0880] 0.122 [0.1678]
South Central Coast -0.189* [0.0968] -0.019 [0.0915] 0.019 [0.1388]
Central High Land 0.011 [0.1146] -0.119 [0.1077] 0.415 [0.3686]
Southeast -0.125 [0.0886] 0.039 [0.0954] -0.043 [0.1491]
Mekong River Delta 0.001 [0.0816] -0.021 [0.0851] 0.022 [0.1734]
Economic sector: The industrial sector is omittedWhole sale & retail 0.054 [0.0714] 0.049 [0.0639] 0.229* [0.1243]
Service 0.024 [0.0834] 0.019 [0.0813] 0.055 [0.1329]
LogNumber2 0.228* [0.1214]
Constant -0.177 [0.3600] -0.48 [0.3263] -0.869 [0.6398]
R-squared 0.062 0.106 0.088N 958 702 280Omitted variable test
* p<0.1, ** p<0.05, *** p<0.01
154

Table 4.12: Social instability constraints
Variables Growing Unchanged DecliningLogNumber -0.023 [0.0563] -0.027 [0.0701] -0.219* [0.1208]
Income 0.051 [0.0354] -0.067 [0.2680] 0.117* [0.0634]
Registered 0.099 [0.0656] 0.112 [0.0875] 0.162 [0.1223]
Credit access 0.185* [0.1002] -0.138 [0.1101] 0.004 [0.1417]
Rural 0.021 [0.0582] -0.015 [0.0660] -0.121 [0.1084]
Single -0.033 [0.0743] -0.085 [0.0900] -0.063 [0.1439]
Full-time -0.067 [0.0693] -0.157* [0.0808] -0.006 [0.1008]
Firm-age: �rms created before 1980 are omittedFirmage 1981-1985 0.090 [0.2007] -0.016 [0.1311] -0.531** [0.2406]
Firmage 1986-1990 0.055 [0.1535] 0.143 [0.1478] -0.529*** [0.1980]
Firmage 1991 -1995 -0.067 [0.1415] 0.147 [0.1102] -0.607*** [0.1829]
Firmage 1996-1999 -0.038 [0.1415] 0.062 [0.1040] -0.522*** [0.1807]
Firmage 2000-2002 0.034 [0.1464] 0.030 [0.1125] -0.443** [0.1937]
Economic region: The River Red Delta is omittedNortheast -0.269*** [0.0872] -0.012 [0.1153] -0.021 [0.1920]
Northwest -0.314** [0.1287] 0.297 [0.2710] -0.789*** [0.1919]
North Central Coast -0.221** [0.0955] -0.198* [0.1034] 0.173 [0.1850]
South Central Coast -0.273*** [0.0982] -0.381*** [0.0958] -0.114 [0.1415]
Central High Land -0.239** [0.1008] -0.138 [0.1315] 0.174 [0.2235]
Southeast -0.297*** [0.0913] -0.373*** [0.0906] -0.339** [0.1399]
Mekong River Delta -0.243*** [0.0868] -0.256*** [0.0881] -0.101 [0.1485]
Economic sector: The industrial sector is omittedWhole sale & retail 0.201*** [0.0712] 0.210*** [0.0672] 0.027 [0.1262]
Service 0.035 [0.0800] 0.110 [0.0779] -0.044 [0.1563]
Income2 0.012 [0.0165]
Constant -0.328 [0.3456] -0.172 [1.0704] -0.168 [0.6079]
R-squared 0.028 0.069 0.034N 958 702 280Omitted variable test
* p<0.1, ** p<0.05, *** p<0.01
155

Table 4.13: Infrastructure constraints
Variables Growing Unchanged DecliningLogNumber 0.147*** [0.0519] 0.08 [0.0658] 0.083 [0.0859]
Income 0.053* [0.0318] 0.088*** [0.0320] 0.081* [0.0471]
Registered 0.000 [0.0598] -0.072 [0.0724] -0.172* [0.0953]
Credit access 0.062 [0.0733] 0.125 [0.1190] 0.035 [0.0989]
Rural 0.050 [0.0501] 0.041 [0.0606] 0.211** [0.0915]
Single -0.099 [0.0707] 0.114* [0.0689] -0.250* [0.1323]
Full-time -0.148** [0.0612] -0.024 [0.0612] 0.066 [0.1066]
Firm-age: �rms created before 1980 are omittedFirmage 1981-1985 0.399*** [0.1277] 0.252** [0.1058] -0.262 [0.2266]
Firmage 1986-1990 0.159 [0.1179] 0.078 [0.1283] -0.253 [0.2124]
Firmage 1991 -1995 0.251** [0.1038] 0.108 [0.0952] 0.007 [0.1944]
Firmage 1996-1999 0.272*** [0.1026] 0.12 [0.0941] 0.05 [0.2027]
Firmage 2000-2002 0.248** [0.1033] 0.034 [0.0985] -0.079 [0.2024]
Economic region: The River Red Delta is omittedNortheast -0.084 [0.0820] -0.049 [0.1074] -0.089 [0.1458]
Northwest 0.239 [0.1799] -0.258 [0.1680] 0.133 [0.2210]
North Central Coast -0.038 [0.0812] -0.111 [0.0801] 0.022 [0.1515]
South Central Coast 0.016 [0.0848] -0.148* [0.0867] 0.184 [0.1266]
Central High Land 0.011 [0.0759] -0.186 [0.1158] -0.115 [0.2437]
Southeast -0.132* [0.0783] -0.177** [0.0844] -0.16 [0.1222]
Mekong River Delta -0.083 [0.0722] -0.111 [0.0737] -0.093 [0.1285]
Economic sector: The industrial sector is omittedWhole sale & retail -0.203*** [0.0645] -0.129** [0.0575] -0.243** [0.0967]
Service -0.144* [0.0743] -0.149** [0.0666] -0.252** [0.1190]
Constant -0.468 [0.3177] -0.889*** [0.3240] -0.667 [0.4447]
R-squared 0.055 0.026 0.07N 958 702 280Omitted variable test
* p<0.1, ** p<0.05, *** p<0.01
156

Chapitre 5
General conclusion
This thesis emphasizes the development of non farm micro enterprises in Vietnam
from the worker's choice to become entrepreneur to the identi�cation of determinants of
constraint level to �rm growth.
In the chapter 2, we identify empirically the determinants of self-employment sup-
ply in the Vietnamese labour market. This is not a very new issue in literature but the
pattern of micro �rm in developing countries should not be as close to that which is
described in the mainstream literature, often consists of empirical evidence in developed
countries. We refer to the structural approach in which the earnings di�erentials of wor-
kers are introduced in the model as an explicative variable. The two stage econometric
method of Heckman is used to estimate the participation function of workers in the self-
employment sector. The alternative is the salaried sector. We �rst estimate the income
equation of workers in both sectors (correcting for selection bias) : self-employment and
salaried employment and calculate the earnings di�erentials of each individual. Next, this
is introduced in the structural equation. The analysis is carried out separately for male
and female workers as we �nd signi�cant di�erence between men and women which can
not be represented by a simple dummy variable in the model. Our results show that, pecu-
niary gain is a signi�cant factor which encourages the participation of male workers into
self-employment sector in Vietnam. In contrast, this seems not to be the objective of fe-
male worker choosing self-employment sector. Also, educational level has a negative e�ect
157

on the choice of male workers. The higher the educational level, the lower the probability
is to become self-employed. Age also plays a signi�cant role in the choice of male worker.
The propensity to become self-employed is higher for older workers. Regarding, female
workers, the number of dependant children plays a positive in�uence on the propensity
to participate in the self-employment sector. Furthermore, the importance of e�ect di�ers
with the age of children. Our study provides a basis for understanding the determinants
of self-employment. This might be helpful for authorities to making adequate policies in
the sector.
Chapter 3 proposes an empirical analysis of factors which may a�ect the performance
of micro �rms in Vietnam. The relationship between �rm characteristics and �rms growth
or performance have been largely analysed in the literature of entrepreneurship. However,
most have often been carried out on sizable enterprises rather than �rms of micro size.
The micro unit of business, which, in a large number of cases, have several employees,
from 1 to 5 including �rm owner have been mentioned less. We carry out our analysis
on a sample of micro and small �rms, of which an important number are informal. Our
�ndings show that the size of �rm, in terms of income level, positively a�ects growth.
While, in terms of employee numbers, the e�ect on growth depends on the equation
speci�cation. This result implies, to a certain extent, that bigger �rms tend to be in a
more favourable state of growth than the smaller in the group of micro and small �rms.
The reason may be that owners of the larger �rms are more concerned by the growth of
their �rms, so make more e�ort to grow, while owners of the smaller ones would have less
�entrepreneurial spirit�, and therefore, may be less concerned by the development of their
businesses. We �nd also that younger �rms tend to have better performance levels than
older ones. The e�ect of the informal status is rather weak. However, informal �rms seem
to be in the worst state of growth compared to two other alternative groups. Geographical
location signi�cantly a�ects the growth state of �rms. Firms in rural areas report better
performance than �rms in urban areas. The �rm performance also varies across industrial
sectors.
158

In recent years, development of micro �rms has received a great concern of policy
makers in both developed and developing countries. Literature on determinants of �rm
growth and performance could provide a rich framework for policy making. It is obvious
that an enormous number of researches have been carried on �rms in developed countries,
but, increasing attention has also been paid on �rms in developing countries. The chapter
4 of this thesis provides a complementary analysis which may be helpful for policy ma-
kers in the context where the �one size �ts all policy� is in question. We investigate the
heterogeneity of �rm across constraints to �rm growth. The main hypothesis is that faced
with growth barriers, �rms bear di�erent levels of hurdles as each one is di�erent. Our
empirical �ndings suggest that �rms do not encounter the same level of constraints of
growth barriers. This varies according �rm characteristics, industrial sector and geogra-
phical location. The size of �rms matters signi�cantly in the level of constraints caused by
�nancial, tax and licensing factor and by infrastructure factor. Bigger �rms tend to voice
louder complaint than smaller �rms. The empirical evidences show that younger �rms
complain less about institutional and social disability burdens but more about �nancial,
tax and licensing issues. The level of burden depends also on the business sector of �rms.
Firms in service sector present less complaint against institutional barriers and regarding
infrastructural condition, �rms in industrial sector tend to voice louder complaint. The
level of hurdle reported by �rms varies also signi�cantly among geographical regions.
Empirical results imply, to some extent, that among micro and small �rms, bigger
and younger �rm's owners tend to have more �entrepreneurial spirit� as they are more
concerned with their business environment. Furthermore, it is suggested that micro �rms,
particularly informal �rms have more di�culties in accessing growth support from both
the government or private institutions.
Overall, our �ndings support the idea that the one-size-�ts-all policy is not appro-
priate for improving the business conditions of MSEs in Vietnam. Policy makers needs to
understand the constraint level facing �rms in each economic regions, each group of �rms
in terms of sector of activity, the age and size of the �rm etc. The result implies also that
159

MSEs might not only be the last resort of unemployment, but a career choice and that
micro and small �rm owners have real concern on the growth of their �rms. Therefore,
more researches on policies aiming to promoting the growth of MSEs are necessary in
Vietnam.
160

Bibliographie
[1] Z. Acs and D. B. Audretsch. Innovation and small �rms. Cambridge Mass : The
MIT Press, 1990.
[2] Z. J Acs, S. Desai, and J. Hessels. Entrepreneurship, economic development and
institutions. Small Business Economics, 31 :219�234, 2008.
[3] P. Adair. L'emploi informel en Agérie : évolution et segmentation du marché du
travail. Cahier du GRATICE 22, Université Paris XII, 2002.
[4] P. Adair. Economie non observée et emploi informel dans les pays de l'Union euro-
péenne. une comparaison des estimations et des déterminants. Revue économique,
60(5) :1117�1153, 2009.
[5] P. Almeida and B. Kogut. The exploration of technological diversity and the geo-
graphic localization of innovation. Small Business Economics, 9(1) :21�31, 1997.
[6] R. Alvarez and G. Crepsi. Determinants of technical e�ciency in small �rms. Small
business economics, 20 :233�244, 2003.
[7] B. C. Arimah. Nature and determinants of linkages between formal and informal
sector in Nigeria. African Development Review, 13(1) :114�144, 2001.
[8] B.V. Arkadie and D.D. Do. Economic reform in Tanzania and Vietnam : A compa-
rative commentary. William Davidson Institute Working Papers Series 2004-706,
William Davidson Institute at the University of Michigan Stephen M. Ross Business
School, 2004.
[9] S. Arvanitis. The impact of �rm size on innovative activity�an empirical analysis
based on swiss �rm data. Small Business Economics, 9(6) :473�490, 1997.
161

[10] D. Audretsch. Innovation, growth and survival. International journal of industrial
organization, 13 :441�457, 1995.
[11] D. B. Audretsch, M. C. Keilbach, and E. E. Lehmann. Entrepreneurship and eco-
nomic growth. New York : Oxford University Press, 2006.
[12] P. Au�ret. Trade reform in Vietnam : opportunities with emerging challenges.
Policy Research Working Paper Series 3076, The World Bank, 2003.
[13] J. Babetski, A. Kolev, and M. Maurel. The Kyrgyz labour market in the late 1990s :
The challenge of formal job creation. Journal of Comparative Studies, 2004.
[14] J. R. Baldwin. Were small producers the engines growth in the canadian manufac-
turing sector in 1980s ? Small Business Economics, 10(4) :349�364, 1998.
[15] F. Bari, Ali Cheema, and Ehsan ul Haque. Barriers to SME growth in Pakistan :
An analysis of constraints. A study conducted for the Asian Development Bank,
Lahore University of management sciences (LUMS), 2002.
[16] W. Bartlett and V. Bukvic. Barriers to SMEs in Slovenia. MOCT-MOST : Econo-
mic Policy in Transitional Economies, 11(2) :177�195, 2001.
[17] T. Beck, A. Dermirguc-Kunt, and R. Levine. SMEs, growth and poverty : Cross-
country evidence. Journal of Economic Growth, 10(3) :199�229, 2005.
[18] A. Ben-Ner, J. M. Montias, and E. Neuberger. Basic issues in organizations : A
comparative perspective. Journal of Comparative Economics, 17(2) :207�242, June
1993.
[19] I. Bernhardt. Comparative advantage in self-employment and paid work. Canadian
Journal of Economics, 27 :273�289, 1994.
[20] A. Bigsten and M. Gebreeyesus. The small, the young, and the productive : De-
terminants of manufacturing �rm growth in Ethiopia. Economic Development and
Cultural Change, 55 :813�840, 2007.
[21] D.G. Blanch�ower and A.J.Oswald. What makes an entrepreneur ? Journal of
labour Economics, 16 :26�60, 1998.
162
[22] G. J. Borjas and S. G. Bronars. Consumer discrimination and self-emloyment.
Journal of Political Economy, 97 :581�605, 1989.
[23] C. Brassard. Wage and labour regulation in Vietnam within the poverty reduction
agenda. Policy and Society, 23 :49�77, 2004.
[24] C. Brown and J. Medo�. The employer size wage e�ect. Journal of political Eco-
nomy, 97(4) :1027�1059, 1989.
[25] C. Brown and J. L. Medo�. Firm age and wages. Journal of Labor Economics,
21(3) :677�697, 2003.
[26] J.D. Brown, J.S. Earle, and D. Lup. What makes small �rms grow ? �nance, human
capital, technical assistance, and the business environment in romania. Economic
Development and Cultural Change, 54(1) :33�70, 2005.
[27] A. A. Burki and D. Terrel. Measuring production e�ciency of small �rm in pakistan.
World Development, 26(1) :155�169, 1998.
[28] D. Canning and P. Pedroni. Infrastructure, long-run economic growth and causality
test for cointegrated panel. The Manchester School, 76(5) :504�527, 2008.
[29] M. Carree and A. Thurik. Small �rms and economic growth in europe. Atlantic
Economic Journal, 26(2) :137�146, June 1998.
[30] L. Castany, E. López-Bazo, and R. Moreno. Di�erences in total factor productivity
across �rm size - a distributional analysis. Technical Report ersa05p115, European
Regional Science Association, August 2005.
[31] R. E. Caves and D. R. Barton. E�ciency in US manufacturing industries. MIT
Press, Cambridge (Mass), 1990.
[32] A. Coad. Firm growth : a survey. Documents de travail du Centre d'Economie de
la Sorbonne 07024, Université Panthéon-Sorbonne (Paris 1), Centre d'Economie de
la Sorbonne, May 2007.
163

[33] A. Coad and J.P. Tamvada. The growth and decline of small �rms in developping
countries. Papers on economics and evolution, Max Planck Institute of Economics,
Evolutionary Economics Group, 2008.
[34] A. Constant and K. F. Zimmermann. The making of entrepreneurs in germany :
Are native men and immigrant alike ? Small Business Economics, 26 :279�300,
2006.
[35] A.C. Cooper, F. J. Gimeno-Gacson, and C.Y. Woo. Initial human and �nancial
capital as predictors of new venture performance. Journal of Business Venturing,
9 :371�395, 1994.
[36] J. G. Covin and D. P. Slevin. Strategic management of small �rms in hostile and
benign environment. Strategic Management Journal, 10(1) :75�87, Jan-Feb 2008.
[37] J.S. Cramer, J. Hartog, N. Jonker, and C. M. Van Praag. Low risk aversion en-
courages the choice for entrepreneurship : an empirical test of a truism. Journal of
Economic Behavior & Organization, 48 :29�36, 2002.
[38] S. Das. Size, age and �rm growth in an infant industry : The computer hardware
industry in india. International journal of Industrial Organization, 13 :111�126,
1995.
[39] S. J. Davis, J. Haltiwanger, and S. Schuh. Small business and job creation : Dissec-
ting the myth and reassessing the facts. Small Business Economics, 8(4) :297�315,
August 1996.
[40] G. de Wit. Model of self-employment in a competitive market. Journal of Economic
Surveys, 7 :367�397, 1993.
[41] G. Destré and V. Henrard. The determinants of occupational choice in colombia :
an empirical analysis. Cahiers de la Maison des Sciences Economiques, Maison des
Sciences Economiques, Université Paris 1 Panthéon-Sorbonne, 2004.
[42] P. H. Dick and K. M. Weaver. The role of the institutional environment in de-
termining �rm orientations toward entrepreneurial behavior. The International
Entrepreneurship and Management Journal, 4(4) :467�483, December 2008.
164

[43] D. Dollar, M. Hallward-Driemeier, and T. Mengistae. Investment climate and �rm
performance in developing economies. Economic Development and Cultural Change,
54(1) :1�31, 2005.
[44] B. Egert, T. J. Kozluk, and D. Sutherland. Infrastructure and growth : Empirique
evidence. Working Paper 685, OECD Economics Department, 2009.
[45] R. Ericson and A. Pakes. Markov-perfect industry dynamics : a framework for
empirical work. Review of Economic Studies, 62 :53�82, 1995.
[46] D.S. Evan and B. Jovanovic. An estimated model of entrepreneurial choice under
liquidity constraints. Journal of Political Economy, 79 :808�827, 1989.
[47] D. S. Evans. The relationship between �rm growth, size and age : estimates for
100 manufacturing industries. The journal of industrial economics, 35(4) :567�581,
1987a.
[48] D. S. Evans. Test alternative theories of �rm growth. The journal of political
economy, 97(4) :657�674, 1987b.
[49] D.S. Evans and L. S. Leighton. Some empirical aspect of entrepreneurship. Ame-
rican Economic Review, 79 :519�535, 1989.
[50] R. W. Fairlie and A. Robb. Families, human capital and small business : Evidence
from the characteristics of business owners survey. IZA discussion paper 1296,
Institute for the study of Labor, IZA, September 2004.
[51] P. Fajnzylber, W. Maloney, and G. M. Rojas. How similar are they to those in
the industrialized world ? Evidence from Mexico. World Bank Economic Review,
20(3) :389�419, 2006.
[52] P. Fajnzylber, W. Maloney, and G. M. Rojas. Releasing constraints to growth
or pushing on a string ? The impact of credit, training, business associations and
taxes on the performance of Mexican micro- �rms. Working Paper 3807, World
Bank Policy Research, 2006b.
165

[53] Centre for International Economics (Australia) and Australian Agency for Interna-
tional Development. Vietnam poverty analysis [electronic resource] / prepared for
the Australian Agency for International Development by the Centre for Internatio-
nal Economics. AusAID, Canberra, 2002.
[54] N. Freeman, V. L. Nguyen, and H. N. Nguyen. Beyond the headline numbers :
Business registration and start up in vietnam. IFC, MPDF (Mekong private sector
development facility), PSDP, (20), 2005.
[55] C. C. Gallagher and H. Stewart. Jobs and the business life-cycle in the uk. Applied
Economics, 18(8) :875 � 900, August 1986.
[56] R. Gibrat. Les Inégalités Economiques. Paris : Librairie du Recueil, 1931.
[57] A.M. Gill. `choice of employment status and the wages of employees and the self-
employed : some further evidence'. Journal of applied econometrics, 3 :229�234,
1988.
[58] W. H. Greene. Econometric Analysis 5thed. Upper Saddle River, NJ : Prentice
Hall, 2003.
[59] GSO. Vietnam Household Living standards Survey 2004. General Statistics O�ce
of Vietnam, 2004. Vietnam.
[60] M. Gumbau-Albert and J. Maudos. The determinants of e�ciency : the case of the
Spanish industry. Applied Economics, 34(15) :1941�1948, 2002.
[61] H. Hansen, J. Rand, and F. Tarp. Sme growth and survive in vietnam : did di-
rect government support matter ? Discussion Paper 04-13, Institute of Economics,
University of Copenhagen, 2004.
[62] D. Harho�, K. Stahl, and M. Woywode. Legal form, growth and exit of west german
�rm- empirical results for manufacturing construction, trade and service industries.
The Journal of industrial economics, XLVI(4) :453�488, 1998.
[63] J. Hausman and D. Mcfadden. Speci�cation tests for the multinomial logit model.
Econometrica, 52(5) :1219�1240, 1984.
166

[64] J.J. Heckman. Sample selection bias as a speci�cation error. Econometrica, 47 :153�
161, 1979.
[65] J.J. Heckman and G. Sedlacek. Heterogeneity, aggregation, and market wage func-
tions : an empirical model of self-selection in the labor market. Journal of Political
Economy, 93 :1077�1125, 1985.
[66] J.J. Heckman and G. Sedlacek. Self-selection and the Distribution of hourly wages.
Journal of labour economics, 8 :S329�S363, 1990.
[67] M. Hemlin, B. Ramamurthy, and P. Ronnås. The anatomy and dynamics of small
scale private manufacturing in vietnam. Working Paper Series in Economics and
Finance, 236, 1998.
[68] A. Heshmati. On the growth of micro and small �rms : Evidence from sweden.
Small business economics, 17 :213�228, 2001.
[69] S. Holmes and I. Zimmer. The nature of the small �rm : understanding the moti-
vations of growth and non-growth oriented owners. Australian Journal of Manage-
ment, 19(1) :97�120, June 1994.
[70] E. Ishengoma. Firm�s resources as determinants of manufacturing e�ciency in
Tanzania : Managerial and econometric approach. Technical report, Hamburg :
LIT Verlag., 2005.
[71] A. E. Jackle and C. A. Li. Firm dynamics and institutional participation : A case
study on informality of micro-enterprises in P]eru, year=2003, month=, institu-
tion=University of Essex, Department of Economics, type=Economics Discussion
Papers, number=552, abstract=, keywords=. Technical report.
[72] E. Johansson. Self-employment and the predicted earnings di�erential-evidence
form Finland. Finnish Economic Paper, 13 :45�55, 2000.
[73] S. Johnson, J. McMillan, and C. Woodru�. Property rights, �nance, and entrepre-
neurship. EBRD Working Paper 43, EBRD, 1999.
167
[74] S. Johnson, J. McMillan, and C.M. Woodru�. Entrepreneur and ordering of institu-
tional reform Poland, Slovakia, Romania, Russia and Ukrain compared. Economic
of transition, 8(1) :1�36, 2000.
[75] B. Jovanovic. Selection and the evolution of industry. Econometrica, 50 :649�670,
2003.
[76] P. Justino and J. Litch�eld. Welfare in vietnam during the 1990s : Poverty, inequa-
lity and poverty dynamics. PRUS Working Papers 08, Poverty Research Unit at
Sussex, University of Sussex, 2003.
[77] K. Kan and W.D. Tsai. Entrepreneurship and risk aversion. Small Business Eco-
nomics, 26 :65�474, 2006.
[78] M. P. Kidd. Immigrant wage di�erential and the role of self-employment in Aus-
tralia. Australia Economic Papers, 32 :92�115, 1993.
[79] J. De Kok, P. Brouwer, and P. Fris. Can �rm age account for productivity dif-
ferences ? Scales Research Reports N200421, EIM Business and Policy Research,
January 2005.
[80] A. Kolev. Labour supply in the informal economy in Russia during transition.
Discussion Paper Series No 2024, Centre for Economic Policy Research (CEPR),
Novembre 1998.
[81] A. Kolev. Determinants of the labor supply in Russia and the informal economy.
Revue d'études comparatives EST/OUEST, 31, 2000.
[82] J. Konings, H. Lehmann, and M.E. Scha�er. Job creation and job destruction in a
transition economy : Ownership, �rm size. CERT Discussion Papers 9611, Centre
for Economic Reform and Transformation, Heriot Watt University, 1996.
[83] E. P. Lazear. Entrepreneurship. DP 760, IZA, 2003.
[84] A.T. Le. Empirical studies of self-employment. Journal of Economic Surveys,
13 :381�417, 1999.
168

[85] A.T. Le. Self-employment and earnings among immigrant in Australia. Internatio-
nal Immigration, 37 :383�412, 1999b.
[86] X.B. Le, C. L. Cu, T. K. D. Nguyen, and V. T. Nguyen. The labour market in
vietnam : growth, poverty reduction and adjustment to crisis. Labour Markets
in Transitional Economies of Southeast Asia and Thailand, Development Analysis
Network (DAN), (Ottawa, IDRC and Phnom Penh, Cambodia Development Re-
source Institute), 2001.
[87] L.F. Lee. Some approaches to the correction of selectivity bias. The Review of
Economic Studies, 49 :355�372, 1982.
[88] B. Lentz and D. Laband. Entrepreneurial success and occupational inheritance
among proprietors. Canadian Journal of Economics, 23 :563�579, 1990.
[89] A.R. Levenson and W.F. Maloney. The informal sector, �rm dynamics, and ins-
titutional participation. Policy Research Working Paper Series 1988, The World
Bank, 1998.
[90] R. Levine. Financial development and economic growth : View and agenda. Journal
of Economic Literature, 32(2) :668�726, June 1997.
[91] C. Liedholm. Small �rm dynimics : Evidence from africa and latin america. Small
business Economics, 18(1-3) :227�242, 2002.
[92] A.Y.C. Liu. Changing wage structure and education in Vietnam, 1992 - 98, the
roles of demand. Economics of Transition, 14 :681�706, 2006.
[93] N. A. Loayza. The economics of the informal sector : a simple model and some
empirical evidence from Latin America. Policy Research Working Paper Series
1727, The World Bank, 1997.
[94] J. S. Long and J. Fresse. Regression models for categorical dependent variables using
stata. College Station, 2003.
[95] F. Lotti, E. Santarelli, and M. Vivarelli. Does gibrat's law hold among young, small
�rms ? Journal of Evolutionary Economics, 13(3) :213�235, 2003.
169

[96] J. H. Love and B. Ashcroft. Market versus corporate structure in plant-level inno-
vation performance. Small Business Economics, 13(2) :97�109, 1999.
[97] "G.S. Maddala". "Limited-dependent and Qualiquative Variables in Econometrics".
"Cambridge University Press", "1986". "Cambridge".
[98] S. K. Majumdar. The impact of size and age on �rm-level performance : some
evidence from india. Review of industrial organization, 12 :231�241, 1997.
[99] A. McCarty. The employment and social consequences of Vietnam's international
economic integration. UNIDO/UNDP/CIEM mimeo, 1999.
[100] D. Mckenzie and I. S. Sakho. Does it pay �rms to register for taxes ? the impact of
formality on �rm pro�tability. IZA discussion paper N° : 3179, 2007.
[101] M. A. McPherson. Growth of micro and small enterprises in southern africa. Journal
of Development Economics, 48(2) :253�277, 1996.
[102] W. Meeusen and J. Van Den Broeck. E�ciency estimation from cobb-douglas
production functions with composed error. International Economic Review,
18(2) :435�444, 1977.
[103] J. Mincer. Schooling, Experience, and Earnings. New York : NBER Press, 1974.
[104] S. Moghal and W. D. Pfau. An investigation of �rm heterogeneity in the constraints
to development and growth in Pakistan. Discussion paper, GRIPS Policy Informa-
tion center, 2008.
[105] P. R. Moock, H. A. Patrinos, and M. Venkataraman. Education and earnings in
a transition economy the case of Vietnam. Policy Research Working Paper Series,
The World Bank, 1920, 1998.
[106] C. Morrisson. What institutional framework for the informal sector ? Policy Brief
No 10, OECD Development Centre, 1995.
[107] H. Najib. Determinants of �rm growth : An empirical analysis from morocco.
MPRA Paper 4394, University Library of Munich, Germany, July 2005.
170

[108] V. P. Nguyen, K. Ulrich, and L. Francois. The performance of german �rms in
the business-related service sectors : a dynamic analysis. Journal of business &
Economic statistics, 2004.
[109] S. Nichter and L. Goldmark. Small �rm growth in developing coutries. Mimeo,
2008.
[110] M. Niskanen and J. Niskanen. The determinants of �rm growth in small and micro
�rms - evidence on relationship lending e�ect. Working paper, University of Kuopio,
Finland., January 2007.
[111] E. Papadaki and B. Chami. Growth determinants of micro businesses in
canada. Small business policy branch, Industry Canada, 2002. http :
//www.strategis.gc.ca/epic/site/sbrp− rppe.nsf/en/hrd01522e.html.
[112] S.C. Parker. The economics of self-employment and entrepreneurship. Cambridge
University Press, 2003.
[113] T. H. Pham and B. Reilly. The gender pay gap in Vietnam, 1993-2003 : A quantile
regression appoach. PRUS Working paper, 34, 2006.
[114] F. Pissarides, M. Singer, and J. Svejnar. Objective and constraints of entrepreneurs :
Evidence from small and medium-sized enterprises in russia and bulgaria. Journal
of comparative economics, 31(3) :503�531, 2003.
[115] C. M. Van Praag and P. H. Versloot. What is the value of entrepreneurship ? A
review of rencent research. Small Business Economics, 29 :351�382, 2007.
[116] C. Pratten. Economies of scale in manufacturint industry. Cambridge : Cambridge
University Press, 1971.
[117] R. Rajan and L. Zingales. Financial dependence and growth. American Economic
Review, 88(3) :599�586, June 1998.
[118] J. Rand, F. Tarp, H. D. Nguyen, and Q. V. Dao. Documentation of the small and
medium scale enterprise sme(sme) survey in vietnam for the year 2002. Mimeo,
2005.
171

[119] H. Rees and A. Shah. An empirical analysis of self-employment in the UK. Journal
of Applied Econometrics, 1 :101�108, 1986.
[120] P. Robson and B. Obeng. The barriers to growth in Ghana. Small Business Eco-
nomics, 30(4) :385�403, 2008.
[121] A. C. Rodriguez, M. A. Molina, A. L. G. Perez, and U. M. Hernandez. Size, age and
activity sector on the growth of the small and medium �rm size. Small Business
Economics, 21(3) :289�307, 2003.
[122] P. Romer. Increasing return and long run growth. Journal of political Economics,
42 :365�394, 1986.
[123] H. Sakai and N. Takada. Developing small and medium scale enterprises in vietnam.
NRI (Nomura research insitute) Paper, (13), 2000.
[124] E. Santarelli and M. Vivarelli. Entrepreneurship and the process of �rms' entry,
survival and growth. IZA Discussion Papers 2475, Institute for the Study of Labor
(IZA), December 2006.
[125] J. A. Schumpeter. Theorie der wirtschaftlichen Entwicklung,(Théorie de l'évolution
économique). Duncker & Humblot, Leipzig, 1911. Translated in anglaise by R.
Opie, from the second German edition , The Theory of Economic Development :
An Inquiry into Pro�t, Capital, Credit, Interest, and the Business Cycle, Cambridge
(Mass) : Harvard University Press.
[126] J. A. Schumpeter. Theory of economic development. New York : Oxford University
Press, 1961.
[127] K. Schwab, M. Porter, and J. Sachs. The global competitiveness report 2001-2002.
New York : Oxford University Press, 2002.
[128] F. Sjoholm. State owner enterprises and equitization in Vietnam. Working Paper
series 288, The European Institute of Japanese studies, 2006.
[129] L. Sleuwaegen and M. Goedhuys. Growth of �rms in developing countries, evidence
from Côte d'ivoire. Journal of Development Economics, 68(1) :117�135, 2002.
172

[130] K. A Small and C. Hsiao. Multinomial logit speci�cation tests. International
economic review, 26(3) :619�627, 1985.
[131] R. Solow. A contribution to theory of economic growth. Quarterly Journal of
Economics, 70 :65�94, 1956.
[132] J. Sutton. Gibrat's legacy. Journal of economic literature, 35(1) :40�59, 1997.
[133] B. Tamara. "Vietnam : Lessons in building linkages for competitive and responsible
entrepreneurship". UNIDO and Kennedy School of Government, 2006. Harvard
University.
[134] A. Torii. Dual Structure and Di�erences of E�ciency between Japanese Large and
small Enterprises. MIT Press, Cambridge (Mass), 1992. in in Richard E. Caves,
ed., Industrial E�ciency in Six Nations,.
[135] T.B. Tran, G. R. Quentin, and T. Kompas. Institutions matter : The case of
vietnam. The Journal of Socio-Economics, 38(1) :1�12, January 2009.
[136] J. R. Tybout. Manufacturing �rms in developing countries : How well do they do,
and why ? Journal of Economic Literature, 38(1) :11�44, March 2000.
[137] Vietnam National University. "The informal economic sector : Realities and pro-
blems for the management". Nha xuat ban dai hoc Quoc Gia Hanoi, 2004. Hanoi.
[138] W. P. M Vijverberg and J. Haughton. Household enterprises in vietnam : Survive,
growth and living standards. World Bank working paper, (2773), 2002.
[139] W.P.M. Vijverberg and J. Houghton. Household enterprises in Vietnam : Survive,
growth and living standards. World Bank, Policy Research Working Paper, PS2773,
2002.
[140] J. Wiklund. The sustainability of the entrepreneurial orientation-performance re-
lationship. Entrepreneurship Theory and Practice, 24 :37�48, 1999.
[141] R. Winter-Ebmer and J. Zweimuller. Firm-size wage di�erentials in Switzerland :
Evidence from job-changers. The American Economic Review, 89(2) :89�93, 1999.
173

[142] World-Bank. "Vietnam Development report 2006. Business". World Bank Vietnam
O�ce, 2005. Hanoi.
[143] P. V. Wunnava and B. T. Ewing. Union-nonunion gender wage and bene�t di�e-
rentials across estabilishment sizes. Small business Economics, 15(1) :47�57, 2000.
[144] C. H. Yang and C. H. Huang. R & D, size and �rm growth in Taiwan's electronics
industry. Small Business Economics, 25(5) :477�487, December 2005.
[145] S. O. Yu. Infrastructure development and the informal sector. Socio Economic
Technical Paper 12, ILO-Employment-Intensive Investment Branch, Geneva, 2002.
174