during april, full-time employment increased by 2.2 per ... · ms joslyn magro cuschieri ... s t...
TRANSCRIPT

1Kindly indicate source when quoting from this release.The advance release calendar may be consulted at www.nso.gov.mt
Issued by: External Cooperation and Communication Unit, National Statistics Office, Lascaris, Valletta VLT 2000, Malta.T. +356 2599 7219 F. +356 2599 7205 E. [email protected]
4 September 2013 | 1100 hrs | 168/2013
Compiled by:
Unit C2: Labour Market Statistics
Directorate C: Social Statistics
Further information on data:
Ms Joslyn MAGRO CUSCHIERIT. +356 2599 7662E. [email protected]
During April, full-time employment increased by 2.2 per cent when compared to the corresponding month last year.
Gainfully Occupied Population: April 2013
Administrative data provided by the Employment and Training Corporation showed that over a twelve-month period to April, persons registered as working on a full-time basis increased by 3,315, reaching 154,855. During the month under review, persons registering as unemployed also increased by 403 to 7,176, despite a decrease of 174 when compared to March. The labour supply (excluding part-timers) went up by 3,718 to 162,031.
Full-Time Employment
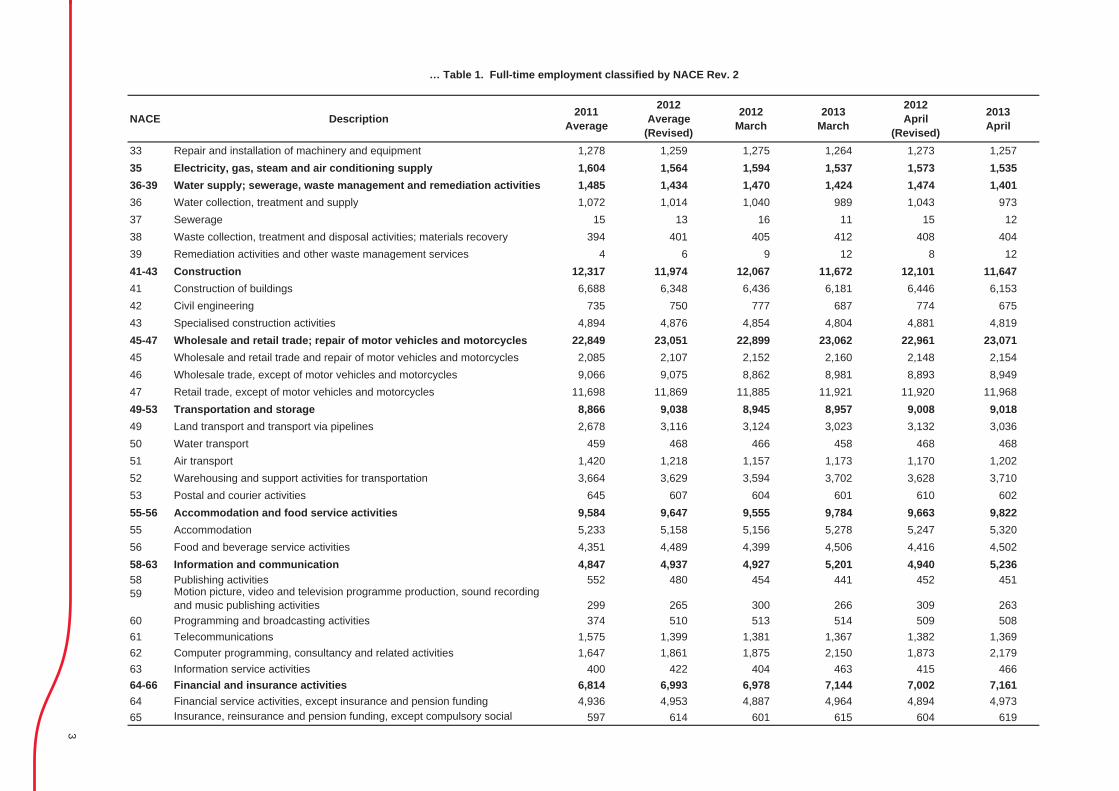
Full-time employment within the Education sector (NACE 85) registered the highest increase when compared to the corresponding month in 2012 (+970). The Administrative and Support Service Activities sector (NACE 77-82) also advanced by 11.3 per cent to 8,610. On the other hand, full-time employment within Construction (NACE 41-43) declined by 454 when compared to the corresponding month last year.
Full-time employment within the private sector grew by 2 per cent to 113,039. Main increases in private sector employment were recorded within Administrative and Support Services (NACE 77-82; +894) and in Professional, Scientifi c and Technical activities (NACE 69-75; + 469). Public sector full-time employment also went up by 2.6 per cent, with the highest increase being recorded within the Education sector (NACE 85; +716).
When compared to April 2012, employees working on a full-time basis increased by 2.4 per cent, reaching 136,933. Registered self-employment went up by 0.6 per cent, to 17,922.
Part-Time Employment
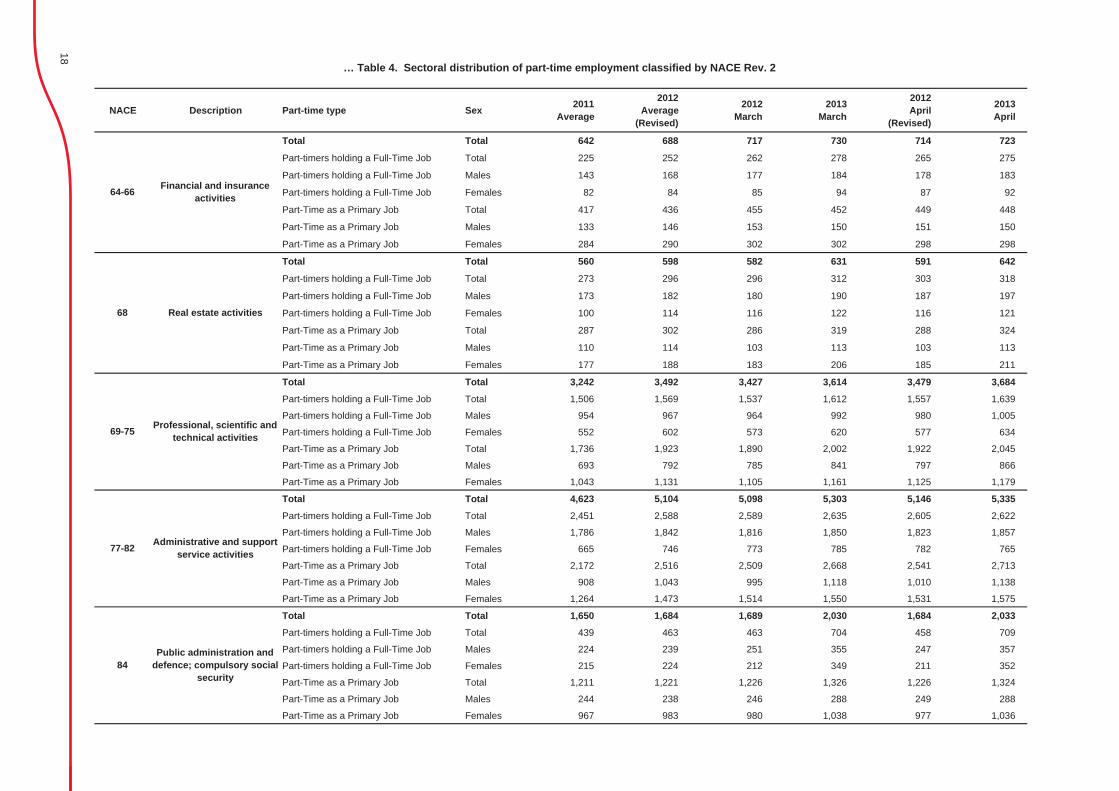
During the month under review, part-time employment went up by 5 per cent when compared to the corresponding month last year, reaching 55,978. The most signifi cant increase in part-time employment was registered in Wholesale and Retail Trade; Repair of Motor Vehicles and Motorcycles (NACE 45-47, +559) and Health and Social Work activities (NACE 86-88, +296). On the other hand, part-timers in Education (NACE 85) declined by 132.
During April, part-time workers who also held a full-time job increased by 752, with the highest increase being recorded among women (+538 registrants). During the same period, an increase of 1,938 persons was recorded among persons who had a part-time job as their main employment

2
NACE Description 2011 Average
2012 Average
(Revised)
2012 March
2013 March
2012 April
(Revised)
2013 April
01-03 Agriculture, forestry and fishing 2,126 2,103 2,087 2,092 2,083 2,07401 Crop and animal production, hunting and related service activities 1,640 1,601 1,598 1,585 1,593 1,57902 Forestry and logging - - - - - -03 Fishing and aquaculture 486 502 489 507 490 49505-09 Mining and quarrying 323 291 293 291 294 28605 Mining of coal and lignite - - - - - -06 Extraction of crude petroleum and natural gas - - - - - -07 Mining of metal ores - - - - - -08 Other mining and quarrying 216 192 195 187 195 18309 Mining support service activities 107 99 98 104 99 10310-33 Manufacturing 20,016 19,868 20,097 19,937 20,113 19,95010 Manufacture of food products 2,425 2,395 2,438 2,353 2,432 2,32911 Manufacture of beverages 795 781 771 791 781 78812 Manufacture of tobacco products 17 16 15 15 15 1513 Manufacture of textiles 436 453 444 404 452 40614 Manufacture of wearing apparel 442 435 423 424 425 41815 Manufacture of leather and related products 38 32 30 31 31 3116 Manufacture of wood and of products of wood and cork, except furniture;
manufacture of articles of straw and plaiting materials 274 265 273 260 273 264
17 Manufacture of paper and paper products 230 229 236 232 236 22118 Printing and reproduction of recorded media 1,331 1,376 1,398 1,401 1,403 1,39819 Manufacture of coke and refined petroleum products 9 9 4 5 4 520 Manufacture of chemicals and chemical products 256 267 268 262 260 26321 preparations 850 1,019 1,143 1,208 1,152 1,21822 Manufacture of rubber and plastic products 1,595 1,598 1,611 1,619 1,611 1,63723 Manufacture of other non-metallic mineral products 1,183 1,148 1,158 1,122 1,157 1,11324 Manufacture of basic metals 202 125 87 91 87 8925 Manufacture of fabricated metal products, except machinery and equipment 1,315 1,213 1,314 1,187 1,316 1,19626 Manufacture of computer, electronic and optical products 2,303 2,180 2,180 2,191 2,171 2,17327 Manufacture of electrical equipment 462 447 445 457 448 46128 Manufacture of machinery and equipment n.e.c. 444 451 454 437 460 44529 Manufacture of motor vehicles, trailers and semi-trailers 963 1,005 989 1,051 981 1,08030 Manufacture of other transport equipment 42 46 40 43 42 4331 Manufacture of furniture 1,247 1,203 1,206 1,167 1,210 1,17232 Other manufacturing 1,879 1,916 1,895 1,922 1,893 1,928
Table 1. Full-time employment classified by NACE Rev. 2 …
3
NACE Description 2011 Average
2012 Average
(Revised)
2012 March
2013 March
2012 April
(Revised)
2013 April
33 Repair and installation of machinery and equipment 1,278 1,259 1,275 1,264 1,273 1,257 35 Electricity, gas, steam and air conditioning supply 1,604 1,564 1,594 1,537 1,573 1,535 36-39 Water supply; sewerage, waste management and remediation activities 1,485 1,434 1,470 1,424 1,474 1,401 36 Water collection, treatment and supply 1,072 1,014 1,040 989 1,043 973 37 Sewerage 15 13 16 11 15 12 38 Waste collection, treatment and disposal activities; materials recovery 394 401 405 412 408 404 39 Remediation activities and other waste management services 4 6 9 12 8 12 41-43 Construction 12,317 11,974 12,067 11,672 12,101 11,647 41 Construction of buildings 6,688 6,348 6,436 6,181 6,446 6,153 42 Civil engineering 735 750 777 687 774 675 43 Specialised construction activities 4,894 4,876 4,854 4,804 4,881 4,819 45-47 Wholesale and retail trade; repair of motor vehicles and motorcycles 22,849 23,051 22,899 23,062 22,961 23,071 45 Wholesale and retail trade and repair of motor vehicles and motorcycles 2,085 2,107 2,152 2,160 2,148 2,154 46 Wholesale trade, except of motor vehicles and motorcycles 9,066 9,075 8,862 8,981 8,893 8,949 47 Retail trade, except of motor vehicles and motorcycles 11,698 11,869 11,885 11,921 11,920 11,968 49-53 Transportation and storage 8,866 9,038 8,945 8,957 9,008 9,018 49 Land transport and transport via pipelines 2,678 3,116 3,124 3,023 3,132 3,036 50 Water transport 459 468 466 458 468 468 51 Air transport 1,420 1,218 1,157 1,173 1,170 1,202 52 Warehousing and support activities for transportation 3,664 3,629 3,594 3,702 3,628 3,710 53 Postal and courier activities 645 607 604 601 610 602 55-56 Accommodation and food service activities 9,584 9,647 9,555 9,784 9,663 9,822 55 Accommodation 5,233 5,158 5,156 5,278 5,247 5,320 56 Food and beverage service activities 4,351 4,489 4,399 4,506 4,416 4,502 58-63 Information and communication 4,847 4,937 4,927 5,201 4,940 5,236 58 Publishing activities 552 480 454 441 452 451 59 Motion picture, video and television programme production, sound recording
and music publishing activities 299 265 300 266 309 263 60 Programming and broadcasting activities 374 510 513 514 509 508 61 Telecommunications 1,575 1,399 1,381 1,367 1,382 1,369 62 Computer programming, consultancy and related activities 1,647 1,861 1,875 2,150 1,873 2,179 63 Information service activities 400 422 404 463 415 466 64-66 Financial and insurance activities 6,814 6,993 6,978 7,144 7,002 7,161 64 Financial service activities, except insurance and pension funding 4,936 4,953 4,887 4,964 4,894 4,973 65 Insurance, reinsurance and pension funding, except compulsory social 597 614 601 615 604 619
… Table 1. Full-time employment classified by NACE Rev. 2

4
NACE Description 2011 Average
2012 Average
(Revised)
2012 March
(Revised)
2013 March
2012 April
(Revised)
2013 April
66 Activities auxiliary to financial services and insurance activities 1,281 1,426 1,490 1,565 1,504 1,569 68 Real estate activities 1,017 1,012 983 977 989 973 69-75 Professional, scientific and technical activities 7,221 7,749 7,721 8,176 7,757 8,228 69 Legal and accounting activities 2,226 2,383 2,342 2,441 2,342 2,443 70 Activities of head offices; management consultancy activities 2,418 2,670 2,676 2,849 2,692 2,875 71 Architectural and engineering activities; technical testing and analysis 1,326 1,346 1,353 1,396 1,368 1,406 72 Scientific research and development 43 48 40 44 38 43 73 Advertising and market research 823 872 871 954 878 963 74 Other professional, scientific and technical activities 343 381 398 448 395 453 75 Veterinary activities 42 49 41 44 44 45 77-82 Administrative and support service activities 7,030 7,877 7,649 8,437 7,731 8,610 77 Rental and leasing activities 926 954 976 965 1,031 1,012 78 Employment activities 1,298 1,377 1,384 1,404 1,383 1,405 79 Travel agency, tour operator and other reservation service and related
ti iti1,124 1,134 1,049 1,092 1,072 1,094
80 Security and investigation activities 1,271 1,389 1,382 1,409 1,407 1,435 81 Services to buildings and landscape activities 1,100 1,324 1,237 1,607 1,263 1,703 82 Office administrative, office support and other business support activities 1,311 1,699 1,621 1,960 1,575 1,961 84 Public administration and defence; compulsory social security 10,635 10,491 10,508 10,420 10,454 10,637 85 Education 13,430 13,777 13,829 14,675 13,838 14,808 86-88 Human health and social work activities 11,809 12,440 12,336 12,907 12,358 12,909 86 Human health activities 7,585 7,781 7,697 8,098 7,709 8,123 87 Residential care activities 3,055 3,408 3,386 3,508 3,388 3,483 88 Social work activities without accommodation 1,169 1,251 1,253 1,301 1,261 1,303 90-93 Arts, entertainment and recreation 3,607 3,995 3,958 4,114 3,976 4,139 90 Creative, arts and entertainment activities 346 390 363 397 362 401 91 Libraries, archives, museums and other cultural activities 391 410 426 432 427 426 92 Gambling and betting activities 2,302 2,559 2,470 2,563 2,487 2,588 93 Sports activities and amusement and recreation activities 568 636 699 722 700 724 94-96 Other service activities 3,173 3,131 3,036 3,148 3,044 3,170 94 Activities of membership organisations 630 582 582 649 588 663 95 Repair of computers and personal and household goods 256 215 225 224 220 218 96 Other personal service activities 2,287 2,334 2,229 2,275 2,236 2,289 97-98 Activities of households as employers; undifferentiated goods- and
services-producing activities of households for own use 3 3 3 3 3 3
97 Activities of households as employers of domestic personnel 3 3 3 3 3 3
… Table 1. Full-time employment classified by NACE Rev. 2

5
NACE Description 2011 Average
2012 Average
(Revised)
2012 March
(Revised)
2013 March
2012 April
(Revised)
2013 April
98 Undifferentiated goods- and services-producing activities of private households for own use - - - - - -
99 Activities of extraterritorial organisations and bodies 184 180 180 179 178 177 Apprentices, trainees and students 659 395 - - - -
01-99 Total Gainfully Occupied (including apprentices) 149,599 151,950 151,115 154,137 151,540 154,855 Registered Unemployed 6,570 6,839 6,966 7,350 6,773 7,176 Part I 5,892 6,169 6,265 6,853 6,089 6,690 Part II 678 670 701 497 684 486
Labour Supply 156,169 158,788 158,081 161,487 158,313 162,031
… Table 1. Full-time employment classified by NACE Rev. 2

6
NACE Description Category 2011 Average
2012 Average
(Revised)
2012 March
2013 March
2012 April
(Revised)
2013 April
Total 2,126 2,103 2,087 2,092 2,083 2,074Private Sector 1,969 1,940 1,925 1,921 1,922 1,903Public Sector 157 163 162 171 161 171Males 1,931 1,912 1,899 1,900 1,895 1,884Females 195 191 188 192 188 190Self-employed 1,521 1,502 1,491 1,488 1,489 1,477Employees 605 601 596 604 594 597Malta 1,654 1,634 1,620 1,624 1,618 1,608Gozo 472 469 467 468 465 466Total 323 291 293 291 294 286Private Sector 323 291 293 291 294 286Public Sector - - - - - -Males 301 271 273 269 274 265Females 22 20 20 22 20 21Self-employed 70 63 60 59 60 59Employees 253 228 233 232 234 227Malta 275 244 247 246 248 242Gozo 48 47 46 45 46 44Total 20,016 19,868 20,097 19,937 20,113 19,950Private Sector 19,943 19,803 20,031 19,883 20,047 19,896Public Sector 73 65 66 54 66 54Males 15,000 14,876 15,098 14,845 15,123 14,847Females 5,016 4,992 4,999 5,092 4,990 5,103Self-employed 1,455 1,423 1,382 1,389 1,385 1,388Employees 18,561 18,445 18,715 18,548 18,728 18,562Malta 19,084 18,964 19,175 19,059 19,191 19,066Gozo 932 904 922 878 922 884Total 1,604 1,564 1,594 1,537 1,573 1,535Private Sector 2 4 5 9 5 9Public Sector 1,602 1,560 1,589 1,528 1,568 1,526Males 1,448 1,406 1,434 1,381 1,413 1,379Females 156 158 160 156 160 156Self-employed 1 2 2 2 2 2Employees 1,603 1,562 1,592 1,535 1,571 1,533Malta 1,557 1,518 1,547 1,490 1,527 1,488Gozo 47 46 47 47 46 47
35 Electricity, gas, steam and air conditioning supply
10-33 Manufacturing
Table 2. Sectoral, sex, employment status and regional analysis of full-time employment classified by NACE Rev. 2 …
01-03 Agriculture, forestry and fishing
05-09 Mining and quarrying

7
NACE Description Category 2011 Average
2012 Average
(Revised)
2012 March
2013 March
2012 April
(Revised)
2013 April
Total 1,485 1,434 1,470 1,424 1,474 1,401Private Sector 283 314 336 325 335 320Public Sector 1,202 1,120 1,134 1,099 1,139 1,081Males 1,316 1,264 1,295 1,259 1,294 1,239Females 169 170 175 165 180 162Self-employed 57 56 62 63 62 64Employees 1,428 1,378 1,408 1,361 1,412 1,337Malta 1,255 1,268 1,303 1,265 1,304 1,244Gozo 230 166 167 159 170 157Total 12,317 11,974 12,067 11,672 12,101 11,647Private Sector 8,788 8,541 8,587 8,300 8,614 8,301Public Sector 3,529 3,433 3,480 3,372 3,487 3,346Males 11,670 11,291 11,394 10,950 11,427 10,931Females 647 683 673 722 674 716Self-employed 2,626 2,649 2,632 2,650 2,650 2,656Employees 9,691 9,325 9,435 9,022 9,451 8,991Malta 11,399 11,070 11,140 10,762 11,173 10,737Gozo 918 904 927 910 928 910Total 22,849 23,051 22,899 23,062 22,961 23,071Private Sector 22,849 23,051 22,899 23,062 22,961 23,071Public Sector - - - - - -Males 15,529 15,685 15,630 15,686 15,660 15,685Females 7,320 7,366 7,269 7,376 7,301 7,386Self-employed 5,250 5,254 5,311 5,288 5,305 5,272Employees 17,599 17,797 17,588 17,774 17,656 17,799Malta 21,543 21,719 21,585 21,746 21,646 21,761Gozo 1,306 1,332 1,314 1,316 1,315 1,310Total 8,866 9,038 8,945 8,957 9,008 9,018Private Sector 6,630 7,023 6,967 7,001 7,031 7,041Public Sector 2,236 2,015 1,978 1,956 1,977 1,977Males 7,388 7,547 7,494 7,447 7,546 7,491Females 1,478 1,491 1,451 1,510 1,462 1,527Self-employed 1,091 995 965 979 969 980Employees 7,775 8,043 7,980 7,978 8,039 8,038Malta 8,420 8,558 8,473 8,483 8,539 8,547Gozo 446 480 472 474 469 471
45-47 Wholesale and retail trade; repair of motor vehicles and motorcycles
49-53 Transportation and storage
36-39 Water supply; sewerage, waste management and remediation activities
41-43 Construction
… Table 2. Sectoral, sex, employment status and regional analysis of full-time employment classified by NACE Rev. 2

8
NACE Description Category 2011 Average
2012 Average
(Revised)
2012 March
(Revised)
2013 March
2012 April
(Revised)
2013 April
Total 9,584 9,647 9,555 9,784 9,663 9,822Private Sector 9,546 9,647 9,555 9,784 9,663 9,822Public Sector 38 - - - - -Males 6,683 6,703 6,671 6,744 6,753 6,763Females 2,901 2,944 2,884 3,040 2,910 3,059Self-employed 1,075 1,115 1,118 1,122 1,128 1,118Employees 8,509 8,532 8,437 8,662 8,535 8,704Malta 8,925 8,991 8,888 9,101 8,985 9,137Gozo 659 656 667 683 678 685Total 4,847 4,937 4,927 5,201 4,940 5,236Private Sector 4,409 4,481 4,484 4,704 4,488 4,739Public Sector 438 456 443 497 452 497Males 3,528 3,561 3,551 3,758 3,567 3,778Females 1,319 1,376 1,376 1,443 1,373 1,458Self-employed 200 205 199 217 203 217Employees 4,647 4,732 4,728 4,984 4,737 5,019Malta 4,673 4,762 4,753 5,021 4,766 5,055Gozo 174 175 174 180 174 181Total 6,814 6,993 6,978 7,144 7,002 7,161Private Sector 6,176 6,343 6,339 6,474 6,361 6,492Public Sector 638 650 639 670 641 669Males 3,357 3,413 3,429 3,458 3,436 3,467Females 3,457 3,580 3,549 3,686 3,566 3,694Self-employed 66 74 77 79 75 77Employees 6,748 6,919 6,901 7,065 6,927 7,084Malta 6,529 6,706 6,697 6,859 6,723 6,878Gozo 285 287 281 285 279 283Total 1,017 1,012 983 977 989 973Private Sector 997 994 964 960 970 958Public Sector 20 18 19 17 19 15Males 671 666 665 651 669 648Females 346 346 318 326 320 325Self-employed 289 287 286 291 289 294Employees 728 725 697 686 700 679Malta 876 866 889 888 890 886Gozo 141 146 94 89 99 87
58-63 Information and communication
64-66 Financial and insurance activities
68 Real estate activities
55-56 Accommodation and food service activities
… Table 2. Sectoral, sex, employment status and regional analysis of full-time employment classified by NACE Rev. 2

9
NACE Description Category 2011 Average
2012 Average
(Revised)
2012 March
2013 March
2012 April
(Revised)
2013 April
Total 7,221 7,749 7,721 8,176 7,757 8,228Private Sector 7,140 7,663 7,638 8,088 7,672 8,141Public Sector 81 86 83 88 85 87Males 4,190 4,525 4,540 4,771 4,555 4,806Females 3,031 3,224 3,181 3,405 3,202 3,422Self-employed 1,054 1,103 1,113 1,136 1,114 1,137Employees 6,167 6,646 6,608 7,040 6,643 7,091Malta 7,006 7,510 7,497 7,923 7,533 7,970Gozo 215 239 224 253 224 258Total 7,030 7,877 7,649 8,437 7,731 8,610Private Sector 6,212 7,036 6,800 7,610 6,883 7,777Public Sector 818 841 849 827 848 833Males 4,542 4,975 4,870 5,234 4,923 5,298Females 2,488 2,902 2,779 3,203 2,808 3,312Self-employed 589 678 672 751 683 754Employees 6,441 7,199 6,977 7,686 7,048 7,856Malta 6,784 7,568 7,358 8,134 7,435 8,309Gozo 246 309 291 303 296 301Total 10,635 10,491 10,508 10,420 10,454 10,637Private Sector - - - - - -Public Sector 10,635 10,491 10,508 10,420 10,454 10,637Males 7,288 7,068 7,088 7,027 7,038 7,171Females 3,347 3,423 3,420 3,393 3,416 3,466Self-employed - - - - - -Employees 10,635 10,491 10,508 10,420 10,454 10,637Malta 9,817 9,686 9,686 9,629 9,648 9,837Gozo 818 805 822 791 806 800Total 13,430 13,777 13,829 14,675 13,838 14,808Private Sector 3,823 4,014 4,049 4,292 4,063 4,317Public Sector 9,607 9,763 9,780 10,383 9,775 10,491Males 4,786 4,807 4,870 4,985 4,868 4,992Females 8,644 8,970 8,959 9,690 8,970 9,816Self-employed 285 292 317 294 320 297Employees 13,145 13,485 13,512 14,381 13,518 14,511Malta 12,424 12,767 12,816 13,617 12,822 13,740Gozo 1,006 1,010 1,013 1,058 1,016 1,068
84 Public administration and defence; compulsory social security
85 Education
77-82 Administrative and support service activities
… Table 2. Sectoral, sex, employment status and regional analysis of full-time employment classified by NACE Rev. 2
69-75 Professional, scientific and technical activities

10
NACE Description Category 2011 Average
2012 Average
(Revised)
2012 March
2013 March
2012 April
(Revised)
2013 April
Total 11,809 12,440 12,336 12,907 12,358 12,909Private Sector 2,573 2,890 2,835 3,116 2,864 3,110Public Sector 9,236 9,550 9,501 9,791 9,494 9,799Males 4,942 5,001 4,993 5,089 4,985 5,094Females 6,867 7,439 7,343 7,818 7,373 7,815Self-employed 261 277 273 300 277 304Employees 11,548 12,163 12,063 12,607 12,081 12,605Malta 10,961 11,536 11,444 11,960 11,458 11,961Gozo 848 904 892 947 900 948Total 3,607 3,995 3,958 4,114 3,976 4,139Private Sector 3,057 3,423 3,375 3,494 3,395 3,520Public Sector 550 572 583 620 581 619Males 2,346 2,631 2,597 2,736 2,623 2,761Females 1,261 1,364 1,361 1,378 1,353 1,378Self-employed 322 359 351 367 351 379Employees 3,285 3,636 3,607 3,747 3,625 3,760Malta 3,450 3,824 3,784 3,936 3,799 3,957Gozo 157 171 174 178 177 182Total 3,173 3,131 3,036 3,148 3,044 3,170Private Sector 3,169 3,123 3,031 3,134 3,039 3,156Public Sector 4 8 5 14 5 14Males 1,575 1,508 1,453 1,482 1,457 1,494Females 1,598 1,623 1,583 1,666 1,587 1,676Self-employed 1,469 1,487 1,452 1,432 1,458 1,446Employees 1,704 1,644 1,584 1,716 1,586 1,724Malta 3,045 3,005 2,915 3,023 2,925 3,045Gozo 128 126 121 125 119 125Total 3 3 3 3 3 3Private Sector 3 3 3 3 3 3Public Sector - - - - - -Males 1 1 1 1 1 1Females 2 2 2 2 2 2Self-employed - - - - - -Employees 3 3 3 3 3 3Malta 3 3 3 3 3 3Gozo - - - - - -
… Table 2. Sectoral, sex, employment status and regional analysis of full-time employment classified by NACE Rev. 2
97-98
Activities of households as employers; undifferentiated goods- and services-producing activities of households for
own use
86-88 Human health and social work activities
90-93 Arts, entertainment and recreation
94-96 Other service activities

11
NACE Description Category 2011 Average
2012 Average
(Revised)
2012 March
(Revised)
2013 March
2012 April
(Revised)
2013 April
Total 184 180 180 179 178 177Private Sector 184 180 180 179 178 177Public Sector - - - - - -Males 120 118 117 117 115 117Females 64 62 63 62 63 60Self-employed - 1 - 1 - 1Employees 184 179 180 178 178 176Malta 184 180 180 179 178 177Gozo - - - - - -Total 659 395 - - - -Private Sector 508 301 - - - -Public Sector 151 94 - - - -Males 553 327 - - - -Females 106 68 - - - -Self-employed - - - - - -Employees 659 395 - - - -Malta 644 384 - - - -Gozo 15 11 - - - -Total 149,599 151,950 151,115 154,137 151,540 154,855Private Sector 108,585 111,065 110,296 112,630 110,788 113,039Public Sector 41,014 40,885 40,819 41,507 40,752 41,816Males 99,165 99,556 99,362 99,790 99,622 100,111Females 50,434 52,394 51,753 54,347 51,918 54,744Self-employed 17,681 17,822 17,763 17,908 17,820 17,922Employees 131,918 134,128 133,352 136,229 133,720 136,933Malta 140,508 142,763 142,000 144,948 142,411 145,648Gozo 9,091 9,187 9,115 9,189 9,129 9,207
… Table 2. Sectoral, sex, employment status and regional analysis of full-time employment classified by NACE Rev. 2
99Activities of extraterritorial
organisations and bodies
Total Gainfully Occupied (including apprentices)
Apprentices, trainees and students

12
NACE Description 2011 Average
2012 Average
(Revised)
2012 March
2013 March
2012 April
(Revised)
2013 April
01-03 Agriculture, forestry and fishing 2,311 2,366 2,378 2,377 2,380 2,37801 Crop and animal production, hunting and related service activities 1,573 1,628 1,654 1,660 1,652 1,66102 Forestry and logging - - - - - -03 Fishing and aquaculture 738 738 724 717 728 71705-09 Mining and quarrying 37 33 33 33 33 3305 Mining of coal and lignite - - - - - -06 Extraction of crude petroleum and natural gas - - - - - -07 Mining of metal ores - - - - - -08 Other mining and quarrying 32 30 30 30 30 3009 Mining support service activities 5 3 3 3 3 310-33 Manufacturing 2,930 2,922 2,846 3,015 2,848 3,00110 Manufacture of food products 775 736 705 759 709 74911 Manufacture of beverages 90 92 89 86 84 7712 Manufacture of tobacco products 1 2 2 2 2 213 Manufacture of textiles 54 52 46 54 46 5514 Manufacture of wearing apparel 111 113 110 114 112 11415 Manufacture of leather and related products 16 13 16 14 13 1416 Manufacture of wood and of products of wood and cork, except
furniture; manufacture of articles of straw and plaiting materials 58 51 59 53 58 5317 Manufacture of paper and paper products 23 22 23 25 22 2418 Printing and reproduction of recorded media 205 200 199 208 204 19919 Manufacture of coke and refined petroleum products 1 1 1 1 1 120 Manufacture of chemicals and chemical products 39 39 40 38 40 4121 Manufacture of basic pharmaceutical products and
pharmaceutical preparations 37 35 32 36 31 3422 Manufacture of rubber and plastic products 105 114 109 130 109 13123 Manufacture of other non-metallic mineral products 157 160 165 158 163 15924 Manufacture of basic metals 56 46 37 35 36 3525 Manufacture of fabricated metal products, except machinery and
equipment 227 236 241 245242 241
26 Manufacture of computer, electronic and optical products 81 73 73 74 72 7327 Manufacture of electrical equipment 82 85 82 88 83 8828 Manufacture of machinery and equipment n.e.c. 31 35 38 32 36 33
Table 3. Part-time employment classified by NACE Rev. 2 …

13
NACE Description 2011 Average
2012 Average
(Revised)
2012 March
2013 March
2012 April
(Revised)
2013 April
29 Manufacture of motor vehicles, trailers and semi-trailers 60 68 72 80 73 81
30 Manufacture of other transport equipment 13 15 11 16 11 16
31 Manufacture of furniture 369 375 365 380 371 382
32 Other manufacturing 231 236 216 246 215 260
33 Repair and installation of machinery and equipment 108 123 115 141 115 139
35 Electricity, gas, steam and air conditioning supply 8 8 8 8 8 836-39 Water supply; sewerage, waste management and remediation
activities 186 183 179 189 177 192
36 Water collection, treatment and supply 20 15 15 16 15 16
37 Sewerage 3 3 3 3 3 338 Waste collection, treatment and disposal activities; materials 152 156 152 161 150 16439 Remediation activities and other waste management services 11 9 9 9 9 9
41-43 Construction 1,565 1,632 1,635 1,668 1,657 1,66541 Construction of buildings 452 472 494 482 493 478
42 Civil engineering 52 60 63 59 65 58
43 Specialised construction activities 1,061 1,100 1,078 1,127 1,099 1,12945-47 Wholesale and retail trade; repair of motor vehicles and
motorcycles 9,082 9,579 9,306 9,915 9,381 9,940
45 Wholesale and retail trade and repair of motor vehicles and motorcycles
650 658 647 657 650 653
46 Wholesale trade, except of motor vehicles and motorcycles 2,647 2,668 2,522 2,609 2,524 2,64047 Retail trade, except of motor vehicles and motorcycles 5,785 6,253 6,137 6,649 6,207 6,647
49-53 Transportation and storage 1,950 2,057 1,911 2,133 1,940 2,18549 Land transport and transport via pipelines 1,175 1,152 1,094 1,158 1,104 1,185
50 Water transport 97 95 98 99 97 108
51 Air transport 62 150 50 203 77 21252 Warehousing and support activities for transportation 452 456 459 476 459 475
53 Postal and courier activities 164 204 210 197 203 205
55-56 Accommodation and food service activities 9,687 10,334 9,579 10,018 9,753 10,25155 Accommodation 3,408 3,476 3,255 3,213 3,427 3,369
56 Food and beverage service activities 6,279 6,858 6,324 6,805 6,326 6,882
… Table 3. Part-time employment classified by NACE Rev. 2

14
NACE Description 2011 Average
2012 Average
(Revised)
2012 March
2013 March
2012 April
(Revised)
2013 April
58-63 Information and communication 1,490 1,508 1,498 1,537 1,523 1,51558 Publishing activities 232 136 129 132 130 13359 Motion picture, video and television programme production, sound
recording and music publishing activities 344 373 365 383 372 355
60 Programming and broadcasting activities 295 432 443 430 457 43261 Telecommunications 217 129 124 116 120 11462 Computer programming, consultancy and related activities 376 412 411 448 416 45463 Information service activities 26 26 26 28 28 2764-66 Financial and insurance activities 642 688 717 730 714 72364 Financial service activities, except insurance and pension funding 264 296 313 332 310 32665 Insurance, reinsurance and pension funding, except compulsory
social security 124 126 118 116 117 119
66 Activities auxiliary to financial services and insurance activities 254 266 286 282 287 27868 Real estate activities 560 598 582 631 591 64269-75 Professional, scientific and technical activities 3,242 3,492 3,427 3,614 3,479 3,68469 Legal and accounting activities 757 820 810 828 809 82870 Activities of head offices; management consultancy activities 1,191 1,231 1,166 1,324 1,198 1,36371 Architectural and engineering activities; technical testing and
analysis 467 473 470 490 466 492
72 Scientific research and development 12 19 18 19 18 1973 Advertising and market research 561 673 690 656 681 66374 Other professional, scientific and technical activities 236 255 253 273 287 29575 Veterinary activities 18 21 20 24 20 2477-82 Administrative and support service activities 4,623 5,104 5,098 5,303 5,146 5,33577 Rental and leasing activities 459 498 492 536 517 54478 Employment activities 1,328 1,397 1,427 1,451 1,433 1,46879 Travel agency, tour operator and other reservation service and
related activities618 594 557 559 570 564
80 Security and investigation activities 846 913 854 1,002 864 1,00581 Services to buildings and landscape activities 777 1,007 1,099 1,069 1,094 1,07082 Office administrative, office support and other business support
activities595 695 669 686 668 684
84 Public administration and defence; compulsory social security 1,650 1,684 1,689 2,030 1,684 2,033
… Table 3. Part-time employment classified by NACE Rev. 2

15
NACE Description 2011 Average
2012 Average
(Revised)
2012 March
2013 March
2012 April
(Revised)
2013 April
85 Education 5,173 5,281 5,388 5,241 5,441 5,30986-88 Human health and social work activities 2,903 2,949 2,857 3,192 2,888 3,18486 Human health activities 908 954 907 1,080 912 1,105
87 Residential care activities 1,398 1,374 1,355 1,492 1,381 1,465
88 Social work activities without accommodation 597 621 595 620 595 614
90-93 Arts, entertainment and recreation 1,480 1,669 1,592 1,786 1,609 1,77990 Creative, arts and entertainment activities 385 472 407 545 413 53991 Libraries, archives, museums and other cultural activities 125 119 119 119 118 120
92 Gambling and betting activities 321 294 260 267 256 26693 Sports activities and amusement and recreation activities 649 784 806 855 822 854
94-96 Other service activities 2,344 2,208 1,994 2,072 2,005 2,09194 Activities of membership organisations 463 470 457 494 463 50695 Repair of computers and personal and household goods 141 147 149 150 148 149
96 Other personal service activities 1,740 1,591 1,388 1,428 1,394 1,43697-98 Activities of households as employers; undifferentiated
goods- and services-producing activities of households for own use
3 7 9 10 9 10
97 Activities of households as employers of domestic personnel 3 7 8 8 8 898 Undifferentiated goods- and services-producing activities of
private households for own use- - 1 2 1 2
99 Activities of extraterritorial organisations and bodies 22 21 22 20 22 2001-99 Total 51,888 54,323 52,748 55,522 53,288 55,978
… Table 3. Part-time employment classified by NACE Rev. 2

16
NACE Description Part-time type Sex 2011 Average
2012 Average
(Revised)
2012 March
2013 March
2012 April
(Revised)
2013 April
Total Total 2,311 2,366 2,378 2,377 2,380 2,378
Part-timers holding a Full-Time Job Total 1,364 1,375 1,390 1,371 1,390 1,374
Part-timers holding a Full-Time Job Males 1,309 1,317 1,334 1,308 1,334 1,307
Part-timers holding a Full-Time Job Females 55 58 56 63 56 67
Part-Time as a Primary Job Total 947 991 988 1,006 990 1,004
Part-Time as a Primary Job Males 802 830 826 846 827 843
Part-Time as a Primary Job Females 145 161 162 160 163 161
Total Total 37 33 33 33 33 33
Part-timers holding a Full-Time Job Total 11 10 10 9 9 9
Part-timers holding a Full-Time Job Males 10 9 9 8 8 8
Part-timers holding a Full-Time Job Females 1 1 1 1 1 1
Part-Time as a Primary Job Total 26 23 23 24 24 24
Part-Time as a Primary Job Males 18 15 15 16 16 16
Part-Time as a Primary Job Females 8 8 8 8 8 8
Total Total 2,930 2,922 2,846 3,015 2,848 3,001
Part-timers holding a Full-Time Job Total 1,207 1,170 1,123 1,193 1,130 1,201
Part-timers holding a Full-Time Job Males 989 953 918 962 921 966
Part-timers holding a Full-Time Job Females 218 217 205 231 209 235
Part-Time as a Primary Job Total 1,723 1,752 1,723 1,822 1,718 1,800
Part-Time as a Primary Job Males 902 916 902 947 890 927
Part-Time as a Primary Job Females 821 836 821 875 828 873
Total Total 8 8 8 8 8 8
Part-timers holding a Full-Time Job Total 4 4 4 4 4 4
Part-timers holding a Full-Time Job Males 4 4 4 4 4 4
Part-timers holding a Full-Time Job Females - - - - - -
Part-Time as a Primary Job Total 4 4 4 4 4 4
Part-Time as a Primary Job Males 3 3 3 3 3 3
Part-Time as a Primary Job Females 1 1 1 1 1 1
Total Total 186 183 179 189 177 192
Part-timers holding a Full-Time Job Total 74 72 67 71 68 69
Part-timers holding a Full-Time Job Males 65 62 57 61 58 60
Part-timers holding a Full-Time Job Females 9 10 10 10 10 9
Part-Time as a Primary Job Total 112 111 112 118 109 123
Part-Time as a Primary Job Males 61 64 65 68 65 72
Part-Time as a Primary Job Females 51 47 47 50 44 51
01-03 Agriculture, forestry and fishing
05-09 Mining and quarrying
10-33 Manufacturing
35 Electricity, gas, steam and air conditioning supply
36-39Water supply; sewerage, waste management and remediation activities
Table 4. Sectoral distribution of part-time employment classified by NACE Rev. 2 …

17
NACE Description Part-time type Sex 2011 Average
2012 Average
(Revised)
2012 March
2013 March
2012 April
(Revised)
2013 April
Total Total 1,565 1,632 1,635 1,668 1,657 1,665
Part-timers holding a Full-Time Job Total 835 860 869 869 877 866
Part-timers holding a Full-Time Job Males 804 816 822 820 827 818
Part-timers holding a Full-Time Job Females 31 44 47 49 50 48
Part-Time as a Primary Job Total 730 772 766 799 780 799
Part-Time as a Primary Job Males 585 613 603 635 617 635
Part-Time as a Primary Job Females 145 159 163 164 163 164
Total Total 9,082 9,579 9,306 9,915 9,381 9,940
Part-timers holding a Full-Time Job Total 3,245 3,385 3,290 3,476 3,285 3,468
Part-timers holding a Full-Time Job Males 2,239 2,291 2,254 2,316 2,242 2,305
Part-timers holding a Full-Time Job Females 1,006 1,094 1,036 1,160 1,043 1,163
Part-Time as a Primary Job Total 5,837 6,194 6,016 6,439 6,096 6,472
Part-Time as a Primary Job Males 1,871 1,957 1,903 2,005 1,933 2,033
Part-Time as a Primary Job Females 3,966 4,237 4,113 4,434 4,163 4,439
Total Total 1,950 2,057 1,911 2,133 1,940 2,185
Part-timers holding a Full-Time Job Total 893 891 849 870 850 888
Part-timers holding a Full-Time Job Males 774 759 726 738 725 753
Part-timers holding a Full-Time Job Females 119 132 123 132 125 135
Part-Time as a Primary Job Total 1,057 1,166 1,062 1,263 1,090 1,297
Part-Time as a Primary Job Males 712 771 702 832 713 860
Part-Time as a Primary Job Females 345 395 360 431 377 437
Total Total 9,687 10,334 9,579 10,018 9,753 10,251
Part-timers holding a Full-Time Job Total 3,691 3,851 3,621 3,766 3,604 3,728
Part-timers holding a Full-Time Job Males 2,603 2,709 2,591 2,636 2,581 2,595
Part-timers holding a Full-Time Job Females 1,088 1,142 1,030 1,130 1,023 1,133
Part-Time as a Primary Job Total 5,996 6,483 5,958 6,252 6,149 6,523
Part-Time as a Primary Job Males 2,766 3,014 2,747 2,950 2,842 3,074
Part-Time as a Primary Job Females 3,230 3,469 3,211 3,302 3,307 3,449
Total Total 1,490 1,508 1,498 1,537 1,523 1,515
Part-timers holding a Full-Time Job Total 797 807 815 796 816 790
Part-timers holding a Full-Time Job Males 577 581 585 580 587 576
Part-timers holding a Full-Time Job Females 220 226 230 216 229 214
Part-Time as a Primary Job Total 693 701 683 741 707 725
Part-Time as a Primary Job Males 363 370 355 402 369 400
Part-Time as a Primary Job Females 330 331 328 339 338 325
49-53 Transportation and storage
55-56 Accommodation and food service activities
41-43
58-63 Information and communication
… Table 4. Sectoral distribution of part-time employment classified by NACE Rev. 2
Construction
45-47Wholesale and retail trade;
repair of motor vehicles and motorcycles
18
NACE Description Part-time type Sex 2011 Average
2012 Average
(Revised)
2012 March
2013 March
2012 April
(Revised)
2013 April
Total Total 642 688 717 730 714 723
Part-timers holding a Full-Time Job Total 225 252 262 278 265 275
Part-timers holding a Full-Time Job Males 143 168 177 184 178 183
Part-timers holding a Full-Time Job Females 82 84 85 94 87 92
Part-Time as a Primary Job Total 417 436 455 452 449 448
Part-Time as a Primary Job Males 133 146 153 150 151 150
Part-Time as a Primary Job Females 284 290 302 302 298 298
Total Total 560 598 582 631 591 642
Part-timers holding a Full-Time Job Total 273 296 296 312 303 318
Part-timers holding a Full-Time Job Males 173 182 180 190 187 197
Part-timers holding a Full-Time Job Females 100 114 116 122 116 121
Part-Time as a Primary Job Total 287 302 286 319 288 324
Part-Time as a Primary Job Males 110 114 103 113 103 113
Part-Time as a Primary Job Females 177 188 183 206 185 211
Total Total 3,242 3,492 3,427 3,614 3,479 3,684
Part-timers holding a Full-Time Job Total 1,506 1,569 1,537 1,612 1,557 1,639
Part-timers holding a Full-Time Job Males 954 967 964 992 980 1,005
Part-timers holding a Full-Time Job Females 552 602 573 620 577 634
Part-Time as a Primary Job Total 1,736 1,923 1,890 2,002 1,922 2,045
Part-Time as a Primary Job Males 693 792 785 841 797 866
Part-Time as a Primary Job Females 1,043 1,131 1,105 1,161 1,125 1,179
Total Total 4,623 5,104 5,098 5,303 5,146 5,335
Part-timers holding a Full-Time Job Total 2,451 2,588 2,589 2,635 2,605 2,622
Part-timers holding a Full-Time Job Males 1,786 1,842 1,816 1,850 1,823 1,857
Part-timers holding a Full-Time Job Females 665 746 773 785 782 765
Part-Time as a Primary Job Total 2,172 2,516 2,509 2,668 2,541 2,713
Part-Time as a Primary Job Males 908 1,043 995 1,118 1,010 1,138
Part-Time as a Primary Job Females 1,264 1,473 1,514 1,550 1,531 1,575
Total Total 1,650 1,684 1,689 2,030 1,684 2,033
Part-timers holding a Full-Time Job Total 439 463 463 704 458 709
Part-timers holding a Full-Time Job Males 224 239 251 355 247 357
Part-timers holding a Full-Time Job Females 215 224 212 349 211 352
Part-Time as a Primary Job Total 1,211 1,221 1,226 1,326 1,226 1,324
Part-Time as a Primary Job Males 244 238 246 288 249 288
Part-Time as a Primary Job Females 967 983 980 1,038 977 1,036
64-66 Financial and insurance activities
… Table 4. Sectoral distribution of part-time employment classified by NACE Rev. 2
77-82 Administrative and support service activities
68 Real estate activities
Professional, scientific and technical activities69-75
84Public administration and
defence; compulsory social security

19
NACE Description Part-time type Sex 2011 Average
2012 Average
(Revised)
2012 March
2013 March
2012 April
(Revised)
2013 April
Total Total 5,173 5,281 5,388 5,241 5,441 5,309
Part-timers holding a Full-Time Job Total 2,844 2,844 2,940 2,725 2,954 2,740
Part-timers holding a Full-Time Job Males 1,508 1,494 1,548 1,399 1,557 1,418
Part-timers holding a Full-Time Job Females 1,336 1,350 1,392 1,326 1,397 1,322
Part-Time as a Primary Job Total 2,329 2,437 2,448 2,516 2,487 2,569
Part-Time as a Primary Job Males 841 877 900 900 917 925
Part-Time as a Primary Job Females 1,488 1,560 1,548 1,616 1,570 1,644
Total Total 2,903 2,949 2,857 3,192 2,888 3,184
Part-timers holding a Full-Time Job Total 1,257 1,333 1,306 1,442 1,306 1,437
Part-timers holding a Full-Time Job Males 546 568 566 601 569 602
Part-timers holding a Full-Time Job Females 711 765 740 841 737 835
Part-Time as a Primary Job Total 1,646 1,616 1,551 1,750 1,582 1,747
Part-Time as a Primary Job Males 285 297 284 351 289 346
Part-Time as a Primary Job Females 1,361 1,319 1,267 1,399 1,293 1,401
Total Total 1,480 1,669 1,592 1,786 1,609 1,779
Part-timers holding a Full-Time Job Total 702 787 770 834 764 833
Part-timers holding a Full-Time Job Males 460 514 509 540 507 538
Part-timers holding a Full-Time Job Females 242 273 261 294 257 295
Part-Time as a Primary Job Total 778 882 822 952 845 946
Part-Time as a Primary Job Males 362 408 386 432 398 439
Part-Time as a Primary Job Females 416 474 436 520 447 507
Total Total 2,344 2,208 1,994 2,072 2,005 2,091
Part-timers holding a Full-Time Job Total 719 697 638 667 644 670
Part-timers holding a Full-Time Job Males 468 434 394 396 397 396
Part-timers holding a Full-Time Job Females 251 263 244 271 247 274
Part-Time as a Primary Job Total 1,625 1,511 1,356 1,405 1,361 1,421
Part-Time as a Primary Job Males 519 490 437 436 440 441
Part-Time as a Primary Job Females 1,106 1,021 919 969 921 980
Total Total 3 7 9 10 9 10
Part-timers holding a Full-Time Job Total - 2 2 3 2 3
Part-timers holding a Full-Time Job Males - 1 1 2 1 2
Part-timers holding a Full-Time Job Females - 1 1 1 1 1
Part-Time as a Primary Job Total 3 5 7 7 7 7
Part-Time as a Primary Job Males - 1 1 1 1 1
Part-Time as a Primary Job Females 3 4 6 6 6 6
85 Education
… Table 4. Sectoral distribution of part-time employment classified by NACE Rev. 2
Activities of households as employers; undifferentiated
goods and services-producing activities of
households for own use
86-88
94-96 Other service activities
97-98
Human health and social work activities
90-93 Arts, entertainment and recreation

20
NACE Description Part-time type Sex 2011 Average
2012 Average
(Revised)
2012 March
2013 March
2012 April
(Revised)
2013 April
Total Total 22 21 22 20 22 20
Part-timers holding a Full-Time Job Total 3 2 2 2 2 2
Part-timers holding a Full-Time Job Males 2 1 1 1 1 1
Part-timers holding a Full-Time Job Females 1 1 1 1 1 1
Part-Time as a Primary Job Total 19 19 20 18 20 18
Part-Time as a Primary Job Males 5 4 4 3 4 3
Part-Time as a Primary Job Females 14 15 16 15 16 15
Total Total 51,888 54,323 52,748 55,522 53,288 55,978
Part-timers holding a Full-Time Job Total 22,540 23,258 22,843 23,639 22,893 23,645
Part-timers holding a Full-Time Job Males 15,638 15,911 15,707 15,943 15,734 15,948
Part-timers holding a Full-Time Job Females 6,902 7,347 7,136 7,696 7,159 7,697
Part-Time as a Primary Job Total 29,348 31,065 29,905 31,883 30,395 32,333
Part-Time as a Primary Job Males 12,183 12,963 12,415 13,337 12,634 13,573
Part-Time as a Primary Job Females 17,165 18,102 17,490 18,546 17,761 18,760
Total
99 Activities of extraterritorial organisations and bodies
… Table 4. Sectoral distribution of part-time employment classified by NACE Rev. 2

21
Methodological Notes
1. In line with international methodology, annual data are being presented as an average for eachrespective year.
2. The statistics in this release are based on the administrative records of the Employment and TrainingCorporation (ETC).
3. The data in this release may be subject to revision. Monthly data are revised in the subsequent year.
4. Full/part-time status is defined by what the employer (employer or self-employed) declares in theEngagement Form which is required to be sent to the ETC upon the commencement of employment.
5. As from January 2013, the number of apprentices, trainees and students are no being included undertheir respective economic activity.
Definitions:
Malta/Gozo employment: Data on regional employment differ on the basis of economic sector. Accordingly,the data of the private sector depend on employee residence, whereas the data of the public sector depend onemployer information of location of its employees.
Part 1 of the unemployment register: Persons registering under Part 1 are either new job seekers who haveleft school, re-entrants into the labour market, and job losers who have been made redundant by their formeremployer.
Part 2 of the unemployment register: Persons registering under Part 2 are either workers who have beendismissed from work due to disciplinary action, left work out of their own free will, refused work or trainingopportunities or were struck off the register after an inspection by the Law Enforcement personnel.
Apprentices, trainees and students: Includes apprentices, trainees, Junior College and University students in the summer work-phase, undergraduate trainees, and trainees with fixed contracts.
Labour Supply: The sum of the full-time gainfully occupied population and the registered unemployedpopulation.