durham e-theses nmr studies of solid nitrogen-containing
TRANSCRIPT

Durham E-Theses
NMR studies of solid nitrogen-containing dyestu�s
McGeorge, Gary
How to cite:
McGeorge, Gary (1996) NMR studies of solid nitrogen-containing dyestu�s, Durham theses, DurhamUniversity. Available at Durham E-Theses Online: http://etheses.dur.ac.uk/5197/
Use policy
The full-text may be used and/or reproduced, and given to third parties in any format or medium, without prior permission orcharge, for personal research or study, educational, or not-for-pro�t purposes provided that:
• a full bibliographic reference is made to the original source
• a link is made to the metadata record in Durham E-Theses
• the full-text is not changed in any way
The full-text must not be sold in any format or medium without the formal permission of the copyright holders.
Please consult the full Durham E-Theses policy for further details.
Academic Support O�ce, Durham University, University O�ce, Old Elvet, Durham DH1 3HPe-mail: [email protected] Tel: +44 0191 334 6107
http://etheses.dur.ac.uk

NMR Studies of Solid Nitrogen-Containing
Dyestuffs The copyright of this thesis rests with the author.
No quotation from it should be pubhshed without
his prior written consent and information derived
from it should be acknowledged.
by
Gary McGeorge
B.Sc. University of Glasgow
A thesis submitted in partial fiilfilment of the requirements for
the degree of Doctor of Philosophy
Department of Chemistry
University of Durham
1996
1 Q MAR 1997

Memorandum.
The research in this thesis has been carried out in the Department of Chemistry of the University of Durham between October 1993 and September 1996. It is the original work of the author unless otherwise stated. None of this work has been submitted for any other degree.
The copyright of this thesis rests with the author. No quotation from it
should be published without his prior written consent and information derived from
it should be acknowledged.
Acknowledgements.
There are a number of people I wish to thank who have contributed either
directly or indirectly to the work in this thesis.
First, I would like to express thanks to my supervisor Professor Robin K.
Harris for his supervision throughout the last three years, for financial aid to attend
several conferences, and also for the opportunity to study at the University of Utah
for three months. Barry Say, Dr A. M. Kenwright, Ian McKeag, Dr. D. C.
Apperley, Nicola Apperley, Dr. U. Scheler and Dr. R. Challoner are all thanked for
their helpful discussions and suggestions. Additionally, thanks are due to Dr. A.
Porte at the University of Glasgow for introducing me to solid-state NMR during my
undergraduate research project.
I would also like to thank EPSRC and Zeneca Specialties for financial
support under a CASE award, without which I could not have carried out this
research. At Zeneca, Drs. A. M. Chippendale, J. Bullock, C. Brennan, N. Hall and

B. Docherty, are all thanked sincerely for their help in my understanding of various
fields of colour chemistry.
During my three months stay in Utah I made several friends who all made
me feel very welcome and ensured that my stay was a pleasant one. Professor D. M.
Grant should be thanked firstly for his kind invitation to work under him for the
three month duration and use his spectrometers, along with Anita Orendt, Mark
Solum, J. Harper and S. Bia who helped me understand and appreciate the Utahan
way of life.
On a more personal note I thank my fellow members of the Durham NMR
group over the past three years for their friendship: Stefan, Elke, Graham, Abdul,
Peter, Anna, Tim, Se-Woung, Steve Carss, Steve Breen, Alison, Minoru, John and
Susan.
Finally, I would like to thank Claire for putting up with me during the last
three years, and for her patience and understanding whilst this thesis was being
written.

NMR Studies of Solid Nitrogen-Containing Dyestuffs.
Gary McGeorge, B. Sc.
Abstract.
This thesis is concerned with the structural analysis of dyestuffs in their
natural solid state by the application of solid-state nuclear magnetic resonance.
These dysetuffs are all derived from the phenylazobenzene group, but tautomerism
can produce structural changes, which have so far been uncharacterised in the solid
state for many of the dyestuffs currently under investigation.
The information obtainable from ^ C and chemical shifts, both isotropic
and anisotropic will be applied in this structure determination. Under magic-angle
spinning the anisotropic nature of solid-state interactions is partially averaged or
removed. The rotational resonance technique will be presented, which reintroduces
the homonuclear dipolar interaction allowing dipolar coupling constants to be
measured. Second-order effects arising from the ' ' ' N quadrupole interaction broaden
spin-1/2 lines (RDC) in such a manner that bond lengths can be determined. This
RDC analysis wil l be applied to a series of hydrazone structures to determine the
^^N-''*N bond length within the hydrazone linkage. Finally, the two-dimensional
magic-angle turning experiment wil l be discussed and applied to both the '^C and
^'N nuclei for a range of dyestuffs to show that accurate shielding tensor information
can be obtained from large molecules.

Table of Contents.
1. I N T R O D U C T I O N 1
1.1 THESIS OVERVIEW 3
2. E X P E R I M E N T A L 6
2.1 SAMPLE PREPARATION AND CHARACTERISATION. 6
2.2 NMR. 7
2.2.1 Magic-angle spinning (MAS) 7
2.2.2 Variable Temperature Operation 7
2.2.3 Observation of C-13 9
2.2.4 Observation of N-15 9
2.2.5 Pulse Sequences 10
3. A N A L Y S I S O F T H E P O L Y M O R P H S O F D R 2 7 8 12
3.1 INFORMATION FROM TRADITIONAL NON-NMR TECHNIQUES 13
3.2 ELUCIDATION OF T H E SOLUTION STATE STRUCTURES 15
3.3 SOLID-STATE STRUCTURES OF T H E POLYMORPHS OFDR278 24
3.3.1 Carbon-13 NMR 24
3.3.2 Nitrogen-15 NMR 30
4. K I N E T I C S A N A L Y S I S O F A L A R G E - A M P L I T U D E R E O R I E N T A T I O N 38
4.1 INTRODUCTION 38
4.1.1 Bandshape Analysis 41
4.2 MAGNETISATION TRANSFER EXPERIMENTS 45
4.2.1 I D Selective Polarisation Inversion (SPI) 45
4.2.1.1 Results: Application to DR278form II. 52
4.2.2 Two-dimensional exchange (EXSY) 60
5. I N V E S T I G A T I O N O F T A U T O M E R I S M I N S U L P H O N I C A C I D A Z O B E N Z E N E D E R I V A T I V E S B Y C - 1 3 A N D N-15 N M R 67
5.1 APPLICATIONOFC -13 AND N-15 NMR FOR
T H E ANALYSIS OF CARBOCYCLIC AZO DYES: A REVIEW 69
5.1.1 c-13 NMR 69
5.1.2 N-15 NMR 73

5.2 ANALYSIS OF NMR SPECTRA FOR A SERIES OF WATER SOLUBLE DYES 75
5.2.1 C-13 NMR 75
5.2.2 N-15 NMR 98
5.3 T H E SOLID-STATE STRUCTURE OF A TYPICAL R E A C T I V E AZO DYESTUFF . 108
6. A N A L Y S I S O F D I P O L A R C O U P L E D S P I N S Y S T E M S
U S I N G N-15 N M R 115
6.1 INTRODUCTION 115
6.2 SHIELDING THEORY:- S P E C L \ L EMPHASIS ON NITROGEN 116
6.3 ^^N TENSOR ANALYSIS OF AZO AND IMINE GROUPS 121
6.3.1 DR278 Polymorph H: a (Ha), p (IIP) and a, P (Ildl) '^N-labelled samples 123
6.3.2 DR278 Polymorph V I : p (Vip) labeUed samples 132
6.3.3 Sulphonic acid azobenzene derivatives: P-labelled samples 133
6.4 REINTRODUCTION OF DIPOLAR INTERACTIONS UNDER MAS CoNDmoNS 139
6.4.1 Rotational Resonance: R^ 140
7. M A G I C - A N G L E T U R N I N G S P E C T R O S C O P Y 150
7.1 INTRODUCTION. 150
7.2 THEORY OF MAT 151
7.3 APPLICATION OF " C AND ^^N P H O R M A T TO D Y E S AND PIGMENTS 157
7.3.1 CI-PV19: Y Linear-trans-quinacridone 157
7.3.2 DR278 V I 162
7.3.3 CI Pigment Red 57:1 164
8. A P P E N D I X 168
9. A D D E N D U M 190

Chapter 1 L
1. Introduction.
Nuclear magnetic resonance last year celebrated its 50th anniversary and
several historical articles have been written which trace out the evolution of this
important analytical technique.' Consequently, an encyclopaedia engaging all areas
of NMR was published, which contains over 600 articles.^ From a brief glance at
these articles one can realise the great progress that has occurred in this field.
The comer-stone of modem solid-state NMR is the combination of cross
polarisation^ with magic-angle spinning'* (CP/ MAS), which has allowed the
observation of spin systems containing nuclei of low natural abundance, e.g. and
'^C. The lack of rapid isotropic molecular motion, as in solutions, renders the
spectral features broad and featureless, and to obtain the high resolution desired in
* C or ' ' N spectra, MAS and high-power proton decoupling have to be applied.
These techniques have allowed the determination of molecular stmctures that could
not have been contemplated without such techniques. Extensions to these techniques
have allowed two-dimensional experiments, analogous to solution-state ones, to be
routinely obtained, opening up a whole new field. Two-dimensional studies of
dynamic processes and molecular order in polymeric systems, for example, have
proven useful in understanding their physical properties.^
The same interactions that one tries to remove to increase spectral resolution
contain valuable information, and over the last decade solid-state nuclear magnetic
resonance has undergone a dramatic transformation as a result of several technique
developments, which allow the reintroduction of these interactions in a predictable

Chapter 1 _2.
manner. These are principally the spin-spin dipolar coupling and the anisotropy in the shielding tensor. Dipolar coupling constants can provide constraints in the structural elucidation of biomolecules, which was previously not possible due to the removal of such couplings by rapid MAS. Additionally, the anisotropy of the shielding tensor can provide further structural information relating to the distribution of electron density surrounding a particular nucleus, and new two-dimensional techniques allow the accurate determination of the shielding tensors for various sites within a molecule.
The main problems concerning solid-state NMR are those of sensitivity and
spectral resolution. For solid-state NMR to progress into the next century and
compete with solution-state high-resolution NMR, I believe that it is paramount that
these two problems should be solved. Both of these issues are being addressed by
several pioneering laboratories. The combination of electron spin resonance
spectroscopy with NMR spectroscopy in a technique called dynamic nuclear
polarisation spectroscopy (DNP)^ has showed that hundred-fold increases in
sensitivity can be observed for spectra obtained from dilute spin systems. This will
open up a whole new world of stuctural elucidation for the NMR spectroscopist
interested in biomolecules, for example. The sensitivity issue has also been
approached by increasing the static field strength to the maximum possible for solid-
state NMR at the current moment; that of 750 MHz. Increased resolution has also
been obtained by the application of solid-state NMR at this increased field strength,
with J-coupling being observed in the spectra of rigid organic solids.^ Increased
resolution has also been possible by the application of a two-pulse phase modulation

Chapter 1 3_
decoupling scheme, which increases the efficiency of high-power proton decoupling.
1.1 Thesis Overview.
In this thesis several techniques, both old and new, will be presented which
allow the determination of dipolar and shielding parameters, which are useful in
understanding the structural features of several dye systems. Chapter 2 will discuss
some of the experimental techniques used in the NMR experiments, along with
pertinent information about other analytical techniques used throughout the thesis.
In Chapter 3 the reader will be taken through the structural elucidation of a
disperse azobenzene dyestuff. The phenomenon of polymorphism and molecular
reorientation wil l be addressed, and how they manifest themselves in the NMR
spectra of the '^C and nuclei will be illustrated. Single crystal X-Ray data will
be used to confirm the structures derived from the NMR study. Once the basic
structures have been discussed, the kinetics of a large-amplitude dynamic
reorientation wil l be analysed in Chapter 4 for one of the polymorphs of the same
dye. A simple one-dimensional technique to measure exchange rates was used to
obtain accurate estimates for the rate of inter-conversion.
In Chapter 5 the structures for a range of water-soluble sulphonic acid
phenylazobenzene dyestuffs wil l be determined from "C and NMR. Tautomeric
inter-conversion was found to occur upon protonation of the sulphonate group, and
the three-dimensional structure in the crystalline-state suggests formation of dimers
and/ or higher order-oligomers. Using the simple azobenzene dyes as model

Chapter 1 4.
samples allows one to extend the size of dyestuffs which can be investigated via solid-state NMR. A reactive dyestuff will be presented as a typical example of a large mono-azo dyestuff.
In Chapter 5 structures were discussed using the information obtainable from
the isotropic shifts in the relevant NMR spectra. However, distinct advantages occur
when one retains the anisotropic shielding and the direct dipolar coupling
information. Chapter 6 will address this issue by analysing the spectral properties of
^^N NMR as applied to enriched samples. Nitrogen-15 rotational resonance
spectra clearly demonstrate the reintroduction of the homonuclear '^N- dipolar
coupling which is removed by rapid MAS. Finally, in Chapter 7 a technique called
PHORMAT will be presented which enables one to determine the principal
components of the shielding tensor for systems which exhibit spectral congestion in
one dimension.

Chapter 1 5
References.
r
1 a/. E. R. Andrew and E. Szczesnaik, Prog. Nucl. Magn. Reson., 28, 11-36,
(1995).
hi. J. W. Elmsley and J. Feeney, Prog. Nucl. Magn. Reson., 28, 1-9, (1995).
2 'Encyclopaedia of Nuclear Magnetic Resonance', eds D. M. Grant and R. K.
Harris, Wiley, London, (1995).
3 J. Schaefer and E. O. Stejskal, J. Am. Chem. Soc, 98, 1030, (1976).
4 E. R. Andrew, A. Bradbury and R. G. Eades, Nature, 182, 1659, (1958).
5 A. Hagemeyer, K. Schmidt-Rohr and H. W. Speiss, Adv. Magn. Reson., 13, 85,
(1989).
6 R. A. Wind, M . J. Duijwestijn, C. van der Lugt, A. Manenschijn and J. Vriend,
Prog. Nucl. Magn. Reson., 17, 33, (1985).
7 K. W. Zilm, selection of posters at ENC, Asilomar, 1996.
8 A. E. Bennett, C. M . Rienstra, M. Auger, K. V. Lakshmi and R. G. Griffin, J.
Chem. Phys., 103, 6951, (1995).

Chapter 2 6
2. Experimental
2.1 Sample Preparation and Characterisation.
Virtually all of the samples in this thesis were supplied by Zeneca Specialties
from their fine-chemical collection. The three samples of '^N-enriched DR278 were
prepared by Dr. N. Hall at Zeneca. The 3-labelled sodium sulphonate dyes used
were synthesised using standard techniques, with N H 4 ' ' N 0 2 as a starting material
for the preparation of the diazonium cation. The free acids were obtained from the
sodium salts by recrystallisation from I M aqueous hydrochloric acid solution. Al l
samples were checked for purity by solution-state proton NMR and by mass
spectrometry. Elemental analysis verified the presence of free acid, by the absence
of sodium counterions, and allowed the determination of the degree of hydration.
The solid-state Raman and UV/ Vis spectra were obtained at Zeneca by Dr.
G. Dent and Dr. D. Williams, respectively. For the DR278 samples polymorphic
purity was determined by powder X-ray diffraction at the University of Durham by
Dr. C. Lehmann, using a Philips PW 1050 diffractometer.

Chapter 2 7_
2.2 NMR.
Three spectrometer types were used in the present investigation;- a
Chemagnetics CMX H, a Varian VXR and a Varian Unity Plus. The two Varian
spectrometers operate at 300 MHz for protons and are for all intents and purposes
identical. Three CMX I I spectrometers were utilised which range in field strength
from 100 MHz to 400 MHz. Every experiment carried out in this thesis involved the
initial creation of enhanced spin-polarisation by the cross-polarisation technique, for
the dilute spin system to be observed. This involves fiilfilling the Hartmann-Hahn
matching condition, which is generally obtained using suitable reference samples.
2.2.1 Magic-angle spinning (MAS).
The Chemagnetics probes used in the current investigation use pencil
spinning modules with independent bearing and drive gas inlets. The supply gas is
dry air which passes into an automated PID spin-rate controller which is capable of
locking the spin rate to ±5 Hz. This is essential for the careful and accurate analysis
of the spinning sideband spectra to obtain shielding tensor information via the
Herzfeld and Berger technique.^ Typical spin rates used were in the range of 2 kHz
to 6 kHz.
2.2.2 Variable Temperature Operation.
Several variable temperature experiments have been carried out and the
experimental procedure varies between the two systems. The Varian spectrometers
use Doty probes which have single bearings. The temperature of the bearing gas

Chapter 2 8.
(nitrogen gas when using VT) is modified by a heater which regulates the temperature that one wishes to require. For low-temperature experiments a heat exchanger is submerged in liquid nitrogen to cool the gas and the heater subsequently raises the temperature to the desired value.
For the Chemagnetics system there is a separate variable-temperature gas
inlet which is totally independent of the bearing and drive gas lines. This improves
the quality of the temperature stability in comparison to that obtainable by the Doty
system, and allows for better spinning stability at lower temperature. In general the
spinning gas is dry compressed air and the VT gas is nitrogen. A similar approach
to maintaining the required temperature is applied as in the Varian system.
Due to the fact that the thermocouple is not directly at the sample, the system
requires a calibration of the actual temperature. This can be carried out using
several techniques, each of which has its failings. VT calibration is inherently
difficult due to complications induced by the pressure effects (or frictional heating)
which arise during MAS. Thus, ideally one would calibrate the system for each
spinning speed, using a solid sample. At the time the spectra were recorded, the
temperature dependence of the '^C resonances within samarium acetate was used.
These shifts vary according to a polynomial equation given by Haw et al.^ The new
method of choice would be that of the observation of the ^°'Pb resonance in PbNOs
which exibits a linear shift dependence with temperature. Thermal gradients across
the sample can also be determined by careful analysis of the observed lineshape.
This has been shown to be a highly accurate technique over a large temperture
3,4 range.

Chapter 2 9_
2.2.3 Observation of C - 1 3
The primary objective for the observation of ^ C spectra is that of obtaining
the maximum resolution possible. This is carried out by spinning fast enough to
remove the effect of spinning sidebands and also by the application of suffiently
high-power proton decoupling. Typical decoupling powers correspond to a nutation
frequency of around 60 kHz (7t/2 pulse duration of ~4 |is). The Hartmann-Hahn
matching condition was determined by optimising the signal intensity for ^ C using
adamantane under slow MAS conditions (-1200 Hz). Referencing was carried out
by sample replacement, setting the high-frequency CHj resonance of adamantane to
38.4 ppm relative to TMS. Typical linewidths of adamantane were ~4 Hz. The
magic angle was set using the '^Br resonance from KBr, by optimising the intensity
of the rotational echos resulting from the first-order quadrupole interaction.
2.2.4 Observation of N-15.
For ^^N a 20% doubly-enriched sample of NH4NO3 was used for referencing
(the high frequency NO3 line being referenced to -5.1 ppm relative to CH3NO2),
setting the Hartmann-Hahn matching condition (using a spin rate of -2.5 kHz and
matching on the centreband) and also for setting the magic angle approximately.
The angle is particularly important for ' ' N work due to the huge shielding
anisotropy for the systems under investigation. It was discovered that some of the
'^-enriched azobenzene (and hydrazone) samples analysed were more sensitive to
the angle than NH4NO3, and as a result the angle could be set directly on the sample
under investigation.

Chapter 2 10_
In this thesis the nitrogen scale used is that of the CH3NO2. Significant discussion has centred around nitrogen referencing, and several people use the liquid ammonia scale, in which most resonances have positive 6. However, due to handling problems many people prefer to use the CH3NO2 scale, where most signals possess negative shifts.
2.2.5 Pulse Sequences.
For the observation of high-resolution solid-state NMR spectra application of
simple CP/ MAS with flip-back^ was used in most cases. For these spectra a dead-
time is required which results in the necessity for applying a first-order phase
correction to the spectrum. To solve this problem the standard Hahn-echo sequence
was applied. Removal of the decoupler for a short period, -40 |is, removes the
presence of protonated '^C signals (with the exception of CH3 signals, due to the
rapid rotation about the C3 axis) from the spectrum, which is known as interrupted
decoupling. Subtraction of signals arising in the interrupted decoupling from those
obtained using the Hahn-echo sequence, results in a spectrum which contains
protonated signals only.
The Hahn-echo sequence is also used for the accurate determination of the
powder pattems in the '^N spectra under static conditions. The acquisition time was
started exactly at the top of the spin echo to remove the effect of receiver dip.
During static operation the purge and VT gas were used, each with flow rates of -20
standard cubic feet per hour to maintain temperature stability within the probe body,
and to reduce radio frequency heating.

Chapter 2 H .
References.
1 J. Herzfeld and A. Berger, J. Chem. Phys., 73, 6021, (1980).
2 J. F. Haw, G. C. Campbell and R. C. Crosby, Anal. Chem., 58,b 3173, (1986).
3 A. Bielecki and D. P. Burum, J. Magn. Reson., 116, 215, (1995).
4 L. C. M. van Gorkom, J. M. Hook, M. B. Logan, J. V. Hanna, R. E. Wasylishen,
Magn. Reson. Chem., 33, 791, (1995).
5 J. Tegenfeldt and U. Haeberlen, J. Magn. Reson., 36, 453, (1979).

Chapter 3 12.
3. Analysis of the polymorphs of DR278.
The azobenzene dye Colour Index (CI) Disperse Red (DR) 278, 2'-
acetamido-4'-[N,N-bis(2-methoxycarbonylethyl)amino]-4-nitroazobenzene, (1), is a
member of the class of disperse dyes used in the dyeing of polyester fibres.
Monoazo dyes of this type are the single most important class of dye. Subtle
changes in substituents at various positions are known to significantly influence the
colour, tinctorial strength, dye-fibre affinity and the fastness properties.*' Visible
spectroscopy in solution has shown that any intra-molecular hydrogen-bond
formation can strongly influence the colour and solvent interactions generally affect
the hydrogen-bonding nature of the system. This becomes important in an analysis
sense because a large proportion of structural analytical techniques require the use of
solvents, therefore, careful choice of solvents is essential. Additionally, the sorption
process in which disperse dyes are generally thought to associate with polyester
fibres assumes that the dyes are rigidly held within the pores of the fibre.
Correspondingly, any technique that analyses the material in its natural solid state
would hold distinct advantages over solution techniques.
0 2 N — / Q V - N = N ^ Q w
(1) CIDR278

Chapter 3 \ 13_
3.1 Information from traditional non-NMR techniques.
In the solid state this dye has three known crystalline states or polymorphs.
Two of these polymorphs were reported to exist prior to the start of this project, but
very little was known about their structure, particularly about the nature of any intra
molecular hydrogen bonding that may be present. The polymorphs have been
labelled as forms A, B and C according to the X-ray powder diffraction patterns
shown in Figure 1. Form C is now currently in use by the Zeneca colours
specialists, because it is thought to be the state of lowest free energy. Generally,
differential scanning calorimetry (DSC) and X-ray powder diffraction are two of the
methods of choice for the analysis of polymorphs,'' due to their ease and speed of
characterisation of a particular material. DSC is particularly useful for the
determination of phase changes and melting point determination. For example, one
polymorph could spontaneously convert to another polymorph prior to melting.
However these techniques do not give a means of obtaining structural information.
Infrared spectroscopy has, until recently, been the only tool for the analysis
of the structure of these polymorphs. Resonance Raman and solid-state NMR are
becoming particularly important because of advances in experimental design. In this
section I shall attempt to solve the structure of all three polymorphs using solid-state
NMR along with supporting evidence from the afore-mentioned techniques.

Chapter 3 14
-1 1 1 r n i 1 1 7 10 13 16 19 22 25 28 31 34
2Q /Degrees
Figure 1
X-ray powder diffraction patterns for (a) polymorph A, (b) polymorph B,
and (c) polymorph C.
Chapter 3 15_
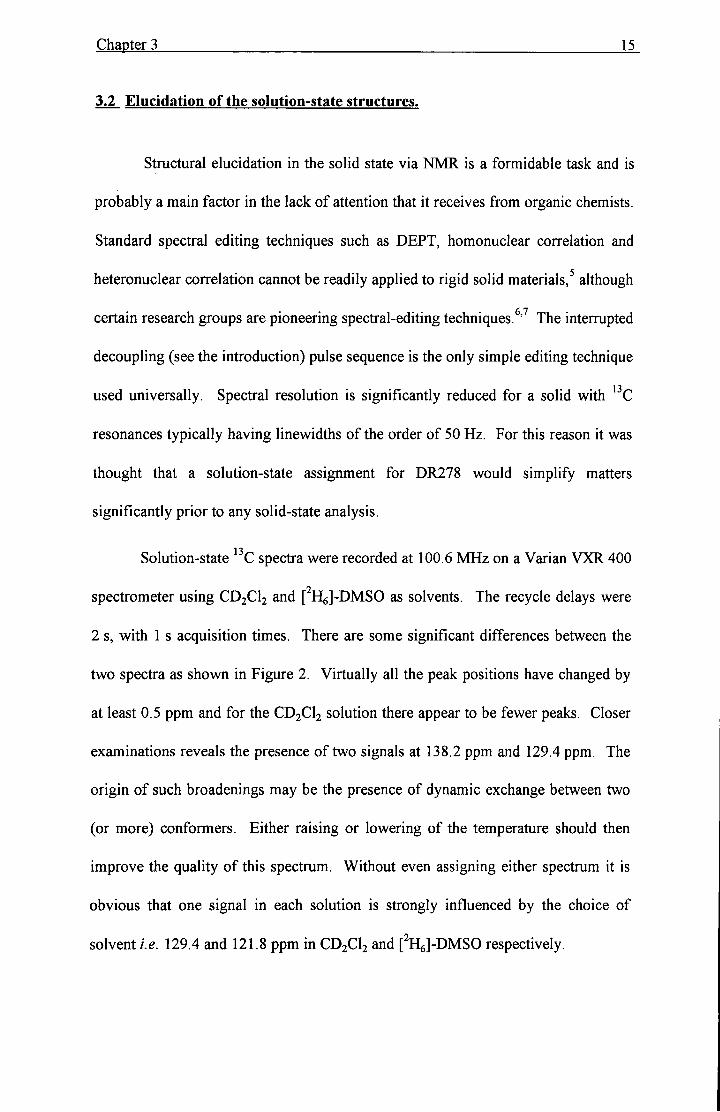
3.2 Elucidation of the solution-state structures.
Structural elucidation in the solid state via NMR is a formidable task and is
probably a main factor in the lack of attention that it receives from organic chemists.
Standard spectral editing techniques such as DEPT, homonuclear correlation and
heteronuclear correlation cannot be readily applied to rigid solid materials, although
certain research groups are pioneering spectral-editing techniques. '' The interrupted
decoupling (see the introduction) pulse sequence is the only simple editing technique
used universally. Spectral resolution is significantly reduced for a solid with ^ C
resonances typically having linewidths of the order of 50 Hz. For this reason it was
thought that a solution-state assignment for DR278 would simplify matters
significantly prior to any solid-state analysis.
Solution-state ' C spectra were recorded at 100.6 MHz on a Varian VXR 400
spectrometer using CD2CI2 and [ Hgl-DMSO as solvents. The recycle delays were
2 s, with 1 s acquisition times. There are some significant differences between the
two spectra as shown in Figure 2. Virtually all the peak positions have changed by
at least 0.5 ppm and for the CD2CI2 solution there appear to be fewer peaks. Closer
examinations reveals the presence of two signals at 138.2 ppm and 129.4 ppm. The
origin of such broadenings may be the presence of dynamic exchange between two
(or more) conformers. Either raising or lowering of the temperature should then
improve the quality of this spectrum. Without even assigning either spectrum it is
obvious that one signal in each solution is strongly influenced by the choice of
solvent i.e. 129.4 and 121.8 ppm in CDjClj and [ HeJ-DMSO respectively.

Chapter 3 16_
With these initial observations made, a complete assignment could be carried out. This was possible purely by comparison with the assignments for other related molecules. Substituent chemical shift calculations are of some use in substituted azobenzenes, but are limited due to the modification of the electron density distribution in one ring by the substituents in the other ring. These effects are maximum at the ipso and para positions relative to the azo linkage. The assignments are made with the assumption that the azo linkage is present in the trans orientation, which indicates that each pair of ortho and meta resonances are inequivalent even for the C6H4NO2 ring if the molecule is rigid. However, if rapid (on the NMR timescale) phenyl ring rotation occurs around the CI - N and/ or Cl'-N bond(s) then motional averaging will simplify the spectrum significantly. The numbering scheme for the structure is given in Figure 3 and the corresponding assignments given in Table 1.

Chapter 3 17
a/
•Lk •
b/
1 T 1 1 1 1 1 1 1 1 1 1 1 1 i 1 1 1 1 i—I 1 1 \ 1 1 — I 1 1 1 1 1 1 1 1 1 1 1 — I 1 — I
170 160 150 140 130 120 110 6/ipn
Figure 2
Room temperature solution-state '^C spectra of DR2 78 recorded in a/
tH]-DMSO and b/ CD2CI2. The "bump " at -129 ppm in b/ is a real
peak.

Chapter 3 18
3 2
0 , N -
5 6
\ 2 ' 3 ' , N' V - ^ a b c d
\ M ^ { ^ | ) ^ — N ( C H 2 C H 2 C O O C H 3 ) 2
6' 5'
(1)
5 6
3 2
(2)
NttH^CHjCOOCHj)
(3)
Figure 3
Dynamic equilibrium proposed for DR278 reorientation, with
corresponding numbering scheme.
Rapid phenyl ring-flips are indeed present, with C2 and C6 giving one
resonance at 122.3 ppm, while C3 and C5 similarly average to 124.5 ppm. Although
the symmetry is lost in the other ring due to the presence of the acetamido group it is
possible to verify that rapid ring rotation also occurs by analysis of the actual
chemical shift values. The presence of an acidic proton on the acetamido group
provides the opportunity for the formation of a six-membered ring via a N — H — N

Chapter 3 19_
hydrogen bond. Sterically, the non-hydrogen-bonded conformer (3) is favoured, with the ortho substituent pointing towards the neighbouring nitrogen lone pair. To
overcome the steric hindrance the N — H — N hydrogen bond must be sufficiently
strong to compensate, and it becomes possible to have a dynamic equilibrium
between the two conformers as shown in Figure 3. Visible spectroscopy has shown
that the intramolecular hydrogen-bond strength is weaker for the acetamido case in
comparison to the hydroxyl substituted derivative, as exemplified by the larger
solvatochromic shift for the acetamido moiety. Therefore polar, basic solvents will
hydrogen bond to the acidic amide proton, with DMSO being a typical example.
UV/ visible spectroscopy for DR278 shows a 16 nm bathochromic shift (496 nm to
512 nm) in going from CD2CI2 to DMSO solution. The large solvent dependency
can be explained by interruption of the intramolecular hydrogen bonding by the
DMSO molecule. This effect has been fully explained by Federov and co-workers
for a range of similar azo dyes using solution-state NMR. However, I believe that
8 9
his assignment regarding the shifts for C6' are rather confusing. Two papers '
analysing similar dyes give conflicting assignments. The latter (ref 9) is correct in
my opinion. As a result the dye-solvent intermolecular hydrogen-bonding, which is
favoured in DMSO, is associated with a low-frequency shift in the C6' resonance.
This can easily be visualised by considering the equilibrium outlined in Figure 4.

Chapter 3 20_
SOLVENT
(5)
Figure 4
At ambient probe temperatures it is impossible to tell anything about the
degree of solvation that this molecule may experience. This would require prior
knowledge of the chemical shifts of conformers (4) and (5). This information can be
obtained by carrying out a low-temperature spectrum. This was indeed done in the
CD2CI2 solution at -80 °C. Figure 5 gives the spectrum obtained at the reduced
temperature, and it can clearly be seen that there are two conformations present, with
approximately equal proportions. The low-temperature shifts and assignments are
given, along with the room temperature assignment, in Table 1. The actual extreme
values for the two C 6 ' signals are 138.3 ppm and 116.9 ppm for conformers (4) and
(5) respectively. From these low-temperature results we can see that 58% of the
material is present as conformer (4) in CD2CI2 solution, while only 23% is present as
conformer (4) in DMSO solution, as calculated by:

Chapter 3 21
Fractionil) = ': »' 'P> 5 C6(2) ~6 C6p^
where 5 C6(3-) and 5 C6(2) are the chemicals shifts of C6' in the -80 ° spectrum
and 5 C6j5(jis the observed shift at room temperature. The references to
conformations 2 and 3 have been used because that is the scheme which contains the
numbering of the nuclei.
Again, these results give significant evidence that DMSO strongly solvates
the dye. These mole fractions, as obtained from the shift values, roughly relate to
the relative intensities of the two conformations in the low-temperature spectrum.
Indeed, several of the shifts were assigned on the basis of intensities, the small
changes in shifts being insufficient to confidently assign signals to a particular
conformer. It must be remembered, however, that no intrinsic shift change as a
function of temperature has been accounted for. Carrying out the same calculation
as above, but using C2', gives 40% and 16% respectively. Both are consistently
lower by a factor of ca. 3/2 which suggests that the isotropic thermal effects on these
two shifts are in opposite directions. Thus averaging the two results will give a
rough estimate of the molar fraction of (2). i.e. 50% and 20% in the two solutions.
Even at -80 °C phenyl ring-flips on the nitro substituted ring are still fast, producing
only averaged shifts. The origin of the small splittings observed is a result of the
slight modification of electron density around the rings by the formation of the
hydrogen bond, probaby due to the change in conjugation around the azo linkage.

Chapter 3 22
5/ ppm (Solution)
Carbon C D 2 C I 2 ["HgJ-DMSO
20 °C -80°C 20 °C
(2)' (3) 1 156.6 154.8 155.9 156.2
2,6 122.3 121.0 122.0 122.8
3,5 125.1 124.5 124.8
4 147.5 145.9 146.1 146.7
1' 131.6 129.6 130.5 132.1
2' 138.2 134.6 140.6 139.7
3' 101.4 99.6 102.0
4' 152.3 150.9 151.6 151.8
5' 107.8 106.6 107. 108.1
6' 129.4
(broad)
138.3 116.9 121.8
a 47.4 46.3 46.4
b 32.4 31.1 31.6
c 172.1 171.9 171.6
d 52.1 52.0 51.6
e 25.8 25.4 25.8 24.8
f 169.7 168.6 170.3 169.3
Table 1
Solution-state assignments for '^C spectra of I in solution, given in ppm
relative to the signal for IMS.
The more intense peaks are assigned to this conformer.

Chapter 3 23
3 00
CO T — I
O CO
8
5U
s
'-5
00
I o
5U

Chapter 3 24.
3.3 Solid-state structures of the polymorphs of DR278.
3.3.1 Carbon-13 NMR.
With a complete understanding of the solution-state structures and of the
effect that the azo linkage has upon the aromatic signals, a solid base has now been
established for the analysis of the polymorphs in their natural state. All three
polymorphs were packed into the rotors without any form of grinding or crushing. It
has been shown by Maciel that grinding can cause changes in the SSNMR spectra
of polymorphic forms. Differences in resonance Raman spectra can also result from
grinding with KBr, and hence nujol mulls are often preferred. Cross polarisation
with magic-angle spinning was employed to obtain high-resolution ' C spectra for
all three polymorphs. Figure 6. At first inspection it would appear that, although
some spectral features are similar, there are significant differences between the
solid-state and room-temperature solution-state spectra. Also, when comparing the
three polymorphs, the spectra again vary quite dramatically. It is clear from the
complexity of the spectra, and from comparison with the low-temperature solution-
state spectra, that polymorphs A and B contain conformationally different molecules
in the crystal lattice, with non-integral intensity ratios. This is a most unusual
situation for a single crystalline form, let alone for two distinct polymorphs.
At ambient temperature it is clear that the linewidths for all three polymorphs
are different, with form C giving the narrowest resonances. This is the structure
which is believed to exist as a single molecular entity in the crystal state, given the
relative simplicity of the spectrum. With the observation of 12 aromatic signals it is

Chapter 3 25
evident that the C2,C6 and C3,C5 pairs of signals are no longer averaged in this sample. Hence, phenyl ring rotation is hindered and the group is locked in a fixed orientation relative to the azo linkage. Chippendale et aC^ analysed this effect in a similar series of compounds. The parent molecule, /ra«5-azobenzene, showed that the C2-C6 splitting is around 13 ppm, while the C3-C5 splitting is far smaller, to the extent that no observable splitting can be detected unless narrow lines are observed. However, a splitting of 3 ppm was observed (ref 11) for C3-C5 and suggested to be typical of that which would generally arise from these meta ' C signals. With the solution-state spectra of DR278 and the information regarding locked conformations, the signals for polymorph C could be assigned. Table 2, and are thought to arise from a purely non-hydrogen-bonded molecule. C6' and C2' produce resonances at 118.4 ppm and 140.5 ppm respectively, close to the values found for conformer 3 in the low-temperature spectrum. Additionally it should be noted that the signals assigned to CI ' and C3' deviate from their solution shifts by approximately 4 ppm to higher frequency. This is probably due to the acetamido group being fixed out of the plane of the aromatic ring, introducing a steric contribution to the shift for these resonances. This out-of-plane rotation is only possible for molecules in the non-hydrogen-bonded conformer.
The situation is more complex for the other two polymorphs which is
primarily due, as suggested before, to the reduced spectral resolution. If two
conformers mutually exchange then any broadening would be expected to be less at
a higher static field strength. Also, with the presence of several '''N nuclei it is
12
possible to experience residual dipolar coupling of the quadrupolar nucleus to the
directly bonded ' C, which is again reduced at higher field strengths. With this

Chapter 3 26.
supposition, •'C CP/MAS spectra were recorded at 50 MHz and 75 MHz for both
polymorphs. The 50 MHz spectra are shown in Figure 6, and the 75 MHz spectrum
for polymorph B is shown for comparison in Figure 7. Interrupted-decoupling
spectra were recorded to select the non-protonated aromatic carbon signals, and the
corresponding difference spectra with only the aromatic CH signals selected can also
be obtained. A representative interrupted-decoupling spectrum is shown with its
corresponding difference spectrum in Figure 8.
A significant resolution-enhancement is observed in moving to the higher
field, and the small peaks which appear as "bumps" in the baseline at 50 MHz can
clearly be observed. These peaks correspond to the minor contribution arising from
C2' and C6' and can therefore be assigned to the non-hydrogen-bonded
conformation (2). The relative intensities of each pair will give an estimate of the
populations of the two conformers present in each polymorph. Thus we see that
polymorph A is present with a 50:50 ratio of the two conformations, while
polymorph B contains -80:20 ratio in favour of the hydrogen-bonded conformer.
Variable-temperature analysis of these samples show significant changes in the
spectral features due to the expected conformational averaging of the C2(6), C2' and
C6' pairs. Analysis of the spectra at these elevated temperatures proved rather
difficult due to the complexity of the spectra and poor signal-to-noise of the
exchanging lines. In an effort to analyse the motional processes involved it was
decided that the *'N nucleus would be used as a probe.

Chapter 3 27
200 180 160 140 120 100 80 60
5i3c / ppm
40 20
IS,
Figure 6
'C CP/MAS spectra of aJ polymorph A, hi polymorph B and c/
polymorph C. All spectra were recorded at 50 MHz, with typical
acquistion parameters of; a7 ms contact time, a 30 s pulse delay for A
and B, and 5 s for C, and between 600 and 1000 transients. Spin rates
of -4.5 kHz to 5.5 kHz were applied

Chapter 3 28
i'7b 160' i5o Uo i30 iib ho I'oo
5 /ppm
Figure 7
'^C CP/MAS spectrum ofDR278 at 75 MHz for polymorph B.
* indicates spinning sidebands.
200 180 160 140 120 100 80 60 40
5i3c/ppm
20
13.
Figure 8
CP/MAS a/interrupted-decoupling and b/difference spectra for
polymorph A. The decoupler was switched off for a duration of 40 ^ to
allow removal of the aromatic CH signals. Standard acquisition
parameters were used as in the caption for Figure 6.

Chapter 3 29
5/ ppm (Solid)
Carbon Polymorph A Polymorph B Polymorph C
1 155.7 155.3 156.0 2 130.5 130.3 131.4 6 114.9 115.0 114.9
3,5 124.2 123.0 123.8
125.7 4 147.0 145.3 146.7
r 130.0 131.7 134.4 2' 141.4 141.5 # 140.5
135.2 135.9
3' 99.0 100.8 106.7
4' 153.7 155.3 151.4
5' 107.5 107.6 109.0
6' 138.8 138.7 118.4
117.9 116.7 #
a 46.0 45.2 49.9 48.2
b 33.8 31.3 33.7
28.6 30.5 31.8
c 172.6 172.6 171.4
172.1
d 51.9 51.6 52.6 50.7 51.9
e 26.6 27.0 24.3
f 170.0 169.7 169.8
Table 2
Solid-state '^C assignment for the spectra of the polymorphs for DR278.
Shifts are given in ppm relative to TMS. The minor conformer is
indicated by the # for polymorph B.

Chapter 3 30_
3.3.2 Nitrogen-15 NMR.
The '^N nucleus is a useful probe for the analysis of azobenzenes because of
the large shielding anisotropy of the azo nitrogen sites. Wasylishen' has reported
that pure trans- azobenzene has a chemical shift span of over 1000 ppm, one of the
largest known for nitrogen. Hence, both the anisotropics and the isotropic shifts
should be sensitive to the local environment. Also, with its low magnetogyric ratio,
couplings to other nuclei will be weak in comparison to those for carbon, which will
result in a virtually isolated spin. On the down side is the fact that it has a very low
natural abundance which limits the application of natural abundance ^ N NMR to
samples which have short 1 ^ and long Tjp, allowing fast repetition of the
acquisition and long contact times to be employed. Possession of a large SA is not
beneficial in this case because the signal intensity is spread over many sidebands,
reducing the chance of observing the relevant isotropic signal. Fast MAS is thus
required to remove as many sidebands as possible, as shown for form C in Figure 9.
Observation of the azo nitrogen signals is possible only because of the very high
number of transients used and this is certainly not a typical spectrum. A poorer
signal-to-noise ratio still allows the secondary and tertiary amines to be observed for
form B, as these have very small shielding anisotropics which have been effectively
spun out at the speeds used. No azo nitrogen signals appear, however. Thus if a
proper analysis is to be carried out then isotopic enrichment with ^ N must be used.
The isotropic ^^N shifts for the solid and solution states are given in Table 3.

Chapter 3 31
Isotopic enrichment of the a and 3 positions of the azo linkage produced
three samples of polymorph A:-
a/ a singly-labelled sample
hi P singly-labelled sample
c/ a and P doubly-labelled sample
The two singly-labelled samples are essentially ^''N isolated
heteronuclear spin pairs, while the doubly-labelled sample is a - ^ isolated
homonuclear spin pair. Probing the dipolar couplings between these two nuclei
would intuitively provide information regarding the structure of the azo bond. The
spectra, showing the isotropic chemical shifts, are given in Figure 10 for these
three samples.
200 100 0 -100
5NI5 / ppm
-200 -300
Figure 9
Natural abundance Nspectra ofDR278form C at 30 MHz and a spin
rate of 5 kHz. * indicates spinning sidebands.

Chapter 3 32
SOLID SOLUTION
8 N / ppm Polymorph
Nitrogen B C DgDMSO CDCI3
Na 60.0 62.3
Np 105.4 111.3
NO2 -13.6 -11.7 -11.9 -13.2
NHCOCH3 -248.8 -254.1 -254.7 -253.9
N(CH2 ) -290 -297.3 -294.4 -294.7 (very weak)
Table 3
'^N chemical shift assignment of polymorphs B and C at natural
abundance. The iVp signal for polymorph C was taken from the labelled
sample.
Polymorph A should produce two signals of appproximately equal intensity
in the ^^N CP/MAS spectra for each of the two singly-labelled samples. This was
indeed the case, providing irrefutable evidence that two comformations exist, with
peaks being observed at 121 ppm and 89 ppm for the P label, and at 60 ppm and 44
ppm for the a label. A two-dimensional chemical shift / dipolar correlation
experiment could not distinguish between the two sites for either sample on the basis
of differing N-H dipolar coupling and the chemical shifts are too close to be able to
assign them. This is as expected for the P site due to the very similar environments
of the two sites. However, it was hoped that the hydrogen-bonded proton would be

Chapter 3 _33_
sufficiently close to allow a dipolar coupling to be realised for the hydrogen-bonded conformation in the a label sample. Additionally, the ^'*N-'^ spin pairs for the singly-labelled materials show no evidence of residual dipolar coupling at room temperature. This phenomenon will be discussed later. The spectrum of the doubly-labelled sample appears to be simply a superposition of those for the two singly-labelled samples, with no observable dipolar coupling under MAS. The fact that the chemical shifts are far enough removed from each other should allow a complete kinetics analyis to be carried out. First though it would be useful to obtain a chemical shift assignment for the four signals.
This assignment was obtained from two new pieces of information. Firstly,
the P-labelled sample was converted to form C, which is already known to exist in
the purely non-hydrogen-bonded conformation. A single peak at 105.4 ppm was
observed for this sample in the CP/MAS spectrum. Strangely, this does not
coincide with either of the two shifts in the form A spectrum, 121 ppm and 89 ppm,
as these shifts are thought to represent the values for the two posssible
conformations. The natural abundance signals could be observed in the labelled
spectrum, and gave the same shifts as for the natural abundance sample. With the
extra sensitivity and narrower lines the shifts could be extracted more accurately.
From comparison with the spectrum of the a labelled sample the resonance at 60
ppm could be assigned to the non-hydrogen-bonded conformer. This only leaves the
P sites to be assigned.

Chapter 3 34
140 120 100 80 60
5 / ppm 40 20
Figure 10
Comparison of the '^N CP/MAS spectra for the labelled samples of
polymorph A. a/a,^ double label, b/a single label, c/ P single label
andd/^ single label of polymorph C.
The second tool in this assignment is the application of rotational resonance
to the ^^N spin-pair in the doubly-labelled sample of polymorph A. Generally this
technique is used to obtain non-bonding intemuclear separations in molecules with a
view to understanding conformations in the solid state.''' Upon matching the spin
rate with the isotropic chemical shift difference (expressed in Hz) of two
homonuclear coupled spins, a splitting will be observed which is dependant upon the
direct dipolar coupling constant. The rotational resonance spectrum. Figure 11, for
the 121 ppm and 44 ppm signals provides the proof that these two lines are directly

Chapter 3 35
bonded and are present in the molecule at the same time. Similarly matching the
spin rate to the 89 ppm, 60 ppm spin-pair produced an equivalent splitting, while the
121 ppm, 60 ppm spin pair did not show any splitting at their rotational resonance
condition, proving that the nuclei contributing to the signals at 121 ppm and 60 ppm
are not coupled.
The only curiosity that remains to be answered is the apparently anomalous
shift for the P signal of form C. A non-planar orientation of the acetamido group, as
13
suggested for the C spectra, would only affect the P site in this non-hydrogen-
bonded conformation. The a site would be significantly spatially removed from the
amide nitrogen lone pair so that it is not affected.
1 r 140 120
1 r 100
—r 80 60
T r 40
-I 1
20
Si5N/ppm
Figure J J
15 N rotational resonance (n=l) spectrum for the doubly labelled sample
of polymorph A. Selecting only the hydrogen bonded spin pair.
* indicates spinning sideband

Chapter 3 36
Conclusion.
It has been shown that a complete assignment of the ' C solution and solid-
state spectra for DR278 can give information regarding the local molecular
environment of the system. The solution-state spectra are profoundly influenced by
the particular choice of solvent which gives clear evidence that the hydrogen
bonding network is being interrupted by the solvent. In the solid phase the different
polymorphs can be considered to be composed of two conformations, which can
undergo molecular reorientation, in different proportions. As to how the total free
energy of the system relates to the local structures is at the moment unclear.
The NMR spectra verify the supposition of the presence of two
conformations and with the application of rotational resonance a full assignment of
the signals for all the samples can be made.

Chapter 3 37
References.
1 H. Zollinger, Colour Chemistry; Syntheses, Properties and Applications of
Organic Dyes and Pigments, 2nd Ed, VCH, (1991).
2 W. Biedermann, J. Soc. Dyes Colour., 87, 105, (1971).
3 P. Gregory and D. Thorp, J. C. S Perkin Trans I, ppl990, (1979).
4 T. L. Threlfall, Anal., 120, 2435, (1995).
5 A. Bax, Two-Dimensional Nuclear Magnetic Resonance in Liquids, Delft
University Press, Delft, (1982).
6 X. Wu and K. W. Zilm, J. Magn. Reson., 102, 205-213, (1993).
7 R. Sangill, N. Rastrup-Andersen, H. Bildsoe, H. J. Jakobsen and N. C. Neilsen,
J. Magn. Reson., 107, 67-78, (1994).
8 P. Savarino, G. Viscardi, E. Bami, R. Carpignano, L A. Federov, Dyes and
Pigments.^, 71, (1990).
9 P. Savarino, G. Viscardi, E. Bami, R. Carpignano, L.A.Federov, V.
LDostovalova, J Struct. Chem., 33, 6, 844-852, (1992).
10 G. E. Maciel, N. M. Szeverenyi and M. Sardashti, J. Magn. Reson., 64, 365,
(1985).
11 A. M. Chippendale, A. Mathias, R. K. Harris, K. J. Packer, B.J. Say, J.C.S
Perkin Trans II, 1031, (1981).
12
S. H. Alarcon, A. C. Olivieri and P. Jonsen, Chem. Soc. Perkin Trans 2,
1783-1786, (1993).
13 R. D. Curtis, J. W. Hilbom, G. Wu, M. D. Lumsden, R. E. Wasylishen and J. A.
Pincork,y. Phys. Chem., 97, 1856, (1993).
14 M. H. Levitt, D. P. Raleigh, F. Creuzet and R. G. Griffin, J. Chem. Phys., 92,
6347, (1990).

Chaper 5 67
5. Investigation of Tautomcrism in Sulphonic Acid
Azobenzene Derivatives by C-13 and N-15 NMR.
The systematic analysis of azobenzene dyestuffs by NMR, particularly in the
solid state, has been limited to a small range of dyes. Disperse dyes constitute the
majority of the work done on substituted phenylazobenzenes, while phenylazo-
naphthols have also received significant attention, which is in part due to the
presence of rapid proton transfer in the solution state, and also in the solid state. The
resultant system is thought to yield a well defined double-well potential-energy
surface. Theoretical chemists trying to understand these proton transfers require
accurate experimental evidence to validate their ab-initio studies. The proton
transfer in phenylazonaphthols results in a tautomeric change in the structure of the
dye, with the naphthol OH proton transferring, back and forward, between the azo
group and the hydroxyl group, resulting in an equilibrium between the enol / azo and
keto / hydrazo structures as shown in Scheme 1. Jonsen and co-workers'' and
Lycka^ have utilised both '^N and ' C CP/MAS NMR in the solid state to probe the
tautomerism of these phenylazonaphthols.
Scheme 1

Chapter 4 38.
4, Kinetics Analysis of a Large-Amplitude Reorientation.
4.1 Introduction.
Large amplitude reorientations of the type suggested in the previous section
are rather uncommon in the solid state. Phenyl ring rotation is common place, but
with the acetamide group attached rotation of this ring is unlikely to proceed. Three
plausible mechanisms for the motional process exist. One suggestion is that two
independent phenyl ring rotations around the central azo linkage occur. Secondly, a
complete crankshaft motion of the aromatic rings around the Cl'-N and Cl-N bonds
of the azo linkage, while keeping the two aromatic rings approximately co-planar at
all times, could occur. This second proposal requires far less free volume to proceed
and is thought to be a more likely mechanism. The third proposal involves an in-
plane inversion of the azo linkage, similar to cis-trans isomerisation.' It should be
noted, however, that the transition-state structure is likely to be identical for the first
two mechanisms with the aromatic rings orientated perpendicular to the azo linkage.
The transition state of the trans-trans inversion is generally believed to be linear
around the azo linkage in the crystal state. The co-planarity requirement must hold
if the crystal is held together by 7i-7i intermolecular interactions (as suggested by the
crystal structure).'
I. Additional crystal structure information is given in the addendum.

Chapter 4 31
A crystal structure determination, recently obtained, was solved by
considering that there are two orientations of the azo Imkage, and also two positions
of the benzene ring with the nitro group attached. This determination showed a
significant degree of disorder within the molecule, with the two configurations
having approximately equal populations. The presence of these two conformations
is shovm below in Figure 1. Figure 1 shows that the two structures occupy virtually
the same space within the lattice. Consideration of the molecular packing would
intuitively provide more information for one to propose a mechanism for any
motional rearrangement.
i
Figure I
Single crystal X-ray derived molecular strucure for DR278 A. Thermal
ellipsoids are shown at 30 % probability for clarity.

Chapter 4 40_
X-ray crystallography cannot determine the origin of such disorder, be it static, long range or motional. It merely detects the fact that over a large collection of atoms, and over a long time, there is a distribution of electron density which is not attributable to one single well-defined molecular environment. The NMR evidence has, however, shown that at least some of that disorder is motional in nature, as discussed in the previous chapter. In this chapter a complete understanding of the kinetics process within polymorph A of DR278 will be presented.
NMR has proven to be an invaluable tool for the analysis of dynamic
processes, particularly those which involve equilibria or where simple
intramolecular motion is present. " In this branch of NMR, which is known as
dynamic NMR (DNMR), it is possible to probe molecular reorientation,
conformational change, or chemical reactions by a variety of experimental
techniques. The choice of technique depends upon the rate of the exchange process
in relation to the observable features in an NMR spectrum. By utilising the
appropriate experiment it is possible to probe processes where the first-order, or
2 8
pseudo first-order, rate constants span the range 10" Hz to 10 Hz. The upper limit
given here is for processes which produce efficient pathways for spin-lattice
relaxation^ and Tjp relaxation.^ Accordingly these motions interact with the static
field and applied RF field in the range of 10 Hz to I O ^ ' H Z . Additionally, any
coherent perturbation applied to the system, be it pulses or CW irradiation, can
interfere with the motional processes inherently present. As a result it is possible to
observe significant broadening of the solid-state NMR signal when the motion 8 9
interferes with the decoupler field, ' the cycle time in multiple pulse experiments
such as CRAMPS and also the spin rate of the rotor,'° even well above the

Chapter 4 41
Rothwell et a/." These fast motional processes include methyl rotation about the C3
axis, aliphatic chain rotation and proton tunneling involved in tautomeric equilibria.
Typically rotor spin rates and decoupler fields are in the kHz to lOO's of kHz range.
To monitor slower processes it is possible to apply magnetisation transfer sequences'
and to use the bandshape analysis technique. Both of these last two techniques shall
be considered in greater detail in the following sections.
Bandshape Analysis.
When the exchange rate between two chemically shifted signals is of the order
of the separation of the two resonances then it is possible to observe a broadening of
the signals. Initial studies of the resultant lineshapes in solution were initially carried
out by considering an uncoupled two-spin system and solving for the transverse
components of the exchange-modified Bloch equations. The final expression was
derived by Rogers and Woodbrey:'
where.
~ ( 1+T PB PA
< p 1+T PB + 1+T
T V 2A
+ QR
P^+R^ (1)
/' = d T • T ^2A ^2A
r 1 l + T
T
PA PB v = ~ ~~
v = '^A
-\-n5vr\
T T
-'ZA •'2B
M 1 ^ K^IA ^2B J + n5v(p^-p,)

Chapter 4 42_
where T j j , Vi and p; are the transverse relaxation times, frequencies and fractional populations of the ith resonance, kj are the exchange rate for the process i to j .
In the solid state, however, one must be very careful in the method of
analysis. Schmidt et al^^ discussed the exchange-broadened lineshapes in the solid
state under magic-angle-spinning by the application of Floquet theory. Essentially,
the simple theory previously mentioned cannot be applied to a system where spectral
overlap occurs due to the presence of shielding or dipolar sidebands.
The ^^N CP/MAS spectrum of the P-labelled sample of DR278 H at room
temperature shows no evidence of exchange broadening. Upon increasing the
temperature, significant broadening is observed, with the coalescence temperature at
approximately 80 °C. Due to the low melting point of this sample the maximum
temperature recorded was 90 °C. The error in the estimate of the rate constant is
significant when there is very little exchange broadening of the line, which proved to
be a problem below 40 °C. As discussed previously it is desirable to reduce the
presence of sidebands to the minimum possible. This was achieved by carrying out
the experiment at 20.33 MHz and applying rapid MAS (6 kHz), which allowed the
analysis to be carried out by simulating spectra by evaluating Equation (1), and then
fitting the experimental spectra by inspection by eye. A typical example is shown in
Figure 2, which was obtained at -60 °C. In fitting these lineshapes it was found that
the relative populations could not be easily determined, and this is as expected by the
fact that the equilibrium constant (and the exchange rates) varies as a function of
temperature. This situation is discussed in greater detail by Searle' and by Lane.
The best fits for all the temperatures recorded are shown in Figure 3. As a result of

Chapter 4 43
damage which occurred to the probe soon after these measurements were made it
was not possible to calibrate the temperature of the sample. A replacement stator
was inserted which would have an unknown effect on the temperature calibration
and it would be unwise to use these data to obtain kinetic activation parameters. The
main source of error would arise from the fact that the two stators employ different
bearing designs which require significantly different bearing pressures to maintain
the same spin rate. The thermal mixing of the room temperature spinner gases and
the variable temperature heater gas of the initial stator would therefore be
unpredictable and an accurate calibration could not be obtained.
-2 0 Frequency / kHz
2
Figure 2
Experimental lineshape for the '^N CP MAS spectrum ofDR278 II
recorded at 60°C and the corresponding best fit with an estimated
exchange rate of k=460 Hz.

Chapter 4 44
T= 90 °C
T= 80 °C
T= 70 °C
T = 6 0 X
T= 50 °C
k= 3360 Hz
k= 2240 Hz
k= 960 Hz
k= 460 Hz
k= 150 Hz
•1.5 •1.0 1
-0.5 0 0.5
Frequency / kHz 1.0 1.5
Figure 3
Results of the simulated'^N lineshapes for the exchange broadened
resonances from 50 °C to 90 °C (uncalibrated temperatures), plotted on
an absolute scale.
From Figure 3 it can be easily seen that when exchange broadening occurs
the maximum amplitude of the lines becomes reduced. This was also observed in
the ^ N solution-state spectrum recorded at ambient temperature in C D C I 3 solution.
However no further analysis of the solution-state kinetics has been carried out via
'^N NMR. With increasing the temperature it is also evident that there is an
additional intrinsic shift to lower frequency of the whole band, with the assumption
that the reference frequency is fixed at all temperatures over the range used.

Chapter 4 45_
4.2 Magnetisation Transfer Experiments.
In the slow exchange regime where no observable effect can be detected
upon the linewidth, as outlined previously, it is possible to follow the exchange
process via exchange-driven magnetisation transfer techniques. Ernst et al discussed
thoroughly the application of such techniques in both one ^ and two dimensions".
In both the one-dimensional and two-dimensional experiments, relaxation of the z-
magnetisation occurs during a mixing time due to exchange, creating modulation of
the signal intensity or cross peaks in the two experiments respectively.
Magnetisation (coherence) transfer sequences can be applied to monitor not only
exchange, but also dipolar coupling constants under rotational resonance conditions
18
in solids, and they form the basis for virtually all 2D spectral editing techniques in
both solids' and solutions. " These techniques have only been possible due to the
time-domain nature of FT NMR.
4.2.1 ID Selective Polarisation Inversion (SPI).
The pulse sequence which was used is outlined in Figure 4. It essentially
consists of a non-selective preparation component, in this case cross polarisation,
followed by a selective inversion of one signal. The inverted state can be created by
several methods which include DANTE,^' soft pulses, and shaped pulses. Quite
often these schemes are only useful for systems with highly dispersed isotropic shifts
in the solid state. In the cases of DANTE and soft pulses the transmitter is placed on
resonance with respect to the line to be inverted. However both techniques involve
long cycle times for the creation of the inverted state, during which exchange can

Chapter 4 46
occur. Also, with soft pulses the excitation bandwidth is inversely proportional to
the duration of the pulse, and as a result excitation selectivity is often compromised
to reduce the pulse duration.
15N
Selective inversion
Figure 4
Schematic representation of the pulse sequence used in the general
magnetisation-transfer sequence.
In the DR278 P-labelled system, which was previously analysed, there is a
^^N chemical shift separation of -30 ppm. At 30 MHz for '^N this relates to a
frequency of 900 Hz which would require a soft pulse of duration in excess of 2 ms
to create an inverted state with the appropriate selectivity. Additionally, the signal
intensity is damped as a result of Tj dephasing during the initial inversion step. The
method of choice used here is based upon the precession frequencies and the angle
that the magnetisation vectors subtend with the rotating axis system after a period of
free precession, because it is highly selective and less time is required for inversion.
The rate of precession in the transverse plane, within the rotating frame, is equal to
the frequency offset, Af, from the transmitter and subsequently the angle, 9, acquired
during a time ti is simply 27i Af t j . To create a rotation of 180° relative to the carrier
then ti =l/(2Af). By suitably placing the carrier at Af from one signal and 2Af from

Chapter 4 47
the other then these signals will acquire a 180° phase difference relative to each
other. The actual pulse sequence used is shown in Figure 5. This method has been
used both for solutions and solids, ' with this same pulse sequence being utilised
recently in the determination of the relative orientations of the shielding tensors
and of the hydrogen-bonding geometry for a series of pyrazole cyclic trimers and
tetramers under off-magic-angle spinning conditions.
'H
15N
Figure 5
Magnetisation transfer sequence with selective inversion obtained via a
nan- selective pulse.
Application of a 90° pulse stores the magnetisation along the z axis, at which
point relaxation occurs via the exchange-modified Bloch equations i f utilising a
classical approach. For a two site 4 5 scheme the coupled differential equations
are:
dt
dt
= [Mi -Mt)-k^Mi + k,M',
= -R,\m', - Ml)-k,Ml +k,M,

Chapter 4 48_
where and M f are the z-magnetisations of sites A and B respectively at time
t, MQ^ and M Q are the equilibrium z-magnetisation, R ^ i and Rgi are the spin-
lattice relaxation rates (1/Ti) for each site, and kf and kb are the forward and
backward rate constants, defining A=:>B as the forward process. These Bloch
equations are only valid under perfect experimental conditions and it becomes very
complex to consider this classical approach in non-ideal cases, of which pulse
imperfections form an example.
The density matrix formalism allows a more rigorous investigation to be
carried out. The density matrix for this isolated system, ^ at time t2=0 is given by:
'^-i2i:AfIj,t, jA^+i2n^^xh _|_ g-'"4nA<?A-'i y«g+''4nA/? /i 1 . (2b) X X
e"^"'e'"-«"^"V('„Aw„„r,) (2c)
This representation shows more clearly the full dynamics of the experiment.
In line (2b) the evolution of the initial Ix magnetisation, created from the CP
preparation component, for both sites is clearly traced out, with the evolution of site
B precessing twice as fast as that of site A, which, with the previously given timing
for t i , results in a phase-inverted state. The accuracy of placing the transmitter has
to be considered carefully as this will result in a loss of signal due to phase cycling
the ly signal away. However, the accuracy of the experiment would suffer more
drastic damage due to the creation of a spin system which is not phase-inverted, but

Chapter 4 ] 49_
in some other non-equilibrium state. The relaxation processes during ti must be considered and may be represented by f(tj,A© ^ g , T2), which is a complex function of the shielding tensor, the transverse dephasing time under proton decoupling and the t i evolution time. Consideration of the isotropic shifts, as in
liquids, simplifies f ( t i , Aco T2) to a simple exponential damping imparted by T2
dephasing. With systems containing a large SA component to the observable
spectrum, one must consider the effect of the sample spinning, which further
complicates the situation. Under MAS the dephasing associated with the ti period is
primarily due to the time dependence of the resonance frequency resulting from the
28
SA under such spinning. As proven by Marich & Waugh such dephasing is only
refocussed at integral multiples of the rotor period, and a rotor echo occurs, forcing
one to store the magnetisation only at the top of a rotor echo. The temporal width of
the rotor echo is inversely proportional to the static lineshape, and for large SA this
fact imposes a very strict rotor synchronisation on the evolution period. This
undetermined state of the initial magnetisation is one severe drawback of this
technique in comparison to 2D exchange spectroscopy, where this kind of relaxation
only manifests itself in spectral broadening in the second dimension.
The average Hamiltonian, X, during t^ contains the terms included in the
Bloch equations (Tj and exchange relaxation) in terms of relaxation and exchange
superoperators, and of the spin-spin coupling terms which cause rapid dephasing of
the remaining transverse magnetisation, which simplify the situation. In solution-
state experiments the transverse magnetisation is deliberately destroyed by the
application of gradients. The spin labelling is eventually lost if the mixing time is
Chapter 4 50
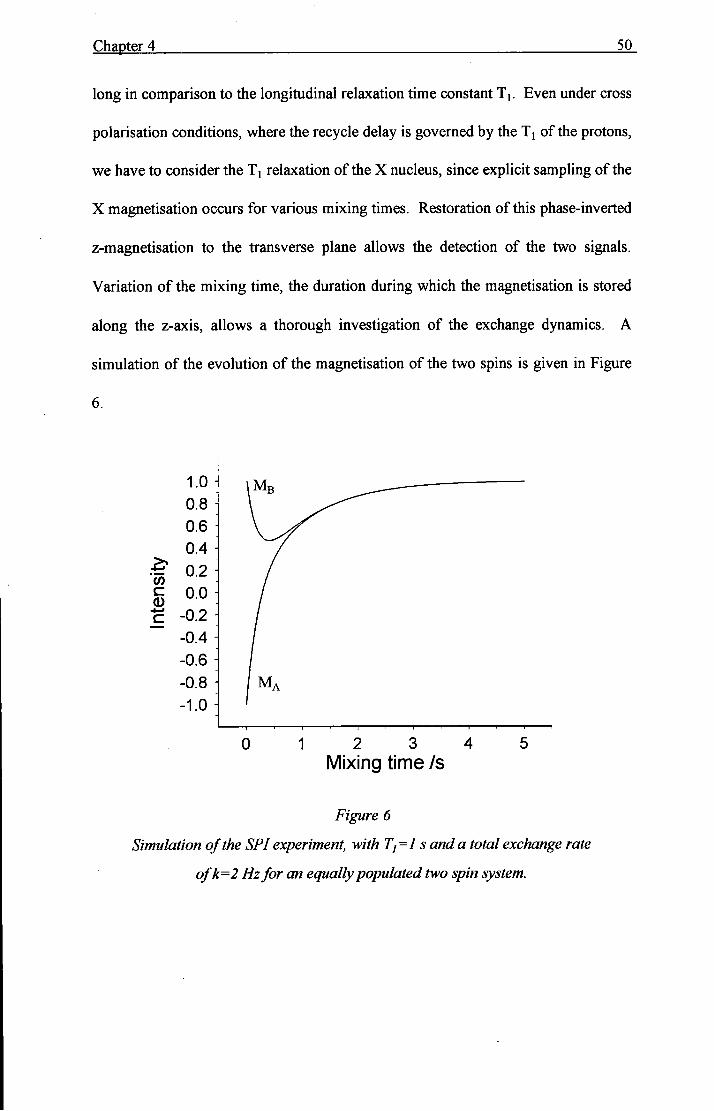
long in comparison to the longitudinal relaxation time constant Tj. Even under cross
polarisation conditions, where the recycle delay is governed by the Tj of the protons,
we have to consider the Tj relaxation of the X nucleus, since explicit sampling of the
X magnetisation occurs for various mixing times. Restoration of this phase-inverted
z-magnetisation to the transverse plane allows the detection of the two signals.
Variation of the mixing time, the duration during which the magnetisation is stored
along the z-axis, allows a thorough investigation of the exchange dynamics. A
simulation of the evolution of the magnetisation of the two spins is given in Figure
c CD
1.0 • 0.8 -0.6 -0.4 0.2 0.0
-0.2 -0.4 --0.6 --0.8 -1.0 ^
0 2 3 4 Mixing time Is
Figure 6
Simulation of the SPI experiment, with Tj=l s and a total exchange rate
ofk=2 Hz for an equally populated two spin system.

Chapter 4 5L
This ID technique requires the application of about 10 different mixing times per temperature in order to obtain a suitably good estimation of the exchange rates. Hence, a great reduction in time is observed in comparison to a fijU 2D exchange sequence, which will typically have several hundred increments in the ti dimension. This is defined by the fact that the spectral width in the second dimension has to be sufficiently large to incorporate all of the signals, including sidebands. Obviously this becomes a serious problem in the analysis of nuclei which have large shielding anisotropies, e.g. '^N, as shall be discussed later. The saving in time is rather staggering when one considers the fact that a full kinetics analysis at 10 temperatures via the 2D exchange sequence would take about 20 days, while the ID
29
analogue takes only 3 days. In analogy with 3D accordion spectroscopy one could
Fourier transform along the t , dimension, and the resultant lines would show a
linewidth dependence upon both the Tj relaxation and the exchange rate. This
would require equidistant sampling to allow a discrete Fourier transformation to be
applied, and this again would lengthen the experimental time, but with the advantage
of a significant simplification of the analysis to obtain exchange rates.

Chapter 4 52_
4.2.1.1 Results: Application to DR278 form n .
The rate of the motional process within DR278 n is expected to be less than
several hundred hertz, at room temperature, due to the fact that minimal exchange
broadening is observed in the ^^N spectrum for the P-labelled sample.
Consequently, a low temperature study would increase the temperature range over
which the motion can be probed, increasing the accuracy for estimation of any
activation parameters. The spectrum consists of two central resonances
separated by 32 ppm, which corresponds to 960 Hz at 30 MHz, and a large spinning
sideband envelope covering 1000 ppm (30 kHz). In the previous section it was
shown that the peak at 121 ppm was from the hydrogen-bonded (fi-H) conformer,
and the 89 ppm peak was from the non-hydrogen bonded (P-nH) conformer. The
complete SPI analysis was carried out from 243 K to 323 K using the Varian VXR
300 MHz spectrometer previously outlined. With such a large SA the FID is
represented by a train of rotor echoes, each of which is very narrow. The widths of
these are approximately 11 |is and imparts a tight restriction upon the timing during
the inversion component of the sequence.
Experimentally it was observed that the evolution time (ti) had to be a
multiple of 2n rotor periods, where n is integer, and that the error in the spin rate
should be less than ±50 Hz. The necessity for rotor synchronisation is shown in
Figure 7. A spin rate of 3850 Hz was subsequently chosen such that n=2 and a ti
evolution time of 515 |j,s was used. The transmitter was placed to high frequency of
the 121 ppm peak, and as a result the 121 ppm resonance had its phase inverted. A

Chapter 4 53_
typical SPI spectrum is shown in Figure 8, which shows how large the SA is with a substantial number of sidebands being observed.
The ^^N spin-lattice relaxation time was found to be -1000 ±100 s via a non
selective inversion-recovery sequence, as first outlined by Torchia. " This sequence
allows for a more rapid repetition rate, determined by the proton Tj relaxation time,
which is generally shorter than that for the nucleus. The Tj relaxation time
is long enough to allow the exchange-modified Bloch equations to be simplified by
ignoring Tj relaxation during the relatively short mixing times. The time evolution
of the individual magnetisation vectors, during the mixing time, can now be
considered to be governed by first-order reaction kinetics and as such can be fitted,
for the general case of a non-integral equilibrium constant, to a simple shifted
exponential function. In the following analysis the difference of the two
magnetisations was fitted as a function of mixing time:
Maiff =(Mi-Mi)exp[-(kf +k,) t)+(M^+Mi)
The relative sign (phase) of the magnetisation vectors is retained in these
equations and as a result the first term is the total initial magnetisation, the second is
the exponential recovery back to equilibrium, and the third is the final equilibrium
state in the absence of Tj relaxation. Figure 9 shows the relaxation curves for the
difference equations, taken at 50 °C and 22 °C, and the corresponding fitted
lineshapes. As can be seen, the relaxation process is much faster for the higher
temperature and the results from the whole temperature range are given in Table 1.

Chapter 4 54
The values were obtained by a non-linear regression of the above equation, using the
windows software package MATHCAD 31
1.1 H 1.0 0.9
•t B ^•'^ S. 0.6 I 0.5 ro 0.4
0.3 0.2 0.1 H 0.0
Lorentzian simulation Non-Inverted peak Inverted peak
I — I — I — I — I — I — I — I — I — I — I — I — I — I — I — I — i — I — I — I — I — i — r 3000 3200 3400 3600 3800 4000 4200 4400 4600 4800 5000
Spin Rate / Hz
Figure 7
Variation of signal intensity as a function of spin rate to verify rotor
synchronisation necessity. A Lorentzian curve with a FWHH of300 Hz
is shown for comparison.

Chapter 4 55
M I I I I I I I I I I I I I I I I I I I I M I I I I I I I I I I I I I I I I I I M I I I I I I I I I I I I I I I j I I I I I I I M I M I
700 500 300 100 -100 8 / ppm
-300 -500
Figure 8
Typical ^N SPI spectrum taken at8°C. The acquisition parameters
were t]=5I5 \xs, tm=500 \xs, with a pulse delay of 30 s, a contact time of
10 ms and 48 transients.

Chapter 4 56
70 -
60 •
50 - • •
w 40 • ( c -
Q) 30 •
20 -
10 •
0 -
-1 1 1 1 r -1 1 1 1-0.00 0.01 0.02 0.03 0.04 0.05 0.06 0.07 0.08 0.09 0.10
Mixing time /s
Figure 9
Experimental results for the '^N SPI experiment, shown as difference
curves, for DR2 78II at a/ 50°C and b/ 22 °C, with the corresponding
best-fit curves. Note the significantly enhanced exchange rate for the
higher temperature.
T/K 243 253 263 273 281 298 303 313 323
kA+ka/Hz 0.11 0.34 1.4 4.1 10.3 45.3 87.6 178 349
Mp-hB 0.43 0.44 0.45 0.46 0.47 0.48 0.49 0.50 0.51
0.57 0.56 0.55 0.54 0.53 0.52 0.51 0.50 0.49
Table 1
Exchange rates andfractional populations from the SPI experiment as
obtained by fitting the difference magnetisation.

Chapter 4 57
Initial studies in kinetics used the Arrhenius activation theory, which was realised to depend upon rather over-simpUfied assumptions. A model-based treatment was given by Eyring which was based on statistical mechanics, and the resultant Eyring equation was derived:-
where AG* = AH* -TAS*, K is the transmission coefficient, which will be assumed
to be unity and kg is the Boltzmaim constant. To obtain the activation parameters
one constructs the typical Eyring plot, as shown for the SPI and bandshape analysis
results in Figure 10. The Arrhenius activation parameters AG * (evaluated at 295 K),
AH * and AS * can be obtained from this graph. These values are the Gibbs free
energy, enthalpy and entropy of activation, and are measured relative to the activated
transition state. Hence, knowing the forward and backward reaction rates allows one
to determine these parameters for the forward and backward reactions, and the results
are summarised in Table 2. The fractional populations were used to obtain the
forward and backward reaction rates. The results from the bandshape analysis will be
ignored in these calculations because, as discussed already, the probe temperature had
not been calibrated. It should be noted, however, that if the temperature was reduced
by 5 °C for each point corresponding to the bandshape results then the two sets of
data become virtually indistinguishable. This suggests that the actual temperature
may be ~5 °C too high.

Chapter 4 58_
These activation parameters yield information relating to the structure of the potential energy surface, which is presumed to be a double well, and therefore to the relative stabilities of the two structures. The relative stability of the two states is defined by the Gibbs free energy difference, AG, and as shown it is virtually zero at room temperature, indicating that the two states are almost equally populated. The interconversion rate between the two states is dominated by the enthalpic contribution. For simple phenyl ring rotation it has been shown'' that the free energy of activation is -58 kJ mol'^ which is relatively close to the values obtained in this analysis. However, the barriers to rotation appear to be dominated purely by crystal packing interactions and the free volume present in the sample, which is related to the density. This azobenzene dye has a particularly low density in relation to other similar organic molecules. The packing coefficient, defined as the ratio of the Van der Waals volume of the molecule to the unit cell dimensions (assuming two molecules per cell), turns out to be -0.6 for DR278 in relation to 0.7-0.8 for typical organics. However, similar studies have shown that phenyl ring flips can proceed significantly faster in large drug molecules eg. penicillin.' 4,4'-Dimethyl-/raw5-phenylazobenzene undergoes a similar rearrangement which is on the same
32
timescale. This is rather surprising when one considers the fact that the density
would be expected to be much higher in the dimethyl-azobenzene sample, resulting
in an increase in the rotational barriers via crystal packing interactions. Interestingly
enough the crystal structure of 4,4'-Dimethyl-^rawj-phenylazobenzene shows the
same disorder as for the present strucure. Brown^^ solved the structure by assuming
two orientations of the whole molecule, not just the azo linkage.

Chapter 4 59
2 -1 -
0 -
-1 -
-2 --
-3 -
1 -4 -
-5 -
-6 -
-7 -
-8 -
-9 -
+Bandshape analysis results.
Bandshape analysis best fit.
• SPI results.
SPI best fit.
- I 1 1 1 1 1 1 1 1 1 1 1 i 1 1 r
2.6E-3 2.8E-3 3.0E-3 3.2E-3 3.4E-3 3.6E-3 3.8E-3 4.0E-3 4.2E-3
-h 1/T (K-0
Figure 10
Results of the kinetics analysis presented as an Eyring plot, for both the
bandshape analysis and SPI data, where k is the sum ofkfond k^.
Forward (H to nH) Back (nHtoH)
1 kJ mol'^ / kJ mol" / J mol" K"' / kJ mol' / kJ mol"' / J mol' K"
64.9 (±2) 63.8 (±2) -3.6(±2) 65.1 (±2) 66.5 (±2) 4.7 (±2)
Table 2
Activation parameters obtained from the SPI kinetics analysis. The
forward process is defined as that which converts the magnetisation at
121 ppm to the magnetisation at 89 ppm.

Chapter 4 60.
However, it must be remembered that this rotation was not considered to be a simple phenyl ring flip, but a crankshaft rotation of the full azo linkage. Due to the complex nature of solid state structures it would be impossible to solve the full wave equation for the solid, and carry out molecular mechanics calculations on this sample to compare experimental and calculated activation parameters. Additionally, it would be pointless to carry out such calculations in the gas phase because the primary barrier, i.e. the neighbouring molecules, has been removed from the problem.
4.2.2 Two-dimensional exchange (EXSY).
In an EXSY experiment one sequentially increments the ti evolution time in
the magnetisation transfer sequence. After Fourier transformation in two
dimensions, any non-exchanging resonances result in diagonal peaks, while those
which have undergone exchange during the mixing time are represented by off-
diagonal peaks. From the relative intensities of the peaks it is possible to obtain the
exchange rate for the process. However, the results tend to be reliable only if
several values of the mixing time are used, and with the fact that the sequence takes
a long time this becomes a very time-consuming experiment to use for a complete
kinetics analysis. As a result, only two EXSY spectra were obtained, with different
mixing times, 20 ms and 200 ms, at ambient temperature, purely for the verification
that cross peaks would arise as a result of exchange. This was indeed the case as can
be seen in Figure 11. Using a mixing time of 20 ms only small off-diagonal peaks
appear, but with a longer mixing time the off-diagonal elements increase
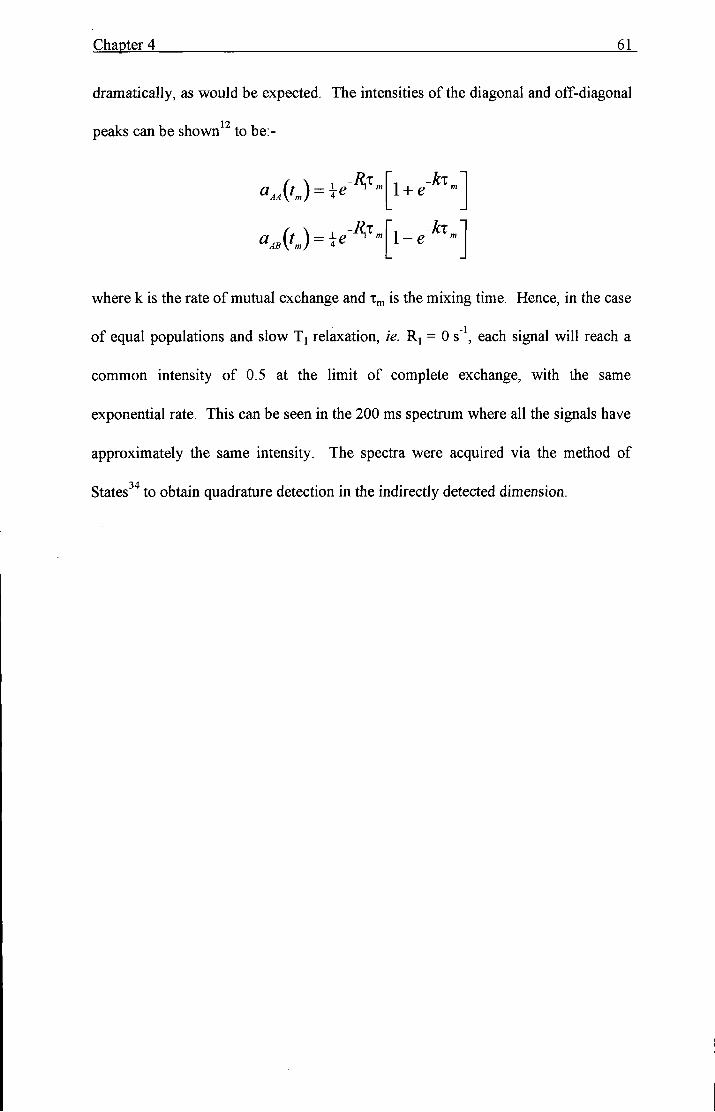
Chapter 4 61
dramatically, as would be expected. The intensities of the diagonal and off-diagonal
12 peaks can be shown to be:
\ + e
l-e -kx.
where k is the rate of mutual exchange and v is the mixing time. Hence, in the case
of equal populations and slow Tj relaxation, ie. Rj = 0 s'\ each signal will reach a
common intensity of 0.5 at the limit of complete exchange, with the same
exponential rate. This can be seen in the 200 ms spectrum where all the signals have
approximately the same intensity. The spectra were acquired via the method of
States "* to obtain quadrature detection in the indirectly detected dimension.

Chapter 4
200 ms
200
20 ms
15 y
Figure 11
2D EXSYspectrum ofDR278 II obtained on the CMX200 at
20.33 MHz. Acquisition parameters were; ct=IO ms, pd=30 s, and
mixing times of 20 ms and 200 ms. 128 points were acquired in the
second dimension and zero-filled to 512 to create a square dataset

Chapter 4 63.
Conclusions.
It has been possible by the analysis of an isotopically ' N-enriched sample of
DR278 I I , via several NMR techniques, to evaluate the energetics of the motional
process within this polymorph. The SPI sequence with inversion via the chemical
shift offset method has proven to be a simple, yet effective, technique for obtaining
accurate rate constants. The free energy of activation for the process was found to
be -65 kJ mof^ which is in accordance with other investigations of phenyl ring
flips. The mechanism for the process has not been identified, but it is still consistent
if it is thought to be a concerted rotation of the azo linkage in a crankshaft manner.
The main source of error was found to relate to the temperature calibration and not
within the calculation of the rate constant. Every effort should be made to calibrate
temperatures within probes prior to carrying out any kinetics analysis.

Chapter 4 64.
References.
1 R. Cimiraglia and H.-J. Hofmann, Chem. Phys. Lett., Ill, 430, (1994).
2 J. Sandstrom, "Dynamic NMR Spectroscopy", Academic Press, London/ New
York, (1982).
3 H.S. Gutowsky and C.H. Holm, J. Chem. Phys., 25, 1228, (1956).
4 C.L. Perrin and T.J. Dwyer, Chem. Rev., 90, 935-967, (1990).
5 A.N. Lane, Prog NMR Spec, 25, 481-505, (1993).
6 C.G. Hoelger, B. Wehrle, H. Benedict and H.H. Limbach, J. Phys. Chem., 98,
843-851, (1994).
7 F.G. Riddell, M. Bremner and J.H. Strange, Magn. Reson. in Chem., 32, 118,
(1994).
8 JR. Long, B.Q. Sun, A.Bowen and R.G. Griffin, J Am. Chem. Soc, 116, 11950-
11956, (1994).
9 J. Fattah, J.M. Twyman, S.J. Heyes, D.J. Watkin, A.J. Edwards, K. Prout and
CM. T>ohson,JAm. Chem. Soc, 115, 5636-5650, (1993).
10 D. Suwelack, W.P. Rothwell and J.S. Waugh, J. Chem. Phys., 73, 2559-2569,
(1980).
11 W.P. Rothwell and J.S. Waugh, J. Chem. Phys., 73, 2721, (1981).
12 J. Jeener, B.H. Meier, P. Bachmann and R.R. Ernst, J. Chem. Phys., 71, 4546-
4553, (1979).
13 M.T. Rogers and J.C. Woodbrey, J. Phys. Chem., 66, 540, (1962).
14 A. Schmidt and S. Vega, J. Chem. Phys., 87, 6895, (1987).
15 M.S. Searle, Prog NMR Spec, 25, 403-480, (1993).

Chapter 4 65.
16 R.R. Ernst, G. Bodenhausen and A. Wokaun, "Principles of Nuclear Magnetic
Resonance in One and Two Dimensions", 2nd Ed, Ch. 4.6, Clarendon Press,
Oxford, (1991).
17 R.R. Ernst, G. Bodenhausen and A. Wokaun, "Principles of Nuclear Magnetic
Resonance in One and Two Dimensions", 2nd Ed, Ch. 9, Clarendon Press,
Oxford, (1991).
18 D P Raleigh, M.H. Levitt and R.G Griffin, Chem. Phys Lett., 146, 71, (1988).
19 P. Caravatti, G. Bodenhausen, R.R. Ernst, Chem. Phys Lett., 89, 363-367,
(1982) .
20 R.R. Ernst, G. Bodenhausen and A. Wokaun, "Principles of Nuclear Magnetic
Resonance in One and Two Dimensions", 2nd Ed, Ch. 8, Clarendon Press,
Oxford, (1991).
21 GA. Morris and R. Freeman, J. Magn. Reson., 29, 433, (1978).
22 G. Robinson, P.W. Kuchel, B.E: Chapman, D.M. Doddrell and M.G Irving, J.
Magn. Reson., 63, 314-319, (1985).
23 N.M. Szeverenyi, A. Bax, G.E. Maciel, , J. Am. Chem. Soc, 105, 2579-2582,
(1983) .
24 G. Almond, PhD Thesis, University of Durham, (1995).
25 C. Connor, A Naito, K. Takegoshi and C.A. McDowell, Chem. Phys Lett., 113,
123, (1985).
26 L.D. Field, N. Bampos and B.A. Messerle, Magn. Reson. Chem., 29, 36-39,
(1991).
27 C.G. Hoelger, F. Aguilar-Parrilla, J. Elguero, O. Weintraub, S. Vega and H.H.
Limbach, J. Phys Chem., 120, 46-55, (1996).
28 M.M. Marich & J.S. Waugh, J. Chem. Phys, 70, 3300-3316, (1979).

Chapter 4 66_
29 R.R. Ernst, G. Bodenhausen and A. Wokaun, "Principles of Nuclear Magnetic
Resonance in One and Two Dimensions", 2nd Ed, Ch. 9.6, Clarendon Press,
Oxford, (1991).
30 D.A. Torchia, J. Magn. Reson., 30, 613, (1986).
31 MATHCAD Plus 6, Mathsoft Inc, (1995).
32 G. McGeorge, A.M. Chippendale and R.K. Harris, unpublished work.
33 C. J. Brown, Acta Cryst., 21, 153, (1966).
34 D.J. States, R.A. Haberkom and D.J. Ruben, J. Magn. Reson., 38, 286, (1982).

Chaper 5 68_
For industrial applications the dye chemist would prefer to choose molecules which are present as the hydrazone tautomer. These dyes tend to be more cost effective than azobenzene dyes, due to their higher extinction coefficients. Extensive research has been carried out using solution-state techniques to understand this tautomerism. UV-Vis, Raman, and ' H , ^^C and NMR have all proven useful. Conversion from the azo tautomer to the hydrazone tautomer results in a large bathochromic shift,'*' ^ which can exceed 100 nm for certain systems. Raman spectroscopy has proven popular due to the high symmetry of the azo linkage, which renders the resonance weak in IR studies, but very strong in Raman spectroscopy. A further extension of Raman spectroscopy is to carry out resonance Raman studies, where only the characteristic vibrations for the chromophore are selectively excited by application of a coherent stimulus to a particular electronic transition. The enhanced bands correspond to the N=N stretch, C-N stretch and in-plane deformation vibrations, for the case of trans-azohenzene.
Substituted phenylazobenzenes predominately exist in solution as the azo
form. Upon protonation, which occurs in acidic media, it is possible for zwitterions
to be created. Here, one must consider the possible resonance structures, and the
resultant mesomeric effect upon the shielding parameters. In this chapter an initial
survey of the present state of the NMR analysis of azobenzene dyes will be
presented. Once this foundation has been built, a thorough investigation of the
solution-state and solid-state structures for a series of phenylazobenzene sulphonic
acid dyes will be described, primarily via ^ C and ^^N NMR techniques, but also
with corroborating information from Raman spectroscopy and UV-Vis spectroscopy.

Chaper 5 69.
5.1 Application of C-13 and N-15 NMR for the analysis of carbocyclic azo dyes: A review.
5.1.1 NMR.
Azobenzene dyes contain two aromatic groups attached to each end of the
azo linkage. When both groups are aromatic then the resultant dye is classed as a
carbocyclic dye. The presence of electron donating and accepting groups creates
extensive modification of the 7i-electron density across both rings, and with the
inherent conjugation present in such systems prediction of shielding constants
becomes rather complicated. The solution state creates a much simpler environment
in which one can generally assign shifts by considering the average structure created
by rapid molecular and group rotations. Ewing^ built up the first comprehensive
collection of ^ C substituent chemical shift (SCS) parameters for mono-substituted
benzenes. With these data and the fact that substituent effects in benzenes are
approximately additive, unless substituents are ortho to each other, it becomes
possible to calculate the shifts for poly-substituted benzenes according to:
5c = 128.5+ ZiAi(R)
where Aj (R) represents the chemical shift increment for a substituent R in the /th
position, as tabulated by Ewing^ for example. This includes the parent azobenzene
molecule, as shown in Figure 1, which will be used throughout this chapter.

Chaper 5 70_
Oc rric
ot mt
Figure 1
The SCS parameters for the ipso, ortho, meta and para positions in
azobenzene are Ai =24.0 ppm, Ao~5.8 ppm. Am - 0.3 ppm and Ap = 2.2 ppm
respectively. In solution the o and Ot (likewise m . and m j resonances are equivalent
7 8
due to rapid phenyl ring rotation. Lycka and Chippendale et al. have analysed
several 4,4'-disubstituted fr-awj-azobenzenes in which these simple rules held true.
However, addition of groups ortho to the azo linkage result in changes which were
attributed to the presence of locked conformations, with the substituent being found
purely in the Ot position, rendering these traditional additivity rules virtually useless.
Additionally, i f this ortho-group can participate in the formation of an intra
molecular hydrogen bond, then a conformational equilibrium can be set up whereby
the electronic and hydrogen-bonding interactions compete to produce the more
stable conformation. This has already been discussed in the previous chapter for the
case of an or//»o-acetamido group. For large inert or///o-substituents the benzene
rings may twist out of the plane of the azo group to minimise steric hindrance, and
also changes in bond angles may significantly contribute to rather complicated
geometries and NMR spectra. Thus, the maximum chemical shift deviation between
the Oc and Ot pair will be reduced depending upon the exact orientation of the
aromatic ring. This further complication is particularly pronounced in the solid state

Chaper 5 7 L
where the aforementioned rapid molecular rotations are not present to average shifts. Fedorov et al.^ have recently published ' C data relating to some 40 azo disperse dyes in an attempt to understand the combination of hydrogen-bonding, electronic effects and steric effects on solution-state shifts.
In the case of or///o-hydroxy groups the structure is almost always found to
be hydrogen bonded. Depending upon the neighbouring substituents, the proton can
actually transfer over to the nitrogen atom, and form a hydrazone dye or an
equilibrium between the two tautomers. This is generally not observed in
carbocyclic phenylazobenzene dyes, but it has been characterised by Fedorov'"'
under conditions of extreme basicity. Fedorov's analysis is rather important in
relation to the current research. It was observed for resorcinol (2',4'-dihydroxy
phenyl group) azobenzene derivatives that the ' C NMR shifts in the solid state were
identical to those in strongly alkaline aqueous solutions, and that these structures
were deduced to be hydrazone in nature in the solution state. However, a discussion
of the solid-state structure was totally avoided in those reports, and it definitely does
not contain a formal negative charge as in solution, unless it is some way stabilised
by intermolecular interactions. The preferred state of azonaphthol dyes is that of the
hydrazone tautomer, but the exact equilibrium constant is highly dependant upon
both temperature and pKa of the solvent. Heterocyclic azobenzene dyes also
constitute an important class, because it is possible to force the hydrazone tautomer
by the substitution in the heterocycle (the heterocycle is typically a pyridone). Thus,
from Lycka's work^^ it has been possible to identify the shifts one would expect
from a phenyl ring attached to 1/ an azo group, II an azo group intra-molecularly
hydrogen-bonded to an orr/io-substituent, 3/ a hydrazone group and 4/ a hydrazone

Chaper 5 72
group intra-molecularly hydrogen-bonded to an o/-//70-substituent. The SCS
parameters arising from these systems are summarised in Table 1.
One important additional piece of information that remains to be clarified is
the effect that the strongly acidic sulphonic acid group has upon both the observed
^ C NMR shifts, and also on the expected structure in various solvents. Benzene
sulphonic acid has a pKa of —2 in aqueous solution, being nearly as acidic as
sulphuric acid, and will deprotonate in all aprotic solvents. This can prove to be a
problem due to the insolubility of the azobenzene sulphonic acids in acidic aqueous
media, which is the type of solvent that one would wish to record a spectrum in, in
order to obtain the NMR shifts relating to the neutral molecule.
Carbon
signal
1/ 3 2
21
•N,
3/
N
4/
C CK; CI
C2
C3
C4
23.8
-6.2
1.0
2.0
22.0
-6.4
0.7
2.0
13.5
-14.2
0.8
-3.9
12.4
-12.9
1.0
-2.9
13
Table 1
C SCS values for the phenyl resonances in azo and hydrazone systems
in ppm relative to trans-azobenzene.

Chaper 5 73.
5.1.2 N-15 NMR.
Nitrogen-15 NMR has proven to be very useful in the determination of the
structures found for these dyes. The primary reason for this is the huge shielding
range that nuclei cover, and also the nature of the tautomerism that we wish to
analyse here. Azo signals are generally found between 50ppm and 150 ppm,
whereas those for hydrazos cover a much larger range, -200 ppm to 70 ppm. The
latter is a feature of the protonation of the a nitrogen position in converting from the
azo to hydrazo tautomer. For NMR a low-frequency shift of between 200 and
300 ppm is realised for this a ^ 'N resonance. Both Jonsen' and Lycka''* have
successfully used the difference between the a and P resonances to pin-point the
percentage of hydrazo or azo form present in a system. To be able to have
confidence in this information one must understand the SCS arising at the two
nitrogen sites as a result of substitution of the aromatic rings, and also the effect of
intra-molecular hydrogen bonding in oA-r/;o-substituted azobenzenes. Some pertinent
SCS parameters are shown in Table 2 for the N„ and Np signals of four 4-substituted
/raw5-azobenzenes,^^ with the substituent being attached to the ring adjacent to N„.
A general trend was observed such that the resonance of the nitrogen atom closer to
the para-substituent was always shifted to lower frequency, regardless of substituent,
while that for the second nitrogen atom was shifted to lower frequency with
electron-donating substituents, and to higher frequency for electron-accepting
substituents. From the entry for NH2 it is clear that there is a strong solvent
dependency upon the SCS for the Np signal.

Chaper 5 74
Substituent scs„ SCSp
''N(CH3)2 -10 -31
^NH2 -10 -37
'NH2 -9 -26
''OH -6 -20
''NO2 -7 +17
V5,
Table 2
SCS values for 4-substituted trans-azobenzenes relative to that for
trans-azobenzene (130 ppm). The spectra were recorded in DMSO-d^
and^inCDClj.
Kuroda et al^^ provided direct evidence of the site of protonation in acidic
media of 4-aminophenylazobenzne by ^ 'N NMR. In weakly acidic media the acidic
proton was located at both the azo nitrogen P to the amino group and also at the
amino group. The shifts (and supporting UV/ Vis data) suggested that the
equilibrium favoured the protonation of the amino group. In strong acid where two
protons have transferred to the dye it was shown that one of the protons was located
on the amino group and the other at the nitrogen a to the amino group, either as an
azonium cation or as the hydrazo form. Knowledge of these resonances may
assist in understanding two of the sulphonate systems under investigation in the
present chapter.

Chaper 5 75.
5.2 Analysis of NMR spectra for a series of water soluble dyes.
5.2.1 NMR.
A complementary range of mono-sulphonic acid phenylazobenzene dyes, and
their sodium salt analogues, have been analysed in an attempt to correlate the
solution-state and solid-state NMR shielding constants. These dyes are generally
present as the mono-anionic salts, making them highly soluble in aqueous solutions.
This is beneficial in the dyeing procedure, but is a major disadvantage when it
comes to washing the garment. Leaching of the dye colour occurs from the inferior
wash fastness. As the free acids they are not actually used as dyes, being highly
insoluble at all pH's in water, but the structures for the free acids may help in the
understanding of the structures of more complex reactive dyes, as will be
investigated later. The NMR shielding parameters relate to the molecular
conformations, of which the solid-state structures are unknown. In solution it is
generally perceived that they all exist in the azo form. As a result, the solution shifts
wil l be assumed to be those that relate to the sulphonic acid anion of the
corresponding dye (when recorded in DMSO-dg). The assignments were made by
comparison to data for similar molecules and the known substituent shifts previously
discussed. The numbering system adopted is shown in Figure 2.

Chaper 5 76_
3 2 4 , f ~ V XT. \ 2 ' 3' RO3S—<^ ^>^N
5 6 ^ N ^ < ^ J > - X
6' 5'
R=H, Na
Figure 2
The substituents R, X and Y are tabulated in Table 3 for the compounds
recorded in solution, along with the corresponding '^C chemical shift assignments.
These spectra were all recorded in DMSO-dg, so solvent effects across the range can
be considered to be comparable for all samples, and therefore ignored. The data for
the parent sulphonic acid azobenzene anion has been built up from the literature and
is reported as sample A.
The ^ C shifts in the sulphonate-substituted ring are all very similar when
comparing across the range, and are as one would expect. It should be noted that the
SCS parameters of = 16.7 ppm, A,, = 3.3 ppm, A^ = 0.3 ppm and Ap = 5.9 ppm,
relative to benzene, for the sodium sulphonate group^^ have not been used in any of
18
the current analyses, because Kosugi found a very poor correlation using these
SCS parameters for di-substituted benzenes. It was suggested that the electronic
nature of the sulphonate group varies according to the nature of the substituent. No
other literature, to my knowledge, has been published on the SCS effects for poly-
substituted benzenes with sulphonate groups attached. Thus the assignments given

Chaper 5 77_
in the literature for azobenzene sulphonates have been obtained purely by consideration of a large number of analogous compounds.
The assignment for I is within 1 ppm for all shifts in comparison to those for
A. A low frequency shift of ~2 ppm appears for the CI resonance of the di-hydroxy
sample, when compared to the other molecules. This, by comparison with Table 1,
is suggestive of the formation of an intra-molecular hydrogen bond. The other ring
is, however, far more susceptible to the influences of hydrogen bonding, and
changes can easily be observed at C2',C4' and C6' (depending on the sample). C6'
allows one to determine the conformation of the oz-fZ/o-substituent, i.e. cis or tram
with respect to the azo linkage, which is important for V and V I and DC. V I and IX
exhibit low-frequency shifts of 12.4 ppm in comparison to V, which are too large to
be accounted for by the difference between the /weto-SCS values for methyl, amino
and hydroxy groups. These meta-SCS values are -Oppm, 0.5 ppm and 1.2 ppm
respectively, and the corrected shifts for C6', due to the electronic interaction
between the azo nitrogen lone-pairs with the C6' nucleus, are 117.3 ppm, 117.3 ppm
and 128.5 ppm, for V, IX and V I respectively. Thus, an 11 ppm splitting is
observed in these or^/zo-substituted samples, wholly in accordance with other
previous reports in the literature, for both solids and liquids. These shifts
therefore prove that ortho-CH^ groups are present in the /raw5-orientation, while
or//70-hydroxy groups are present in the c/5-orientation, due to a stabilisation of the
molecular system by the formation of an intra-molecular hydrogen bond.

Cbaper 5 J3.
'I
ho
CM
O
X
Pi
o
0 0
0 0
oo' CN
o
0 0
od
0 0
m O N
0 0
0 0
in
[25.
0
[25.
6
17.3
*
[29.
7
[24.
8
17.8
*
o <n C N CN »—) O n O
lO 1—1
CO cn O n cn VO
ON [1
6.0
[16.
5
17.1
*
[02.
9
[11.
7
17.2
*
p cn «n 0 0 ON
«n < N
vd < N
o
vd ( N
C<1 c<-) CN
cn
CN
CN
CN
OO vd CN
CN
CN CN
o 0 0 o O N O n O N 0 0 CJn 0 0
vd CN
ffi ffi ffi u o
ffi HI ffi ffi ffi o o o o
ffi ffi ffi
I — I l - H H H l - H H H
CN
o 1 - H p O N 1 - H CN 1 - H O CN CN CN CN CN CN
•p l> < N CN CN CN O CN
m in m
1
i
1
"a 3
I 3
1 5
•a, §
f
I O
I
5
t
I I K
1 I I I
I I O
I
I
5>
I K
I
I i I
5
t
I I
c o
1
1
i I I I I-"3 3
I . 0 3

Chaper 5 79_
In the solid state the situation becomes rather more complex with the additional possibility of inter-molecular hydrogen bonding, resuhing in the formation of dimers, or polymeric-like chains. In l-phenylazo-2-naphthol, it is thought that the intra-molecular proton transfer occurs via formation of an inter-molecular hydrogen bond. Monahan et al. ' have suggested that arylazonaphthols readily form dimers and higher aggregates in solution, giving complementary evidence that the proton transfer is facilitated via inter-molecular interactions, in direct contrast to the description given by Jonsen' and Lycka and Machacek,'' who have suggested that formation of an intra-molecular 6-membered ring is preferred. It is probable that both mechanisms exist, and dominance of one over the other may be directly related to the crystal structure, and also to the substituents on the rings. Kuder '* established approximate stabilities of the azo and hydrazo tautomers for a series of hydroxyarylazo compounds by the application of the Hiickel molecular orbital method. Terms were included to allow for the possible formation of intra-and / or inter-molecular hydrogen bonding. These calculations reproduce the experimental trends observed via NMR^'^', UV/ Vis^^'^' and IR^^ techniques. Additionally, it was observed that dimer formation produced a three times greater stabilisation for a hydrazo-hydrazo dimer compared to an azo-azo dimer. Applying similar considerations to the sulphonic acid phenylazobenzenes would result in an understanding of their structures.
The crystal structure for the acid-base indicator methyl orange (Sample V I
above) is one of only two reported in the literature for this class of dyes. ^ It was
present as the monohydrate monoethanolate form, and the co-ordination of the
sodium atom is distorted octahedral. The octahedron is made up of two water

Chaper 5
molecules, three sulphonate oxygen atoms (each from a different molecule) and the
oxygen atom of the ethanol molecule. These octahedra hydrogen-bond together to
form chains, creating a two-dimensional plane as shown in Figure 3. The present
samples do not contain solvent co-crystals, and similar structures are therefore
unlikely to be present for the salts in the present investigation.
Figure 3
Crystal structure for methyl orange monoethanol monohydrate sodium
salt, viewed along b, showing the planar arrangement of the co
ordination octahedra. (Taken from ref 29.)

Chaper 5 8L
The second crystal structure, which was recently reported by Ehlinger et a/., " is again rather important in relation to the current investigation, with two crystal forms of 4-(4-hydroxy-3,5-dimethylphenylazo)-benzenesulphonic acid being presented. Both systems are monoclinic (P2i/ c) with one water molecule being associated with each dye molecule. The important point is the fact that there is extensive hydrogen bonding between the SO3H group and the azo group. The proton from the SO3H group donates to the nearest azo nitrogen resulting in an
azonium (N=NH^) group. The OH hydroxy group interacts with two SO3 groups by
utilising the HjO as a bridging molecule. This dye is the first of its kind isolated in
the solid state (with supporting crystal data) and NMR studies do not appear to have
been carried out so far on this system. This structure may, however, represent what
is possible in some of the free sulphonic acid systems under investigation here,
where strong intermolecular contacts are expected.
The assignments of the ^ C solid-state NMR spectra were made by
comparison with the solution assignments for the azo structures, and also by
comparison with previous literature assignments for analogous compounds in the
solid state. Rather than tabulating the assignments in a fashion similar to the
solution-state results, each molecule will be treated individually, with a
corresponding discussion of the structure. Dipolar-dephasing spectra were recorded
to distinguish between the protonated and non-protonated carbons.

Chaper 5 82
I . 4-phenylazobenzene sulphonic acid
127.4 131.8
141.5 r.—X 15 .3
H03S-
127.4 114.4
114.4 128.6
N /
151.7
131.8 128.6
429
170 160 150 140 130 120 110 5/ ppm
Figure 4
'^CCP /MAS spectrum of I obtained at 75 MHz, with 2500 transients, a
2 s recycle delay, a 2 ms contact time, and a spin rate of8300 Hz.
Under normal operating conditions one sets the Hartmann-Hahn matching
using slow-spinning adamantane where the profile is broad. At faster spin rates the
profile breaks up into a series of sidebands, which are more pronounced for
quaternary carbons. Consequently, the three high-frequency peaks are less intense
than one would expect. It was expected that this parent sulphonic acid would be the
simplest to assign, but this proved a rather optimistic assumption, because when
compared to the solution shifts one resonance moves from -150 ppm to 141.5 ppm.
This has been tentatively assigned to the ipso-carhon C4, with this position being

Chaper 5 83
highly sensitive to the inter-molecular interactions. Al l the other shifts are indicative
of the presence of the azo form.
Ha. and l ib Sodium 4-r4'-hydroxyphenylazo] benzene sulphonate dihydrate.
NaOgS a \ ) —
170 160 150 140 130 120 110 5/ppm
Figure 5
C CP /MAS spectra of a/Ila obtained at 75 MHz, with 104 transients,
a60 s recycle delay, a 1 ms contact time, and a spin rate of4500 Hz and
b/Ub obtained at 50 MHz; with 476 transients, a 10 ms contact time, a
5 s recycle delay, and a spin rate of 5 kHz.

Chaper 5 84_
Two separate samples of this compound were analysed, one being a reference sample supplied by Zeneca (Ha), and the other (lib) being enriched with at the P- azo nitrogen. The two samples produced different ^ C CP/MAS spectra, with their respective assignments given in Table 4. The small peaks in Figure 5a, labelled by asterisks, actually correlate to the large peaks in Figure 5b, which is highly suggestive that two crystal forms (polymorphs or hydrates) exist in Ha. lib is actually present as the dihydrate as determined from elemental analysis. Interestingly, heating Ila to 80 °C causes a change in the spectrum, and it then appears very similar to the rooom temperature spectrum of lib, which could possibly be attributed to a different mode of binding of the water hydrate molecules. Care should be taken in trying to interpret the spectra in terms of signal intensities, because the signals for these samples all have very different cross-polarisation dynamics, and this feature should be more fully investigated for a proper understanding of this system. The assignments given are tentative, and several could be interchangable. However, they do show the existence of the azo tautomer by consideration of the C-OH signal at -159 ppm.

Chaper 5 85
Ring A 1 2 3 4 5 6
Ila 154.7 130.7 127.4 145.7 126.1 112.7
152.8 147.3
l ib 152.5 129.6 126.5 146.7 126.5 116.0*
RingB r 2' 3' 4' 5 6'
Ila 144.0 119.6 116.4 158.5 116.4 134.9
141.8
l ib 142.0 116.0* 116.0* 158.4 116.0* 133.9
13
Table 4
C assignment for the solid samples of Ila and lib. * indicates that 1
broad resonance was observed, and all the relevant signals were
assigned to the centre of that peak.

Chaper 5 86
I I I . 4-[4'-hydroxyphenylazo] benzene sulphonic acid. (~N ^-labelled)
123.8 129.6
1 4 6 . 4 ^ ^ 1 4 1 . 4 / 118.9 121.1
123.8 120.1 139.7 \ — , -0
126.3 121.1
180 170 160 150 140 130 120
5 / ppm
110 100
13
Figure 6
C CP /MAS spectrum of HI obtained at 50 MHz, with 200 transients,
a2 s recycle delay, a7 ms contact time, and a spin rate of 5 kHz.
Unlike its respective sodium salt, the spectrum of this compound strongly
suggests it exists as the hydrazo tautomer, with one set of sharp lines, indicating that
one distinct crystal form is present. Low-frequency shifts of the CI , C4 and C I ' are
all indicative of this form, in addition to the C4' high-frequency shift resulting from
the quinoid structure (as drawn).
Further evidence of the structural changes between I I and E I has been
supplied from the techniques of solid-state Raman spectroscopy and solid-state

Chaper 5 87
visible spectroscopy. As mentioned previously a large bathochromic shift, in the
visible spectrum, is generally observed in going from the azo to the hydrazo
tautomer. Compound Ha produced a peak at 350 nm, which is atributed to the
presence of the azo form, and a weak shoulder at -480 nm which may be from a
small fraction of the hydrazo form not observed in the NMR analysis. Also, HI
produced the same two bands with approximately equal intensity, suggesting that the
a larger contribution comes from the hydrazo form in comparison to Ha. Figure 7
shows the comparison between Ila and in.
Absorbance
0.8
0.7
0.6 ^
0.5
0.4 ^
0.3
0.2 -
0.1 -
0.0 200 300 400 500 600
Wavelength / nm 700 800
Figure 7
UV / Vis spectra of a/ Ha and b/ III recorded in the solid state. Spectral
features below 300 nm should be ignored

Chaper 5 88_
The Raman spectra are simpler to understand than the UV/ Vis spectra. Saito et al.^^ observed a decrease in frequency of the Raman band due to the N=N stretching vibration in p-hydroxyazobenzene-sulphonic acid upon dissolution in strongly basic solution, and attributed it to a reduction of the order of the N-N bond. Thus, deprotonation of the phenolic OH group, forming the dianion (the sulphonic group is already deprotonated) results in a resonance structure between the azo and
32
the quinoid structures. A comparative study by Chattopadhyay et al. showed the
same effects, with similar conclusions. Using the assignments given by Saito, " 32 33
Chattopadhyay and Gregory it was possible to assign some of the important
bands in the Raman spectra for Ila and EI. The Raman spectra are shown in Figure
8, with the corresponding assignments given in Table 5. The low-frequency shift of
71 cm" and the reduction in intensity of the triplet at 1100 to 1200 cm"' indicates the
increased proportion of the hydrazo form for I I I as compared to Ila.
Sample Ila m Ring stretches 1590+1610 1595+1625
N=N 1440
N-N 1205
Ph-N= 1187
C=N 1370
C-N (hydrazo) 1171
C-N(azo) 1148+1123
Table 5
Observed wavemumhers (cm') and corresponding assignments for the
Raman spectra for the solid samples of Ila and III.

Chaper 5 89
• 1 • 1 ' 1 • 1 • 1 • i • 1 •
1700 1600 1500 1400 1300 1200 1100 1000
cm
Figure 8
Solid-state Raman spectra for a/Ila and b/ III.

Chaper 5 90
IV. Sodium 4-[2'-methyl. 4'-hydroxyphenylazol benzene sulphonate.
r%r B-labelled)
NaOjS
125.6 128.9
125.6 -114
117.2 115.2
T , , / / 159.6
143.6 117.2
19.3
143.6
— I 1 1 1 1 1 1
130 120 1 10 100 180 170 160 150 140
5 / ppm
13
Figure 9
C CP /MAS spectrum of IV obtained at 50 MHz, with 108 transients, a
5 s recycle delay, a 4 ms contact time, and a spin rate of 5 kHz.
Steric hindrance from the or//?o-methyl group forces the fran5-orientation to
be observed. There is no observed structural change in going from solution to the
solid. However, all of the hydrogen-carrying carbon resonances are broad,
indicating that some motional process may be present, resulting from intermediate
averaging of two comformations of the benzene rings. The spectral broadening may

Chaper 5 91
possibly arise from incomplete decoupling via interference of the decoupler and
molecular motion.
V. 4-[2'-methyl 4'-hydroxyphenylazo] benzene sulphonic acid. (3-labelled)
128.9 125.6 H
145.6/ \ 143.3 / 120.5 124.0
127.6 117.0
1 5 8 . 8 / ^ 1 7 3 . 3 • N = ( > = 0
120.5
C H 3 18.3
180 160 140 120 100 30 15
6 / p p m
J3
Figure 10
C CP /MAS spectrum of V obtained at 50 MHz, with 640 transients, a
5 s recycle delay, a 8 ms contact time, and a spin rate of 5 kHz.

Chaper 5 92
As with ni, the hydrazo form is observed, with the methyl group being
present in the fra«5-orientation. Surprisingly though, one quaternary resonance
moves quite significantly from the expected value. This has been assigned to a high-
frequency shift of the C=N, C I ' , resonance, as it is known that C=N shifts can vary
quite significantly. The solid-state Raman spectrum shows similar features to that of
I I I , indicating that the two structures are similar, the C=N stretch being found at
1382 cm\ compared to 1369 cm" for HI.
V I . Sodium 4-[2'.4'-dihydroxyphenylazo] benzene sulphonate. ( % f P-labelled)
NaOgS
126.5 -129
126.5 116.2
130 109.4
180 160 140 120
5 i 3 c / ppm
100 80
Figure 11
C CP /MAS spectrum of VI obtained at 50 MHz, with 108 transients, a
5 s recycle delay, a 4 ms contact time, and a spin rate of 5 kHz.

Chaper 5 93
The poor resolution of this spectrum makes a positive assignment very
difficult, but it is again clear, as for the other salts, that it is present in the azo form
(judged by the shift of the phenolic carbons). Intra-molecular hydrogen bonding is
suggested from the shift of C2', which would be ~8 ppm higher i f rapid rotation of
the phenyl ring was present.
V I I . 4-[4'-dihydroxyphenylazo] benzene sulphonic acid. (3-labelled)
H O 3 S
123.0 126.6 H
144.2/ N\142.7 / 167.6 \ 106.0
123.0 116.1
128.5 119.8
180 170 160 150 140 130
5 / ppm
120 110 100
Figure 12
C CP /MAS spectrum of VII obtained at 50 MHz, with 200 transients,
a5 s recycle delay, a7 ms contact time, and a spin rate of 5 kHz.

Chaper 5 94_
The spectrum obtained for this sample. Figure 12, was one of the best for this range of dyes. Significantly narrowed lines were observed in comparison to the salt, simplifying the assignment. Strangely though, it appeared that one carbon signal was not realised. The dipolar dephasing spectrum, with a standard 40 |is dephasing window, did not resolve the problem. To try to locate the lost CH resonance a variable dipolar dephasing experiment was carried out, with the results displayed as a stacked plot in Figure 13. It should be remembered that intensities are not reliable via CP, but within a single experiment it is possible to correlate changes in intensity. The variable dipolar dephasing experiment showed that several resonances decayed rather rapidly, as one would expect, followed by a slight increase in signal intensity when the dephasing time was equal to the rotor period. However, the resonance at 128.5 ppm decayed initially, but stayed fixed at -60% of its original intensity. This is proof that the 128.5 ppm line is composed of two signals, one an aromatic CH, and the other a quaternary signal, which were assigned to the C6' and C I ' carbon atoms respectively. The final assignment all of the resorcinol ring carbons has been made by considering a 50:50 equilibrium of the azo and hydrazo forms, with the hydrazo shifts being taken from Fedorov's analysis of similar resorcinol derivatives.''' The lack of reference samples for azobenzene resorcinol derivatives prevents an accurate estimation of the actual equilibrium constant. As shown from the two crystal structures discussed earlier it is clear that several possible combinations of intermolecular contacts are possible, each of which have profound effects on the '^C NMR spectral features. Hence, other possible structures, not so far proposed may explain the NMR spectra better.

Chaper 5 95
0 |is
1 — I — I — I — I — I — I — 1 — I — I — I — i — I 1 ] I I I 150 145 140 135 130 125 120 115 110 105 100
ppm
Figure 13
Stacked plot of the '^C CP/MAS, variable dipolar dephasing experiment
of VII, obtained with a Hahn echo. The echo time was 200 \xs which is
one rotor period i.e. corresponding to a spin rate of 5 kHz.

Chaper 5 96
V i n 4-[4'-(dimethylamino) phenylazo] benzene sulphonic acid.
H
•O3S- / / w / 144.1 142.6
43.3, = \ + 41.1
N(CH3)2 136.2 160.0
J r " ^ - ' • • I • • • • I • I I • I ' • • • I • • •-•r-t--T T [ T J 1 I I • I . I I I I I • • • I I " I r T I I [ T I • [ 1 I • • 1 I T I 1 I I T I I • I
160 140 120 100 80 60 40 5/ ppm
Figure 14
'^CCP /MAS spectrum of VUI obtained at 75 MHz, with 1550
transients, a4 s recycle delay, a 3 ms contact time, and a spin rate of
8.43 kHz.
All of the ^ C resonances could not be assigned for this sample, however, the
quaternary signals were successftilly assigned. The signals associated to the
protonated carbons were: 115.5, 117.1, 119.7, 124.3, 125.3 and 128.9 ppm. The CI
resonance frequency of 142.6 ppm suggests that the hydrazone tautomer is present.
Additionally, the presence of two separate CH3 signals with a 2 ppm splitting infers
that there is hindered rotation of the dimethylamino group, presumably due to the
formation of a C, N double bond, as shown above.

Chaper 5 97
IX. 4-[2'-methyl. 4'-amino phenvlazo] benzene sulphonic acid, sodium salt.
-127 130.4
N a O . S — C ^)—^Nv ^
-127 114.3 \ / ^ ^ 2 114.3
141.4
170 160 150 140 130 120 110 5/ppm
Figure 15
C CP /MAS spectrum of IX obtained at 75 MHz, with 1100 transients,
a 2 s recycle delay, a 5 ms contact time, and a spin rate of 8.3 kHz.
The assigment given above indicates that IX is present as the azo tautomer,
with the CH3 group locked in a conformation such that steric hinderance from the
azo a nitrogen lone pair orbital is minimised. Weak quaternary signals were
observed due to the high spin-rates used, as already discussed.

Chaper 5 98.
5.2.2 N - 1 5 N M R
The effect of the substituents upon the electron density distribution in similar
conjugated systems has been well characterised via visible spectroscopy, and a
significant variation was observed. "* Nitrogen-15 NMR is very sensitive to small
changes in electron density, and thus would be useful in analysing these sulphonic
acid azobenzene systems. The isotropic shifts for azo nitrogens are particularly
difficult to detect at natural abundance in the solid state, due to the huge SA for the
signals, diluting the signal over many sidebands under MAS conditions. Too fast a
MAS rate wil l reduce the number of sidebands, but as was observed from the ''C
experiments several of the samples show modulation of the Hartmann-Hahn
matching profile. Setting the matching condition accurately is critical for these
measurements i f one spins at high rates. Al l of the spectra recorded in the section
were acquired at moderate spin rates of 5 kHz or less, thus alleviating the problem
with HH matching breakup. The assignments for the isotropic shifts are given in
Table 6. Some of the entries in Table 6 were obtained at natural abundance, and the
error in the shifts is rather large, ~±1 ppm. The labelled samples have chemical
shifts quoted with a significantly higher accuracy, due to the increased signal-to-
noise ratio. The calculated entries for the azo compounds were obtained by
comparison to the SCS values given in Table 6, along with the SCS parameter found
for the SO3" group in I . This '^N SCS has not been reported in the literature, and
was determined to be -12 ppm for the a nitrogen and +4 ppm for the P nitrogen.

Chaper 5 99
Sample No. Na Na (calc.) NP NP (calc) 1 Na - Np 1
I 118.7n 118.7 135.3 n 135.3 16.6
n l l O n 98.7 130 (122.9)* 129.3 20.0
m -131.5n 40.9 * 172.1
IV 128 (122.9)*
V -146.7 n 31.2 * 177.9
V I 37.7 107(111.3)* 126.3 69.3 '
V I I -122.5 n 5.8 * 128.3
vni'' -173.3 n 2.1 n 175.4
I X ' 126.7 n 122.2 n 4.5
Table 6
Assignment of'^N isotropic shifts in the solid state. The value in
parenthesis is for the solution(given in ppm) in DMSO-d^ The
calculated values were determined as discussed in the text n indicates
that the peak is observed at natural abundance, while * indicates
observation of the labelled signal.
" \Na - iVP I determined from theoretical Na and experimental N^.
* N(CH3)2 b^.is =-245.8ppm. ' N H j b^-is =-328ppm
From the results it is easy to see that I , I I , IV, V I and IX are all present as the
azo tautomer. The planarity of the aromatic rings affect the shifts of the azo
nitrogens in a manner which is dependant on the paramagnetic contribution. Mixing
of the angular momentum components for the ground states and the excited states
results in a higher paramagnetic contribution, i.e. a shift to higher frequency. I f the
energy difference between the levels involved increases, then the mixing will be
reduced, as would be expected i f stabilisation of the bonding orbital by hydrogen

Chaper 5 100_
bonding was present. Additionally, lone pair orbitals, of O H and NRj groups for example, can overlap with the aromatic n orbitals, creating fiarther stabilisation. This is why the dihydroxy salt, V I , shows an approximate 20 ppm low-frequency shift in relation to the other azo resonances for the P site. In comparison with the theoretical shifts, using solution-state SCS values, a large deviation to low frequency is also observed. Lycka observed similar low-frequency shifts in going from solution to so l id , and attributed them to an increased proportion of the hydrazo
13
tautomer. The C CP/MAS spectra do not show the introduction of any hydrazo
tautomer. This site is very sensitive to the strength of the hydrogen bond, and
consequently small changes in the structure significantly influence the observed
shift. It is clear that the sample is present in the azo form with a hydrogen bond.
The hydrogen bonding cannot be proven to be intra- or inter-molecular since the a
resonance cannot be observed.
As an example of a '^N spectrum obtained at natural abundance. Figure 16
shows the CP/ MAS spectrum of VIE. The two large low-frequency peaks are from
the N a - H resonance (-183 ppm) and the Ar-N(CH3)2 (-245.8 ppm), and appear
stronger due to the small SA. It should therefore be noted that it is very difficult to
obtain signals from the non-protonated azo nuclei at natural abundance,
particularly when the ' H Tjp is rather short (which can happen for several classes of
organic materials, and especially with many polymers).

Chaper 5 101
200 ' I'OO ' ^ ' . . , . . ppm
^5,
Figure 16
'N CP/MAS spectrum ofVIU obtained at 30.4 MHz, with 7392
transients, a contact time of 5 ms, a recycle delay of7s and a spin rate
of 5 kHz.
For samples Vm and IX knowledge of the shifts for N,N-dimethylaniline
(-336 ppm) and aniline (-323 ppm) are required to determine i f Zwitterion formation
occurs. Substitution of these anilines with a para-azo group does not significantly
effect the '^N resonance frequencies. Protonation of anilines result in low frequency
shifts, however, and for VII a high frequency shift of -90 ppm was observed, which
indicates that there is an increased double bond character for the nitrogen atom.
Thus, the proton from the sulphonic acid group is now associated with the a azo
nitrogen, resulting in the hydrazone tautomer. This differs from that determined
from N NMR by Kuroda'^ where the proton was associated with both the amino
and azo group as shown in Figure 17, with the ammonium resonance form being
favoured. The assignments for both the * C spectra and for the Na and NP

Chaper 5 102.
resonances in the '^N spectra are consistent with the hydrazone tautomer. Nuclear Overhauser enhancements cannot generally be observed in solid state spectra, and consequently the degree of protonation cannot be determined by NOE enhancements, as in solution.
H
Figure 17
The three P-'^N labelled free-acid samples all provide evidence from the
CP/ MAS spectra that the hydrazo form is present, or at least that there is a fast
equilibrium which significantly favours the hydrazo form. Variable temperature
analysis could give some insight into the equilibrium position of the azo / hydrazo
tautomerism, i f one exists and is found to be mobile. For HI, V and Vn no such
equilibrium was found. The '^C and CP/MAS spectra were virtually identical
over the temperature range, -100 °C to +80 °C. The differences between the a - ' ^
and p-'^N are -175 ppm for both HI and V, which are comparable to those observed
by L y c k a . T h e splitting for V I I is 128 ppm, which is significantly smaller than HI,
V and VI I I . I f one considers a mixture of the azo / hydrazo tautomers in rapid
exchange then, using the values for the splitting of 70 ppm (azo, determined in
Table 6) and 170 ppm (hydrazo), an -50 % contribution from the azo tautomer can
be determined. This is identical to the '^C results given earlier. However, it appears
that this explanation does not ftilly explain the results of the variable temperature
analysis. A shift of the resonance would be expected, because the equilibrium would
most probably be dynamic, as shown by Lycka.

Chaper 5 103_
The ^^N CP/MAS spectra were obtained at various field strengths, and show the presence of a perturbation to the lineshape which is observed at 20 MHz, but is negligible at 40 MHz. This perturbation, which was observed as a splitting of between 35 Hz and 45 Hz at 20 MHz, depending on the sample, can be attributed to the phenomenon of residual dipolar coupling (RDC) for these samples. No data have been published where anyone has observed this phenomenon for ' ' ' N - ' ^ coupled spins in a hydrazo spin system, which is not surprising. The P- site exhibits a very large SA which renders it very sensitive to the magic angle. The spinning sidebands span approximately 800 ppm, over twice that of NH4NO3 which was used to set the angle. Hence, it is twice as sensitive to errors in setting the magic angle. Even small errors will cause broadening of the signals, and the splitting is therefore lost. For example, for an error of 0.1°, a broadening of -80 Hz would be observed. Older probes may not have such sensitive angle adjustment as those used for the new Pencil rotors. On the Chemagnetics spectrometer the angle is slightly dependent upon the temperature, and a broadening was observed in reducing the temperature. It was possible to reset the angle and reintroduce the splitting. Challoner et a//^ have observed this splitting in the linear benzene diazonium cation. Jonsen^ and Lycka^^ did not observe any splitting in their hydrazo compounds, even though a ' ' N - ' ' ' N isolated spin system was present in their selectively labelled samples, due to the large linewidths, in excess of 200 Hz in Jonsen's case, and the presence of a crystallographic splitting in Lycka's work. Figure 18 shows the comparison between the CP/MAS spectra obtained at 40 MHz and 20 MHz for the three samples.

Chaper 5 , 104
Strangely, the 2:1 asymmetric doublet, after deconvolution, was found to be a 3:2 doublet for V, and this cannot be explained properly in terms of RDC. I f the origin of the splittings was of a crystallographic nature then one would expect them to be retained at the higher field strengths. Assuming the hydrazo tautomer is solely present it is possible to obtain the N-N bond length. The splitting between the two lines is given by:
5 = i^(3cos2 pi> - l + n s i n ^ P^ cos2a^)
where, D = i ! " - ^ NH.Y NIS^ ^ j ^ ^ dipolar coupling constant, expressed in Hertz, x 471 4K TJS
is the ' Y f nuclear quadrupolar coupling constant, r) is the asymmetry of the electric
field gradient, VN is the Larmor frequency for the ''*N nucleus, while a" and P° are
the Euler angles defining the orientation of the EFG tensor to the molecular frame.
It should be remembered that the magnetogyric ratio of the nucleus is negative
when one evaluates this expression.

Chaper 5
50 25 ppm
Figure 18
^^N CP/MAS spectra for; III a/ at 40 MHz, b/ at 20 MHz; VII d at
40 MHz, d/ at 20 MHz; V e/ at 40 MHz, f / at 20 MHz. Spectra were
acquired with between 40 and 128 transients, recycle delays between 2 s
and 5 s, contact times between 5 ms and 10 ms, and spin rates between
3.5 kHz and 5 kHz.

Chaper 5 106_
One must know all of the above parameters to make an accurate estimate of the splitting, the unknowns usually being ris, x, ^, ctP and P°. Osokin and coworkers^^ have previously obtained NQR parameters for some phenylhydrazones, and found that the magnitude of the amino '*N nuclear quadrupolar coupling constant was % = 4.68 MHz, with an associated asymmetry of the electric field gradient of i i = 0.31. Since the asymmetry is non-zero, one must be carefiil in the analysis of such RDC. The relative orientation of the EFG tensor, at the nuclear site, to the ^^-^'*N dipolar vector must be determined i f one wishes to apply the above equation. The ZEFG axis wil l be co-linear to the orientation with the greatest electron density, namely along the lone pair. Thus, assuming planarity of the molecule, p" = 90°, i.e. perpendicular to the molecular plane. Two alternatives have been proposed for hydrogen-bonded N-H amino groups depending on whether 1/ the XEFG axis or 2/ the YgpG axis points along the direction of the N-H bond. I f the YEFG points along the N-H bond then a ° = 30°, while for XEFG along the N-H bond the corresponding angle would be 120°. Therefore, using the above parameters, and the experimental splitting, it is possible to both orient the EFG tensor and evaluate the bond length.
The results are given in Table 7. From these two sets of results one can
assume that the N-N bond length is between 1.3 A and 1.5 A, and that the YEFG axis
points along the N-H bond. This result has been obtained from the facts that typical
N=N double bond distances, ' as obtained for azobenzenes, are between 1.2 A
and 1.27 A ,while those for N-N single bonds in hydrazones are lie between 1.3 A
and 1.4 A.^^' The error in estimating the bond length is actually rather significant
in this case because the splitting is small. Errors as large as +0.05 A for each sample

Chaper 5 107
are expected. Olivieri and co-workers/' and Garcia et al."^ have suggested that
formation of a strong intra-molecular hydrogen bond may possibly result in a
reduction of the nuclear quadrupole coupling constant, which would possibly allow
the XEFG axis to be directed along the N-H bond. However, Olivieri suggests that it
is more likely that the YEFG axis lies along the N-H bond for phenylazo-naphthol, in
accordance with the results found here. Interestingly, /ra«5-azobenzenes show no
'^C or '^N - ^ ' ' N R D C , not due to the small quadrupolar coupling constants, but
rather due to the relative orientations of the EFG tensor with the dipolar vector. The
quadrupolar coupling constant is rather large, x = -5 MHz,'*^ and given the N=N
bond length of 1.25 A, a splitting of ~5 Hz is expected (assuming an asymmetry of
r| = 0.5), which is far too small to be generally observed by '^N solid-state NMR.
Sample S/Hz D a
X/MHz
m 37 30 90 4.68 0.31 1.32
120 90 4.68 0.31 1.47
V 41 30 90 4.68 0.31 1.38
120 90 4.68 0.31 1.53
v n 47 30 90 4.68 0.31 1.43
120 90 4.68 0.31 1.59
Table 7
Estimation of the N-Nhond length for the hydrazo fragment of III, V, VII
for both possible orientations of the EFG tensor (as discussed in text).

Chaper 5 108
5.3 The solid-state structure of a typical reactive azo dyestuff.
Reactive azo dyes contain one or more groups which are capable of forming
one or more covalent bonds between a carbon atom of the dye anion, and an oxygen
atom of a hydroxy group in cellulose (for example). The characteristic structural
features of a reactive dye are shown schematically in Figure 19.
W D Q RG X
RG: electrophilic leaving group
Q: bridge link
X: nucleofiigic leaving group
D: chromogen
W: water solubilising group
Figure 19
The sulphonic acid azobenzenes discussed previously constitute the W and D
sections of the reactive dye shown in Figure 20, with its corresponding ^ C CP/MAS
spectrum. A propyl linkage (Q) joins the chromogen (W+D) to the reactive triazene
group (RG). For simplicity the molecule has been broken up into two fragments; A
and B. Solution-state ' C NMR suggests that there are two conformations present.
No solid-state ^ C NMR studies have been published on any reactive dyes. The most
complex dyes analysed previously by solid-state NMR have been a series of bisazo
pigments. 44

Chaper 5 109
NaO^S
12 11
// \ 3 2
8 9 N '/ w
4 V ^ l 5 6
-N
d e / C H 2 C H 3
\ C H 2 C H 2 C H 2 N H
a b c
1 ^ 1^0 5 / ppm
Na03S
IF- I F
Figure 20
Molecular structure ofASG 12974/94 with corresponding numbering
scheme and '^C CP/MAS spectrum obtained at 50.3 MHz. The spectrum
was acquired with a contact time of 6 ms, recycle delay of 10 s, 2000
transients and a spin rate of 6 kHz. Resolution enhancement was carried
out by applying 20 Hz Gaussian (centre of 0.2 virtual) and -20 Hz
exponential damping functions.

Chaper 5 HO.
In comparing the solution-state and solid-state ' C shifts it is apparent that there are no major structural changes, and that the structure is present as the azo form, as drawn in Figure 20. The presence of the triazene group and the several NH linkages around the molecule reduce the spectral resolution, because of '^C- ^ ^ ^ Cl, and * C- ''*N RDC. This is most evident at -160 ppm where no positive assignments can be made relating to the triazene ring. An assignment of the ' C solution and solid-state NMR shifts is given in Table 8. Only six signals were observed for the protonated carbon in the ' C CP/ MAS spectrum. This could probably be explained by the fact that all the protonated signals are averaged by rotations about the axes of the respective phenyl rings. From consideration of the resonance frequencies this cannot be the case. The resonance at 134.2 ppm suggests that one, or two, pairs of CH signals ortho to the azo linkage are separated due to hindered rotation. Additionally, the signal intensities appear rather anomalous when comparing the quaternary and protonated signals. This is presumably due to the fact that the proton-proton homonuclear dipolar coupling is very small, as evidenced by the narrow Bloch decay spectrum for the protons. As a consequence the Hartmann-Hahn matching profile breaks up into many narrow sidebands, and the signals may cross polarise very differently. Thus the protonated signals cannot be confidently assigned.

Chaper 5 111
Fragment A Fragment B
Carbon Solution Solid Carbon Solution Solid
No. de- DMSO No. dg- DMSO
1 150.42+150.37 150.0 13 168.52+167.87* 165.5*
2 111.23+111.27 14 165.37 163.7*
3 125.21 15 163.67+163.33* 162.2*
4 142.83 142.0 16 139.13+139.07 141.0
5 125.21 17 119.31+119.10 119.7
6 111.23+111.27 18 126.09+126.04 -126
7 152.31 152.9 19 142.25 137.4
8 121.23 20 126.09+126.04 -126
9 126.60 21 119.31+119.10 119.7
10 148.68 143.5 a 47.52 46.7
11 126.60 b 26.87+26.45 27.6
12 121.23 c 44.63 46.7
b 38.52+38.34 38.3
e 12.34+12.30 14.3
Table 8
'^C solution-state and solid-state chemical shift assignments (in ppm) for
the reactive dyestuff shown in Figure 20.
* indicates that assignments are interchangeable

Chaper 5 112
References.
1 P. Jonsen, PhD. Thesis, University of East Anglia, (1984).
2 R.K. Harris, P. Jonsen and K.J. Packer, Org Magn. Reson., 22, 269, (1984).
3 A. Lycka and V. Machacek, Dyes and Pigments, 7, 171-185, (1986).
4 M. Nepras, M. Titz, M. Necas, S. Lunak jr, R. Hrdina and A. Lycka, Co//.
Czech. Comm., 53, 213, (1988).
5 J. Kelemam, S. Moss, H. Sauter, T. Winkler, Dyes and Pigments, 3, 27, (1982).
6 D.F. Ewing, Org Magn. Reson., 12, 499, (1979).
7 A. Lycka, Coll. Czech. Comm., 47, 1112, (1987).
8 A M . Chippendale, A. Mathias, R.K. Harris, K.J. Packer and B.J. Say, J.C.S.
Perkin Trans II, 1031, (1981).
9 L.A. Ferorov, P. Savarino, V.I. Dostovalova, G. Viscardi, R. Carpignano and E.
Bami, Zunal. Stimkt. Khimii. 33, 91-101, (1992).
10 L.A. Fedorov, A.I. Rebrov and S. Lainfang, Dyes and Pigments, 18, 207-226,
(1992).
11 L.A. Fedorov, J. Anal Chem. USSR, 40, 23, (1985).
12 J. Keleman, Dyes and Pigments, 2, 73-91, (1981).
13 A. Lycka, Org Magn. Reson., 15, 17, (1981).
14 A. Lycka, D. Snobl, V. Machacek and M. Vecera, Org. Magn. Reson., 16, 17,
(1981).
15 A. Lycka, J. Jirman, B. Schneider and J. Straka, Magn. Reson. Chem., 26, 507-
510, (1988).
16 Y. Koruda, H. Lee and A. Kuwae, J. Phys. Chem., 84, 3417, (1980).
17 Y. Kosugi and T. Takeuchi, Org Magn. Reson., 12, 435, (1979).
18 Y. Kosugi, Anal Scl, 4, 353, (1988).

Chaper 5 113_
19 P. Savarino, G. Viscardi, E. Bami, R. Carpignano and L.A. Fedorov, Dyes and
Pigments, 13,1 ISO, (1990).
20 L A Fedorov, S.A. Sokolovskii, S.I. Dvoskin and V.M. Chertov, J. Org Chem.
USSR., 23, 2067, (1987).
21 A.M. Chippendale, Private Communication.
22 A.R. Monahan and D.F. Blossey, J.Phys. Chem., 14, 4014, (1970).
23 A.R. Monahan, N.J. Germano and D.F. Blossey, J.Phys Chem., 75, 1227,
(1971).
24 J.E. Kuder, Tetrahedron, 26, 1973-1981, (1972).
25 V. Bekarek, K. Rothschein, P. Vatesnik and M. Vecerea, Tetrahedron Letters.,
3771, (1968).
26 G. Gabor, Y. Frei, D. Gegiou, M. Kaganowitch and E. Fischer, Israel J. Chem.,
Si 193, (1967).
27 J. Ospenson, Acta Chem. Scand, 5, 491, (1951).
28 D. Hadzi, J. Chem. Soc, 2143, (1956).
29 A.W. Hanson, Acta Cryst, B29, 454, (1973).
30 N. Ehlinger and M. Perrin, Acta Cryst. C, 51, 1846, (1995).
31 Y. Saito, B. Kim, K. Machida and T. Uno, Bull Chem. Soc. Jpn., 44, 2111,
(1974).
32 S. Chattopadhyay, G.S. Kastha and S.K. Brama, S. Chattopadhyay, G.S. Kastha
and S.K. Brama, J. Raman Spectrosc, 22, 449, (1991).
33 P.K Bajpai, B. Pal and T.S. Basu Baul, / . Raman Spectrosc., 26, 217, (1995).
34 P. Gregory and D. Thorp, J. Chem. Soc. Perkin Trans I, 1990, (1979).
35 R. Challoner and R. K. Harris, Solid State NMR, 4, 65, (1995).

Chaper 5 114_
36 D.A. Osokin, I.A. Saphin, B.I. Buzoikin and P. Kitaev, Dokl Akad Nauk.
USSR., 223, 920, (1975).
37 C. J. Brown, Acta Crystallogr., 21, 146, (1966).
38 J. A. Bouwstra, A. Schouten and J. Kroon, Acta Crystallogr., C39, 1121, (1983).
39 A.C. Olivieri, R.B. Wilson, C. Paul and D.V. Curtin, J. Am. Chem. Soc, 111,
5525, (1989).
40 R.G. Cooke, C.L. Raston and A.H. White, Aust. J. Chem., 33, 441, (1980).
41 S.H. Alarcon, A.C. Olivieri and P. Jonsen, J. Chem. Soc. Perkin Trans II, 1783,
(1993).
42 M L. Garcia, J.A.S. Smith, P.M.G. Bavin, C.R. Genelin, J. Chem. Soc. Perkin
II, 1391, (1983).
43 T. Eguchi, M. Kishita, N. Nakamura and H. Chihara, J. Phys Soc. Jpn., 57, 227,
(1988).
44 K.-Y. Law, S. Kaplan, R. Crandall and I . W. Tamawskji, Chem. Mater., 5, 557-
565, (1993).

Chapter 6 115
6. Analysis of Dipolar Coupled Spin Systems Using N-15 NMR.
6.1 Introduction.
Nitrogen NMR spectroscopy affords a variety of information, due to its
magnetic and electronic properties, and has been studied extensively by a range of
NMR techniques. Nitrogen forms bonds with all non-inert elements, leading to an
unusual variety of bond types, which generates a great variety of electronic
environments and consequently a chemical shift range of over 1500 ppm for
diamagnetic compounds. This is a result of nitrogen's greater electronegativity in
comparison to ^ C, and its ability to carry lone-pair electrons with s character. Many
texts exist reviewing nitrogen spectroscopy of both ^''N and nuclei, ' ^ with the
majority of work being carried out on biologically important molecules, and
focusing recently on the spin-1/2 ^^N nucleus (typically upon enriched samples).
Table 1 shows the NMR properties of the two active nitrogen nuclei.
Nitrogen-14 is quadrupolar, 1=1, and the rapid quadrupolar relaxation causes
significant linebroadening of the spectrum. In the solid state it is generally not
feasible to obtain ^''N spectra by standard CP/ MAS techniques. Double-quantum
techniques have been developed which remove the effect of the first-order
quadrupolar interaction. ' However, these techniques are only useful for nuclear
species in highly symmetric environments where there is no second-order
quadrupolar interaction.

Chapter 6 116
Spin I 1 0.5
Natural abundance (%) 99.635 0.365
Magnetic moment | i (|J,N) 0.57099 -0.4903
Magnetogyric ratio (10^ rad s"') 1.9338 -2.712
Receptivity relative to that of ' C 5.69 2.19 x 10-
Nuclear quadrupole moment (10" * m ) 1.99 X 10" 0
NMR frequency H (MHz) 7.26329 10.136783
Table I NMR properties of the ''^N and '^N nuclei.
6.2 Shielding Theory:- Special Emphasis on Nitrogen.
The shielding range for nitrogen is over three times greater than that for
carbon, but similar trends in shielding constants are observed. The shielding
contribution cr^, can be decomposed into two terms according to whether the
shielding opposes ( < 7 ^ ) or assists ( c r ^ ) the static magnetic field. The diamagnetic
term does not vary greatly for a particular nuclear species, and is given by equation
(1).
(1)
However, the paramagnetic term which dominates the nitrogen shielding can
vary significantly and is given by equation (2),

Chapter 6 I I I
where the shielding tensor a is defined by
<? E
and where, rNk is the position of electron k relative to nucleus N, is the angular
momentum operator of electron k as determined relative to nucleus N, Lk is the
angular momentum operator relative to a chosen gauge origin, and To and T n are the
ground-state and excited-state electronic wavefunctions. Equations (1) and (2) are
the single-electron shielding equations defined by Ramsey, and should be summed
over all the electrons in the molecule.
The diamagnetic term results from the circulation of the electrons within
closed, low-lying, shells resulting in a relatively constant screening of the nucleus, and
this term will not be considered any further. The paramagnetic shielding term arises
from the mixing of certain excited states with the ground electronic state in the
presence of a magnetic field. Because of the nature of the projection operators in
equation (2), the only excited states which can contribute to the paramagnetic term
are those which are connected to the ground state by magnetic-dipole-allowed
transitions. This paramagnetic shielding, which reinforces the static field, causes a
deshielding of the nucleus, and is only present for non-spherical electronic
distributions surrounding the relative nucleus. The shielding varies significantly for
nitrogen nuclei due to the asymmetry of the p orbitals, which is dominated by the
bonding and non-bonding, electrons. The (En-Eo) term is an effective excitation
energy for the paramagnetic circulation, and higher excited states obviously
contribute less to the deshielding of the nucleus than low-lying states. These
excitation energies vary more widely for nitrogen than for carbon, which is the

Chapter 6 118_
primary reason why nitrogen shielding constants exhibit a greater variety. The effects of the energy term are observed as d/X correlations, i.e. there is a direct relation between the nitrogen shift and the wavelength of the electronic transitions observed in visible spectroscopy within a series. This is particularly relevant in the present analysis of coloured azobenzene dyes.'" The weakly allowed n^ -> K* excitations, in which there is a component of the s ^ p type, gives the well-known long-wavelength bands of the azo chromophore, and causes a high-frequency shift of the nitrogen resonance. In nitrogen atoms which possess both 7r-bonding orbitals and lone-pair electrons, the energy difference between the ground and excited states is significantly reduced in comparison to singly-bonded, symmetric molecules, resulting in far larger paramagnetic contributions to the observed shifts. It is only possible to use these hand-waving arguments to discuss the actual frequency of the isotropic shift. To try to estimate the frequencies of the individual tensor components one must actually evaluate the wavefunction for the molecule. For symmetric molecules it is possible to utilise the symmetry to simplify the system and separate out the individual components at which point it may be possible to make comparisons in relation to the geometrical features. For planar systems, such as condensed aromatic hydrocarbons,'' it is well established that the O33 component of the ' C shielding tensor is dominated by the a- electron system. Hence, for azobenzenes the most shielded component for the azo nitrogen, which is known to be perpendicular to the plane of the azo group, mixes o and a* orbitals (large energy-separation) resulting in small amount paramagnetic shielding, ie. a low frequency signal.

Chapter 6 U9_
Consequently, the other two components observed for polycrystalline samples, reflect the 7r-delocalisation of the system centred around the azo group. The strongest deshielding (largest paramagnetic shielding) is observed for axes (an) which mix n^ and %* orbitals with a small AE. The energy of the njsj - > 7 i * transition tends to increase upon decreasing the electronegativity of the partner in the double bond, within a homologous series, correspondingly lowering the resonance frequency in comparison to similar ^ C N M R . The axis points along the lone-pair orbital in these systems. These considerations assume that the azobenzene fragment is wholly planar, but this will not generally be the case, with the aromatic rings often rotating out of the plane. This rotation will effect the K* energy by reducing the conjugation though the system, thus raising its energy. Additionally, it renders the n^ -^K* transition allowable. This approach is very simplistic, and will generally only give information regarding trends in a series of similar molecules.
A significant selection of literature has now been built up on nitrogen shifts,
with the shifts for ^ ' 'N and ^^N being used interchangeably. An exact understanding
of these shifts in relation to the previous discussion surrounding the paramagnetic
shifts is not generally simple. Computation of shielding tensors via theoretical
calculation methods has been applied with varying success. Generally, experimental
agreement is good for singly-bonded molecules with high electronic excitation
energies. However, in systems with multiple bonds and lone pairs, a poor
correlation is observed due to the extensive mixing of several excited states,
requiring accurate calculation of the electronic wavefunctions. Additionally, one
tends to consider the molecular structure of an isolated molecule, which can lead to

Chapter 6 120
large errors for nitrogen nuclei, where inter-molecular hydrogen bonding is known
to be the principal governing factor in the tertiary structure of biomolecules.
Therefore these interaction should be taken into account when looking at the tensors.
Webb and co-workers' have looked extensively into how the interaction of solvents
effects the shielding constants, whilst Facelli and co-workers have analysed the
hydrogen bonding affects on benzamide,' and uracil'* in the crystal state. The
solid-state calculations show quite significant variations from the experimental
values i f hydrogen-bonding is ignored. A selection of experimental shielding
tensors for the '^N nucleus are shown in Table 2.
Compound 5iso ^22 ^33 Q K Ref
NH3(g) -400 254 238 278 278 40 1 Kukolich'
P-N(g) 213 -349 -689 -689 350 1048 -1 Raymonda'
/rora-PhN=NPh 131 -267 -789 -146 136 925 0.39 Wasylishen'
CeHt' NOz -2 -134 -399 -32 30 429 0.71 Freidrich'*
N H 4 ' ^ 0 3 -4 -132 -220 -189 11 321 -0.74 Delmotte'
Pyridine-' N -83 -53 -387 -168 395 782 -0.44 Spiess "
Nylon-6 -268 132 34 154 29 275 0.37 Powell '
- (CO '^ ) -
02N(C6H4)C="N -117 -19 -153 -143 240 393 -0.95 Sardashti ^
Table 2
Principal components of nitrogen shielding tensors for a range of
systems. Shifts (5) and shielding (cs) are related according to
a = -135.8 -b(MeN02). O. and K are defined on page 122.

Chapter 6 121
6.3 —N Tensor Analysis of Azo and Imine Groups.
The low receptivity of '^N at natural abundance negates the possibility of
acquiring most shielding tensors from natural-abundance ^^N solid-state NMR,
particularly by static techniques. In the future, the application of the dynamic
nuclear polarisation technique^ will allow tensors to be evaluated at natural
abundance in a whole range of samples, and also the detection of signals from very
dilute spin systems. This would be important in biomedical applications where one
wishes to look at biopeptides in situ, and also for the observation of the ^ N signal
from dyes located within dye fibres. At the moment, the majority of tensor analyses
are carried out on ^^N-enriched, polycrystalline samples, via static bandshape, " and
spinning sideband analyses (SSB).' ^
The only ^^N tensor analyses that have been carried out on azobenzenes, or
hydrazones, were those reported by Wasylishen and co-workers on both trans- and
cw-phenylazo-benzene.' ' ^ Wasylishen's study of /raw5-azobenzene was applied to
a doubly-labelled sample, which consequentiy resulted in the creation of a '^N-'^N
isolated spin-pair. This is a highly advantageous situation because application of a
tensor analysis upon isolated spins, with no other interactions, does not allow one to
orient the shielding tensor relative to the molecular frame. In the above analysis, it
was possible to orient the shielding tensor relative to the N=N bonding vector.
Simulations of static lineshapes from dipolar-coupled spin-pairs have been carried
out regularly, and complex fitting routines generally fit the first, or second,
derivative spectra, as these are more sensitive to the presence of dipolar coupling. '"
Theory suggests that the most shielded component, O33, points perpendicular to

Chapter 6 122_
the C-N=N-C plane (P = 90°), and this is what was observed from the results of the CS
static spectrum where P was found to be -80°. The deviation from 90° for the 033
component is probably a result of the non-planarity of the aromatic rings.
Additionally, the O22 component was thought to point along the nitrogen lone pair CS
orbital corresponding to a a = -30° (assuming a 120° N = N - C dihedral angle), and
an experimental value of -40° was found. Throughout this chapter the convention
used is that of Mason ' whereby the principal components of the shift tensor are
defined according to Sn > 622 2:833 , and the following properties are useful in
understanding the symmetry of the electronic environment; Span; 0 = 611-533, Skew; K =
In the present analysis, the samples described in the previous three chapters
have been treated via both static bandshape analysis, using a fitting routine based on
the POWDER interpolation scheme, "* and SSB analysis, using a program developed
at Durham.'^ As in Wasylishen's analysis, it is impossible to directly obtain the
principal components of the shift tensor for these nitrogen environments without
consideration of direct dipolar interactions, either heteronuclear ( ' ' ' N - ' ^ , or
homonuclear ( " N - ' ^ N ) . Examples of both systems can be prepared by specific
isotopic enrichment. The initial results are presented as obtained from singly-
labelled samples, either at the a or p positions, along with one example of a " N - " N
isolated spin pair, i.e. doubly-labelled at the a, p positions.

Chapter 6 123.
6.3.1 DR278 Polymorph H: a (Ha), p (HP) and a, P (Hdl) ^^-labelled samples.
A static analysis of these singly-labelled samples proved to be impossible at
20 MHz due to the fact that the two overlapping powder patterns, arising from the
conformations previously discussed, could not be resolved. Increasing the static
field strength to 40 MHz provided a significant improvement in the resolution,
presumably due to the fact that the chemical shift is scaled in frequency while the
dipolar coupling is invariant to field strength; therefore the coupling will contribute
less at the higher field. At 40 MHz two 622 components could be observed for each
of the singly-labelled samples, which is rather surprising i f one considers that there
is a dipolar coupling of -600 Hz present. This suggests that the orientation of the
dipolar vector, in the principal axis system of the shift tensor, is such that no
splitting is observed for the 622 component. The two 611 components could be seen
for Ha, while the 833 components were resolved for np, with the third pair for each
sample not being observed, as shown in Figure 1, due to the quadupolar coupling
which broadens the turning points. The spectrum of Ildl, which is a doubly-labelled
sample, is also shown for comparison. To show these effects, a simulation of the
best estimate for I la , in which a ^ = 3 5 ° and P°=90°, is compared to that of an
arbitrary orientation of the dipolar vector in Figure 2. The accuracy of p" is rather
low and the splittings obtained are actually dependent upon both the aP and p'
values. Correspondingly, i f P° is chosen to be 80° then the value for a' would
increase to 36° to maintain the structure of the 822 components.

Chapter 6 124.
In fitting these static powder patterns to obtain the shift tensor values the dipolar coupling was ignored to simplify the situation. This is a valid simplification when one looks at the actual powder patterns, and also when comparing the SSB results to the static values. A simulation of the static powder pattern for ndl. Figure 3, shows the effect of ignoring the dipolar coupling. A satisfactory fit could not be obtained i f all three principal components were allowed to be variables in the fitting process, and so Sjso and 822 were fixed. The results of the fitting routine are shown in Table 3, along with the results obtained from the SSB analysis at various spin rates. It should be noted that heteronuclear dipolar coupling is an inhomogeneous interaction, which for weak couplings, is spun out at slow spin rates, and therefore, the resultant spectral intensities arise purely from shielding anisotropy. This is not the case for the homonuclear interaction as wil l be discussed later. The errors in the results obtained from the fitting routines can generally be considered to be ~5 ppm for each program, but arise from different origins. The digital resolution of the static spectra is -100 Hz (3 ppm) and the consequent goodness of fit can be no better than the resolution of the original data. In the SSB case the surface over which one fits is relatively flat, and even i f a good correlation between experimental and simulation appeared to exist there may be a large range of possible solutions that lie close to the minimum. Figure 4 shows a representative '^N CP/ MAS spectrum of DR278.
In comparing the four different signals some significant deviations can be
observed. The signals for np produce similar spans of -900 ppm, but the
corresponding skews vary by 0.1, while the signals for Ha show the same skews, but

Chapter 6 125.
have different spans. The spectrum for Ildl (Figure lb) appears to be purely a superposition of the two singly-labelled spectra, again indicating that the orientation of the dipolar vector in the principal axis system of the shift tensor is such that the the splittings are minimised.
I f one tries to analyse these values in relation to the previous discussion
relating to electronic transitions some curious features are revealed. Ha is the
nucleus which undergoes hydrogen bonding, and therefore, the non-bonding orbital
on the azo-nitrogen, n^, would be expected to change its energy rather significantly.
Additionally, the lone-pair electrons of the amide also act to stabilise the aromatic
ring, raising the 7C* energy level. As a result, the two separate interactions cooperate
to change the energy of the n^ -^K* transition, but this change does not manifest
itself upon the an component as the two values are very similar. A large
paramagnetic shift is observed in going from Ha to np for the On components,
which can be explained by a reduction of the same transition energy. However, the
exact nature of the change of the energy levels cannot be precisely determined
Figure 1 a/ and d/ show very interesting features, which at first appearance
seem rather beguiling, and uninterpretable in terms of the expected lineshapes
arising from dipolar-coupled powdered samples. The apparent discrepancies in the
intensities of the high-frequency region of the spectra are a result of the very high
quality of the probe used for these measurements.
This is an unusual problem for a spin-1/2 nucleus, because typically the
dominant criterion, which affects signal intensities, in the experimental setup is the
strength of the X-channel r f field. This is due to the fact that a pulse of duration x

Chapter 6 126_
excites over a bandwidth defined by the Fourier transform of a truncated cosine wave. The shape of this excitation profile, in the frequency domain, is represented by a sine function, and the frequency at which a signal is attenuated by a factor of 1/2 is at the -3 dB point, in comparison to the maximum of the sine function (on resonance). This is simply four times the nutation frequency of the rf field, i f a 90° tip angle is used in a Bloch-decay experiment. Application of CP to generate the X-channel signal however, removes this problem because the X channel is not used for an excitation pulse, but purely to give a matching field which satisfies the Hartmann-Hahn condition, and to produce sufficient spin-locking of the nuclear spins. Correspondingly, assuming one applies a strong enough r f field to the proton spin system to excite over the whole dipolar-coupled proton reservoir, then all X nuclear spins wil l be equally excited (with the obvious modification due to CP dynamics).
Linear response theory dictates that i f a system is subjected to a stimulus the
detected signal is a convolution of the input signal with the input response of the
system. The response function wil l be exponential in nature, and subsequent Fourier
transformation of this damped oscillation (probe acoustic ring-down) produces a
Lorentzian line. The width. A© 1/2, of this band determines the bandwidth of the
probe, and hence the frequency range over which signals can be detected. This is
not entirely true, because probes generally do not react in a perfectly linear manner
to a pulse, and higher order effects need to be considered. However, this first-order
approach was used to simulate the response function for the probe, when tuned to

Chapter 6 127
— I — I — I — 1 — I — I — I — \ — I — I — \ — I — \ — I 7 5 0 5 0 0 2 5 0 0
ppm
"I I I I I I I I I - 2 5 0 - 5 0 0
J5.
Figure J
"N static powder patterns for a/Ildl at 40.57 MHz, b/IIdl at
40.58 MHz c / / /p and d/Ila, at 40.57MHz using a Hahn-echo pulse
sequence.

Chapter 6 128
Sample Method ^iso 6ii §22 S33 Q K
I l a Static 60 500 -23 -297 797 -0.31
SSB 2kHz 60 505 -21 -304 809 -0.30
Static 44 470 -34 -304 774 -0.30
SSB 2 kHz 44 476 -36 -307 783 -0.31
np Static 89 577 22 -323 900 -0.22
SSB 1 kHz 89 575 22 -328 903 -0.22
SSB 4.2 kHz 89 579 16 -327 906 -0.24
Static 121 614 32 -279 893 -0.30
SSB 1 kHz 121 599 36 -272 871 -0.29
SSB 4.2 kHz 121 613 31 -281 894 -0.30
AB Static 131 653 10 -272 925 -0.39
Diazene Calculated 379 1234 226 -322 1556 -0.29
Table 3
Principal components (in ppm) of the shift tensor for the two
conformations present in Ila and //p. The corresponding values for
trans-azobenzene (AB) and the calculated shifts for diazene (N2H2) (from
reference 17) are given for comparison.
Figure 5 shows a series of simulations for an arbitrary static powder pattern
(similar to the azo ^^N powder patterns), which has been convoluted with Lorentzian
broadening functions of differing width, centred near the isotropic shift (a-c) , and
differing centre, but constant width (d-h). These simulations are rather dramatic,
and reflect the need for careful experimental procedure when one wishes to obtain
accurate tensor patterns from high Q-probes. The transmitter position can be

Chapter 6 129
optimised such that it is placed near to the centre of the spinning sideband manifold,
not the isotropic shift position.
However, the Q of the probe is inherent in the reactive components within it,
and as such cannot be readily modified. The Q can be reduced by addition of
resistive elements within the tuning circuit, but reduction should not be attempted by
mis-matching the probe circuitry. This is a problem which will become more
important in the future, with the need for multi-purpose probes at higher field
strengths.
700 500 300 100 -100
S i 5 N / ppm
•300 •500
Figure 2
Simulation of the static '^N spectrum oflloi, coupled to a single '^N
nucleus. The simulations were carried out at 40.6 MHz and correspond
to two different orientations of the dipolar vector; a/ (0^=90°, ^^90°)
and b/ (aF=35°, ^^=90°), using the principal components obtained by
averaging the entries in Table 3 for each resonance.

Chapter 6 130
— I ^ r -500 300
— I ^ 1 1 1 •100 -300 -500 700 100
5 , 5 N / ppm
Figure 3
Simulations of DR2 78II a, ^ double label at 40.6 MHz using the
average of all the principal components from Table 3 for each resonance
assuming; a/ no dipolar interaction, and b/ homonuclear dipolar
coupling as discussed in text.
m 1 ~ n ^ T"
100 -100
^ i 5 N / p p m
T 1 700 500 300 -300 -500
Figure 4
'^N CP/MAS spectrum of Ildl obtained at 40.6 MHz, with a spin rate of
4.5 kHz. * denote the isotropic shifts.

Chapter 6 131
30000
b/ 40 kHz
c/ 30 kHz
d/ 2 kHz
e/ 4 kHz
f/ 10 kHz
g/ 12 kHz
h/ 15 kHz
20000 10000 -10000 -20000
1 5 N / H z
Figure 5
'^N static simulations with an additional Lorentzian broadening function
simulating the effects of probe bandwidth; a/, b/ and c/ with centre at
zero and varying broadening, and dJ-h/ with a fixed broadening function
of 30 kHz and varying centre.

Chapter 6 132
6.3.2 DR278 Polymorph V I : p (Vip) labelled samples.
Consideration of the same principles as used in the analysis of the previous
samples, produced a rather good fit, as can be seen from the data in Table 4. The
MAS results are all consistent with each other within experimental error for each
field strength used. There is an apparent increase in the span for the higher field
SSB experiments, in relation to the results obtained at 20 MHz. However, this trend
was not observed for the static spectrum, which showed a significant decrease in the
span, which can possibly be accounted for by the aforementioned probe bandwidth
problem.
Method 5iso 5 i i 522 533 n K
Static 106.9 a
613 27 -317 930 -0.26
SSB 2 kHz a 625 25 -335 960 -0.26
SSB 3 kHz a 627 27 -334 961 -0.25
SSB 2 kHz b 621 27 -327 948 -0.25
SSB 3 kHz b 619 27 -326 945 -0.25
SSB 4 kHz b 620 31 -330 950 -0.24
Table 4
Principal components (in ppm) of the shift tensor for F/p obtained at
UOMHz and'' 20MHz.
This sample is thought to exist in the non-hydrogen bonded conformation,
and the results should therefore be very similar to those obtained for the 89 ppm
peak in Iip. Direct comparison of the principal components for each sample shows
that 833 and 622 are very similar for the two cases, while the Sn components are

Chapter 6 133.
significantly different. They are in fact -50 ppm different, which wholly accounts for the difference in the isotropic shifts. Thus, the interaction which leads to this extra shielding for Vip must be a component of the paramagnetic shielding constant which affects the electron density perpendicular to the molecular frame. In the non-intra-molecular hydrogen-bonded conformation it is possible for the amide group to rotate freely i f it is not involved in the formation of an inter-molecular hydrogen bond. The amide nitrogen's lone pair will form stronger 7i-orbital overlap i f it is oriented co-linearly with the aromatic 7i-system, and when this occurs the n* anti-bonding orbital wil l increase in energy. This would result in a reduction of the paramagnetic contribution to the 833 shift component, which is observed for np. Secondly, the planarity of the molecule wil l affect the observed shifts, from similar considerations as above, with non-planarity reducing the conjugation through the system. Additionally, a slight change in the K-TI stacking separation could produce a similar effect, as just discussed. These are, however, only speculative proposals, because the crystal structures of these polymorphs are different. The origins of these changes cannot be explained without knowledge of the crystal structures.

Chapter 6 134_
6.3.3 Sulphonic acid azobenzene derivatives: P-labelled samples.
These sulphonates, from the '^C and isotropic shifts, were found to be
present in either the azo or hydrazo tautomers. From comparison with the principal
components of the shift tensors for the previous samples, it is simple to determine
which tautomer is present. The previous P-labelled samples show that there is a
large variation of shifts for the three principal components, with the spans varying
between 850 and 950 ppm, and the skews varying between 0.2 and 0.3. The
hydrazo, N - ^ ' N = C , shift tensor components have not been reported in the
literature. The principal components, and their orientation in the molecule, for the
shift tensor, were obtained by Curtis et al, for the simple Schiff base, trans-
benzylideneaniline.'^ This C=N moiety will possibly allow the orientation of the
imine shift in the hydrazo form to be determined, and it will serve as a comparison
for the relative magnitudes of the shifts.
In the previous chapter the solid UV/ Vis spectra for Ha and in were
presented to try to understand the structures of the relevant molecules. It should be
noted that the spectral transitions have 7i->7t* character, and therefore do not relate
in any way to the discussion regarding chemical shift relationships to electronic
spectra.
Table 5 shows the principal components of the shift tensor for the acids
and salts of the substituted /7-hydroxyazobenzene sulphonates, and an example of the
fitting accuracy of the SSB method is given in Figure 6. The SSB spectra shown are
purely Lorentzian convolutions, with an arbitrary linewidth, of the normalised input
and output intensities for the SSB fitting routine.

Chapter 6 135
Sample Method 5iso 6,1 522 533 D K
Salts (Na)
Ub/p-OH SSB 2.5 kHz 130.0 659 11 -279 938 -0.38
IV/p-OH,o-CH3 SSB 2 kHz 128.0 670 5 -290 960 -0.38
SSB 4 kHz 679 0 -294 973 -0.39
W 0, p-diOH SSB 2 kHz 107.0 576 24 -282 858 -0.29
SSB 4.1 kHz 586 14 -282 868 -0.32
Acids
III/p-OH Static (fit) 40.9 437 21 -321 763 -0.08
SSB 3.5 kHz 434 20 -330 764 -0.08
SSB 5 kHz 425 19 -320 745 -0.09
V/p-OHo-CHj Static (fit) 3\,2 396 15 -319 715 -0.07
SSB 3.5 kHz 423 14 -343 766 -0.07
SSB 5 kHz 425 16 -347 772 -0.06
VII/ 0, p-diOH Static (fit) 5.8 338 5 -314 652 0.00
SSB 4 kHz 368 8 -359 727 0.01
SSB 5.5 kHz 373 3 -359 732 -0.01
Benzylideaniline a
Static -48 229 -60 -316 545 0.06
Table 5
Principal components (in ppm) of the shift tensor for the sulphonated
phenylazobenzene dyes. C From Ref33)

Chapter 6 136
J J L J J L
4kHz
Figure 6
Comparison of the experimental and the best-fit spinning sideband
manifold for VII spinning at 4 kHz. The best-fit tensor components are
given in Table 5. The difference spectrum is shown with an error,
represented as a sum square difference, of 0.5. The total signal intensity
was normalised to 100. The isotropic shift is indicated by * above the
isotropic shift for the experimental spectrum..

Chapter 6 137_
Prior to trying to understand the shift tensor components in relation to the structures, care should be taken with regard to which data one should use for the acid samples. It can be seen that for V and V I I there is a large difference between the static and SSB outermost tensor components. It can be shown, by application of a moments analysis, that the symmetric distortion of the powder pattern due to the narrow bandwidth of the probe reduces the span of the calculated powder pattern. I f one considers a probe bandwidth of -30 kHz, then 5^ and 833 will be reduced by -50 ppm, which is in line with the observed differences between the static and SSB values. This same narrowing of the powder pattern (15-20 ppm ) was also observed for Vip. It is rather unclear how the distortion affects the fitted values when using the POWDER algorithim,^'* because comparison of the best fit with the actual experimental bandshape seems to indicate that the fitting compensates for the intensity distortions. The SSB fitting routine is known to be less sensitive to these distortions. The outermost sidebands which will be affected are generally weak, and therefore contribute less to the least-squares parameter which the simplex algorithm wishes to minimise. This was verified by restricting the range over which the program reads the signal intensities for its optimisation, and virtually no change in the output values was detected. Thus, it would seem valid to assume that the static tensors are incorrect, and that the SSB values should be used for these samples.
A direct comparison of the results for the salts and the acids shows that 622 is
virtually independent of the nature of the nitrogen environment, but large changes
are readily observed for and 833. The 833 component changes by -50 ppm, which
is marginal for nitrogen shifts. The dominant change is that of the 8,1 component.

Chapter 6 138_
which reduces by -200 ppm in going from the salt to the acid. This low-frequency shift creates a highly asymmetric powder pattern, with a skew o f - 0 , i.e. the powder pattern is centrosymmetric, which is very similar to the case of benzylideneaniline. The 200 ppm lower shift for the acid is dominated by the electronegativity of the atom involved in the double-bond formation, as previously mentioned. The reduced electronegativity of the carbon atom, in relation to nitrogen, increases the TC* energy relative to that of the n orbital, reducing the paramagnetic shielding of the On component. This result is concurrent with the results obtained by Curtis^^ and Wasylishen,^' and also with azobenzene and several other molecular groups ''.
In looking at these principal components the orientation of the tensor must be
evaluated for the acid systems, since it will not be the same as for the azobenzene
cases. In the static spectra no splittings were observed for the 822 components,
which indicates that this component is again oriented along the nitrogen lone pair.
Similarly, the 633 component is likely to remain approximately perpendicular to the
plane of the molecule. The component does not necessarily need to be oriented
in the same direction, and wil l probably point in the opposite direction, i.e. CL^ ^
145°. One cannot distinguish between the two possible orientations from the static
powder pattern, due to the symmetric nature of the splitting of the 622 component
(even symmetry around oF =90°). However, from the benzylideneaniline case,
where a ° = 42°, it is clear that the angle is -140° in the present hydrazo molecules.
The angle a' in benzylideneaniline is with respect to the C=N vector, not the N-N
dipolar vector as in our case.

Chapter 6 139.
6.4 Reintroduction of Dipolar Interactions Under MAS Conditions.
The magic-angle spinning spectra in the previous sections have all been fitted
by assuming that the dipolar interaction does not contribute to the sideband
intensities. This is a valid assumption due to the fact that all the spin rates exceeded
the strength of the dipolar coupling.^^ Over the past decade it has proven popular to
try to reintroduce the dipolar interaction by mechanical manipulation, or by the
application of complex pulse sequences. This development was initiated as a result
of the fact that static lineshapes only yield accurate information for small dipolar
coupled spin systems. In complex spin systems with multiple couplings it is
impossible to disentangle the dipolar couplings from each other, and also from the
shielding components. Excellent review acticles by GrifFm and co-workers^ '
summarise the manner in which these interactions can be reintroduced and how they
manifest themselves as complex spectral features in an NMR spectrum, in either one
or two dimensions. Additionally, i f one can accurately predict multiple dipolar
couplings within MAS spectra then it may be possible to carry out experiments
which map out the whole dipolar coupling network within a molecule, and therefore
determine the structure, in a similar fashion to the NOESY^* experiments in solution
state NMR.
To determine weak homonuclear coupling constants under MAS several
experiments can be applied, depending upon the nature of the system, and they can
be categorised into two groups. The first class involves the periodic application of rf
pulses which interfere with the spatial averaging effects of MAS, and therefore
restore homonuclear and heteronuclear dipolar couplings to the spectrum. In these

Chapter 6 140_
experiments the dipolar coupling prevents the complete refocusing of the rotor echoes, and an oscillatory dephasing of the magnetisation is observed, with the resultant curves being well understood.^^ The second class involves a rotor-driven exchange of magnetisation, which occurs when the MAS rate satisfies the condition of rotational resonance, i.e. n(OR=Aa)iso.
6.4.1 Rotational Resonance: R^
The theory of rotational resonance has been explained in detail elsewhere by
Levitt,'**' Vega"^ and McDowell.'*^ To determine accurate results one must apply
Floquet theory and carry out some rather complex matrix calculations. In the
present analysis only a phenomenological discussion of the rotational resonance
experiment wil l be described, because the Floquet method has not been used and
accurate lineshape calculations were not carried out.
The Hamiltonian for two homonuclear dipole-coupled, chemically-shifted
spins I and S is given by:
where the first two terms are the individual Zeeman terms which are proportional to
the resonance frequencies, a)i(t) and ©s(t), and the dipolar prefactors ©A(t ) and QB(t)
can be expressed in terms of the dipolar Fourier components. The flip-flop term
renders the dipolar interaction homogeneous and spin rates substantially greater than
the dipolar interaction are required to average the interaction to zero. For weak
couplings this is often the case, and contributions from the flip-flop term can be

Chapter 6 M L
ignored because it is not energy conserving. Hence, the dipolar interaction reduces to that of the heteronuclear case which involves only the bilinear term. However, when a multiple of the spin rate equals the frequency difference between the two isotropic shifts, i.e. ncDR=Ac)iso, for the spins under consideration, then the energy mismatch for the flip-flop component is compensated for by an effective absorption of a quantum of energy from the spinning perturbation. This reintroduces the homogeneous nature of the dipolar Hamiltonian and a powder pattern is observed for the isotropic shifts (and corresponding sidebands). The magnitude of the powder pattern is dependent upon the Fourier component ©bCOj which under rotational resonance drives the transfer of coherence between the two states connected by the flip-flop component of the dipolar Hamiltonian. This component can be obtained by comparison of the equation for a time-dependant dipolar interaction determined by Munowitz and Griffin.
© g{t) = © ^^Gy co5^© jft + G2 cos^2(a gt + 2^^^
Gj =^sm2e„sm2^ij
where. 3 G2 = -^sm'Q^sm'^ij
9m is the angle of the rotor axis with respect to the magnetic field and is the angle
which the dipole axis makes with the rotor axis.
Gi and G2 are relevant for the cases for n=l and n=2 rotational resonance
respectively. Hence, for n=l rotational resonance the maximum dipolar splitting
possible is (assuming that 0^ is the magic-angle):
SJ^=2TID'G, =(l/V2)27tD'

Chapter 6 142.
Challoner*^ derived this maximum splitting and it was observed in his analysis of a linear diazomium cation. Using the same assumptions for DR278, which are not perfectly valid, gives an upper estimate of the coupling constant, and thus the lower N=N bond length. The ^^N spectrum for polymorph A of doubly-labelled DR278 exibits a splitting at the n=l rotational resonance condition for the 121 ppm and 44 ppm resonances, corresponding to a spin rate of 2330 Hz as shown in Figure 7. An experimental splitting of -200 Hz was observed by averaging the splittings from several sidebands in the spectrum. Hence, the effective
dipolar coupling constant D ' was found to be 566 Hz corresponding to a bond length
of 1.3 A which is in line with the results obtained from the single crystal X-ray study
(1.25 A). This value should be considered speculative at best, but a full lineshape
calculation is underway and wil l produce reasonably accurate results. However, the
accuracy wil l not be as high as in the paper by Challoner'*^ due to the poor spectral
resolution so other techniques may have to be attempted. The presence of molecular
exchange wil l also complicate the issue quite considerably and conversion to
polymorph C would produce significantly better results, due to the absence of
molecular motion and also the reduced linewidth of the resonances.

Chapter 6 143
-| 1 1 r — I 1 1 1 1 i 1 i 1
100 80 60 40 20 140 120 5 / ppm
V5,
Figure 7
'N CP/MAS spectrum ofDR278form A at the n=l rotational
resonance condition and 30.3 MHz. A spin rate of2330 Hz was used
whuch matches the 121 and 44 ppm resonances. * indicates a spinning
sidebandfrom the 60 ppm resonance.
For systems which have even poorer spectral resolution and/ or smaller
dipole coupling constants the lineshape calculation technique becomes a highly
inaccurate method of extracting bond lengths. A far more accurate method for these
systems is analogous to the chemical exchange driven selective polarisation
inversion experiment discussed in Chapter 4. This experiment involves the transfer
of coherence order from one spin to the other, which it is directly coupled to, under
conditions of rotational resonance. Polarisation transfer between the two spins
results in a dephasing of the individual spin intensities, and the difference signal is
oscillatory in nature. The exact time dependence of the difference magnetisation
under R^ conditions is determined by a number of parameters: the homonuclear
dipolar coupling constant (D'), the principal values of the I and S shift tensors, the

Chapter 6 144.
relative orientations of the shift and dipolar tensors and the zero-quantum relaxation time(T2^'5).
The ^^N CP/ MAS spectrum of the monohydrate calcium salt of the pigment
l-(2-sulpho-4-methylphenylazo)-2-hydroxynaphthalene-3-carboxylic acid (CI PR
57:1), (II), shows a rather broad lineshape, with a linewidth of over 200 Hz.
Consequently, determination of an -60 Hz splitting would be impossible, negating
the use of lineshape calculations.
SO3H
n
The magnetistion transfer pulse sequence shown below was used to obtain
the difference magnetisation curves. The hard nil pulse places this magnetisation
along the z-axis. The polarisation inversion, in this case, is created via a weak
selective pulse. A hard read pulse is finally applied after a variable mixing time,
Tnux> which allows for the transfer of coherence between the two spins. The
difference magnetisation is plotted as a function of the mixing time in Figure 8. As
expected from theory a damped oscillation is observed.

Chapter 6 145
The equation for the time evolution of the difference magnetisation is given in
the paper by Levitt,'**' and for the case given here it was found to be (equation 86 in
ref.40):
{I^-S^)(t) = e-^^"cos^^5)^^^
where r = (7/Q)"'and4")is the resonant fourier component
Decouphng
15N
7t/2 71/2
Inversion
T . nux
Magnetisation transfer sequence used to obtain the difference signal.

Chapter 6
17
16
15
14
13
12
11
10
B ®
B
10 20 30
mix / ms
Figure 8
Experimental magnetisation exchange curve for doubly labelled PR 57:1
at the n=l rotational resonance condition. The data were recorded at
30.4 MHz with a spin rate of 5.13 kHz. The spectra were acquired with
1200 transients per point, a contact time of 10 ms, a 200 |xs inversion
pulse, a recycle delay of 2 s. 40 data points were obtained.

Chapter 6 147
References.
1 G.C. Levy and R. L. Lichter, '^^N NMR Spectroscopy', Wiley Interscience,
New York, (1979).
2 G.J. Martin, M.L. Martin and J. P. Gouesnard, NMR Basic Principles Prog, 18,
341, (1981).
3 J. Mason, 'Nitrogen NMR', in 'Encyclopedia of Nuclear Magnetic Resonance',
eds D. M . Grant and R .K. Harris, Wiley, London, (1996).
4 M . Witanowski and G.A. Webb (eds), 'Nitrogen NMR', Plenum Press, London,
(1973).
5 J. Mason, in 'Multiuclear NMR', ed J. Mason, Plenum Press, New York,
Chap. 12, 335-367, (1987).
6 R. Tycko, P. L. Stewart and S. J. Opella, J. Am. Chem. Soc, 108, 5419-5424,
(1986).
7 R. Tycko and S. J. Opella, J. Am. Chem. Soc, 108, 3531-3532, (1986).
8 I . Mills, T. Cvitas, K. Homann, N . Kally and K. Kuchitsu, 'Quantities, Units and
Symbols in Physical Chemistry', Blackwell (for lUPAC), Oxford, 98-104,
(1993).
9 N.F. Ramsey, Phys. Rev., 77, 567, (1950); 78, 699-703, (1950); 83, 540-541,
(1951); 86, 243-246, (1952)
10 J. Kroner, W. Schneid, N. Wiberg, B. Wrackmeyer and G. Ziegleder, J. Chem.
Soc. Faraday Trans. 2., 74, 1909-1919, (1974).
11 J. Facelli and D. M . Grant, Theor. Chim. Acta., 71, 277, (1987).
12 M . Witanowski, Z. Biedrzycka, W. Sicinska, Z. Grabowski, G. A. Webb,/.
Magn. Reson., 120, 148, (1996)
13 J. C. Facelli, R. J. Pugmuire and D. M. Grant, Am. Chem. Soc, 118, 23, 5488-
5489, (1996).

Chapter 6 148.
14 K. L. Anderson-Altmann, C. G. Phung, S. Mavromoustakos, Z. Zheng, J. C. Facelli, C. D. Poulter and D M. Grant, J Phys. Chem., 99, 10454, (1995).
15 S. G. Kukolich, J. Am. Chem. Sac, 97, 5704, (1975).
16 J. Raymonda and W. Klemperer, J. Chem. Phys., 55, 232, (1971).
17 R. E. Wasylishen, W. P. Power, G. H. Penner and R. D. Curtis, Can. J. Chem.,
67, 1219, (1989).
18 J. O. Freidrich and R. E. Wasylishen, J. Chem. Phys., 83, 3707, (1985).
19 L. Delmotte, M . Soulard and H. Kessler, Chem. Lett, 1215, (1990).
20 D. Schweitzer and H. W. Speiss, J. Magn. Reson., 15, 529, (1974).
21 D. G. Powell and L. J. Mathias, J. Am. Chem. Soc, 112, 669, (1990).
22 M . Sardashti and G. E. Maciel, J. Phys. Chem., 92, 4620, (1988).
23 J. Z. Hu, B. Yang, L. L i , J. Qui, C. Ye, R. J. Pugmuire, M. S. Solum, R. Wind
and D. M . Grant, Solid State NMR, submitted for publication.
24 D. W. Aldermann, M . S. Solum and D.M. Grant, Chem. Phys., 84, 3717,
(1986).
25 J. Herzfeld and A. Berger, J. Chem. Phys., 73, 6021, (1980).
26 R. D. Curtis, J. W. Hilbom, G. Wu, M . D. Lumsden, R. E. Wasylishen and J. A.
Pincork, J. Phys. Chem., 97, 1856, (1993).
27 T. G. Oas, C. J. Hartzell, T. J. McMahon, G. P. Drobny and F. W. Dahlquist,
J. Am. Chem. Soc, 109, 5956, (1987).
28 T. G. Oas, C. J. Hartzell, G. P. Drobny and F. W. Dahlquist, Am. Chem. Soc,
109, 5962, (1987).
29 C. J. Hartzell, M . Whitfield, T. G. Oas and G. P. Drobny, J. Am. Chem. Sac,
109, 5966, (1987).
30 K. W. Zilm and D. M . Grant, Am. Chem. Soc, 103, 2913, (1981).
31 J. Mason, Solid State NMR, 2, 285, (1993).

Chapter 6 149.
32 a. L. H. M e r w i n , 7 7 ? e 5 M , University of Durham, (1987).
b. H. Bai, PhD Thesis, University of Durham, (1991).
33 R. D. Curtis, W. P. Power, G. H. Penner and R. E. Wasylishen, / . Phys. Chem.,
94, 4000, (1990).
34 a. R. E. Wasylishen, G. H. Penner, W. P. Power and R. D. Curtis, J. Am .Chem.
Soc, 111, 6082, (1989).
b J. Mason, D. M . Mingas, J. Schaefer, D. Sherman and E. O. J. Stejskal, J.
Chem. Soc. Chem. Com., 444, (1985).
c. P. A. Duffin, L. F. Lankworthy, J. Mason, A. N. Stephens and R. M.
Thompson, Inorg. Chem., 26, 2034, (1987).
35 M . G. Munowitz and R. G. Griffin, J. Chem. Phys., 76, 2848, (1982).
36 J. M. Griffiths and R. G. Griffin, Anal Chimica Acta., 283, 1081-1101, (1993).
37 A. E. Bennet, R. G. Griffin and S. Vega, NMR Basic Principles Prog, 33, 1-77,
(1994).
38 R. R. Ernst, G. Bodenhausen and A. Wokaun, pp 516, 'Principles of Nuclear
Magnetic Resonance in One and Two Dimensions.', Clarendon Press, Oxford,
1991.
39 a. R. Tycko and G. Dabbagh, Chem. Phys. Lett., 173, 461, (1990).
b. A. E. Bennet, J. H. Ok, S. J. Vega and R. G. Griffin, J. Chem. Phys., 96,
8634, (1992).
c. T. Gullion and J. Schaefer, / . Magn. Reson., 81, 196, (1989).
d. T. Gullion and S. Vega, Chem. Phys. Lett., 194, 423, (1992).
40 M . H. Levitt, D. P. Raleigh, F. Creuzet and R. G. Griffin, J. Chem. Phys., 92,
6347, (1990).
41 A. Schmidt and S. Vega, J. Chem. Phys., 96, 2655, (1992).
42 A. Kubo and C. A. McDowell, Chem. Phys., 93, 7156, (1990).
43 R. Challoner and R. K. Harris, Chem. Phys. Lett., 228, 589, (1994).

Chapter 7 150
7. Magic-Angle Ilirning Spectroscopy.
7.1 Introduction.
In the previous chapter it was shown that knowledge of the principal
components of the shift tensor can provide useful structural information. However,
increasing the number of overlapping powder patterns in a static spectrum, or
spinning sideband manifolds in a MAS spectrum, can significantly increase the
complexity of the observed spectrum. The spectral congestion that arises renders it
virtually impossible to accurately determine the shift tensor components for such
systems.
Several ingenious techniques have been developed to allow the determination
of the anisotropic shielding components for multiple sites. These include magic-angle
hopping,^ stop-and-go,^ spin-lock rotational resonance, and rotor-synchronised
multiple pulse trains.'* One additional class of experiment is based on the magic-angle
turning (MAT) technique introduced by Gan, where the sample is slowly rotated, and
a multiple-pulse sequence is applied during the evolution period within a two-
dimensional pulse sequence. Several modifications of the MAT sequence have been
developed by Hu et al.^' to improve the signal-to-noise ratio and other spectral
features. For a review of these techniques, including the previously mentioned
alternatives the reader is directed to articles by Orendt, Hu' and Speiss

Chapter 7 151
7.2 Theory of MAT.
It was realised by Bax et aU' that if during the evolution time the sample was
placed successively, "hopped", at 120° intervals about the magic-angle axis then it
was possible to obtain the pure isotropic shift. This is a result of the fact that in the
molecular frame the static field is rotated by 90°, and the average of three orthogonal
orientations is simply the trace of the tensor. The magic-angle hopping (MAH)
experiment provides good results, but it cannot be used on commercial systems. This
problem was solved by Gan, who subtly modified the technique to involve slow
continuous rotation of the sample, along with suitable pulse timing during the
evolution period of the sequence, such that the magnetisation was stored at one third
fractions of the rotor period (same sequence as MAH). The spin-rate is sufficiently
slow such that a pseudo-static powder pattern is obtained. A distinct advantage of
MAT is that it can be carried out on standard commercial probes, unlike the MAH
experiment.
The prototype MAT sequence is given in Figure 1. The initial X channel
magnetisation is created via a standard CP preparation sequence. This point in the
sequence can be considered to be t=0. Following this the magnetisation is allowed to
precess through an angle during a time ti /3. A component of this magnetisation
is stored in the z direction for a fixed period by a projection pulse pi, and then
returned to the transverse plane at t=T/3 by the read pulse r i . Free precession then
occurs again for ti 13, with the magnetisation acquiring a phase angle of 4>2, before
being projected back along the z axis by pulse pz. At t=2T/3 this process is repeated
such that a phase angle of is acquired by the magnetisation, which is then stored

Chapter 7 152
along the Z- axis. The final magnetisation is then returned to the transverse plane and
the spectrum is recorded.
t/3
3>,
Pi
t/3 t/3
acqtj
T/3
P2 [2 P3
2T/3
Figure 1
Pulse sequence for the prototype MAT. Narrow rectangles represent 9(f
pulses and the magnetisation is stored along the longitudinal axis as
indicated by L. T is the rotor period.
The acquired phase angles O/, $ 2 and <i>3 can be written as time integrals of
the time-dependent angular frequency a)(7(t)), which is a ftinction of the rotor
position Y(t). Thus
0,=\l^^'Qir{t))dt
= \Y/,-^'^'airmt = \'/'oir{t^T/3))dt
= \ll',l-^'^'oirmt = \'foir{t^2T/3))dt
(1)
The sum of these precession angles is the sum of the integrals
0j^02+^s= \'/^Qiy{t))dt+ \l'^^oir{t+T/3))dt+ l'o'''o){r{t + 2T/3))dt

Chapter 7 153
and combining these integrals gives
0j +02 +^3= i'^^[Gir^t)) + coirit + T/3)) + 0){y{t + 21/3))]dt
Because the static field is aligned along 3 mutually perpendicular orientations, for
each component within the integral, then the expression simplifies to
0j +02 +^3 = V'3(0i,,dt = CO^Ji
To obtain an amplitude modulation of the FIDs by cos(4)/+<I)2+<I>3) and
sin(^>/+^)2+03) one must phase-cycle the projection pulses p i , p2 and p3 according to
the triple-angle formulas
and
lias
cos(<2>; -f-<^2 = cos(< ;)cos(<Z>2)cos(<Z>5)
- sin(<?;) sin(<Z>2) cos(^3)
- sin(<l>,) cos(<?2) sin(0^)
- cos(<?;) sin(<^2) sin(<^5)
sin(<2>; +02+^3) = sin(<^;)cos(<p2)cos(<?5)
- I - cos(<P,) sin(<2>2) cos(<Pj)
- I - cos(< ;) cos(<2>2) sin(<Z>j)
- sin(<^;) sin(<2>2) sin(<2> )
(2)
(3)
Thus, a 2D amplitude-modulated hypercomplex FID F(ti,t2) is obtained.
Since the rotation ft'equency of the sample is ~30 Hz then the t i dimension yields a
pseudo-static powder spectrum, while ti yields the isotropic spectrum, free of
spinning sidebands only, upon Fourier transformation. Additionally, since the rotation
frequency is slow, in comparison to dipolar couplings, then weak scalar dipolar
couplings are not removed from the anisotropic dimension.

Chapter 7 154
In this prototype MAT experiment the transverse magnetisation is stored
along the longitudinal axis three times, with each projection losing a portion of the
magnetisation, which significantly reduces the signal-to-noise ratio. This is a real
drawback since it is a low-sensitivity experiment due to the observation of broad
lines. By applying only two projection pulses then there would be a significant
increase in signal-to-noise. Two such techniques have been developed which address
this issue- triple-echo MAT^' and PHase cORected MAT (PHORMAT). The
method of choice used here is the PHORMAT technique given by the two sequences
given in Figure 2.
3C +
a,
X 1 ti/3
a:
t /3 t/3
^ 3 acqt^
t,/3 i T
Pi P2
or a,
1/3
a.
t /3
0); PI
1 ^
a. acqtj
Pi ti t2 b3
2T/3 0 T/3
Figure 2
Pulse sequences for the PHORMAT experiment. 90° pulses are
represented by narrow rectangles, and two adjacent rectangles denote a
180° pulse. The magnetisation is stored along the Z-axis during the
periods labelled L, and it precesses in the transverse plane at all other
times.

Chapter 7 155
It is impossible to obtain an amplitude modulation, while retaining the pure absorbtion-absorbtion lineshape desired with quadrature detection of the evolution dimension, using only one sequence as in the prototype sequence. Phase cycling of the two projection pulses pi and p2 in the + pulse sequence yields an ampUtude
modulation of the FID by the cosines and sines of the phase angles ( -« ; -¥ Pj +0j
and {-a2 + 2 + ^ 2 )• However, during the final third of the evolution period the
FED is phase modulated by the phase angle {-a^ + 0^+^^). The evolution of the ti
dimension occurs after the 180° refocusing pulse during the O components. The four
individual FIDs for the + sequence are thus
F:=cos(-at + pt +0t)cos(-at + +<?;)e^[/(-a; + pt + < ^ 5 " ) ] ^ ( ^ 2 )
F,: = co5(-a; + Pt +0t)sin(-at + Pt +C>t)exp\i(-oct + Pt +^t)]F(t2)
Ft, =sin(-at + Pt +0t)cos{-at + Pt +0t)Mi-^s + Pt ^ ^ t p i t i )
F: =sin(-at + Pt +0t)sin{-at + Pt +0t)exp[i(-at + Pt +<i>5^)]F(fJ
Combination of these FIDs as follows gives the signal-averaged FID I*
= F" - + iF^ + iF*
where multipUcation by i means a 90° phase shift of the acquisition FID. Addition of
the individual FIDs results in the following simplified equation
F* ={cos(o)^Jj) + isin{co^Jj)}F(t2) (4)
By allowing the evolution to occur prior to the 180° refocusing pulse, which
is equivalent to a time reversal of the chemical shift evolution, a similar series of FIDs
can be written for the - pulse sequence shown in Figure 2.

Chapter 7 156
F- = cos(+aJ - Pi -0i)cos{+a2 - P2 -^2)exp[i{+as - -<^5")]^(^2) F-=cos[-¥aJ - PJ -0f)sin{+a2 - P2 -^2)expli{+(xJ - Pi-^3~)]F{h) f - =sin{+ai - pf -0f)cos{+a2 - P2 -<2>2")e^[/(+a; - Pi -0i)]F(t2) F-=sin{+aJ - PJ -0f)sin(+a2 - P2 -<^2 " )^^K+«f " /^i -<^5")]^(^2)
Application of the same combination of these FBDs gives the signal-averaged FID F
F-=F--F-+iF-+iF-
which simplifies to
F- ={co^cOi,Jj)-ism(co^jj)}F{t2) (5)
The F^ and F" FlDs can be combined to form the real and imaginary components of a
hypercomplex 2D FID and Fi
F,=+^(F^ + F-) = coiQ)^Jj)F{t2)
F,=-i{F^-F-) = sm(cD^Jj)F(t2)
The final 2D hypercomplex FID is simply written, using j=V-l as a second
imaginary unit, as
F = + jFj = cxp(jco^jj)F(t2) (6)
With this minimum phase cycle of four for each sequence artifacts can occur
from several sources. Hu et al. have used a phase cycle of 32 which significantly
improves the quality of the resultant spectra. The pulse sequences and acquisition
macros, as written for a Chemagnetics CMX H, are shown in the appendix. These
sequences were written by members of Grant's research group at the University of
Utah. The manipulation of the + and - datasets can be carried out directly on the

Chapter 7 157
CMX spectrometer using the Spinsight software. The program to carry out this manipulation is also given in the appendix.
7.3 ApDlication of " C and " N P H O R M A T to Dves and Pigments.
7.3.1 CI-PV19: Y Linear-/ra/is-9uinacridone.
Lmear-?ran5-quinacridone, I , is a pigment (a colourant which is insoluble in
the medium in which it is appUed to the substrate) used in the motor industry as a car
paint. The Colour Index name is Pigment Violet 19 (PV19), and it exists in three
crystal modifications a, P and y with each having different colours, ranging fi-om
violet to deep purple. The presence of an inversion centre impUes that, if inter-
molecular interactions are negUgible, only half of the signals will be observed. This is
experimentally observed in the soUds, but the resolution of the spectra is rather poor,
which may suggest that a small deviation from centrosymmetry is present.
H
(I)
This sample is amenable to the PHORMAT technique due to the fact that the
isotropic shifts cover only a short range, -80 ppm, which requires an increase in the
dwell time in the second-dimension, thus reducing the experimental time needed to
obtain suitable resolution in the indirectly detected dimension. This one fact is the
single most important point in the PHORMAT experiment. Figure 3 shows the

Chapter 7 158
comparison between the isotropic * C shift spectra as obtained by a normal CP/ MAS
sequence, and by summation over the isotropic dimension in a PHORMAT
experiment. This clearly shows that the isotropic spectrum can be faithfully recreated
in the PHORMAT experiment, with obvious degradation of the resolution. Figure 4
shows the contour plot for the ' C PHORMAT experiment obtained at 100.6 MHz.
Extraction of the individual slices through the evolution dimension allows one to
separate out the individual powder patterns according to isotropic shifts, as shown in
Figure 5.
- 1 — I — I — I — 1 — I — I — I — 1 -
180 170 160 150 140 130 120 110 100
5ci3 / PPin
Figure 3
'^C spectra ofPV19 y obtained by a/a normal CP/MAS sequence and
b/a summation over the slices in the indirectly detected (isotropic)
dimension in a PHORMAT experiment. * Indicate sidebands.

Chapter 7
O"
o
in n-ri
o in-
m H
' I t "
I I I I I M I I I I I I I I I I I I I M I I I I I I I I I I I I
250 200 150 100 50 0 - 50
Figure 4
Contour plot of the '^C PHORMAT spectrum ofPVlPy. A spectral
width of 80 kHz was used in the t2 dimension and 12.5 kHz in the t,
dimension. 100 points were obtained in the evolution dimension to
produce a digital resolution of 120 Hz. 100 Hz Gaussian line
broadening was applied to both dimensions. The lowest contour level is
10% of the maximum peak height.

Chapter 7
4 5 0 3 5 0 2 5 0 1 5 0 5 0 - 5 0 - 1 5 0 - 2 5 0
6 / ppm
Figure 5
Slices taken through the PHORMAT spectrum as shown in Figure 4 to
give the individual powder patterns.

Chapter 7 161
Table 1 shows both the chemical shift assignment of ' C resonances for PV19
Y and their corresponding principal components of the shift tensor. The shift
components were obtained by fitting the individual sHces independently using the
program outhned earUer. The sUce at 118 ppm is a superposition of three peaks and
it would be possible to fit the Uneshape to several lines. However, in the present case
it was fitted to one powder pattern for the sake of simplicity. All of the fitted
isotropic shifts are within 5 ppm of the actual values as obtained from the isotropic
dimension in the PHORMAT experiment, which shows that the quality of the fitting is
rather good.
6n 522 533 5iso(fit) 6iso(actual)
CI 223 149 -6 122 125.4
C2,4,13a 181 166 -1 115 118.0
C3 223 156 8 129 132.5
C4a 215 164 8 129 133.4
C5a 224 179 13 139 141.2
C14a . 199 164 -2 121 122.9
C13 194 139 4 112 112.8
C14 244 214 61 173 176.6
Table 1
Principal components of the shift tensor for PVI9 yas obtained by fitting
the slices from the PHORMAT data as shown in Figure 5.
Values are given in ppm relative to TMS.

Chapter 7 162
7.3.2 D R 2 7 8 V I
It was hoped that it would be possible to acquire a good quaUty PHORMAT
spectrum from this polymorph of DR278, since it has a significantly shorter Ti
relaxation time in comparison to the other two polymorphs. The presence of both
aromatics and aUphatics requires a large spectral width in the evolution dimension,
and to resolve the aromatic signals sufficiently requires a high number of points to be
collected in the second dimension. Truncation of the FID in the second dimension
produces Gibbs wiggles which interfere in such a manner that the isotropic lines may
be obscured.
In the static ^ C spectrum. Figure 6a, one can see two distinct spectral
features. These arise from the ahphatic and aromatic signals. However, due to the
complexity of the spectral features it is impossible to obtain the principal components
of the ' C shift tensor. Thus, it would seem a suitable candidate for appUcation of the
PHORMAT sequence. The ^ C PHORMAT spectrum for DR278 VI is shown as a
contour plot in Figure 6b. The narrow SA of the aUphatic signals produces suitably
strong intensities in that region, but the aromatic ^ C resonances, having significantly
larger SA, show up as much weaker signals. The combination of Gibbs wiggles in the
indirectly detected dimension and low signal intensity produces rather poor-quaUty
results in the aromatic region as seen inFigure 6b.

Chapter 7
79.37 t
lOOH
200-
236.8
10 • oOoo<>c£5oij::» oo
100 300 200 100 0 -51.46
Figure 6
'C spectra ofDR278 VI recorded at 100.6 MHz. a/ is the static
spectrum reorded with a Hahn-echo sequence and b/ is a contour plot of
the PHORMAT experiment.
IS,

Chapter 7 164
7.3.3 CI Pigment Red 57:1
In Chapter 5 the azo and hydrazone ^ N shift tensors were analysed for the
phenylazophenol derivatives. With this work as a starting point it was decided to try
to understand the equihbrium conformation of the monohydrate calcium salt of the
pigment l-(2-sulpho-4-methylphenylazo)-2-hydroxynaphthalene-3-carboxyUc acid (CI
PR 57:1), I I . A doubly *^N-enriched sample was synthesised by Jonsen who
suggested that the equiUbrium position favoured the hydrazo tautomer, as drawn.'
SO3H
n
The two ^ N powder patterns overlap at -Oppm making it difficult to
determine the low-frequency component af the N=C signal, and high-frequency
component of the N-H signal. AppUcation of the PHORMAT sequence is shown in
Figure 7 as a contour plot. The low signal-to-noise ratio, and the fact that the dipolar
coupling only sUghtly perturbs the spectral structure makes it vahd to fit the individual
sUces by considering the shielding tensor only. The results of this fitting are shown in
Table 2. Comparison of the N=C principal components with those given in Table 5 in
Ch.6 for the acid samples confirms that PR 57:1 is indeed present as the hydrazo
tautomer. Due to lack of investigations that have been carried out on the shift tensors
of these systems the exact equilibrium constant for the azo/ hydrazone tautomerism
cannot be obtained.

81, 622 S33 5iso (fit) 5iso (actual)
N-H -6 -189 -318 -171 -169.4
N=C 339 3 -347 -2 -1.2
Table 2
Principal components of the '^N shift tensor for PR 57: J. Values are
given in ppm relative to the signal for CH3NO2.
-236.9
^4
-200A
-lOoH
100-1
130.4
•J I ^ ' ' 1 . ( ' ' '
' * 11,1 \ • ^
, 1 . . ^ V ' V , , I I . I
,1 1 >
'1 I '1
I 0
- t -
1000 0 P P M
-1000
Figure 7
'^N PHORMAT spectrum of PR 57:1 as represented by a contour plot.

Chapter 7 166
Conclusions.
For multiple spin systems where one-dimensional techniques negate the
determination of the principal components of the shift tensor, PHORMAT has proven
to be a useful, yet time-consuming, technique for separating out the individual
powder patterns. The sequence can be modified quite simply by including a dipolar
dephasing window during the evolution period (to select quaternary signals), and also
to extend to three dimensions. Future applications wiU no doubt concentrate on high-
sensitivity nuclei which will reduce the acquisition time to more manageable values,
with P and ^ F being obvious examples.
Acknowledgements.
I would Uke to thank Professor D. M. Grant at the University of Utah for the
invitation to carry out the PHORMAT experiments within his lab. I am extremely
grateful to Dr. M. S. Solum for teaching me how to use the PHORMAT experiment
and also for the kind use of his fitting routine for the static Uneshape calculations.
Thanks are also due to Dr. P. Jonsen for synthesising the PR57:1 pigment.

Chapter 7 167
References
1 N. M. Szeverenyi, A. Bax and G. E. Maciel,/. Magn. Reson., 51,400, (1983).
2 R. C. Zeigler, R. A. Wind and G. E. Maciel, J. Magn. Reson., 79, 299-306,
(1988).
3 Z. Gan, D. M. Grant and R.R. Ernst, Chem. Phys. Lett., 254,349, (1996).
4 R. Tycko, G. Dabbagh and P. A. Mirau, J. Magn. Reson., 85, 265-274, (1989).
5 Z. Gan, J. Am. Chem. Soc., 114, 8307, (1992).
6 J. Z. Hu, A. M. Orendt, D. W. Alderman, R. J. Pugmuire, C. Ye and D. M.
Grant, Solid State Nucl. Magn. Reson., X 181, (1994).
7 J. Z. Hu, W. Wang and R. J. Pugmuire, 'Magic Angle Turning and Hopping', in
'Enyclopedia of Nuclear Magnetic Resonance', eds D. M. Grant and R. K.
Harris, Wiley, London, (1996).
8 A. Orendt, 'Chemcal Shift Tensor Determination', in 'Enyclopedia of Nuclear
Magnetic Resonance', eds D. M. Grant and R. K. Harris, Wiley, London, (1996).
9 J. Z. Hu, W. Wang, F. Lui, M. S. Solum, D. W. Alderman, R. J. Pugmuire and D.
M. Grant, J. Magn. Reson., 113, 210-222, (1995).
10 K. Schmidt-Rohr and H. W. Spiess, Multidimensional SoUd-State NMR and
Polymers, Ch. 6, Academic Press, London, (1994).
11 N. M. Szeverenyi, A. Bax and G. E. Maciel, J. Magn. Reson., 52, 147-152,
(1983).
12 W. Wang, J. Z. Hu, D. W. Alderman, R. J. Pugmuire and D. M. Grant, Solid
State Nucl. Magn. Reson., 5, 257, (1995).
13 P. Jonsen, PhD. Thesis, University of East AngUa, (1984).

Appendix 168
Appendix.
Index of the Appendix.
Research Conducted Outside the Department 169
Publications 170
Papers Presented and Conferences Attended 170
Colloquia, Lectures and Seminars fi"om Invited Speakers 172
PHORMAT Pulse Sequences 180
PHORMAT Acqpars Files 184
PHORMAT Acquisition Macro 185
PHORMAT Processing Macro 186
Acquisition Parameters for the PHORMAT Spectra Discussed in Chapter 7 188

Appendix 169.
Research Conducted Outside the Department.
Several short visits to Zeneca Specialties Research Centre, extending over all
three years, were carried out to fulfil conditions set out in the CASE award scheme.
During these industrial placements a diverse range of goals was achieved, which
included synthesis of ' N-enriched azobenzene dyestuffs, molecular modelling of
motion and dyeing of polyester fibres.
During the final year (1996) a three-month visit to the University of Utah was
undertaken in which it was possible to learn about the new PHORMAT experiment
discussed in Chapter 7, and also to take advantage of the various field capabilities
that exist in Utah. This was made possible by fimds supplied from both EPSRC and
Prof. D. M. Grant (within whose laboratory I was working).

Appendix LZO_
Publications.
1. Solution- and Solid-State Proton Transfer from Phenols to Triphenylphosphine
Oxide Studied by ^H, ' C and ^ P NMR Spectroscpopy,
C. M. Lagier, U. Scheler, G. McGeorge, M. G. Sierra, A. C. Olivier and R. K.
Harris, J. Chem. Soc. Perkin Trans II, 1325, (1996).
2. G. McGeorge, R. K. Harris, A. M. Chippendale and J. F. Bullock,
Conformational Analysis by Magic-Angle Spinning NMR specfroscopy for a
Series of Polymorphs of a Disperse Azobenzene DyestufF,
J. Chem. Soc. Perkin Trans II, 1733, (1996).
[Note: This work is not described in the present thesis.]
Papers Presented and Conferences Attended.
Oral Presentations.
A Solid-State NMR Analysis of an Azobenzene Dyestuff,
Durham University Final Year Graduate Colloquia, May 1996.
N-15 as a Useful Probe to Understanding the Molecular Structures of Dyes,
University of Utah, Informal Seminar, January 1996.
Investigation of Dynamic Processes in the Solid State by NMR,
Zeneca Specialties, Coordination/ Colour CASE Conference, Delph, 31st May, 1995.

Appendix 121
Poster Presentations.
Structviral Investigations of an Azobenzene Dye by C-13 and N-15 Solid-State NMR,
G. McGeorge, R. K. Harris, A. M. Chippendale and J. F. Bullock,
37th Experimental Nuclear Magnetic Resonance Conference, Asilomar Conference
Center, California, USA, March 1996.
Understanding Solid-State Structures Without Crystallography,
G. McGeorge, R. K. Harris, A. M. Chippendale and J. F. Bullock,
ICI Sponsored Poster Competition, University of Durham, December, 1995.
* Structural Investigations of an Azobenzene Dye by C-13 and N-15 Solid-State
NMR, G. McGeorge, R. K. Harris, A. M. Chippendale and J. F. Bullock,
ISMAR, Sydney, July, 1996.
Structural Investigations by Solid-State NMR of Dyes,
G. McGeorge, R. K. Harris and A. M. Chippendale.
Royal Society of Chemistry's 12th International Meeting on NMR Spectrocsopy,
UMIST, Manchester, July, 1995.
* Presented by Prof R. K. Harris.

Appendix 172
CoUoquia. Lectures and Seminars from Invited Speakers
1993 - 1996 (August 1 - July 31)
1993.
September 13 *Prof. Dr. A.D. Schliiter, Freie Universitat Berlin, Germany
Synthesis and Characterisation of Molecular Rods and Ribbons
September 13 *Dr. K.J. Wynne, Office of Naval Research, Washington, USA
Polymer Surface Design for Minimal Adhesion
September 14 *Prof J.M. DeSimone, University of North Carolina, Chapel Hill,
USA
Homogeneous and Heterogeneous Polymerisations in
Environmentally Responsible Carbon Dioxide
September 28 Prof H. Ila, North Eastern Hill University, India
Synthetic Strategies for Cyclopentanoids via Oxoketene Dithioacetals
October 4 *Prof F.J. Feher, University of California, Irvine, USA
Bridging the Gap between Surfaces and Solution with Sessilquioxanes
October 14 Dr. P. Hubberstey, University of Nottingham
Alkali Metals: Alchemist's Nightmare, Biochemist's Puzzle and
Technologist's Dream
October 20 *Dr. P. Quayle, University of Manchester
Aspects of Aqueous ROMP Chemistry
October 21 Prof R. Adams, University of South Carolma, USA
Chemistry of Metal Carbonyl Cluster Complexes : Development of
Cluster Based Alkyne Hydrogenation Catalysts

Appendix 113.
October 27 *Dr. R.A.L. Jones, Cavendish Laboratory, Cambridge Perambulating Polymers
November 10 *Prof. M.N.R. Ashfold, University of Bristol
High Resolution Photofragment Translational Spectroscopy : A New
Way to Watch Photodissociation
November 17 *Dr. A. Parker, Rutherford Appleton Laboratory, Didcot
Applications of Time Resolved Resonance Raman Spectroscopy to
Chemical and Biochemical Problems
November 24 Dr. P.G. Bruce, University of St. Andrews
Structure and Properties of Inorganic Solids and Polymers
November 25 *Dr. R.P. Wayne, University of Oxford
The Origin and Evolution of the Atmosphere
December 1 Prof M.A. McKervey, Queen's University, Belfast
Synthesis and Applications of Chemically Modified Calixarenes
December 8 Prof O. Meth-Cohn, University of Sunderland
Friedel's Folly Revisited - A Super Way to Fused Pyridines
December 16 Prof. R.F. Hudson, University of Kent
Close Encounters of the Second Kind

Appendix
1994
January 26 *Prof. J. Evans, University of Southampton
Shining Light on Catalysts
February 2 *Dr. A. Masters, University of Manchester
Modelling Water Without Using Pair Potentials
February 9 Prof D. Young, University of Sussex
Chemical and Biological Studies on the Coenzyme Tetrahydrofolic
Acid
February 16 Prof K.H. Theopold, University of Delaware, USA
Paramagnetic Chromium Alkyls : Synthesis and Reactivity
February 23 Prof P.M. Maitlis, University of Sheffield
Across the Border: From Homogeneous to Heterogeneous Catalysis
March 2 *Dr. C. Hunter, University of Sheffield
Noncovalent Interactions between Aromatic Molecules
March 9 *Prof F. Wilkinson, Loughborough University of Technology
Nanosecond and Picosecond Laser Flash Photolysis
March 10 Prof S.V. Ley, University of Cambridge
New Methods for Organic Synthesis
March 25 *Dr. J. Dilworth, University of Essex
Technetium and Rhenium Compounds with Applications as Imaging
Agents
April 28 Prof R. J. Gillespie, McMaster University, Canada
The Molecular Structure of some Metal Fluorides and Oxofluorides:
Apparent Exceptions to the VSEPR Model.
May 12 *Prof D. A. Humphreys, McMaster University, Canada
Bringing Knowledge to Life

Appendix LZ5_
October 5 *Prof N. L . Owen, Brigham Young University, Utah, USA
Determining Molecular Structure - the INADEQUATE NMR way
October 19 *Prof. N. Bartlett, University of California
Some Aspects of Ag(II) and Ag(III) Chemistry
November 2 Dr P. G. Edwards, University of Wales, Cardiff
The Manipulation of Electronic and Structural Diversity in Metal
Complexes - New Ligands
November 3 Prof B. F. G. Johnson, Edinburgh University
Arene-metal Clusters
November 9 Dr G. Hogarth, University College, London
New Vistas in Metal-imido Chemistry
November 10 Dr M. Block, Zeneca Pharmaceuticals, Macclesfield
Large-scale Manufacture of ZD 1542, a Thromboxane Antagonist
Synthase Inhibitor
November 16 Prof M. Page, University of Huddersfield
Four-membered Rings and b-Lactamase
November 23 Dr J. M. J. Williams, University of Loughborough
New Approaches to Asymmetric Catalysis
December 7 *Prof D. Briggs, ICI and University of Durham
Surface Mass Spectrometry

Appendix 126.
1995
January 11 Prof P. Parsons, University of Reading
Applications of Tandem Reactions in Organic Synthesis
January 18 *Dr G. Rumbles, Imperial College, London
Real or Imaginary Third Order Non-linear Optical Materials
January 25 Dr D. A. Roberts, Zeneca Pharmaceuticals
The Design and Synthesis of Inhibitors of the Renin-angiotensin
System
February 1 *Dr T. Cosgrove, Bristol University
Polymers do it at Interfaces
February 8 *Dr D. O'Hare, Oxford University
Synthesis and Solid-state Properties of Poly-, Oligo- and Multidecker
Metallocenes
February 22 Prof E. Schaumann, University of Clausthal
Silicon- and Sulphur-mediated Ring-opening Reactions of Epoxide
March 1 Dr M. Rosseinsky, Oxford University
Fullerene Intercalation Chemistry
March 22 Dr M. Taylor, University of Auckland, New Zealand
Structural Methods in Main-group Chemistry
April 26 Dr M. Schroder, University of Edinburgh
Redox-active Macrocyclic Complexes : Rings, Stacks and Liquid
Crystals
May 4 Prof A. J. Kresge, University of Toronto
The Ingold Lecture Reactive Intermediates : Carboxylic-acid Enols
and Other Unstable Species

Appendix HL
October 11 *Prof P. Lugar, Frei Univ Beriin, FRG Low Temperature Crystallography
October 13 *Prof R. Schmultzer, Univ Braunschwieg, FRG.
Calixarene-Phosphorus Chemistry: A New Dimension in Phosphorus
Chemistry
October 18 Prof A. Alexakis, Univ. Pierre et Marie Curie, Paris,
Synthetic and Analytical Uses of Chiral Diamines
October 25 Dr.D.Martin Davies, University of Northumbria
Chemical reactions in organised systems.
November 1 Prof W. Motherwell, UCL London
New Reactions for Organic Synthesis
November 3 Dr B. Langlois, University Claude Bernard-Lyon
Radical Anionic and Psuedo Cationic Trifluoromethylation
November 8 Dr. D. Craig, Imperial College, London
New Stategies for the Assembly of Heterocyclic Systems
November 15 Dr Andrea Sella, UCL, London
Chemistry of Lanthanides with Polypyrazoylborate Ligands
November 17 Prof David Bergbreiter, Texas A&M, USA
Design of Smart Catalysts, Substrates and Surfaces from Simple
Polymers
November 22 *Prof I Soutar, Lancaster University
A Water of Glass? Luminescence Studies of Water-Soluble Polymers.
November 29 Prof Dennis Tuck, University of Windsor, Ontario, Canada
New Indium Coordination Chemistry
December 8 Professor M.T. Reetz, Max Planck Institut, Mulheim
Perkin Regional Meeting

Appendix 128.
1996
January 10 Dr Bill Henderson, Waikato University, NZ
Electrospray Mass Spectrometry - a new sporting technique
January 17 Prof J. W. Emsley , Southampton University
Liquid Crystals: More than Meets the Eye
January 24 Dr Alan Armstrong, Nottingham Univesity
Alkene Oxidation and Natural Product Synthesis
January 31 Dr J. Penfold, Rutherford Appleton Laboratory,
Soft Soap and Surfaces
February 7 Dr R.B. Moody, Exeter University
Nitrosations, Nitrations and Oxidations with Nitrous Acid
February 12 Dr Paul Pringle, University of Bristol
Catalytic Self-Replication of Phosphines on Platinum(O)
February 14 Dr J. Rohr, Univ Gottmgen, FRG
Goals and Aspects of Biosynthetic Studies on Low Molecular Weight
Natural Products
February 21 Dr C R Pulham, Univ. Edinburgh
Heavy Metal Hydrides - an exploration of the chemistry of stannanes
and plumbanes
February 28 Prof E . W. Randall, Queen Mary & Westfield College
New Perspectives in NMR Imaging
March 6 Dr Richard Whitby, Univ of Southampton
New approaches to chiral catalysts: Induction of planar and metal
centred asymmetry
March 7 Dr D.S. Wright, University of Cambridge
Synthetic Applications of Me2N-p-Block Metal Reagents

Appendix
March 12 RSC Endowed Lecture - Prof. V. Balzani, Univ of Bologna
Supramolecular Photochemistry
March 13 Prof Dave Gamer, Manchester University
Mushrooming in Chemistry
April 30 Dr L.D.Pettit, Chairman, lUPAC Commission of Equilibrium Data
pH-metric studies using very small quantities of vmcertain purity
indicates lectures attended.

Appendix
PHORMAT Pulse Sequences
/* phmatfbp.sm4 WW 941204 based on 940906 +tau2 */
.title phormat flip back plus synchronized
al pw pw 1 pw2 tm2 tau2 tau tau8 tau9 ct rd ad pd
.amode 0
.channels
.include defs.inc
.Ipct
.time aqtm=((dw*al)+lu)
DS=((tau9/3 .)-pw-1 u-ct+(pw 1/2.)) DC=(pwl/2.) DEl=(tau-(pw2/2.)) DB=(((tm2-tau2)/3.)+tau-(pw2/2.)-(pwl/2.)) DD=((tau9/3.)-tau8-(2.*tau)-((tm2-tau2)/3.)-pwI) DE=(tau-(pwl/2.)-(pw2/2.)) RD=(rd+((tm2-tau2)/3.)) AD=(ad+tau-(pw2/2.)-rd)
.amp a al a2
/* extm=(pd+pw+ct+(5*tau)+(3*pw2)+tml+(2*tau8)+(2*TAU9)+ad+rd+aqtm)*/ /•.float txduty2=((pw+ct+(5*tau)+(3*pw2)+tml+(2*TAU9)+ad+rd+aqtm)/extm)*/
.program start: Al(SEXecho)
Al(SEXprojl) A2(SEH90) Al(SEXproj2) A2(SEHfb)
loop: A1 (AT Xcp) A2(CU H90) wmm: amm: wm: am;
wz: az:
wf: af:
A2(ATHcp)
A1 (CU Xecho) A2(AT Hdec)
Al(CUXprojl)
Al(ATXread)
A1(AT Xecho)
Al(CUXproj2)
Al(ATXread) ws:
Tl(lm); Tl(lu); Tl(lu);
S2(TB) Tl(pd); S2(TB) Tl(.lu) ll(jumpxl wmm); S2(TB) Tl(.lu) II(jump xh amm); S2(TB) Tl(.lu) llGumpxlwm); S2(TB) Tl(.lu) Il(jumpxham); S2(TB) T1(DS); S2(TG) Tl(pw);
Sl(TG) S2(TG) Tl(lu); S1(TG) S2(TG)Tl(.lu) IlOumpxlwz); Sl(TG) S2(TG)Tl(.lu) Il(jumpxhaz); Sl(TG) S2(TG) T1(DC);
S2(TG) T1(DE1); Sl(TG) S2(TG) Tl(pw2);
S2(TG) T1(DB); Sl(TG) S2(TG) Tl(pwl);
S2(TG) T1(DD); S2(TG) Tl(.lu) llOumpxlwf); S2(TG) Tl(.lu) IlOumpxhaf);
Sl(TG) S2(TG) Tl(pwl); S2(TG) T1(DE);
Sl(TG) S2(TG) Tl(pw2); S2(TG) Tl(DB);
Sl(TG) S2(TG) Tl(pwl); S2(TG) T1(DD); S2(TG) Tl(.lu) IlOumpxlws);

Appendix 181
as:
Al(ATXecho)
Al(ATrcvr)
A2(CU Hfb)
S2{TG) Tl(.lu) IlOumpxhas); Sl(TG) S2(TG) Tl(pwl);
S2(TG) Tl(DE); Sl(TG) S2(TG) Tl(pw2); Sl(TB) S2(TG) T1(RD); Sl(TBRE) S2(TG) T!(AD); Sl(TBREAE) S2(TG) Tl(aqtm);
S2(TG) Tl(pw); S2(TB) Tl(lu) IlOumploop);
.listl Xcp P(0);
.listl rcvr P(0);
.Ustl Xecho P(0);P(0);P(0);P(0);P(0);P(0);P(0);P(0); P(180); P(180); P(180); P(180); P(180); P(180); P(180); P(180);
.listl Xproj 1 P(90); P(90); P(270); P(270); P(90); P(90); P(270); P(270); P(180); P(180); P(0); P(0); P(180); P(180); P(0); P(0); P(180); P(180); P(0); P(0); P(180); P(180); P(0); P(0); P(90); P(90); P(270); P(270); P(90); P(90); P(270); P(270);
.listl Xproj2 P(90); P(90); P(90); P(90); P(270); P(270); P(270); P(270); P(180); P(180); P(180); P(180); P(0); P(0); P(0); P(0);
.listl Xread P(270);
.list2 H90 P(0) A(a); P( 180) A(a);
.list2 Hfb P( 180) A(a); P(0) A(a);
.list2 Hep P(90) A(al);
.list2 Hdec P(90)A(a2);
.strings abph=02202002200202203113133131131331 pw<H 90 pulse pwKX 90 pulse pw2<X 180 pulse a<H 90 power aKHcp power a2<H dec power ct<contact time tm2<evolution time tau2<extra time tau<echo time tau9<rotor period tau8<dec. off time aqtm<acq time pd<recycle delay extm<time per scam dw<dwell time

Appendix 182
/* phmatfbm.sm4 WW 941204 based on 940906 +tau2 */
.title phormat flip back minus synchronized
.amode 0
.channels 2
.include defs.inc
.Ipct al
.tune pw pwl pw2 tm2 tau2 tau tau8 tau9 ct rd ad pd aqtm=((dw*al)+lu)
DS=((tau9/3 .)-pw- lu-ct+(pw 1/2.)) DC=(pwl/2.) DE=(tau-(pw2/2.)-(pwl/2.)) DB1 =(((tm2+tau2)/3 .)+tau-(pw2/2.)) DD=((tau9/3 .)-tau8-(2. *tau)-((tm2+tau2)/3 .)-pw 1) DB=(((tm2+tau2)/3 .)+tau-(pw l/2.)-(pw2/2.)) RD=rd AD=(ad+tau-(pw2/2.)-rd)
.amp a al a2
/* extm=(pd+pw+ct+(5*tau)+(3*pw2)+tml+(2*tau8)+(2*TAU9)+ad+rd+aqtm)*/ /*.float txduty2=((pw+ct+(5*tau)+(3*pw2)+tml+(2*TAU9)+ad+rd+aqtm)/extm)*/
.program start: Al(SEXecho) Tl(lm);
A1 (SE Xproj 1) A2(SE H90) Tl(lu); A1(SE Xproj2) A2(SE Hfb) Tl(lu);
loop: A1 (AT Xcp) A2(CUH90) S2(TB) Tl(pd); wmm: S2(TB) Tl(.lu) Il(jumpxlwmm); amm: S2(TB) Tl(.lu) Il(jump xh amm); wm: S2(TB) Tl(.lu) Il(jumpxlwm); am: S2(TB) Tl(.lu) n(jumpxham);
S2(TB) T1(DS); S2(TG) Tl(pw);
A2(ATHcp) Sl(TG) S2(TG) Tl(lu); wz: Sl(TG) S2(TG) T1 (. 1 u) 11 (jump xl wz); az: Sl(TG) S2(TG) Tl(.lu) ll(jumpxhaz);
Sl(TG) S2(TG) T1(DC); A1 (CU Xecho) A2(AT Hdec) S2(TG) T1(DB1);
Sl(TG) S2(TG) Tl(pw2); Al(CUXprojl) S2(TG) T1(DE);
Sl(TG) S2(TG) Tl(pwl); A1 (AT Xread) S2(TG) T1(DD);
wf: S2(TG) Tl(.lu) ll(jumpxlwf); af: S2(TG) Tl(.lu) llGumpxhaO; Sl(TG) S2(TG) Tl(pwl);
A1 (AT Xecho) S2(TG) T1(DB); Sl(TG) S2(TG) Tl(pw2);
A1(CU Xproj2) S2(TG) T1(DE); Sl(TG) S2(TG) Tl(pwl);
A1 (AT Xread) S2(TG) T1(DD); ws: S2(TG) Tl(.lu) Il(jump xl ws); as: S2(TG) Tl(.lu) Il(jumpxhas);
Sl(TG) S2(TG) Tl(pwl); A1 (AT Xecho) S2(TG) T1(DB);
Sl(TG) S2(TG) Tl(pw2); Al(ATrcvr) Sl(TB) S2(TG) T1(RD);
S1(TB RE) S2(TG) T1(AD);

Appendix 183
Sl(TBREAE) S2(TG) Tl(aqtm); A2(CUHfb) S2(TG) Tl(pw);
S2(TB) Tl(lu) llGumploop);
.listl Xcp P(0);
.listl rcvr P(0);
.listl Xecho P(0);P(0);P(0);P(0);P(0);P(0);P(0);P(0); P(180); P(180); P(180); P(180); P(180); P(180); P(180); P(180);
.list 1 Xproj 1 P(90); P(90); P(270); P(270); P(90); P(90); P(270); P(270); P(180); P(180); P(0); P(0); P(180); P(180); P(0); P(0); P(180); P(180); P(0); P(0); P(180); P(180); P(0); P(0); P(90); P(90); P(270); P(270); P(90); P(90); P(270); P(270);
.listl Xproj2 P(90); P(90); P(90); P(90); P(270); P(270); P(270); P(270); P(180); P(180); P(180); P(180); P(0); P(0); P(0); P(0);
.listl Xread P(270);
.list2 H90 P(0) A(a); P( 180) A(a);
.list2 Hfb P(l 80) A(a); P(0) A(a);
.list2 Hep P(90)A(al);
.list2 Hdec P(90)A(a2);
.strings abph=02202002200202203113133131131331 pw<H 90 pulse pwKX 90 pulse pw2<X 180 pulse ct<contact time a< H 90 power al<H cp amplitude a2<H dec power tm2<evolution time tau2<extra time tau<echo time tau9<rotor period tau8<dec. off time aqtm<acq time pd<recycle delay extm<time per scam dw<dwell time

Appendix 184.
PHORMAT Acqpars FUes.
# phmatfbp.acq ########################################################### # # The file format is as follows # # si_name;long name;value;units;min;max;decimal pnts;user level;data type # # a - is a blank field. # tabs and spaces are allowed i f you wish to seperate the fields a little # but a line can be only 80 characters. # # first line = ppfh and na # na;number acqs;32;-;8;1000;0;l;long # # channel assignment and sf values chl;ppgchl;l;-;l;4;0;l;long ch2;ppg ch2;2;-; 1 ;4;0; 1 ;long sfl ;X freq; 100.621916;MHz; 10.0;600.0;6; 1 ;float sf2;H freq;400.129766;MHz; 10.0;600.0;6; 1 ;float # timing variables # pwl;X 90 pulse;5.5;u;.l;100;l;l;float pw;H 90 pulse;5.5;u;. 1; 100; 1; 1 ;float pw2;X 180 pulse; 10.5;u;. 1; 100; 1; 1 ;float ct;contact time;3;m;.001 ;30;3; 1 ;float sw;spectrum width acq.;40;kHz;l;2000;l;l;float sw2;spectrum width evo.;20;kHz;l;2000;l;l;float dw;dwen time;25;u;.5;1000;2;l;float dw2;dwell time 2nd dun.;50;u;.5;1000;2;l;float # a;H 90 power;255;-;0;255;0;l;long al;H cp power;200;-;0;255;0;l;long a2;H dec. power;255;-;0;255;0;l;long # al;acq length; 128;-; 1 ;4096;0; 1 ;long al2;acq length 2nd dim.;64;-;l;1024;0;l;long aqtm;acq time; 12.801 ;m;.002;300;3; 1 ;float gain;receiver gain; 1412;-; 1; 1414;0; 1 ;float ad;acq delay;25;u;l;500;l;l;float rd;receiver delay; 15 ;u; 1; 100; 1; I ;float flf;filter width;26;kHz; 1 ;2000; 1; 1 ;float tau;echo time; 15;u;. 1; 1000; 1; 1 ;float tau8;dec. off tune; 1000;u; 1; 10000; 1; 1 ;float tm2;evolution time;0.1 ;u;0.1; 100000; 1; 1 ;float tau9;rotor period;33333.3;u; 10000.0; 100000.0; 1; 1 ;float tau2;extra time;0.1 ;u;0.1; 10; 1; 1 ;float # dp;dummy pulses;0;-;0;32;0;l;long pd;pulse delay;5;s; 1 ;3600; 1; 1 ;float #txduty2;trans duty;0.1 ;-;0.0;0.2;4; 1 ;float # #si_name;long name;value;units;min;max;decimal pnts;user Ievel;data type

Appendix \ 185
PHORMAT Acquisition Macro.
/* phmatS2fb */ /* A macro to collect 2D data sets into 2 separate files */ /* acq has to be the active buffer before running this macro */ /* acq is buffer name for starting data parameters */ /* al is the length of the FID */ /* al2 is the number of fid pairs collected in the second dimension */ /* dw2 is the dwell tune for the second dimension */ /* tm2 is the evolution time actually used m the pulse program */ /• Get filename to store data */
f i l e j ) = query "file name stem for + & - data: " -s; strcpy(file_m, file_p); strcat(file_p,"_p"); strcat(file_m,"_m");
/* Get current values from acq panel */ al2 = get_acq_val al2 -b acq; al = get_acq_val al -b acq; dw2 = get_acq_val dw2 -b acq; tm2 = get_acq_val tm2 -b acq;
saip; /* Set the 2D acq in progress flag */
set_acq_val pp& phmatfbp -b acq; file_p= create al al2 acq; /* Create a new fiill sized file(+) */ set_acq_val ppfii phmatfbm -b acq; file_m= create al al2 acq; /* Create a new full sized file(-) */
for(i=0;i<al2;i = i + l ) { set ni i ; /* Set ni value in acq info panel */ set_acq_val ppfii phmatfbp -b acq; zgw acq; file_p = append acq -r i ; set_acq_val ppfii phmatfbm -b acq; zgw acq; file m = append acq -r i ; tm2 = tm2 + dw2; /* Advance evolution time */ set_acq_val tni2 tni2 -b acq; }
caip; /* Clear the 2D acq in progress flag */'

Appendix 186.
PHORMAT Processing Macro.
/* phormat process */ /* macro for processing 2 separately acquired + and - datasets */ /* GmcG October 1996 */ /* display 4 viewports */ /* process panel displayed to speed up processing */ panel_process; format "2x2"; dis; info "Click in top left viewport"; info "Read p dataset into top left viewport"; bufiiamep = query "name of buffer for pdata?"; pdata = copy bufiiamep; dis pdata; info "Click in top right viewport"; info "Read m dataset into top right viewport"; bufiiamem = query "name of buffer for mdata?"; mdata = copy bufiiamem; dis mdata; /* parameters and definitions required for processing */ al = get_acq_val al -b pdata; aldouble = al*2; info "Click in top left viewport"; /* add p and m data */ real=pdata+mdata; dis real; info "Click in top right viewport"; /* subtract p and m data */ imag=pdata-mdata; phase imag 90 0; dis imag; info "Click in top left viewport"; /* zero fill real dataset -> twice original al */ zf real aldouble; dis real; info "real zero filled -> 2xar'; info "Click in top right viewport"; /* zero fill imag dataset -> twice original al */ /* shift imag dataset al points to the right */ /* -> first al points zero */ zf imag aldouble; dsr imag al; dis imag; info "imag shifted al points to right"; info "Click in bottom left viewport"; /* add real and imag */ fmal = real +imag; dis final; info "real and imag combined"; /* set number of data points back to original al */ setsize fmal al; dis final; info "size of fmal -> al"; /* processing of t2 dimension */
/* line broadenmg */ lb = query "Enter line broadening required (Hz)"; em final lb; dis final; info "line broadening applied"; /* Complex FT of t2*/ size = query "Enter number of points for FT (must be >=al)"; zf final size; ft fmal;

Appendix , 1 ^
dis final; info "Complex FT applied to t2"; /* Phase first row of F2 */ view -dl final; dis final; info "Click on first row and phase, then click OK in phasing panel"; paneljjhase; info "Phasing applied to F2 dimension"; /* Phase sensitive sort */ phasesort = query "psort or psort -i?" -m psorttype; if (phasesort = 1) {
psort final; } i f (phasesort = 2) {
psort - i final; } dis final; info "Phase sensitive sort applied"; /* processing of t l dimension */ view -d2 final; dis final; /* line broadening */ lb = query "Enter line broadening required (Hz)"; em final lb; dis final; info "line broadening applied"; /* multiplication of first point in t l by 0.5 */ view -d2 fmal; mult_first_pt 0.5; dis final; info "first point multiplication applied"; /* Complex FT of t l */ size = query "Enter number of points for FT (must be >=al)"; zf final size; ft final; dis final; info "Complex FT applied to t l " ; /* Phase Fl dimension */ view -d2 final; dis final; info "Click on rows to phase, then click OK in phasing panel"; panel_phase; info "Phasing applied to Fl dimension"; /* Displays F2 dimension parallel to horizontal axis */ view -dl final; dis fmal; paneltwod; info "Processing finished";

Appendix 188_
Acquisition Parameters for the PHORMAT Spectra Described in Chapter 7.
The acquisition parameters given in this section use the nomenclature as
defined for the CMX spectrometer, and are given in the acqpars file for the
PHORMAT pulse sequence. Similarly, the processing applied for each system, as
carried out using the processing macro already given, is summarised.
CI-PV19: y
Acquisition
na= 384 dw2= 80.0 s
pd= 3.0 s al= 512
spin rate= 30 Hz al2= 100
sfl= 100.625836 MHz aqtm= 6.401 ms
sf2= 400.1265 MHz ad= 14 us
pwl= 3.9 us rd= 50.0 us
pw= 3.9 s tau= 50.0 us
pw2= 7.8 us tau8= 1.0 ms
ct= 7.0 ms tm2= 0.1 us
sw= 80.0 kHz tau9= 33.333 ms
sw2= 12.5 kHz tau2= 8.0 s
dw= 12.5 us
Processing.
Both dimensions were zero-filled to 512 points.
gb=100 Hz
gbl=100Hz

Appendix 131.
CI-DR278 VI.
Acquisition. dw= 12.5 us
na= 256 dw2= 59.5 iis pd= 4.0 s al= 256
spin-rate= 30 Hz. al2= 200
sfl= 100.621313 MHz aqtm= 3.201 ms
sf2= 400.12525 MHz ad= 12.0 US
pwl= 3.8 fis rd= 40.0 US
pw= 3.8 ns tau= 50.0 ms
pw2= 7.6 us tau8= 1.0 ms
ct= 6.0 ms tm2= 0.1 US
sw= 80.0 kHz tau9= 33.333 ms
sw2= 16.8 kHz tau2= 8.0 ns
Processing.
Both dimensions were zero-filled to 512 points.
gb=100 Hz
gbl=30 Hz
CI-PR 57:1
Acquisition. dw= 10.0 ns
na= 800 dw2= 67.0 ns
spin-rate= 30 Hz al= 256
pd= 3.0 s al2= 40
sfl= 40.55728 MHz aqtm= 2.561 ms
sf2= 400.1265 MHz ad= 13.0 ns
pwl= 7.0 lis rd= 30.0 lis
pw= 4.0 ns tau= 30.0 ns
pw2= 14.0 lis tau8= 1.0 ms
ct= 6.0 ms tm2= 0.1 ns
sw= 100.0 kHz tau9= 33.333 ms
sw2= 15.0 kHz tau2= 4.0 ns
Processing.
Both dimensions were zero-filled to 512 points.
gb=100 Hz
gbl=50 Hz

Addendum
Single-Crystal X-Ray Structure.
After completion of writing this thesis a single-crystal structure determination
of DR278 polymorph A was obtained. In this addendum the preliminary results
obtained from this structure will be presented along with information on how the
NMR data are consolidated by the structural analysis. The structure determination
was carried out Dr A. Batsanov within the Durham University crystallography
service.
A single crystal of DR278 was obtained by recrystallisation from a 50/50
mixture of CD2CI2 and MeOH. Over a period of one month thin red needle-like
crystals were obtained. A suitable crystal was extracted for X-ray analysis. However,
these crystals proved to be relatively poor diffractors.
The diffraction experiments were carried out on a Rigaku AFC6S 4-circle
diffractometer with a Cryostream open-flow N2 gas cryostat, using graphite-
monochromated Cu-K^ radiation, A,=1.54184A. The unit cell was refined on the
setting angle of 25 reflections with 15<0<24°. The crystal structure was found to be
monoclinic, with space group P2i / c (No. 14), Z=4. The room-temperature data were
corrected for absorption by the empirical method (72 azimuthal scans of 2 reflections,
minimum and maximum transmission factors of 0.79 and 1.00) using the TEXSAN
software.' The structure was solved by direct methods and refined by fiill-matrix least
squares against all positive F^, using SHELXTL software. The single-crystal

m. determinations were carried out at 296 and 150 K. The geometrical parameters were
found to be essentially the same and are therefore discussed together (the data in
brackets refer to the low-temperature study). The data collection, structure refinement
and crystal data are given in Tables 1 to 6 for both structure determinations.
In both studies, N(l), N(2) and C(l) to C(6) of the aromatic ring were found to
be disordered over two positions, A and B, with occupancies refined to 53 and 47% at
296 K, and 47 and 53% at 150 K, respectively. Additionally, at 296 K the 0(3) and
0(4) sites were considered to be disordered over two positions, A and B, with
occupancies refined to 35 and 65 %. The disordered aromatic rings were refined as
idealised rigid bodies.
Results.
Notwithstanding the relatively small lattice volume (17.1 [16.6]A^ per non-
hydrogen atom versus 18 A^), the crystal packing leaves considerable space for
molecular disorder. Thus, the azo group is disordered between two planar trans-
conformations, in one of which (A) the lone-pan of N(2) is directed away from N(3),
while in the other (B) it points towards N(3). Consequently, the benzene ring linked
to N(2) is also disordered over two positions, A and B, which differ by a rotation of
ca. 17 [16]° aroimd the C(4) atom as a pivot, and by a dihedral angle of 10 [7.5]°
between the ring planes. This is shown in Figure 1, where the thermal ellipsoids are
at 30%.
The conjugation, which extends over both aromatic rings, the azo group and
the nitro group, results in an essentially planar system (ignoring the long ester chains

1S2_
at N(5)). The amido group is inclined at 5.8 [5] degrees to the benzene ring plane.
The twists around the C(l) -N(2) and N(l)-C(7) bonds are 14.7 [10.3]° and 3.7 [4.9]°
for the A conformation, and are 12.7 [10.6]° and 4.3 [7.1]° for the B conformation.
The B configuration is stabilised by an intramolecular N(3)-H N(2) hydrogen
bond. For the idealised position of the hydrogen atom the H N(2) distance is 2.13
[2.21] A, the N(3)-N(2) distance is 2.79 [2.84] A, and the N(3)-H-N(2) angle is 133
[128]°. Also, the A position results in a shorter intemuclear contact for H "N(1) of
2.05 [2.15] A and a N(3)-N(l) separation of 2.50 [2.56] A. However, the N(3)-H-
N(l) angle of 112 [108] ° is rather small for a normal hydrogen bond. The atomic co
ordinates, bond lengths and bond angles are given in Tables 2, 3 and 4 respectively.
The out-of-plane substituents at N(5) prevent a stacking arrangement of the
entire molecule, but it is possible to discern partial stacks as shown in Figure 2. They
include pairs of anti-parallel C(l-6) aromatic rings with a fairly short interplanar
separation of ca. 3.3 A, which brings about close contacts between the nitro and azo
groups. This is a typical separation for n-n stacking. These dimers are interleaved by
the amido group as shown in Figure 2. The two positions of the disordered azophenyl
moiety occupy essentially the same space, and, additionally, there is not much room
perpendicular to the plane of the aromatic rings. Hence, if interconversion occurs
between A and B, as suggested by the NMR results, then it would seem likely that the
mechanism for the inversion involves a linear, or near-linear, transition state.
Consequently, the rotation mechanism proposed earlier appears to be less likely than
thought.

m. For completeness, it should be noted that several other phenylazobenzene
systems crystallise in the same P2i/ c space group. Additionally, structural mimicry is
common-place for structures based mainly on van der Waal interactions, such as these
azobenzenes. This is a result of the fact that molecules which exibit similar van der
Waals surfaces crystallise in similar arrangements, assuming that hydrogen-bonding
interactions do not dominate in the crystal formation. The similar /ra«5-stilbene^ and
N-salicylideneaniline'' molecules are both known to crystallise commonly in the P2i/
c space group, and more often than not as monoclinic crystal systems.
In trying to relate the NMR shielding information to the crystal structure
it appears plausible to suggest that the rotation of the C(l-6) aromatic ring from the
plane of the azo linkage would shift the Na resonances more than those of the Np
resonances, irrespective of the electronegativity at each site. In Chapter 3 the shifts
could not be predicated from the additivity relations for phenylazobenzene systems.
Thus the increased shielding may be a result of the different stabilisation resulting
from the 7i-orbital overlap across the system. As discussed earlier, however, it is clear
that these hand-waving arguments carmot be considered at all accurate for predicting
small shifts between similar environments, and a full quantum mechanical description
of all of the interactions is required.

124.
WC(6)
0(6) ^
0(5)
= C(20)
0(6)
N(4)
C(16)
Figure I.
ORTEP plots of the molecular conformations for the structure determination of
DR278form A at a/ 293 K and b/150 K. Thermal ellipsoids are shown at 30 %
probability for clarity.

Figure 2.
Crystal packing of DR278 A as shown upon the (101) plane.

196
Table 1. Crystal data and structure refinement for DR278 A at 293 K.
Identification Empirical formula Formula weight Temperature Wavelength Crystal system Space group Unit cell dimensions
Volume Z Density (calculated) Absorption coefficient F(OOO) Crystal size Theta range for data collection Index ranges
Reflections collected Independent reflections Absorption cortection Max. and min. transmission Refinement method Data / restraints / parameters Goodness-of-fit on F' 2 Final R indices [I>2sigma(I)] R mdices (all data) Largest diff. peak and hole
code96srvl70 C22 H25 N5 07 471.47 293(2) K 1.54184 A Monoclinic P2(l)/c a =18.353(2) A b =12.230(2) A c =10.475(2) A 2326.0(7) A 4 1.346 g/cm^ 0.858 mm"' 992 0.2 X 0.05 X 0.05 mm 4.36 to 75.01°. -22<=h<=22, -1<=1<=11 4629 3398 [R(int) = 0.0908] Semi-empirical from psi-scans 1.000 and 0.789 Full-matrix least-squares on 1968/3/222 1.021 Rl =0.0702, wR2 = 0.1696 Rl =0.3085, wR2 = 0.2644 .261 and -.187 e. A'
a = 90 deg. P = 98.40(1) deg. y= 90 deg.
-15<=k<=l,

Table 2. Atomic coordinates (A x W*) and equivalent isotropic displacement parameters (A^xl(f) for DR278 A at 293 K. U(eq) is defined as one third of the
trace of the orthogonalized Uij tensor.
X y z U(eq)
0(1) 1230(4) -608(5) 6086(6) 115(2) 0(2) 2133(4) -1744(6) 5731(8) 134(3) 0(3A) 128(9) 3228(15) 6136(13) 105(5) 0(4A) -791(8) 3456(14) 4527(12) 96(7) 0(3B) -301(5) 2492(8) 6029(9) 105(3) 0(4B) -542(6) 3841(8) 4565(9) 96(4) 0(5) 4944(5) 7850(7) -1714(8) 161(3) 0(6) 5140(4) 6580(7) -2968(7) 129(3) 0(7) 2855(3) -363(5) 976(6) 112(2) N(1A) 3197(10) 3477(14) 991(17) 65(5) N(2A) 3214(7) 4530(12) 1058(13) 62(4) C(1A) 3668(7) 5043(10) 259(11) 69(3) C(2A) 3806(8) 6147(10) 493(12) 91(4) C(3A) 4213(9) 6737(8) -292(15) 93(3) C(4A) 4480(9) 6221(10) -1312(15) 73(2) C(5A) 4342(8) 5117(10) -1546(12) 67(3) C(6A) 3935(7) 4527(8) -760(11) 69(3) N(1B) 3059(8) 3928(17) 1249(15) 82(6) N(2B) 3438(6) 3624(11) 445(12) 69(4) C(1B) 3777(6) 4522(8) -150(11) 69(3) C(2B) 3708(7) 5610(10) 199(11) 91(4) C(3B) 4052(8) 6426(7) -417(13) 93(3) C(4B) 4465(9) 6155(9) -1383(14) 73(2) C(5B) 4534(7) 5068(10) -1733(11) 67(3) C(6B) 4190(6) 4251(7) -1116(11) 69(3) N(3) 3149(3) 1432(5) 923(6) 76(2) N(4) 4872(4) 6903(8) -2062(9) 98(3) N(5) 1312(3) 1297(5) 3834(5) 73(2) C(7) 2704(4) 3098(8) 1814(8) 74(2) C(8) 2298(4) 3571(7) 2659(8) 77(2) C(9) 1847(4) 2994(6) 3343(7) 75(2) C(10) 1778(4) 1844(6) 3196(7) 66(2) C( l l ) 2205(4) 1351(6) 2354(7) 67(2) C(12) 2684(4) 1922(8) 1690(6) 65(2) C(13) 1081(4) 194(7) 3437(8) 83(3) C(14) 1606(5) -691(7) 3960(9) 113(4) C(15) 1633(6) -969(9) 5338(11) 101(3) C(16) 2213(6) -2080(9) 7059(12) 157(5) C(17) 890(4) 1796(6) 4749(7) 72(2) C(18) 209(4) 2383(6) 4071(6) 70(2) C(19) -186(5) 2975(9) 5003(8) 92(3) C(20) -1045(5) 4272(10) 5440(9) 148(5) C(21) 3214(4) 382(7) 620(7) 72(2) C(22) 3801(4) 138(7) -216(7) 89(3)

128.
Table 3. Bond lengths [A] for DR278 A at 293 K.
0(1)-C(15) 1.234(10) 0(2)-C(15) 1.342(11) 0(2>C(16) 1.437(10) 0(3A)-C(19) 1.279(10) 0(4A)-C(19) 1.290(11) O(4A)-C(20) 1.503(11) 0(3B)-C(19) 1.271(8) 0(4B)-C(19) 1.293(10) O(4B)-C(20) 1.488(9) 0(5)-N(4) 1.216(9) 0(6)-N(4) 1.197(9) 0(7)-C(21) 1.215(8) N(1A)-N(2A) 1.29(2) N(1A)-C(7) 1.42(2) N(2A)-C(1A) 1.41(2) C(1A)-C(2A) 1.39 C(1A)-C(6A) 1.39 C(2A)-C(3A) 1.39 C(3A)-C(4A) 1.39 C(4A)-C(5A) 1.39 C(4A)-N(4) 1.413(11) C(5A)-C(6A) 1.39 N(1B)-N(2B) 1.23(2) N(1B)-C(7) 1.39(2) N(2B)-C(1B) 1.45(2) C(1B)-C(2B) 1.39 C(1B)-C(6B) 1.39 C(2B>C(3B) 1.39 C(3B)-C(4B) 1.39 C(4B)-C(5B) 1.39 C(4B)-N(4) 1.434(11) C(5B)-C(6B) 1.39 N(3)-C(21) 1.332(8) N(3)-C(12) 1.391(9) N(5)-C(10) 1.340(8) N(5)-C(17) 1.452(8) N(5)-C(13) 1.456(9) C(7)-C(8) 1.365(10) C(7)-C(12) 1.444(10) C(8)-C(9) 1.367(9) C(9)-C(10) 1.419(9) C(10)-C(ll) 1.399(9) C(ll)-C(12) 1.387(9) C(13)-C(14) 1.499(11) C(14)-C(15) 1.477(12) C(17)-C(18) 1.523(9) C(18)-C(19) 1.486(9) C(21)-C(22) 1.514(9)

Table 4. Bond angles [deg] for DR278 A at 293 K.
C(15)-0(2)-C(16) 117.8(9) C(19)-O(4A)-C(20) 112.8(9) C(19)-O(4B)-C(20) 113.5(8) N(2A)-N(1A>C(7) 108(2) N(1A)-N(2A)-C(1A) 115(2) C(2A)-C(1A)-C(6A) 120.0 C(2A)-C(1A)-N(2A) 115.9(10) C(6A)-C(1A)-N(2A) 124.0(10) C(1A)-C(2A>C(3A) 120.0 C(4A)-C(3A>C(2A) 120.0 C(3A)-C(4A)-C(5A) 120.0 C(3A)-C(4A)-N(4) 115.2(10) C(5A)-C(4A)-N(4) 124.8(10) C(4A)-C(5A)-C(6A) 120.0 C(1A)-C(6A)-C(5A) 120.0 N(2B)-N(1B)-C(7) 115(2) N(1B)-N(2B)-C(1B) 113(2) C(2B)-C(1B)-C(6B) 120.0 C(2B)-C(1B)-N(2B) 123.4(9) C(6B)-C(1B)-N(2B) 116.6(9) C(3B)-C(2B)-C(1B) 120.0 C(2B)-C(3B>C(4B) 120.0 C(5B)-C(4B)-C(3B) 120.0 C(5B)-C(4B)-N(4) 113.9(10) C(3B)-C(4B)-N(4) 126.0(10) C(6B)-C(5B)-C(4B) 120.0 C(5B)-C(6B)-C(1B) 120.0 C(21)-N(3)-C(12) 129.6(8) 0(6)-N(4)-0(5) 120.9(10) 0(6)-N(4)-C(4A) 123.2(11) 0(5)-N(4)-C(4A) 115.9(11) 0(6)-N(4)-C(4B) 119.1(11) 0(5)-N(4)-C(4B) 120.0(11) C(10)-N(5)-C(17) 124.1(7) C(10)-N(5)-C(13) 120.1(6) C(17)-N(5)-C(13) 114.7(6) C(8)-C(7)-N(1B) 107.6(10) C(8)-C(7)-N(1A) 135.5(11) C(8)-C(7)-C(12) 118.1(8) N(1B)-C(7)-C(12) 134.3(11) N(1A)-C(7)-C(12) 106.3(10) C(7)-C(8)-C(9) 123.4(8) C(8)-C(9)-C(10) 120.4(8) N(5)-C(10)-C(ll) 123.8(7) N(5)-C(10)-C(9) 119.6(8) C(11)-C(10>C(9) 116.5(8) C(12)-C(ll)-C(10) 123.6(8) C(ll)-C(12)-N(3) 124.1(9) C(ll)-C(12)-C(7) 117.8(8) N(3)-C(12)-C(7) 118.1(8) N(5)-C(13)-C(14) 114.8(7) C(15)-C(14)-C(13) 116.8(8) 0(l)-C(15)-0(2) 120.3(11) 0(1)-C(15)-C(14) 126.9(11) 0(2)-C(15)-C(14) 112.7(10) N(5)-C(17)-C(18) 111.8(6) C(19)-C(18)-C(17) 111.7(6) 0(3A)-C(19)-0(4A) 119.5(12) 0(3B)-C(19)-0(4B) 122.9(9) 0(3B)-C(19)-C(18) 119.1(9) 0(3A)-C(19)-C(18) 122.0(11) 0(4A)-C(19)-C(18) 116.3(9) 0(4B)-C(19)-C(18) 115.9(8) 0(7)-C(21)-N(3) 125.3(8) 0(7)-C(21)-C(22) 119.6(8) N(3)-C(21)-C(22) 115.1(8)

200
Table 5. Anisotropic displacement parameters (A^ >^l(f) for DR278 A at 293 K.
The anisotropic displacement factor exponent takes the form: -2n [h^a*^ Uji +...+2hka*b* Uj2 +..J
UU U22 U33 U23 U13 U12
o(i) 135(6) 96(5) 121(6) 7(4) 45(5) 0(4) 0(2) 152(7) 97(5) 167(7) 36(5) 66(6) 12(5) 0(5) 220(9) 98(6) 174(8) 7(6) 63(6) -42(6) 0(6) 124(6) 174(8) 97(5) 19(5) 42(4) -13(5) 0(7) 109(5) 88(4) 150(5) -16(4) 52(4) -26(4) N(4) 101(6) 90(7) 106(7) 19(6) 24(5) -30(6) N(5) 71(4) 85(5) 66(4) -17(4) 22(3) -13(4) C(7) 78(6) 73(6) 68(6) 6(6) 5(5) -10(6) C(8) 78(6) 64(6) 85(6) -1(5) -6(5) -2(5) C(12) 53(5) 95(7) 46(5) 2(5) -3(4) 7(5) C(14) 168(10) 72(7) 121(8) -6(6) 90(8) -23(7) C(15) 112(9) 74(8) 124(10) -10(7) 46(8) -24(7) C(16) 194(12) 131(11) 152(11) 56(9) 49(9) -16(9) C(19) 95(7) 126(8) 57(5) 12(6) 16(5) 18(6) C(20) 140(9) 199(13) 115(8) 2(8) 51(7) 76(9)

201
Table 6. Hydrogen coordinates (A xlO^) and isotropic displacement parameters (A^ x 1(f)
for DR278 A at 293 K.
X y z U(eq)
H(2A) 3627(11) 6492(13) 1175(15) 110 H(3A) 4306(12) 7476(8) -136(20) 112 H(5A) 4521(11) 4772(14) -2228(15) 80 H(6A) 3843(10) 3788(8) -917(16) 83 H(2B) 3432(9) 5791(13) 845(14) 110 H(3B) 4006(11) 7154(8) -184(18) 112 H(5B) 4811(10) 4887(14) -2379(14) 80 H(6B) 4236(9) 3524(8) -1350(15) 83 H(3N) 3422(3) 1884(5) 579(6) 91 H(8) 2332(4) 4324(7) 2779(8) 93 H(9) 1583(4) 3358(6) 3905(7) 89 H( l l ) 2166(4) 598(6) 2233(7) 80 H(131) 1011(4) 160(7) 2502(8) 100 H(132) 608(4) 50(7) 3713(8) 100 H(141) 1481(5) -1348(7) 3455(9) 136 H(142) 2096(5) -473(7) 3821(9) 136 H(161) 2585(6) -2636(9) 7207(12) 235 H(162) 1754(6) -2365(9) 7249(12) 235 H(163) 2356(6) -1464(9) 7606(12) 235 H(171) 1199(4) 2316(6) 5278(7) 87 H(172) 740(4) 1237(6) 5313(7) 87 H(181) 356(4) 2911(6) 3467(6) 84 H(182) -115(4) 1855(6) 3585(6) 84 H(201) -1447(5) 4688(10) 4991(9) 222 H(202) -658(5) 4760(10) 5796(9) 222 H(203) -1213(5) 3864(10) 6123(9) 222 H(221) 4033(4) 810(7) -408(7) 133 H(222) 3580(4) -201(7) -1005(7) 133 H(223) 4163(4) -345(7) 235(7) 133

202
Table 1. Crystal data and structure refinement for DR278 A at 150 K.
Identification code Empirical formula Formula weight Temperature Wavelength Crystal system Space group Unit cell dimensions
Volume Z Density (calculated) Absorption coefficient F(OOO) Crystal size Theta range for data collection Index ranges Reflections collected Independent reflections Absorption correction Refinement method Data / restraints / parameters Goodness-of-fit on F' 2 Final R indices [I>2sigma(I)] R indices (all data) Largest diff. peak and hole
97srv013 C22 H25 N5 07 471.47 150(2) K 1.54184 A Monoclinic P2(l)/c a= 18.042(2) A a = 90 deg. b = 12.198(2) A p = 99.22(1) deg. c= 10.387(2) Ay = 90 deg. 2256.4(7) A 4 1.388 Mg/m^ 0.884 mm' 992 0.8x0.1 X 0.05 mm 4.39 to 50.02 deg. -17<=h<=17, -12<=k<=l, -1<=1<=9 3020 2222 [R(int) = 0.1126] None Full-matrix least-squares on F 1377/0/219 1.089 Rl =0.0787, wR2 = 0.1885 Rl = 0.2823, wR2 = 0.3073 .472 and -.222 e.A'

203
Table 2. Atomic coordinates (A xl(f) and equivalent isotropic displacement parameters (A^
X 1(f) for DR278 A at 150 K. U(eq) is defined as one third of the trace of the orthogonalized Uij tensor.
X y z U(eq)
0(1) 6223(5) -572(8) 6098(8) 80(3) 0(2) 7110(6) -1767(9) 5728(11) 102(4) 0(3) 4698(6) 2604(11) 6027(10) 131(5) 0(4) 4374(6) 3805(9) 4557(9) 96(4) 0(5) 9950(6) 7946(8) -1745(10) 105(4) 0(6) 10145(4) 6619(8) -3003(8) 76(3) 0(7) 7856(4) -385(7) 960(8) 72(3) N(3) 8175(5) 1406(7) 917(8) 47(3) N(4) 9883(5) 6992(10) -2074(10) 58(3) N(5) 6303(5) 1293(7) 3850(9) 48(3) N(1A) 8222(13) 3502(18) 1039(22) 46(6) N(2A) 8221(10) 4562(16) 1134(17) 46(6) C(1A) 8650(9) 5078(12) 209(15) 46(4) C(2A) 8762(10) 6195(12) 425(15) 64(5) C(3A) 9189(11) 6790(10) -333(19) 63(4) C(4A) 9503(12) 6268(13) -1306(19) 47(3) C(5A) 9390(11) 5151(13) -1522(16) 49(4) C(6A) 8964(9) 4557(10) -765(15) 48(5) N(1B) 8059(15) 3995(28) 1144(26) 64(9) N(2B) 8460(11) 3652(18) 465(21) 52(6) C(1B) 8817(11) 4572(13) -112(17) 46(4) C(2B) 8749(11) 5664(15) 235(17) 64(5) C(3B) 9063(13) 6484(11) -436(22) 63(4) C(4B) 9444(14) 6213(14) -1453(23) 47(3) C(5B) 9512(12) 5121(16) -1800(18) 49(4) C(6B) 9199(10) 4301(12) -1130(17) 48(5) C(7) 7726(6) 3081(11) 1810(10) 50(3) C(8) 7307(6) 3591(10) 2673(11) 58(3) C(9) 6848(6) 3005(9) 3352(11) 51(3) C(10) 6790(6) 1876(9) 3170(10) 41(3) C( l l ) 7220(6) 1338(9) 2366(10) 48(3) C(12) 7713(6) 1933(10) 1729(10) 44(3) C(13) 6057(6) 210(10) 3432(11) 61(4) C(14) 6577(7) -698(10) 3952(12) 78(5) C(15) 6604(9) -957(12) 5402(16) 79(5) C(16) 7202(8) -2100(11) 7060(18) 107(6) C(17) 5881(6) 1844(9) 4742(10) 53(3) C(18) 5186(5) 2429(11) 4037(10) 52(3) C(19) 4782(8) 3000(15) 4961(16) 79(5) C(20) 3935(7) 4348(12) 5439(12) 93(5) C(21) 8228(6) 366(10) 656(10) 49(3) C(22) 8820(6) 120(10) -238(11) 67(4)

Table 3. Bond lengths [A] for DR278 A at 150 K.
204
0(1)-C(15) 1.17(2) C(4A)-C(5A) 1.39 0(2)-C(15) 1.35(2) C(5A)-C(6A) 1.39 0(2)-C(16) 1.43(2) N(1B)-N(2B) 1.17(3) 0(3)-C(19) 1.24(2) N(1B)-C(7) 1.49(3) 0(4)-C(19) 1.26(2) N(2B)-C(1B) 1.47(3) O(4)-C(20) 1.462(13) C(1B)-C(2B) 1.39 0(5)-N(4) 1.214(11) C(1B)-C(6B) 1.39 0(6)-N(4) 1.229(11) C(2B)-C(3B) 1.39 0(7)-C(21) 1.207(11) C(3B)-C(4B) 1.39 N(3)-C(21) 1.304(12) C(4B)-C(5B) 1.39 N(3)-C(12) 1.430(12) C(5B>C(6B) 1.39 N(4)-C(4A) 1.436(14) C(7)-C(12) 1.403(14) N(4)-C(4B) 1.45(2) C(7)-C(8) 1.41(2) N(5)-C(10) 1.404(12) C(8)-C(9) 1.371(14) N(5)-C(13) 1.439(13) C(9)-C(10) 1.391(13) N(5)-C(17) 1.454(12) C(10)-C(ll) 1.393(13) N(1A)-N(2A) 1.30(3) C(ll)-C(12) 1.395(13) N(1A)-C(7) 1.39(3) C(13)-C(14) 1.50(2) N(2A)-C(1A) 1.47(2) C(14)-C(15) 1.53(2) C(1A)-C(6A) 1.39 C(17)-C(18) 1.526(14) C(1A)-C(2A) 1.39 C(18)-C(19) 1.47(2) C(2A)-C(3A) 1.39 C(21)-C(22) 1.553(14) C(3A)-C(4A) 1.39

205
Table 4. Bond angles [degjfor DR278 A at 150 K.
C(15)-0(2)-C(16) 114.9(11) C(5B)-C(4B)-N(4) 115.8(14) C(19)-O(4)-C(20) 119.4(11) C(3B)-C(4B>N(4) 123.6(14) C(21)-N(3)-C(12) 129.0(10) C(4B)-C(5B)-C(6B) 120.0 0(5)-N(4)-0(6) 122.9(11) C(5B)-C(6B)-C(1B) 120.0 0(5)-N(4)-C(4A) 117.9(13) N(1A)-C(7)-C(12) 109.8(14) 0(6)-N(4)-C(4A) 119.2(12) N(1A)-C(7)-C(8) 132(2) 0(5)-N(4)-C(4B) 122.6(14) C(12)-C(7)-C(8) 118.3(11) 0(6)-N(4)-C(4B) 114.4(13) C(12>C(7)-N(1B) 136(2) C(10)-N(5)-C(13) 120.0(9) C(8)-C(7)-N(1B) 105(2) C(10)-N(5)-C(17) 121.3(9) C(9)-C(8)-C(7) 121.9(11) C(13)-N(5)-C(17) 116.6(9) C(8)-C(9)-C(10) 119.0(11) N(2A)-N(1A)-C(7) 108(2) C(9)-C(10)-C(ll) 120.7(10) N(1A)-N(2A)-C(1A) 112(2) C(9)-C(10)-N(5) 118.2(10) C(6A)-C(1A)-C(2A) 120.0 C(11>C(10>N(5) 121.1(10) C(6A)-C(1A)-N(2A) 126.8(12) C(10)-C(ll)-C(12) 119.9(10) C(2A)-C(1A)-N(2A) 113.1(12) C(ll)-C(12)-C(7) 119.8(11) C(1A)-C(2A)-C(3A) 120.0 C(11)-C(12>N(3) 121.5(11) C(4A)-C(3A)-C(2A) 120.0 C(7)-C(12)-N(3) 118.6(10) C(3A)-C(4A)-C(5A) 120.0 N(5)-C(13)-C(14) 115.2(10) C(3A)-C(4A)-N(4) 114.1(12) C(13)-C(14)-C(15) 115.3(11) C(5A)-C(4A)-N(4) 125.7(12) 0(l)-C(15)-0(2) 125(2) C(4A)-C(5A)-C(6A) 120.0 0(1)-C(15)-C(14) 126(2) C(1A)-C(6A)-C(5A) 120.0 0(2)-C(15)-C(14) 108.1(14) N(2B)-N(1B)-C(7) 110(3) N(5)-C(17)-C(18) 112.7(9) N(1B)-N(2B)-C(1B) 109(3) C(19)-C(18)-C(17) 111.4(11) C(2B)-C(1B)-C(6B) 120.0 0(3)-C(19)-0(4) 117.0(13) C(2B)-C(1B)-N(2B) 124.3(14) 0(3)-C(19)-C(18) 123(2) C(6B)-C(1B)-N(2B) 115.6(14) 0(4)-C(19)-C(18) 118.5(14) C(1B)-C(2B)-C(3B) 120.0 0(7)-C(21)-N(3) 128.5(11) C(4B)-C(3B)-C(2B) 120.0 0(7)-C(21)-C(22) 118.3(10) C(5B)-C(4B)-C(3B) 120.0 N(3)-C(21)-C(22) 113.1(10)

206
Tables. Anisotropic displacement parameters (A^ x 1 ( f ) for DR278 A at 150 K.
The anisotropic displacement factor exponent takes the form: -2n [h^ a*^ Ujj +...+2hka*b* U,2 +...J
U l l U22 U33 U23 U13 U12
0(1) 90(7) 82(7) 80(7) 7(5) 52(6) 7(6) 0(2) 132(9) 67(7) 131(10) 31(7) 91(8) 4(7) 0(3) 172(11) 171(12) 55(7) -1(8) 38(7) 78(9) 0(4) 93(8) 132(10) 67(7) 6(6) 23(6) 48(7) 0(5) 154(9) 65(7) 106(8) -9(6) 51(7) -37(6) 0(6) 78(6) 102(7) 53(6) -7(5) 27(5) 0(5) 0(7) 78(6) 58(6) 89(6) -5(5) 38(5) -8(5) C(7) 35(7) 89(10) 24(6) 16(7) 0(5) -2(7) C(8) 62(8) 63(9) 48(8) 9(7) 7(7) -9(7) C(14) 121(12) 68(10) 64(10) -15(8) 76(9) -32(9) C(15) 87(12) 48(10) 116(15) -8(10) 52(11) -26(9) C(16) 107(12) 71(11) 159(17) 27(11) 71(12) 15(9) C(17) 64(8) 60(8) 39(7) -2(7) 27(6) 8(7) C(18) 41(7) 84(9) 34(7) 6(7) 19(6) 1(7) C(19) 60(10) 135(16) 47(11) -14(10) 20(8) 11(10) C(20) 87(10) 119(13) 84(11) -13(9) 43(9) 70(10)

.20L
Table 6. Hydrogen coordinates (Ax IG*) and isotropic displacement parameters (A^ x 1(f) for
DR278Aat 150K.
X y z U(eq)
H(3N) 8477(5) 1843(7) 568(8) 57 H(2A) 8548(14) 6551(16) 1090(21) 77 H(3A) 9266(15) 7553(10) -185(26) 75 H(5A) 9605(15) 4795(18) -2188(22) 58 H(6A) 8887(13) 3793(10) -912(22) 57 H(2B) 8489(16) 5849(21) 930(23) 77 H(3B) 9017(19) 7230(12) -198(31) 75 H(5B) 9773(17) 4936(23) -2495(24) 58 H(6B) 9245(15) 3555(13) -1367(25) 57 H(8) 7330(6) 4364(10) 2775(11) 69 H(9) 6580(6) 3361(9) 3948(11) 62 H ( l l ) 7172(6) 570(9) 2223(10) 58 H(131) 5973(6) 186(10) 2467(11) 73 H(132) 5568(6) 72(10) 3718(11) 73 H(141) 7090(7) -502(10) 3806(12) 93 H(142) 6424(7) -1367(10) 3436(12) 93 H(161) 7490(8) -2784(11) 7174(18) 160 H(162) 6707(8) -2217(11) 7310(18) 160 H(163) 7470(8) -1528(11) 7613(18) 160 H(171) 6214(6) 2385(9) 5258(10) 63 H(172) 5729(6) 1298(9) 5354(10) 63 H(181) 5336(5) 2967(11) 3413(10) 62 H(182) 4847(5) 1887(11) 3535(10) 62 H(201) 3791(7) 5078(12) 5093(12) 140 H(202) 4243(7) 4419(12) 6302(12) 140 H(203) 3483(7) 3922(12) 5511(12) 140 H(221) 9042(6) -605(10) -37(11) 100 H(222) 9213(6) 681(10) -76(11) 100 H(223) 8585(6) 145(10) -1157(11) 100

208.
References
1. TEXSAN: T E X R A Y Structure Analysis Package, Ver. 5, 1989, Molecular
Structure Corporation, The Woodlands, Texsas, USA.
2. G. M. Sheldrick, SHELXTL, Ver. 5,1994, Siemens Analytical X-Ray Instruments
Inc., Madison, Wisconsin, USA.
3. J. A. Bouwstra, A. Schouten, J. Kroon and R. B Helmholdt, Acta Cryst., C41,420,
(1970).
4. K. Woznaik, H. He, J. Klinowski, W. Jones, T. Dziembowska and E. Grech, J.
Chem. Soc. Faraday Trans, 91, 77-85, (1995).