o - durham e-theses - durham university
TRANSCRIPT

Durham E-Theses
Esr and relaxation studies in doped calcium tungstate
and magnesium oxide
Ammar, El.Sayed A. E.
How to cite:
Ammar, El.Sayed A. E. (1976) Esr and relaxation studies in doped calcium tungstate and magnesium oxide,Durham theses, Durham University. Available at Durham E-Theses Online: http://etheses.dur.ac.uk/8163/
Use policy
The full-text may be used and/or reproduced, and given to third parties in any format or medium, without prior permission orcharge, for personal research or study, educational, or not-for-pro�t purposes provided that:
• a full bibliographic reference is made to the original source
• a link is made to the metadata record in Durham E-Theses
• the full-text is not changed in any way
The full-text must not be sold in any format or medium without the formal permission of the copyright holders.
Please consult the full Durham E-Theses policy for further details.
Academic Support O�ce, Durham University, University O�ce, Old Elvet, Durham DH1 3HPe-mail: [email protected] Tel: +44 0191 334 6107
http://etheses.dur.ac.uk

ESR AND RELAXATION STUDIES
IN DOPED CALCIUM TUNGSTATE
AND MAGNESIUM OXIDE
by
EL.SAVED A. E. AMMAR (B.Sc.,M.Sc., Alexandria)
Graduate Society
The copyright of this thesis rests with the author.
No quotation from it should be published without
his prior written consent and information derived
from it should be acknowledged.
A. thesis submitted to the University of Durham
L i n candidature for the degree of
Doctor of Philosophy
September 1976
S£LT;OM
To
My Father
and
My Wife

- A. -
ABSTRACT
As a precursor to the ESR and relaxation studies, measure
ments of the d i e l e c t r i c conscants and loss f o r pure single
crystals of calcium tungstate have been made at 1 MHz and room
temperature giving values of E ' = 11.3 ± 0.4, E 1 = 9.1 ± 0.4 a c
-3 and tan<5 - 5 x 10 which agree closely with Brower and Fang's.
Our measurements were extended to frequencies up to 80 MHz
and to samples doped with rveodymium and gadolinium.
A detailed investigation has been made of the s p l i t t i n g 3+
of the ESR tran s i t i o n s i n low concentration Gd /CaWO , reported
f i r s t By Buckley i n 1973; t h i s has led to the proposition of
an ordered oxygen vacancy modal giving r i s e to two s l i g h t l y
d i f f e r e n t Gd environments i n both of which Gd substitutes f o r
Ca at calcium s i t e s . Sources f o r anomalies i n the ESR spectra
of rare earth ions i n scheelite are b r i e f l y discussed.
Spin-lattice relaxation measurements f o r Gd" h/CaWO were
carried out at 37.5 GHz and i n the temperature range from 4.2 K
to 30 K. The relaxation i n the 'direct' region agrees with
preliminary measurements reported by Thorp et a l , 1974, i ; e .
T = 5.8 msec at 4.2 K. The change from d i r e c t t o Raman behaviour occurs near 8 K, and between 8 K and 30 K T follows
-3
a T a T law. This behaviour i n the higher temperature range
i s explained by the assumption of c r y s t a l imperfections.
Measurements of s p i n - l a t t i c e relaxation were also made fo r
Fe"*+/MgO i n the same temperature range; here a T ^'^ v a r i a t i o n
was found i n the Raman region and the t r a n s i t i o n temperature
- i i -
between the d i r e c t and Raman processes was about 20 K. The
data provided another example of an S-state ion behaving i n
the manner predicted by the present theories of relaxation.
In the l a s t chapter an account i s given of the
combined use of ESR and TEM (Transmission Electron Microscopy)
techniques, i n an investigation of the role of impurities
(mainly iron) i n the growth of cavities i n neutron-irradiated
magnesium oxide crystals.

- i i i -
ACKNOWLEDGEMENTS
I wish to express my thanks to many people to whom I owe
a debt of gratitude. Special mention must be made of the
following:
The University of Alexandria, Egypt, f o r the award of a
research scholarship to study f o r the degree of Ph.D. i n the
United Kingdom.
My supervisor. Dr. J. S. Thorp, f o r his u n f a i l i n g guid
ance, suggestions and h e l p f u l discussions.
Professor D. A. Wright f o r the use of the research
f a c i l i t i e s i n the Department, and to the technical s t a f f ,
headed by Mr. Frank Spence, f o r t h e i r assistance. In p a r t i c u l a r
I would l i k e to thank Mr. Ron Waite, Mr. Colin Savage and
Mr. Trevor Barcourt f o r t h e i r help.
Dr. G. Brown and Dr. G. J. Russell f o r t h e i r f r u i t f u l
collaboration and h e l p f u l discussions.
My colleagues i n the Department, especially Mr. William
Hutton and Miss Linda Grange f o r t h e i r useful discussions and
co-operation.
Mrs. J. Henderson for typing t h i s thesis and
Mrs. E. Johnston f o r the tracing of the drawings.
E
- i v
CONTENTS
Page
Abstract Acknowledgements Contents
i n i v
CHAPTER 1: INTRODUCTION 1.1 The aim of the work 1.2 Paramagnetic relaxation 1.3 The measurement of relaxation time
1.3.1 The pulse saturation method 1.3.2 Relaxation rate equations
1.4 Experimental techniques 1.4.1 Measurement of s p i n - l a t t i c e
relaxation time T,.
1 5
8 9
11 14
CHAPTER 2: THE DIELECTRIC CONSTANTS OF CaWO , Nd/CaWO AND. Gd/CaW04
2.1 Introduction 2.2 Experimental 2. 3 Derivation of e' and tan <5 2.4 Results 2.5 Discussion
16 16 18 20 21
CHAPTER .3: SITE OCCUPATION BY GADOLINIUM IN CALCIUM TUNGSTATE 3.1 The c r y s t a l structure 3.2 Crystal growth 3.3 The energy levels of Gd^+ i n CaWO 3.4 The spin-Hamiltonian 3.5 Experimental observations of ESR spectra 28
of gadolinium i n calcium tungstate 3.6 Comparison with the previous ESR data 30
3.6.1 Anomalous t r a n s i t i o n s of trivalent^Q rare earth ions i n scheelites
3.7 Int e r p r e t a t i o n of present results 33 3.7.1 Heat treatments of Gd/CaW04 samples
i n an oxygen ambient and t h e i r 34 i n t e r p r e t a t i o n
23 24 24 26
- v -
Page
CHAPTER 4: SPIN-LATTICE RELAXATION IN GADOLINIUM-DOPED CALCIUM TUNGSTATE
4.1 Theories of s p i n - l a t t i c e relaxation 37
4.2 Relaxation processes and t h e i r temperature dependence 40 4.2.1 The d i r e c t (or one phonon) process 40 4.2.2 The two-phonon Raman process 42 4.2.3 The resonant two-phonon relaxation, ^
or Orbach process 4.2.4 Multiple ground state process 43 4.2.5 Modifications due to l a t t i c e 44 imperfections
4.3 Experimental Results 48 4.3.1 Tj-temperature dependence ^
measurements 4.3.2 T -Lingular dependence measurements 51
4.4 Discussion 51 4.4.1 The temperature dependence of T 51 4.4.2 The angular v a r i a t i o n of T 56
CHAPTER 5: SPIN-LATTICE RELAXATION OF Fe 3 + IN IRON-DOPED 58 MAGNESIUM OXIDE
5.1 Crystal structure, doping and charge 58 compensation
5.2 Experimental results and discussion 59 5.2.1 Observation of two decay rates 60 5.2.2 Temperature dependence of T 61 5.2.3 Concentration dependence of T 64 5.2.4 The angular v a r i a t i o n of T^ 65 5.2.5 Frequency dependence of T 66
5.3 Conclusion 66
- v i -
Page
CHAPTER 6: CAVITY GROWTH IN NEUTRON IRRADIATED MAGNESIUM OXIDE
6.1 Introduction 68 6.2 Experimental 69 6.3 Results 70
6.3.1 Transmission Electron Microscopy 70 6.3.2 Electron Spin Resonance 72
6.4 Discussion 73
REFERENCES 78
APPENDIX Publications 88

- 1 -
CHAPTER 1
INTRODUCTION
1.1 The aim of the work
Paramagnetic resonance measurements f o r gadolinium t r i v a l e n t
ions (Gd^+) i n single crystals of calcium tungstate (CaWO ) were
reported f i r s t by Hempstead and Bowers, 1959 (1). These authors
stated some p r i n c i p a l advantages f o r using CaWO as a host l a t t i c e .
These were mainly t h a t the paramagnetic ion i n a CaWO l a t t i c e sub
s t i t u t e s f o r a calcium ion leading to an i d e n t i f i e d single spectrum;
i t s small linewidth, since the width contribution from the nuclear
magnetic moments of the neighbouring ions i s p r a c t i c a l l y n e g l i g i b l e ,
and the s u i t a b i l i t y of the material because of i t s hardness and
s t a b i l i t y . They concluded that Gd' h makes a p o t e n t i a l l y useful
materia], f o r three-level masers. Previously, Scovil, Feher and
Seidel, 1957 (2) showed that gadolinium et h y l sulphate operates as 3+
a s o l i d state maser and the ion Gd seems suitable since i t s eight
energy levels give the choice of several modes of maser operation.
Calcium tungstate assumed technological importance i n the 1960's
with the discovery that single crystals could be grown doped with
neodymium (Nd^+) i n concentrations suitable f o r laser action, Johnson
et a l , 1962 (3). More recently there have been interests i n scheelite
structure tungstates and molybdates f o r acousto-optic device
applications.
These applications of scheelite structure crystals have stim
ulated studies of c r y s t a l growth, doping, defects, thermal and o p t i c a l
v i b r a t i o n a l properties, e l a s t i c properties (Farley, 1973 (4)) and
electron spin resonance measurements (Buckley, 1973.-(5)). Investigation Of
2 7 OCT 1976 LI

- 2 -
of the ESR linewidths f o r Nd /CaWC>4 at 35 GHz and 4.2 K was under
taken by G Brown et a l , 1974 (6), both experimentally and t h e o r e t i
c a l l y for a range of neodymium concentrations. They concluded that
the homogeneous broadening was found to be due almost, exclusively 3+
to the Nd-Nd dipolar i n t e r a c t i o n i n d i c a t i n g that the Nd ions replace
the calcium ions s u b s t i t u t i o n a l l y i n the CaWO host l a t t i c e . A similar
study f o r Gd3+/CaWC>4 w a s reported by J S Thorp et a l , 1974 (7) and
th e i r results could be regarded as additional evidence f o r the v a l i d i t y
of the Gd-Gd dipolar i n t e r a c t i o n i n determining the angular v a r i a t i o n
of the linewidths. This, also, implied that the Gd 3 + ions enter the
host l a t t i c e of CaWO s u b s t i t u t i o n a l l y at the calcium s i t e s .
Furthermore, a study on Gd"*+/CaWC>4 was i n i t i a t e d by Thorp,
Buckley and Brown, 1974 (8) to investigate the s p i n - l a t t i c e relaxa
t i o n behaviour of t h i s material at 37.5 GHz. They indicated t h a t ,
over the temperature range from 1.5 to 8 K, the recovery was domin
ated by the d i r e c t process.
The main aim of our present studies i s to investigate some
problems encountered i n the preceding studies on pure and gadolinium-
doped calcium tungstate. These remaining problems, regarding CaWO
are presented as follows.
1. The previous published data about the d i e l e c t r i c constants of
pure CaWC>4, by Komandin et a l , 1960 (9) and Brower and Fang, 1969 (10),
revealed an apparent discrepancy i n the res u l t s . So we found i t
appropriate to make new measurements, provided i n Chapter 2, as a
contribution t o solving t h i s problem. Moreover, we extended these
d i e l e c t r i c measurements to samples of CaW04 single crystals doped
with gadolinium and neodymium f o r which, to our knowledge, no previous

- 3 -
data were published. Although measurements of d i e l e c t r i c constants
are not of a d i r e c t concern i n the ESR and relaxation studies,
knowledge of the d i e l e c t r i c behaviour of these materials i s needed
for the matching conditions f o r the ESR spectrometers.
2. The s p l i t t i n g of the gadolinium t r a n s i t i o n s observed i n the
studies of Gd3+/CaWC>4 reported by H P Buckley, 1973 (5) was a rather
in t e r e s t i n g phenomenon. In Chapter 3, we are going to investigate
the cause and nature of t h i s s p l i t t i n g . We suggest that t h i s may
be due to ordered oxygen vacancies i n the calcium tungstate l a t t i c e .
3. The study of the s p i n - l a t t i c e relaxation behaviour of Gd +/CaWO
with temperature reported by Thorp, Buckley and Brown, 1974 (8)
revealed t h a t the relaxation displayed a d i r e c t process i n as f a r
as C K. Subsequently, our aim was to extend the range of temperature
and to investigate the s p i n - l a t t i c e relaxation at high temperatures.
This i s discussed i n Chapter 4.
As regards magnesium oxide (MgO), the i n t e r e s t i n i t s study
began i n i t i a l l y w i t h some i n d u s t r i a l problems. Magnesium oxide,.
because of i t s insulating properties, i s usod very often as an
insulator i n heating elements. I t has been found that at rather o
high temperatures (~800 C) the insulating behaviour of the MgO
collapses and, consequently, the material conducts leading to the
f a i l u r e of the heating element. I t has been suggested that the
d i f f u s i o n of impurities from the sheath of the element, mainly i r o n ,
i n t o the magnesium oxide could be a possible explanation f o r the
occurrence of such breakdown? nonetheless, t h i s argument has not
been proved yet and i s s t i l l under study i n t h i s Department. Besides
the current measurements of e l e c t r i c a l conductivity and d i e l e c t r i c
- 4 -
losses i n pure and doped magnesium oxide, ESR studies on i r o n doped
magnesium oxide were carried out i n t h i s group (Vasquez, 1975 (11)
and Thorp et a l , 1976 (12)).
Moreover, we were able to extend our. studies on magnesium oxide
to a rather d i f f e r e n t f i e l d of i n t e r e s t . That i s , the study of the
damage caused by neutron-irradiated MgO samples and the consequent
nucleation and growth of cavities.when annealing these samples i n an
ambient of argon. The role of ir o n impurities i n MgO i s investigated
i n our studies. Thus, our aim i n studying magnesium oxide i s presented
i n the following.
1. With the forementioned interests i n studying MgO i n t h i s
Department, we found i t appropriate to extend our knowledge about 34-
Fe /MgO b/ studying i t s relaxation behaviour at 37.5 GHz. This was
intended as another example of an S-state ion i n a cubic l a t t i c e to
be compared with Gd"*+ i n the scheelite structure (tetragonal system)
which i s presented i n Chapters 3 and 4. This study of the i r o n -
doped magnesium oxide crystals i s dealt with i n Chapter 5.
2. The knowledge acquired from the ESR studies of iron-doped
magnesium oxide was h e l p f u l i n the i n t e r p r e t a t i o n of the ESR spectra
of the annealed neutron-irradiated MgO crystals. This was achieved
by collaboration with G J Russell (13) who provided the samples and
made transmission electron microscope (TEM) studies on them. Trans
mission electron microscopy on i t s own was inadequate t o i d e n t i f y
impurities so the need fo r the ESR study as a complementary technique
was necessary. ESR and TEM studies on the cavity growth i n neutron
i r r a d i a t e d magnesium oxide are presented i n Chapter 6.
1.2 Paramagnetic relaxation
S p i n - l a t t i c e relaxation i s , i n f a c t , one way of achieving
thermal equilibrium f o r the spin system wi t h the surrounding l a t t i c e . '
I t i s i n t e r e s t i n g to note that the phrase 1 spin-lattio-e relaxation'
i s sometimes used even i n other s i t u a t i o n s , such as noncrystalline or
even l i q u i d paramagnetic materials, where the term ' l a t t i c e ' i s not
e n t i r e l y appropriate and the relaxation process i s rather d i f f e r e n t .
I n order to describe the mechanism whereby a spin system achieves
thermal equilibrium w i t h i n i t s e l f and with i t s surroundings three
processes must be considered. These are spin-spin relaxation, cross
relaxation and s p i n - l a t t i c e relaxation. " The spin-spin relaxation i s
the process by means of which the spin system achieves thermal e q u i l
ibrium w i t h i n i t s e l f , cross relaxation i s the attainment of equilibrium
between spins of d i f f e r e n t species, while s p i n - l a t t i c e relaxation
describes the way i n which the spin system transfers energy to the
l a t t i c e .
The f i r s t calculation of the spin-spin relaxation time T^ was
performed by Waller, 1932 (14) considering a simple S = h system i n
low magnetic f i e l d . For pure paramagnetic E?.lts with t y p i c a l i n t e r --9
atomic spacings of a few angstroms, T^ 10 sec, and even i n magnet
i c a l l y d i l u t e systems, T^ i s very short i n comparison with the spin-
l a t t i c e relaxation time T^. An important conclusion i s t h a t since
T^ does not involve the l a t t i c e energy, i t i s essentially temperature
independent.
In studying the case of S > h or systems containing more than
one type of spin centre, cross relaxation must be considered. This
was discussed by Bloembergen et a l , 1959 (15) and further by Grant,
1964 (16). When the levels of a single m u l t i - l e v e l spin system are

1
v a b
1
v a c
f [a >
FIG. 1-1 Diagramatic representation of cross relaxation between levels lb> and l c > .
- 6 -
sim i l a r , but net i d e n t i c a l (as depicted i n Figure 1.1 where the
levels |b > and | c > are close i n energy and separated from l e v e l
a > ) the difference i n frequencies (v - v , ) i s very much less 1 ac ab than v or v
a c « The spin energy may then be transferred by the
t r a n s i t i o n of one, or more, excited ions ( i n l e v e l | c >) to t h e i r
ground state (level | a > ) with the simultaneous t r a n s i t i o n of a non-
excited ion (level | a > ) to an excited state (level [ b > ) ; t h i s
conserves the Zeeman energy, the small unbalance of energy being
taken up by the dipolar or i n t e r n a l energy of the spin system.
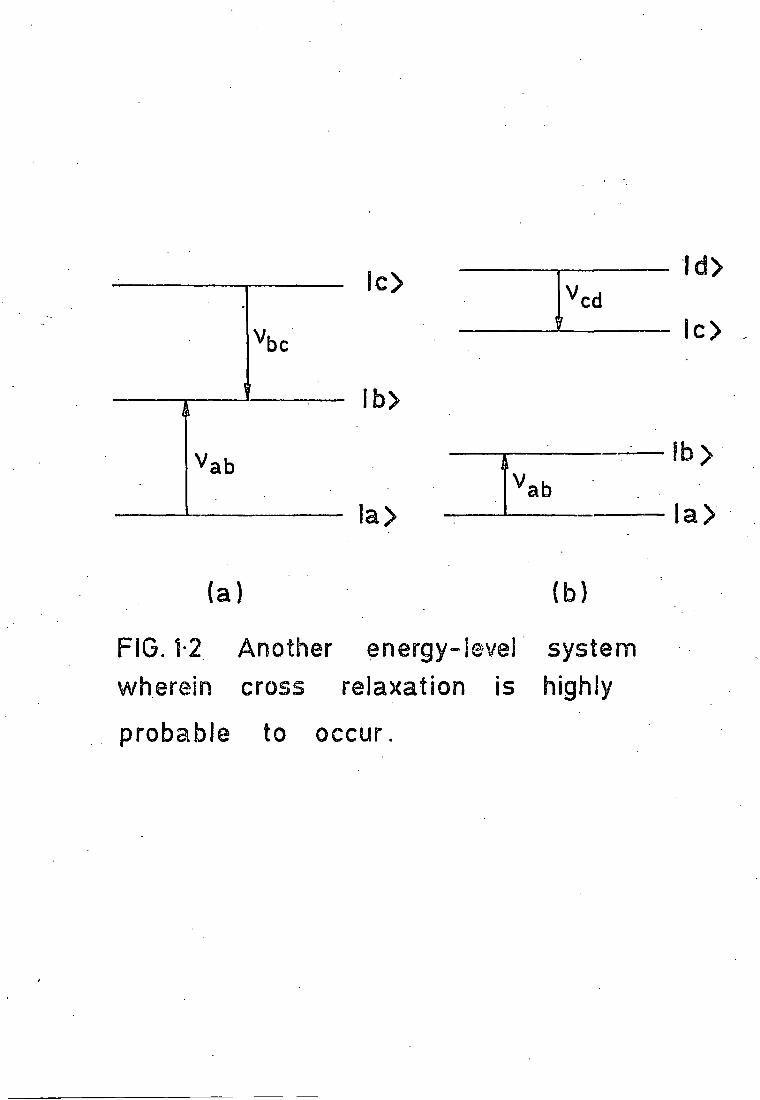
Other energy-level situations are considered by Bloembergen
et a l , wherein pairs of levels occurred with similar but not i d e n t i c a l
separations as i l l u s t r a t e d i n Figure 1.2. Cross relaxation can also
be e f f e c t i v e even when the levels | b > nd | c > are quite widely
separated (Figure 1.2b). I t was mentioned by Standley and Vaughan, 2+
1969 (17) that Figure 1.2a i s appropriate to Ni i n an a x i a l c r y s t a l
f i e l d and a moderate magnetic f i e l d and Figure 1.2b i s an example
of the Cr^ + ion i n an a x i a l f i e l d . I n general, cross relaxation
can occur v/ithin the spin system A and B with a f i n i t e t r a n s i t i o n
p r o b a b i l i t y with (m + n) spins taking p a r t , when m spins of type A
f l i p up say while n spins of type B f l i p down so that m (h v . J = n (h v ) (1.1)
ab ac The p r o b a b i l i t y of t h i s process occurring i s very l i k e l y t o be small
unless m and n are integers close to unity. This process has become
known as "harmonic cross-relaxation 1. Measurements of cross-
relaxation times T (Pershan, 1960 (18), Mims and McGee, 1960 (19)),
and harmonic cross-relaxation (Kopvillem, 1961 (20)) are i n f a i r l y
1
v b c
1 \
Vab
(a)
lc>
la>
v c d
j v a b
FIG. 1-2 Another energy-level wherein cross relaxation is
probable to occur.
(b)
system highly
lc>
ib>
la>
- 7 -
good agreement with the theories of Bloembergen and Grant. In the
context of our studies i t i s concluded that the minima observed i n 3+
the angular plot of the s p i n - l a t t i c e relaxation times of Fe /MgO
are probably due to such e f f e c t s of cross-relaxation as mentioned
i n Chapter 5.
1.3 The measurement of relaxation time
Several authors have described the methods which have been
widely used for the determination of s p i n - l a t t i c e relaxation. These
methods could be c l a s s i f i e d as :-
(a) Resonant methods
1. CW saturation (Eschefelder and Weidner, 1953 (21))
2. DC magnetization (Feng and .^Xoenj.bergen, 1963 (22))
3. Pulse saturdation (Davis, Strandberg and Kyhl, 1958 (23))
4. Inversion recovery (Castle, Chester and Wagner, 1960 (24))
5. Pulse response (Brown and Thorp, 1967 (25))
6. AC saturation (Herve and Pescia, 1960 (26))
7. Ultrasonic method (Dobrov and Browne, 1963 (27))
(b) Non-resonant methods
1.. Absorption methods
2. Dispersion measurements
3. Measurements a t l i q u i d helium temperature.
The experimental r e s u l t s of the l a t t e r methods have been summarized
and discussed by Gorter, 1947 (28) and Cooke, 1950 (29) . The concen
trated magnetic s a l t s usually employed in the non-resonant experiments
do not conform at a l l to the models used i n the th e o r e t i c a l approaches

- 8 -
to s p i n - l a t t i c e relaxation, nor are the parameters determined
generally d i r e c t l y comparable with those found by the resonance
techniques (17).
In our measurements we adopted the pulse saturation method
both for being a widely accepted technique for measuring s p i n - l a t t i c e
relaxation times and also for the sake of comparison with previous
r e s u l t s (8) that were already made with t h i s technique.
i.3.1 The pulse saturation method
This technique has been used many times, p r i n c i p a l l y by
Davis, Strandberg and Kyhl, 1958 (23), Bowers and Mims, 1959 (30),
Pace, Sampson and Thorp, 1960 (31). Recently i t was used by 3+
H P Buckley, 1973 (5) for preliminary studies of T^ for Gd /CaWO^.
The method employs two klystrons; one for monitoring the resonance
(low power klystron) and the other for providing a saturating pulse
(high power klystron) at the same frequency. The saturating pulse
equalizes the populations of the two spin l e v e l s being investigated
and hence absorption of power from the monitor klystron siezes to
occur. After the end of the pulse the populations of the l e v e l s
begin to revert to t h e i r thermal equilibrium values, and as t h i s
occurs an increasing amount of power i s absorbed from the monitor
klystron. The receiver picks up t h i s increasing absorption s i g n a l
and i t i s recorded as a function of time on a cathode-ray oscilloscope.
By d e f i n i t i o n , the spin l e v e l s r e vert to t h e i r undisturbed state i n
an exponential manner, the time constant of which i s the spin l a t t i c e
relaxation time T^, and i t i s t h i s exponential which i s recorded
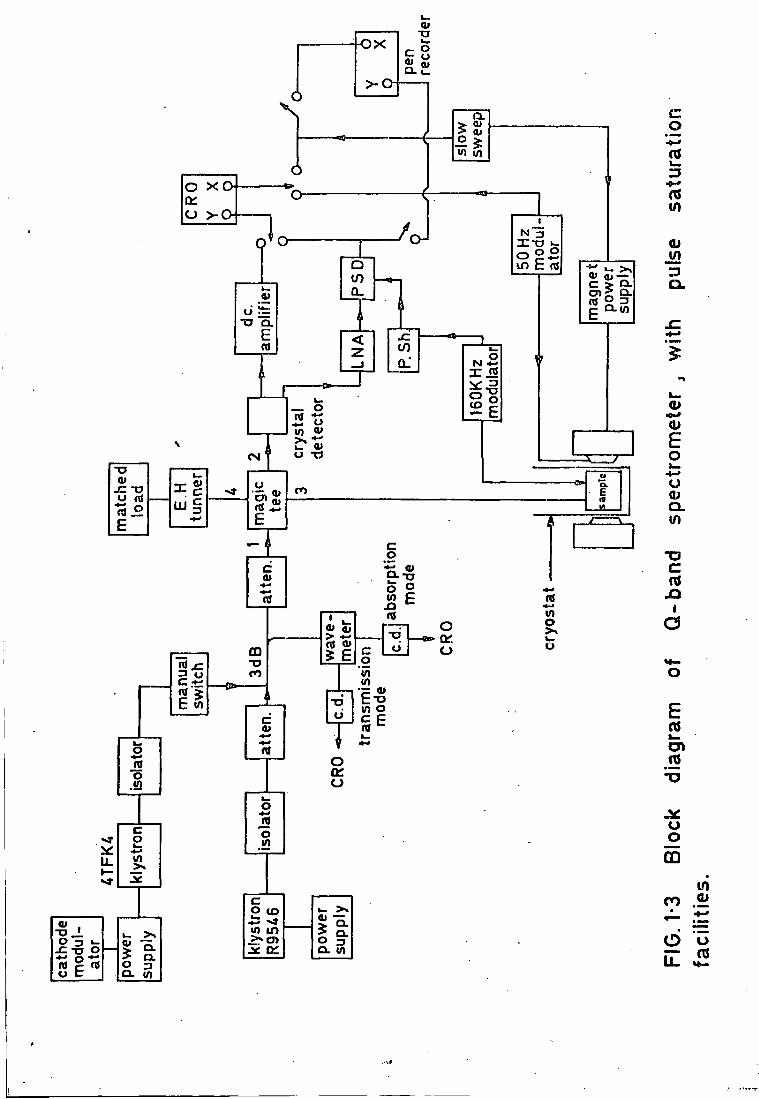
on the display. Figure 1.3 shows a block diagram of the c i r c u i t r y
of the Q-band spectrometer used for these measurements with the
-ox Is
o x o o >-o
if) c m
1
m i n
C O ->-* Of i — Z3 *•* PS <0
j / j
a.
•»-»
£ o >_ ••-» u <l» a . 10
T3 c rd i O
E 03 i _ c n ns
u o CD
10
c 5
- 9 -
f a c i l i t i e s required for the pulse saturation method* This has become
the standard technique for measuring relaxation times; i t i s theo
r e t i c a l l y possible for t h i s method to resolve any number of relaxa
tion times which may be present. This i s demonstrated i n our measure--3+
ments of T^ for re /MgO where two components i n the recovery traces
were observed (Chapter 5 ) .
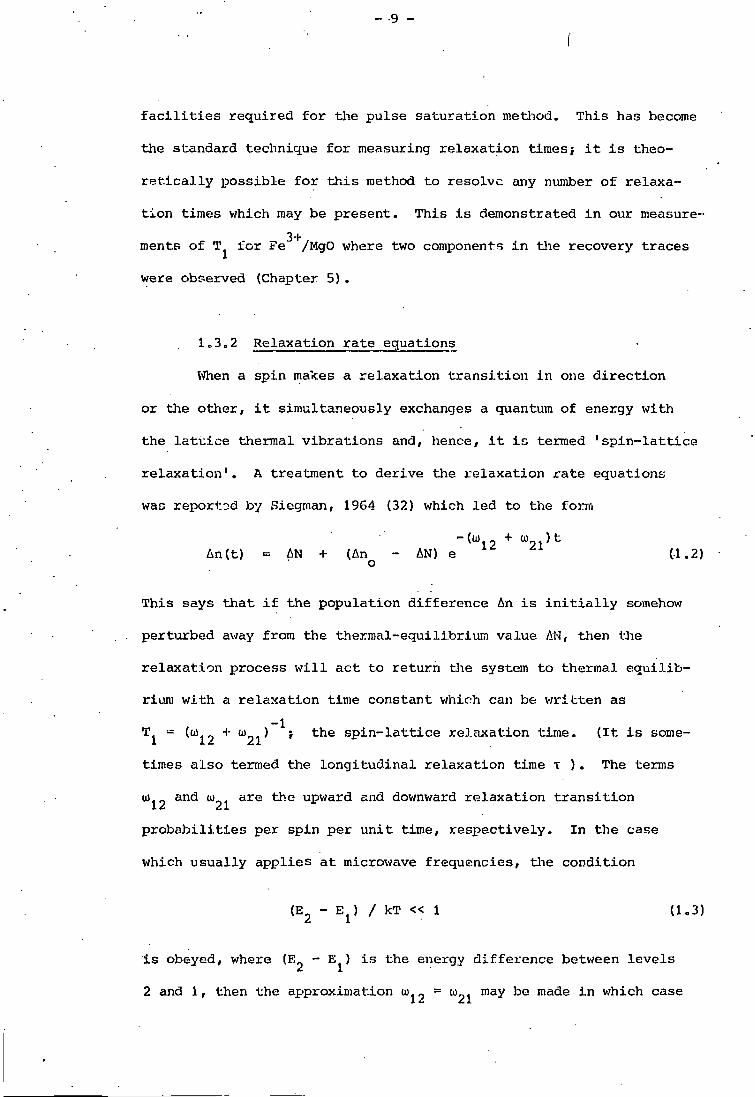
1o3.2 Relaxation rate equations
When a spin makes a relaxation t r a n s i t i o n in one d i r e c t i o n
or the other, i t simultaneously exchanges a quantum of energy with
the l a t t i c e thermal vibrations and, hence, i t i s termed ' s p i n - l a t t i c e
r e l a x a t i o n 1 . A treatment to derive the relaxation rate equations
was reported by Siegman, 1964 (32) which led to the form
-(a) + ai ) t An(t) = AN + (An - AN) e (1.2)
o
This says that i f the population difference An i s i n i t i a l l y somehow
perturbed away from the thermal-equilibrium value AN, then the
relaxation process w i l l act to return the system to thermal e q u i l i b
rium with a relaxation time constant which can be written as T l ~ ^12 + ^21^ ^'' ^ e s p i n - l a t t i c e relaxation time. ( I t i s some
times also termed the longitudinal relaxation time T ) . The terms
a n d W 2 i a r e t* l e u P w a r c ^ a n ^ downward relaxation t r a n s i t i o n
p r o b a b i l i t i e s per spin per u n i t time, respectively. In the case
which usually applies at microwave frequencies, the condition
( E 2 - / kT « 1 (1.3)
i s obeyed, where (E^ - E^) i s the energy difference between l e v e l s
2 and 1, then the approximation to^ = may be made i n v/hich case
- 10 -
T l = 1 / 2 W 1 2 ( K 4 >
This was evaluated for a two-level spin system. Generally, i n the
case of a m u l t i l e v e l spin system containing p l e v e l s , relaxation.
w i l l be a complex process involving a l l the l e v e l s , and the general th
rate equation for the i l e v e l w i l l be
' ST = E ( a ) j i n j " u±j V ( 1 ' 5 )
j = l j / - i
where n i i s the spin population of ths i l e v e l , and the t r a n s i t i o n
p r o b a b i l i t i e s between any two l e v e l s w i l l be i n the Boltzmann r a t i o
of the populations of those two l e v e l s
w../u).. = axp (E. - E.)/kT (1.6)
The relaxation behaviour of the system w i l l be controlled by (p - 1)
relaxation times T^ , where
T i ( i j ) - ( a ) i j + v - 1 • ( U 7 )
Using t h i s r e l a t i o n , the rate equation for the i^1 l e v e l can be
written i n the form
d n. P An. . - f(n. +n.)/(N. +N.)lAN. .
_ ^ L = -y 1 J 1 1 ?. i — i L - S J L + w.. An.. (1.8)
where N^, n^ are the thermal-equilibrium population and the instan
taneous population of l e v e l i also,
An. . = n. - n. , and J 1 3 1 3 (1.9)
AN.. = N. - N. J
JO i ]
- 11 -
The s o l u t i o n of equation (1.8) f o r the time v a r y i n g p o p u l a t i o n of
l e v e l i w i l l be the sum of e x p o n e n t i a l terms of the form
P n. (t) = n. + V * C. . exp - ( t / T . 1 3 ) (1.10) 1 10 , * * i j 1
j = l
which must be e v a l u a t e d n u m e r i c a l l y . I n experiments, the r e l a x a t i o n
behaviour of a p a r t i c u l a r l e v e l w i l l f r e q u e n t l y be dominated by one
of the I ' ^ ^ ^ ' s , having a l a r g e amplitude c o n s t a n t c ^ j f a n c ^ t h i s w i l l
be the time c o n s t a n t of the observed r e l a x a t i o n r e c o v e r y , although
more than one e x p o n e n t i a l may be observed.
1.4 Exp e r i m e n t a l Techniques
r e g a r d i n g the ESR measurements we have used a c o n v e n t i o n a l
Q-band spectrometer w i t h a low power r e f l e x k l y s t r o n working over
a frequency range 33.0 - 37.75 GHz, w i t h f a c i l i t i e s f o r b r o a d - l i n e
ESR d i s p l a y and p u l s e s a t u r a t i o n r e l a x a t i o n time measurements. The
experimental arrangement of the spectrometer i s shown i n b l o c k
diagram form i n F i g u r e 1.3. T h i s spectrometer was running p r e v i o u s l y
w i t h a superhet d e t e c t i o n system, e.g. as r e p o r t e d by K i r k b y , 1967 (33)
Buckley i n 1973 (5) found t h a t , without u s i n g the superhet d e t e c t i o n
system, the p h a s e - s e n s i t i v e d e t e c t o r was s u f f i c i e n t to produce
r e l a t i v e l y n o i s e f r e e s i g n a l s . I n our p r e s e n t work we are adopting
B u c k l e y ' s technique s i n c e i t has proved i t s r e l i a b i l i t y . We a r e not
going t o d i s c u s s the f u n c t i o n of the spectrometer i n d e t a i l s i n c e a
thorough study of s p e c t r o s c o p i c techniques a t m i l l i m e t r i c wavelengths
had been r e p o r t e d by G Brown, 1967 (34) i n t h i s group.
- 12 -
Howeverj there i s a s p e c i f i c feature for our Q-band spectro
meter that makes i t s l i g h t l y d i f f e r e n t from other conventional ones.
This i s that we are not using a proper cavity to contain the para
magnetic sample. Instead, we have sh o r t - c i r c u i t e d the waveguide by
a brass plunger which was f i t t e d inside the end of the waveguide
where the outside d.c. magnetic f i e l d could be applied to the sample.
The only disadvantage i n vsing t h i s technique i s the reduction of
the Q-factor of the system\ which was estimated by Kirkby (using a
technique described by Montgomery, 1948 (35)) as an unloaded value
of around 400. On the other hand, the absence of a cavity made i t
ea s i e r for the setting of the two klystrons used during measurements
of s p i n - l a t t i c e relaxation time. Besides, we were able to use simpler
cryogenic f a c i l i t i e s than would have been possible with a larger
cavity i n the r e s t r i c t e d pole-piece gap.
The low power signal source v/as an E.M.I, re f l e x klystron
type R9546, mounted i n an oil-bath for good frequency s t a b i l i t y .
Measurement of frequency was made by means of a combined transmission-
absorption wavemeter, which was also used i n relaxation measurements
for bringing the high power klystron frequency into coincidence with
the s i g n a l klystron. The high power saturating pulses were obtained
from an E l l i o t t water-cooled klystron, type 4TFK4 working around
37.5 GHz and fed into the system by means of a manual switch. The
bridge element was a magic tee by which the microwave power entering
from arm 1 was s p l i t equally between the sample arm 3 and the matching
arm 4 that composed of an E.H. tuner and a matched load. The two
ref l e c t e d waves were detected i n arm 2 with a c r y s t a l detector. In
the off-resonance condition the E.H. tuner was adjusted u n t i l the
re f l e c t e d power a t the c r y s t a l detector v/as zero. This meant that
the r e f l e c t e d power from the sample was balanced out by the r e f l e c t e d

- 13 -
power from the a d j u s t a b l e E.H. tuner arm. Then, the bridge was taken
s l i g h t l y o f f balance i n amplitude only i n order to observe pure
a b s o r p t i o n s i g n a l . When resonance o c c u r r e d an o f f - b a l a n c e s i g n a l
was d e t e c t e d . D e t e c t i o n and d i s p l a y of the a b s o r p t i o n spectrum was
c a r r i e d o u t • i n s e v e r a l ways depending on the type of measurements
to be made. Fo r video d i s p l a y the s i g n a l was fed through a d.c.
a m p l i f i e r to an o s c i l l o s c o p e , u s i n g a l a r g e amplitude 5C Hz modulation
of the magnetic f i e l d to sweep completely through each l i n e . T h i s
50 Hz modulation was achieved by p l a c i n g an a u x i l i a r y modulation c o i l
designed to be a push f i t i n t o the magnet bore and i t s magnetic
f i e l d being c o a x i a l w i t h t h a t of the magnet. I n the case of d i s p l a y i n g
r e l a x a t i o n r e c o v e r y t r a c e s , the 50 His modulation was s w i t c h e d o f f . I n
p l o t t i n g d e r i v a t i v e s of the a b s o r p t i o n spectrum a h i g h e r s e n s i t i v i t y
was found n e c e s s a r y and f o r t h i s purpose a modulation of high frequency
and s m a l l amplitude was used, together w i t h p h a s e - s e n s i t i v e d e t e c t i o n .
The system was then connected t o a pen-recorder, the x - a x i s of which
was d r i v e n from the slow sweep of the magnetic f i e l d . The high
frequency modulation was achieved by u s i n g an o s c i l l a t o r a t 160 kHz
and c o i l s a t t a c h e d to the plunger which terminated the waveguide such
t h a t the samples were n e a r l y c o n c e n t r i c w i t h the c o i l s . The magnetic
f i e l d s n e c e s s a r y f o r ESR a t Q-band were found to be of the order of 5
1.5 t e s l a , w i t h a homogeneity of b e t t e r than 1 p a r t i n 10 over a 3
volume of 1 cm . The c a l i b r a t i o n of the f i e l d was c a r r i e d out u s i n g
a combined p r o t o n - l i t h i u m magnetometer. The magnet used w i t h t h i s
spectrometer was a Newport type D electromagnet provided w i t h a
c u r r e n t s t a b i l i z i n g u n i t and a slow sweep u n i t . Cryogenic f a c i l i t i e s
were used to enable measurements a t l i q u i d helium, l i q u i d n i t r o g e n
temperatures and temperatures inter-between.

- 14 -
1.4.1 Measurement of s p i n - l a t t i c e relaxation time
Applying the pulse saturation method (Davis et a l , 1958 (23))
we were able to measure the r.pin-lattice relaxation times for both 3+ 3+ Gd /CaW04 (Chapter 4) and Fe /MgO (Chapter 5 ) . With t h i s technique
the behaviour qf the spin system was observed following the removal
of a saturation pulse of the high power klystron (20 W); changes
were monitored by observing the absorption of power from the low
power klystron (20 mW). As the spins relaxed a f t e r the pulse, and
the population difference was restored towards thermal equilibrium,
the recovery traces could be represented by the v a r i a t i o n i n spin
populations with time which obeyed either equation (1.2) or equation
(1.10), depending upon whether we are observing ona or more relaxation
constants.
Experimentally, the samples were oriented and the frequencies
of the high power and monitor klystrons were brought into coincidence
using the transmission-absorption wavemeter. The spectrometer was
then adjusted for balance and the magnetic f i e l d was set at the centre
of the absorption t r a n s i t i o n . Next,.saturation pulses with time
duration of 30 m sec and rate of repetition within 1-10 cycle/sec were
applied to the sample. The pulse t r a i n displayed on the oscilloscope
was of constant height, except for a s l i g h t 50 Hz rippl e which was
due to the A.C. heaters. This was greatly improved by using a
separate D.C. supply for the klystron heaters. The relaxation to
equilibrium, as monitored by the low power source, was displayed on
the C,R.O., using the d.c. amplifier. We used a Polaroid camera to
record the recovery curves photographically, using a slow pulse
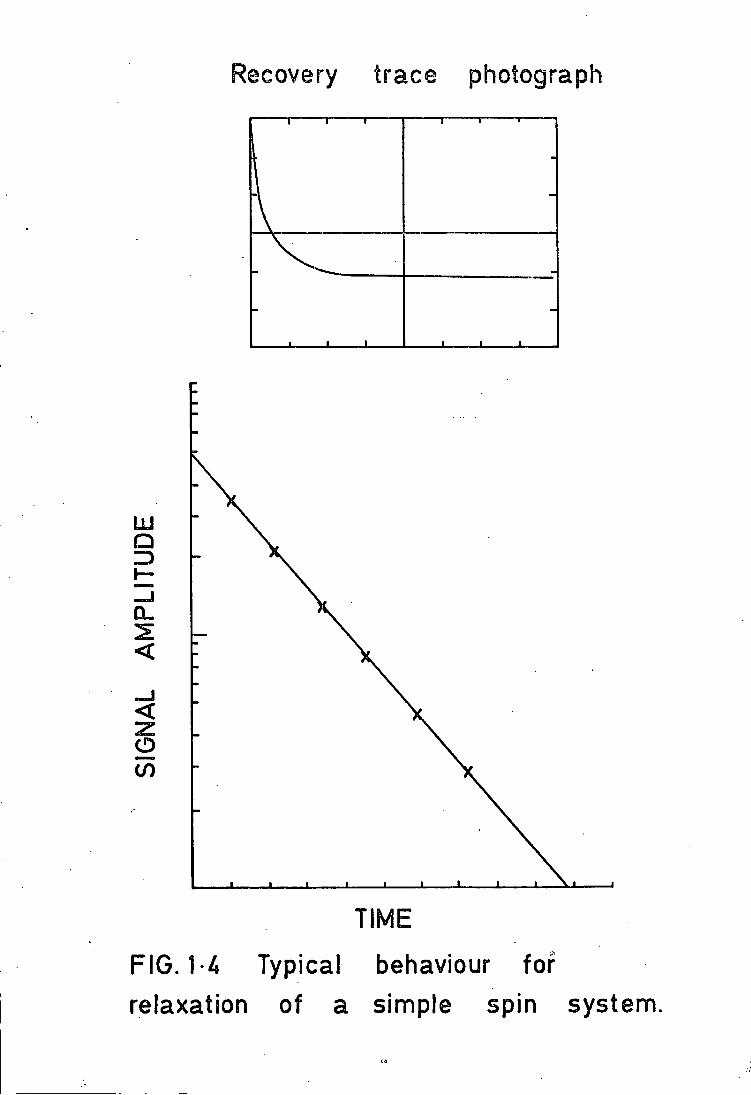
r e p e t i t i o n rate. A t y p i c a l photograph i s shown i n Figure 1.4. The
relaxation times were derived from the photographs by replotting the
ordinates (which are proportional to An(t)) i n semilogarithmic form.
Recovery t race photograph
o
<
o CO
1 — T 1 1 f 1
1 1 1 1 1 1 .
TIME
FIG. 1-4 Typical behaviour for relaxation of a simple spin system.
- 15 -
a g a i n s t time on a l i n e a r s c a l e . T h i s produced a s i n g l e s t r a i g h t l i n e 3+
i n the case of Gd /CaWO^ (Chapter 4, F i g u r e 4.4) and more than one 3+
slope i n the cas e of Fe /MgO (Chapter 5, F i g u r e 5.1). However, any
d e v i a t i o n from a s i n g l e s t r a i g h t l i n e i n d i c a t e s a departure from
simple s p i n l a t t i c e r e l a x a t i o n which i s not unexpected w i t h a m u l t i
l e v e l s p i n system.
The lowest d e t e c t a b l e time r a t e w i t h our CRO was 0.1 u. sec/cm.
A l s o , the f a l l time of the power p u l s e obtained from the k l y s t x o n was
about 3 p. s e c . T h i s r e s t r i c t e d the e x t e n t to which we could measure
T^ a t hi g h e r temperatures. 3+ Measurements of T. i n the case of Gd /CaWO. were c a r r i e d out 1 4
f o r the t r a n s i t i o n Nc.4 ( t h i s nomenclature was gi v e n i n r e f e r e n c e 7 ) ,
because i t appears as a l a r g e amplitude s i g n a l a t higher f i e l d s w i t h
no apparent o v e r l a p w i t h the other t r a n s i t i o n s . I n the case of 3+
Fe /MgO measurements were made f o r the c e n t r a l ± -1 <—• + main
t r a n s i t i o n .
- 16 -
CHAPTER 2
THE DIELECTRIC CONSTANT'S OF CaW04, Nd/CaW04 and Gd/CaW04
2.1 I n t r o d u c t i o n
Although tv/o measurements of the d i e l e c t r i c c o n s t a n t s of pure
c a l c i u m t u n g s t a t e have been re p o r t e d ( 1 , 2 ) , the v a l u e s quoted show a
c o n s i d e r a b l e d i v e r g e n c e . I n the e a r l i e r paper ( 1 ) , Komandin e t a l , who
used an immersion method, s t a t e d t h a t the d i e l e c t r i c c o n s t a n t was
£ ' - 21 .4 a t 25°C and 1.72 MHz f o r s o l i d m a t e r i a l , a p p a r e n t l y i n powder
form. Calcium tungstate., however, c r y s t a l l i z e s i n the s c h e e l i t e s t r u c t u r e ;
i t belongs to the t e t r a g o n a l system having a = b= 5 .243 X and c = 11.376 i£
(3 ); more d e t a i l s o f the s t r u c t u r e are g i v e n i n the n s x t c h a p t e r ,
s e c t i o n 3 . 1 . Consequently, two components are n e c e s s a r y t o d e s c r i b e the
d i e l e c t r i c t e n s o r . I n the l a t e r paper, Brower and Fang (2) gave r e s u l t s
f o r measurements on o r i e n t e d pure s i n g l e c r y s t a l s l i c e s . They found
t h a t the d i e l e c t r i c c o n s t a n t was a n i s o t r o p i c , t h a t the d i e l e c t r i c con-
s t a n s p a r a l l e l t o the a - a x i s and c — a x i s were 11.7 and 9 . 5 , r e s p e c t i v e l y ,
a t 24.5°C, and t h a t these v a l u e s were the same f o r f r e q u e n c i e s of 1.59 KHz
and 1 MHz. The measurements reported here were made p r i m a r i l y t o c l a r i f y
the s i t u a t i o n i n pure c a l c i u m t u n g s t a t e and a l s o to o b t a i n data on some
neodymium- and gadolinium-doped c a l c i u m t u n g s t a t e s i n g l e c r y s t a l s i n
order to a s s i s t o p t i m i z a t i o n of the matching c o n d i t i o n s d u r i n g e l e c t r o n
s p i n resonance and r e l a x a t i o n s t u d i e s i n them; to our knowledge no prev i o u s
measurements on doped c a l c i u m t u n g s t a t e have been p u b l i s h e d .
2 . 2 E x p e r i m e n t a l
The s i n g l e c r y s t a l s used, (obtained from I.R.D. Co. L t d . ,
N e w c a s t l e ) , were grown by the C z o c h r a l s k i method ( 4 ). I n the pure and

- 17 -
gadolinium-doped c r y s t a l s , charge compensation was a c h i e v e d by vacancy
i n c o r p o r a t i o n , and i n the neodymium-doped c r y s t a l s by sodium e d d i t i o n .
The s i n g l e c r y s t a l b o u l e s , whose dimensions were t y p i c a l l y 5 cm long and
1.5 cm diameter, were f i r s t o r i e n t e d by Lane b a c k - r e f l e c t i o n X-ray methods
which gave o r i e n t a t i o n a c c u r a c i e s of ±15' of a r c . Specimens of known
o r i e n t a t i o n were then prepared by making a p p r o p r i a t e s l i c e s w i t h a diamond
wheel c u t t i n g machine and p r e c i s i o n p o l i s h i n g t h e i r f a c e s w i t h diamond
p a s t e to a 0.25 uin f i n i s h . The l a r g e r facer; of the specimens were
l i m i t e d by t!.e boule dimensions to about 1 cm x 1 cm i n a r e a and were c u t
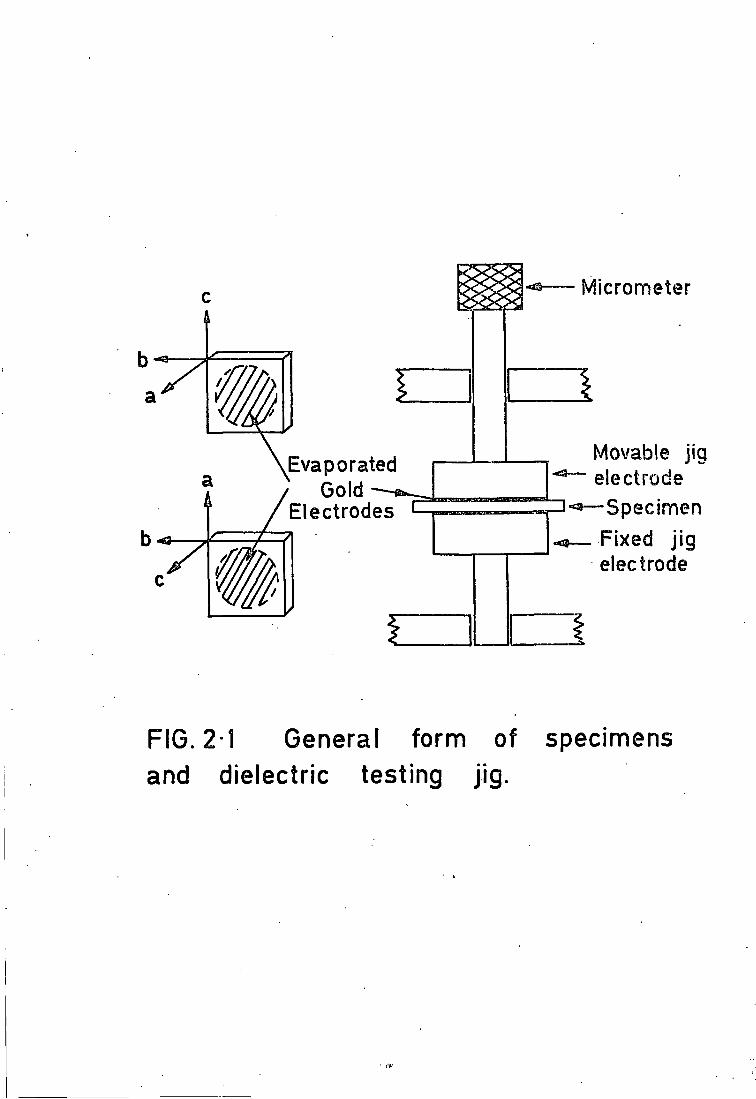
i n the plane of e i t h e r the a- or c - a x i s (see F i g u r e 2 . 1 ) . The specimen
t h i c k n e s s , u s u a l l y 0.3 mm, r e p r e s e n t e d the minimum which could r e a d i l y be
achieved without f r a c t u r i n g the s l i c e during f a b r i c a t i o n . C i r c u l a r gold
e l e c t r o d e s were d e p o s i t e d by e v a p o r a t i o n on the l a r g e r p o l i s h e d f a c e s to
ensure good e l e c t r i c a l c o n t a c t over a d e f i n e d a r e a between the c r y s t a l
and the e l e c t r o d e s of the d i e l e c t r i c t e s t i n g j i g .
The measurements were made i n a i r a t room temperature over the
frequency range 1 to 40 MHz u s i n g a s t a n d a r d Q~meter (Marconi TF 1245)
and the o s c i l l a t o r (Marconi TF 1246). Measurements were then extended to
80 MHz u s i n g an o s c i l l a t o r (Marconi TF 1247) whose o p e r a t i n g range extended
from 20 to 300 MHz. The d i e l e c t r i c t e s t i n g j i g (Marconi T J 155C/1) was
modified to a l l o w the use of 10 or 6 mm diameter c i r c u l a r j i g e l e c t r o d e s
as specimen dimensions were l i m i t e d by the s i z e of the s i n g l e c r y s t a l s
a v a i l a b l e . I n t h i s technique, measurements were made f i r s t l y w i t h the
specimen mounted i n the j i g and secondly, a t the same j i g e l e c t r o d e
s p a c i n g , without the specimen. The d i f f e r e n c e i n c a p a c i t y enabled the
r e a l p a r t of the d i e l e c t r i c c o n s t a n t , e', to be d e r i v e d ; i n a s i m i l a r
manner the d i f f e r e n c e i n Q-value w i t h and without the specimen allowed
the d i e l e c t r i c l o s s , t a n 6 , to be e v a l u a t e d .
Micrometer
b 7 @
\ Movable jiq Evaporated electrode a Gold
m Specimen Z3 Electrodes = 1
b Fixed j ig «3 -y / — ^1 electrode
FIG. 2-1 General form of specimens and dielectric testing jig.

- 18 -
2.3 D e r i v a t i o n of e 1 and tan 6
When u s i n g t h e Q-meter w i t h or without the specimen we a c t u a l l y
observe the resonance c o n d i t i o n ,
(2.1)
where w i s the o p e r a t i n g frequency, L and C are the t o t a l inductance and
t o t a l c a p a c i t a n c e of the c i r c u i t , r e s p e c t i v e l y . So,- m a i n t a i n i n g OJ and L
c o n s t a n t whethec the sample i s i n or out of the t e s t i n g j i g , we can equate
C i n both c a s e s t o a v a l u e which we w i l l denote as C . The t o t a l cap-T L
a c i t a n c e i s the sum of the a i r gap c a p a c i t a n c e when the sample i s
out, w i t h the spacing of the j i g e l e c t r o d e s e x a c t l y as the t h i c k n e s s of the
sample, the Q-meter c a p a c i t a n c e i n t h i s c a s e , , the h o l d e r c a p a c i t a n c e
C , the leaci.s c a p a c i t a n c e C and the i n t e r n a l c a p a c i t a n c e o f the equip-
ment C^. Thus a t resonance, without the sample,
C m = C, + C + C + C + C. (2.2) T 1 o H L i
I n the case when the sample i s i n the t e s t i n g j i y , we r e f e r t o the.sample
c a p a c i t a n c e by C . Thus, a t resonance w i t h t h s sample i n , A
C = C + C + C + C + C. (2.3) T 2 X H L i
From (2.1), (2.2) and (2.3) we f i n d t h a t
C l " C 2 = CX " C o ( 2 ' 4 )
N e g l e c t i n g the edge e f f e c t s , i t can be shown t h a t the c a p a c i t a n c e C of A
a p a r a l l e l p l a t e c a p a c i t o r w i t h a r e l a t i v e p e r m i t t i v i t y ( d i e l e c t r i c
c o nstant) E " i s e x p r e s s e d as

- 19 -
(2.5) A
c = e -o o d
where A i s the area of the electrodes i n square metres, d the thickness
of the sample i n metres and C q i s c a l l e d the p e r m i t t i v i t y of free space
having a value of 8.854 pF m ' ; t h i s y i e l d s the value of the capac
itance i n pico Farad.
Therefore, from (2.4) and (2.5) we get
C o
1)
f 1 1 (2.6)
Also, the numerical value of the los s , tan 6 , can be evaluated from
the expression (5)
tan 6 = (2.7)
i n which and are the capacitances indicated by the Q-meter at
resonance with the specimen out of and i n the testing j i g , respectively,
and Q and Q are the corresponding Q-values. l z-
In the present experiments, however, the specimens were, for
convenience, cut i n the form of squares and so some c r y s t a l protruded
beyond the c i r c u l a r j i g electrodes. Consequently, a correction for edge
ef f e c t s was necessary. Various formulae have been given previously (6),
and following s i m i l a r methods, equation (2.6) can be modified to
C l ' °2 e' C
C (e 1
o or C-. - C r
- 20 -
_1 J? C + C o e
+ 1 ( 2 . 8 )
where C i s the edge correction f o r the capacitance given by
C e 1.113D
3TT .n 8TTD d ( 2 . 9 )
f o r the experimental conditions used i n which, f o r any electrode diameter
D employed, the thickness of each evaporated gold electrode was very small
compared with d, the specimen thickness. These equations v/ere used i n
deriving the numerical data presented; i t was found that the correction
term amounted to about 8%. The edge e f f e c t correction for tan 6 was
negl i g i b l e .
2.4 Results
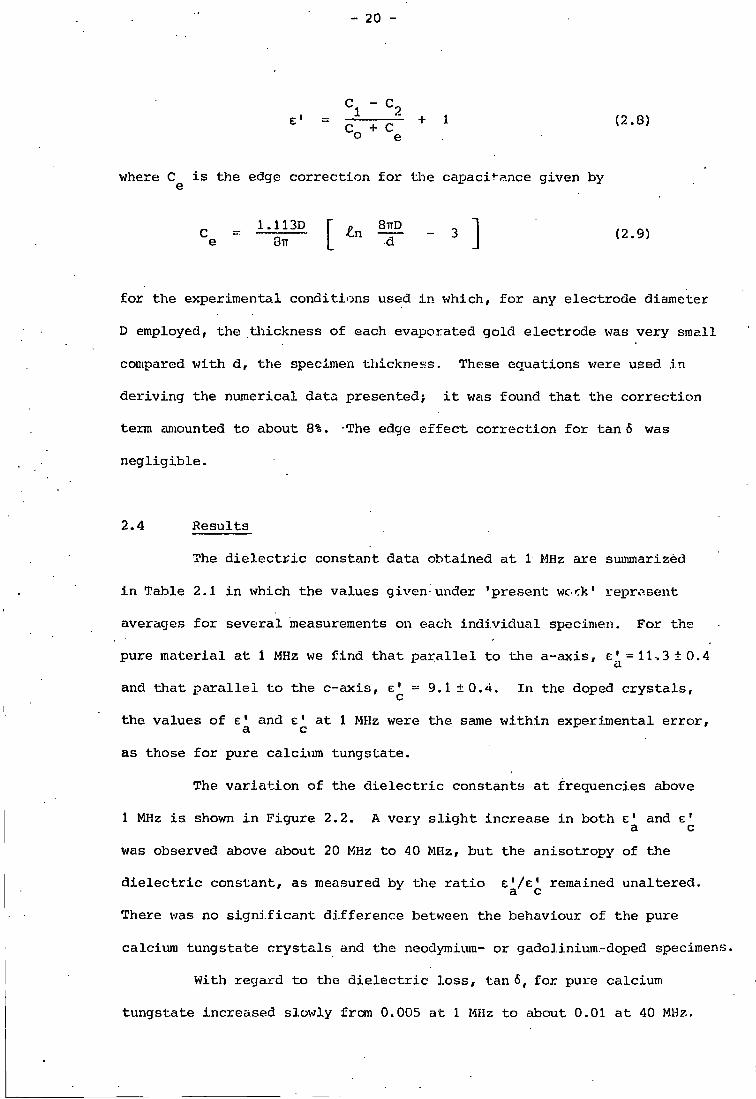
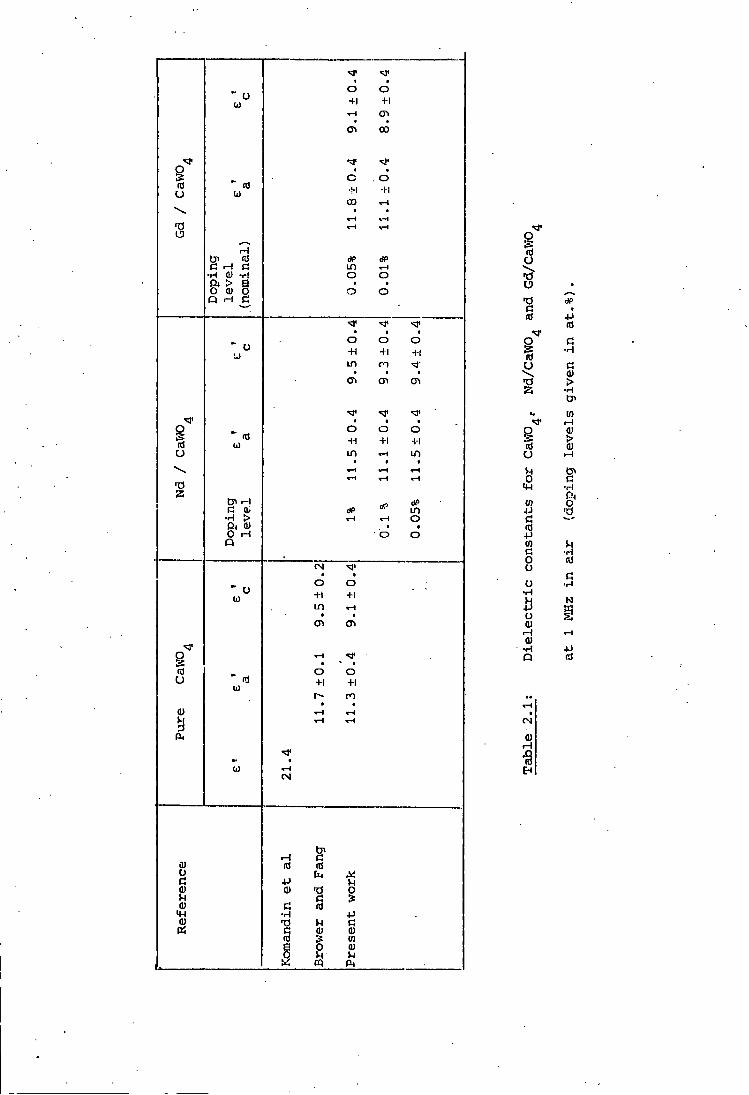
The d i e l e c t r i c constant data obtained at 1 MHz are summarized
i n Table 2.1 i n which the values given under 'present week' represent
averages f o r several measurements on each i n d i v i d u a l specimen. For the
pure material at 1 MHz we f i n d that p a r a l l e l to the a-axis, E ^ = 11.3 ± 0.4
and that p a r a l l e l t o the c-axis, E ^ = 9.1 ± 0 . 4 . I n the doped c r y s t a l s ,
the values of and at 1 MHz were the same w i t h i n experimental error,
as those f o r pure calcium tungstate.
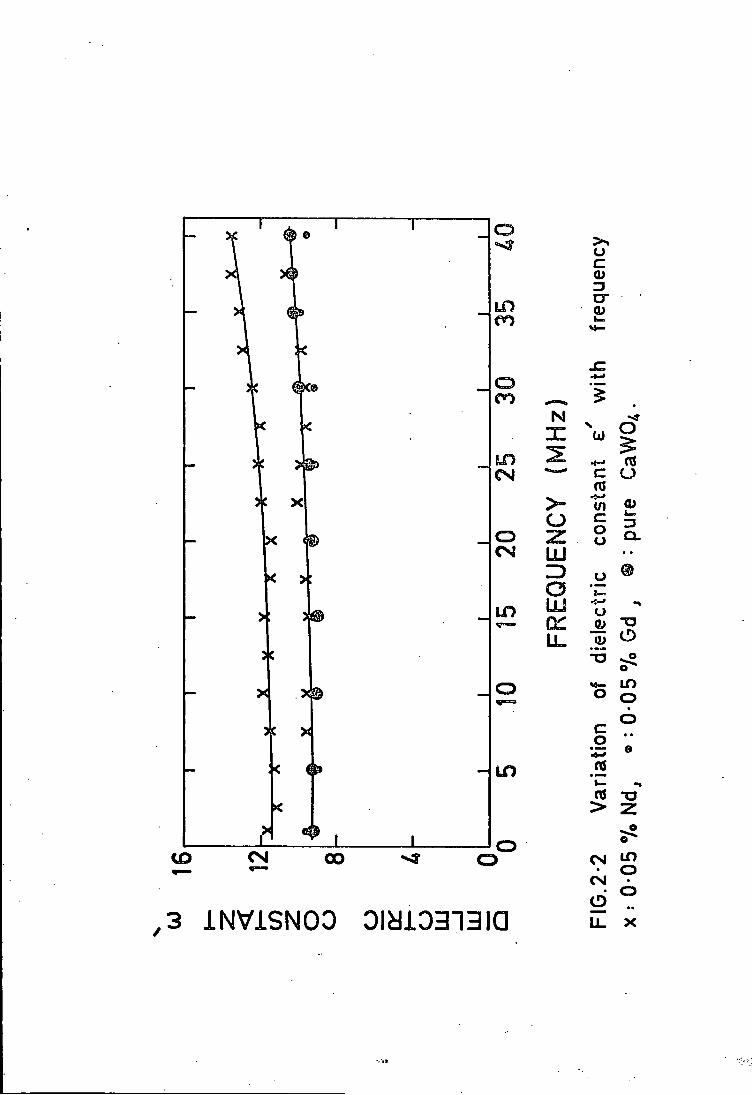
The v a r i a t i o n of the d i e l e c t r i c constants at frequencies above
1 MHz i s shown i n Figure 2.2. A very s l i g h t increase i n both e 1 and E 1
a c was observed above about 20 MHz to 40 MHz, but the anisotropy of the d i e l e c t r i c constant, as measured by the r a t i o e*/e' remained unaltered.
a c There was no s i g n i f i c a n t difference between the behaviour of the pure
calcium tungstate crystals and the neodymium- or gadolinium-doped specimens.
With regard to the d i e l e c t r i c loss, tan 6, f o r pure calcium
tungstate increased slowly from 0.005 at 1 MHz to about 0.01 at 40 MHz.
s id U
1 u •a 2
s Id u 0) M 3 ft
u c CD U m
5* •H <U 04 > O Q)
H id c •r! s o c
tJ> r-i c a; •H > Di a> o H Q
t O +1
• o +i
00
o +1
00 *~t
dp in o
tfp
o
o
o o o +1 +1 +1 in m •sr CTi cn a i
• o
• o
• o
+1 +i •l-l in in H i—I «H *H •H
<#> d? tip in o
CM • O
+1 in
o +i
• • o o +1 +1
CM
H G «j id
fa X +» u a> •d o
G > id
•H +J T) u c C
we
a) id w
e
(0 pj o (U Q n u cq
o o •a o
id
I u •a
s id U M 0
in
U) •IJ G id +J ui G O o u •H u CD H CD •H Q
CM 0) H
EH
• +J id
G •H
G CD > •H Cn
a' >
a •H
& n3 •H Id
G •rJ N e
id
c 0» c r
•*->
vvi
N X U) O
*—- c O •!-» <u
o Z3 o u ex. LU
o O IJJ o ( r T 3 LL .Si O
**— in o o
o c o o i _ •» ns •o >
3 INVISNOO 0iaiD313ia
CM o CM • • o O
* •
LL X

- 21 -
In contrast t o the anisotropy of the d i e l e c t r i c constant, the losses
measured p a r a l l e l to the a- and c-axes were the same. With both
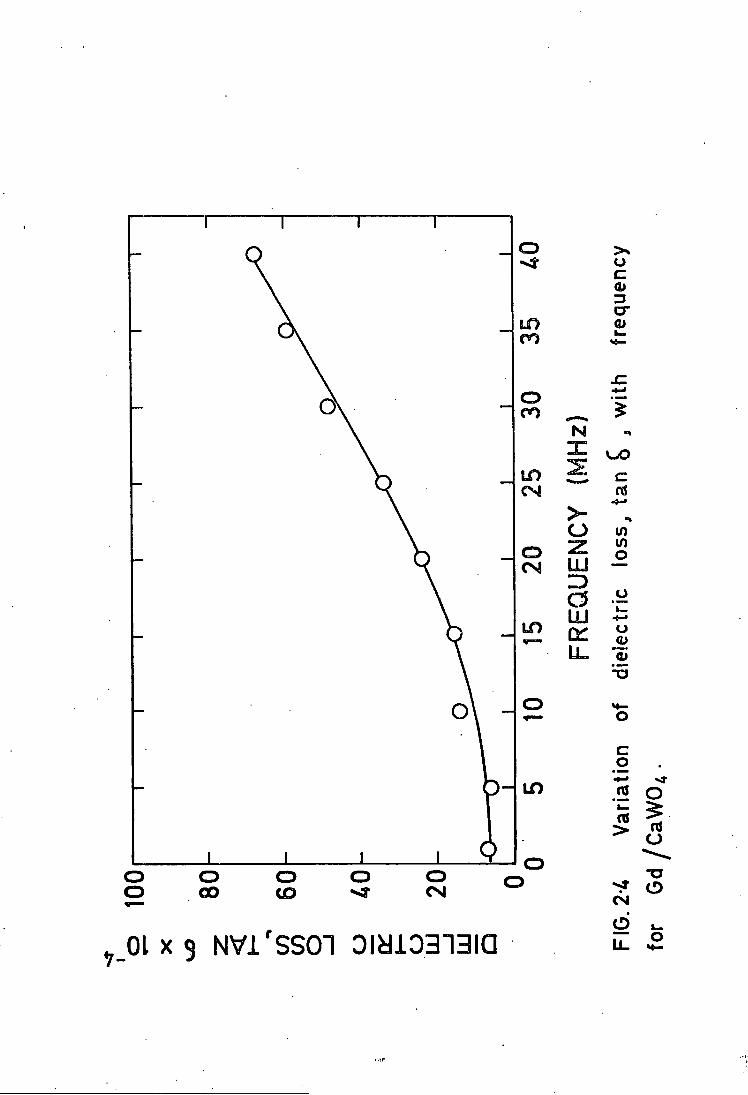
neodymium- and gadolinium-doped c r y s t a l s , similar increases i n loss at
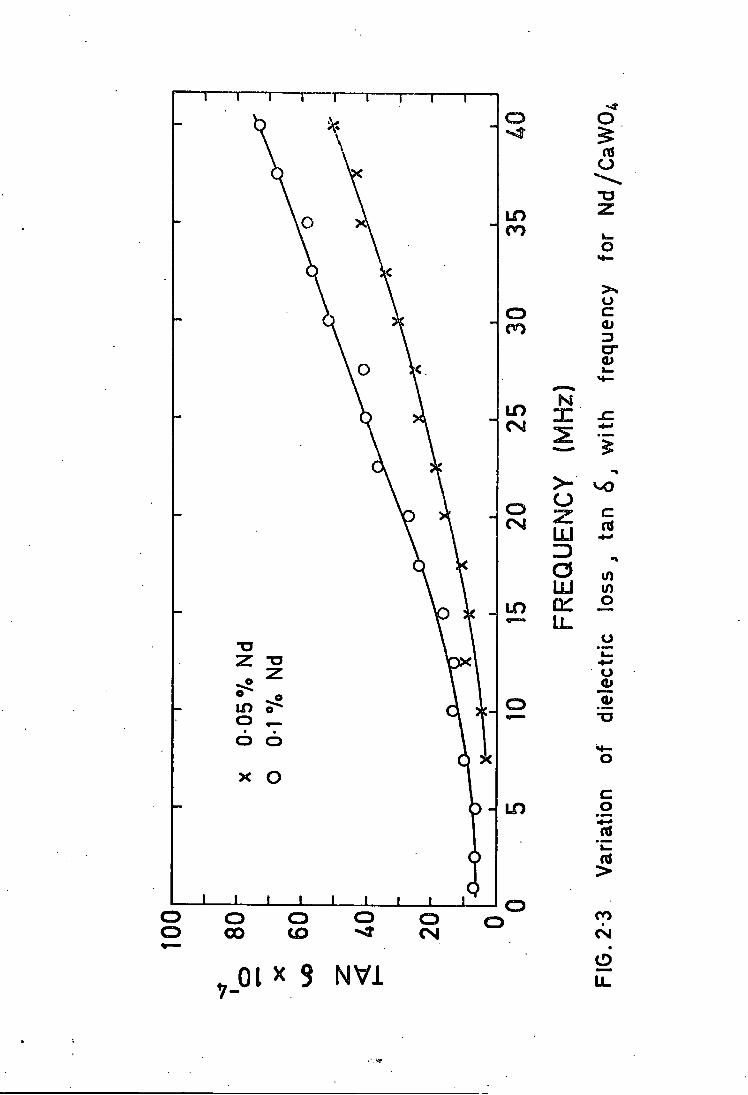
the higher frequencies were observed (Figures 2.3 and 2 . 4 ) . The measure
ments on the doped crystals also showed t h a t , above about 20 MHz, the
d i e l e c t r i c loss was larger the higher the dopant concentration. With
heodymium doping the e f f e c t was quite marked; the true neodymium con
centrations i n these specimens were determined by o p t i c a l spectrographic
analysis (The Chemical Inspectorate) and, as Figure 2.3 shows, the loss -3 -3
at 40 MHz increased from 4 .5 x 10 to 7.2 x 10 as the concentration
rose from 0.05% Nd to 0.1% Nd. In the gadolinium-doped specimens, the
e f f e c t was not so marked, probably because the true gadolinium concentra
tions were a l l very low, ^ 5 0 p.p .u i . , and the differences between the
specimens were not so pronounced. (The analyses were made by emission
spectro-chemistry by the Analyt i c a l Services Laboratory, Imperial College).
• I t was also found, as with the pure material, that i n a l l the doped
specimens examined, the d i e l e c t r i c loss p a r a l l e l to the a-axis was the
same as that measured p a r a l l e l t o the c-axis.
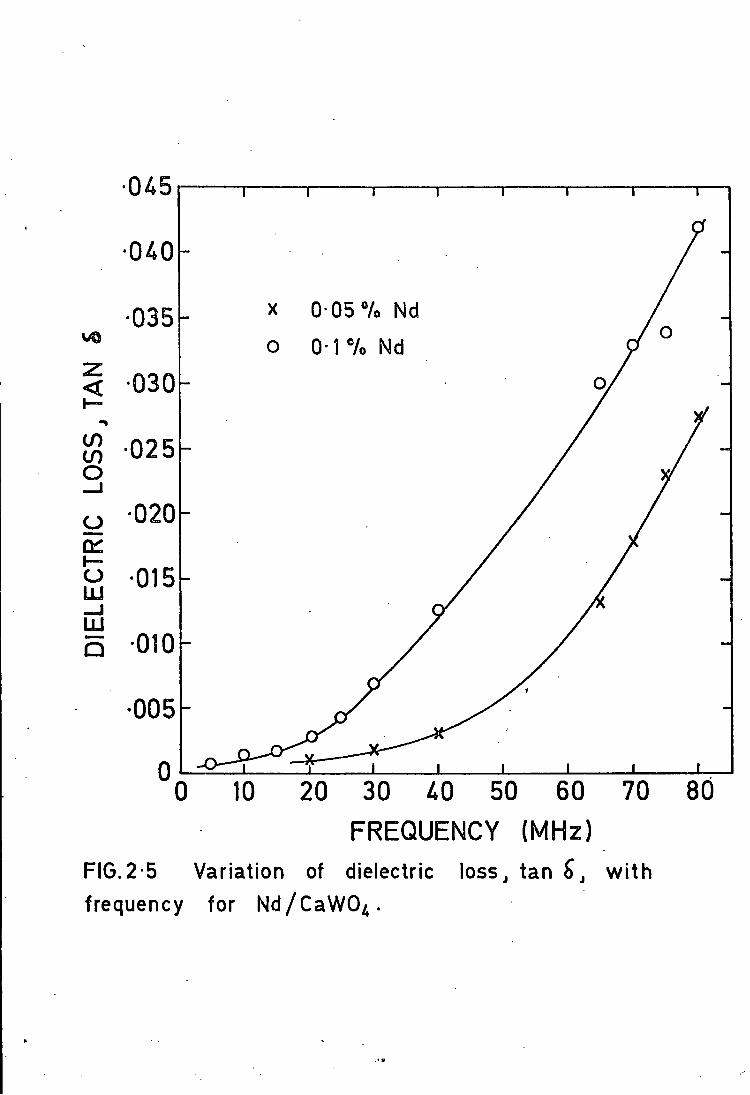
Measurements of the d i e l e c t r i c loss, tan 6 , were extended to
80 MHz for the neodymium-doped samples with concentrations of 0.05% and
0.1% Nd, Figure 2 . 5 . The increase of tan 6 with frequency continued
showing th a t tan <5 at 80 MHz had increased about f i v e times t h a t at 40 MHz.
2.5 Discussion
Considering f i r s t the pure calcium tungstate single c r y s t a l s ,
the measured values of e* arid e' at 1 MHz (11.3 ± 0.4 and 9 .1 ± 0.4 . a c
respectively)agree very closely with those given by Brower and Fang both as regards the numerical values and i n that e 1 > e'. The measurements
a c
o Hi-rd
\ T 3 Lf> o CO
o CO
<D
N Lf) CN
o CN rd LL
in
IL,
IX) a
L O rd
rd
0 0 CO CN
01 3 NVi LL
o
in
CO N X 2
O 10 in 2 : CM LU
LU
a*
O
I D re O
CN 0 0 CO CN
01x9 n v i ssai omio.3i3ia
"045 I 1 1 1 1 1 1 1 r
040
x 0-05 7o Nd 035 o 0-1 % Nd
< 030 o
CO 025 CO o
020 Of P 015
UJ 010
005
0 20 30 40 50 60 70 80 0 0 0 10 20 30 40 50 60 70 80
FREQUENCY (MHz) FIG.2-5 Variation of dielectric l o s s , tan S, with
frequency for N d / C a W 0 4 .
- 22 -
reported here were made on vacancy compensated crys t a l s , whereas those
of Brower and Fang were made on sodium compensated cr y s t a l s , so i t
appears that the d i e l e c t r i c constants are not very sensitive to d i f
ferences i n growth methods. The present work, shows further that there
i s l i t t l e increase i n either or over the frequency range 1 to 40 MHz.
With regard to the d i e l e c t r i c constants of the doped single
c r y s t a l s , the results showed that doping with neodymium or gadolinium
di d not produce a measureable change i n either e 1 or e 1 ; t h i s conclusion a c
was not unexpected as both the neodymium and gadolinium concentrations
were low and electron spin resonance data reported by Brown et a l , 1974
(7) and by Thorp et a l , 1974 ( 8 ) , had previously confirmed that the rare
earth ions entered the tungstate l a t t i c e s u b s t i t u t i o n a l l y and occupied
calcium site©.
The d i e l e c t r i c loss data, on the other hand, established that
i n the neodymium calcium tungstate, the high frequency values of tan 6
were concentration dependent. This e f f e c t may be associated with Debye
relaxation of the neodyrnium ion, although t h i s has not yet been proved.
Experimentally, the loss measurement i s a more sensitive detector of
small composition changes than the d i e l e c t r i c constant measurement; t h i s
might be useful i n an a n a l y t i c a l context where the application of con
ventional methods, p a r t i c u l a r l y f o r gadolinium, i s d i f f i c u l t . '
- 23 -
CHAPTER 3
SITE OCCUPATION BY GADOLINIUM IK CALCIUM TUNGSTATE
3.1 The Crystal Structure
Calcium tungstate, 'scheelite', c r y s t a l l i z e s i n the tetragonal 6
system ( 1 ) and has a space group C (14^/a) with four molecules to
the u n i t c e l l ( 2 ) . The l a t t i c e parameters are a = b = 5.243 A* and
c = 11.376 A\ Figurs 3.1 shows the u n i t c e l l with the oxygen atoms
omitted f o r c l a r i t y . The u n i t c e l l may be devided i n t o four horizontal
( 0 0 1 ) layers of equal stacking density. Arbel and Stokes (3) reported
that cleavage and s l i p occur p a r a l l e l to these layers i n CaWO . Each
calcium atom i s surrounded by eight oxygen atoms at an average distance
of 2.46 8 i n the shape of a dist o r t e d cube. The. four calcium s i t e s
are equivalent i n p a i r s , one pair being derived from the other by body
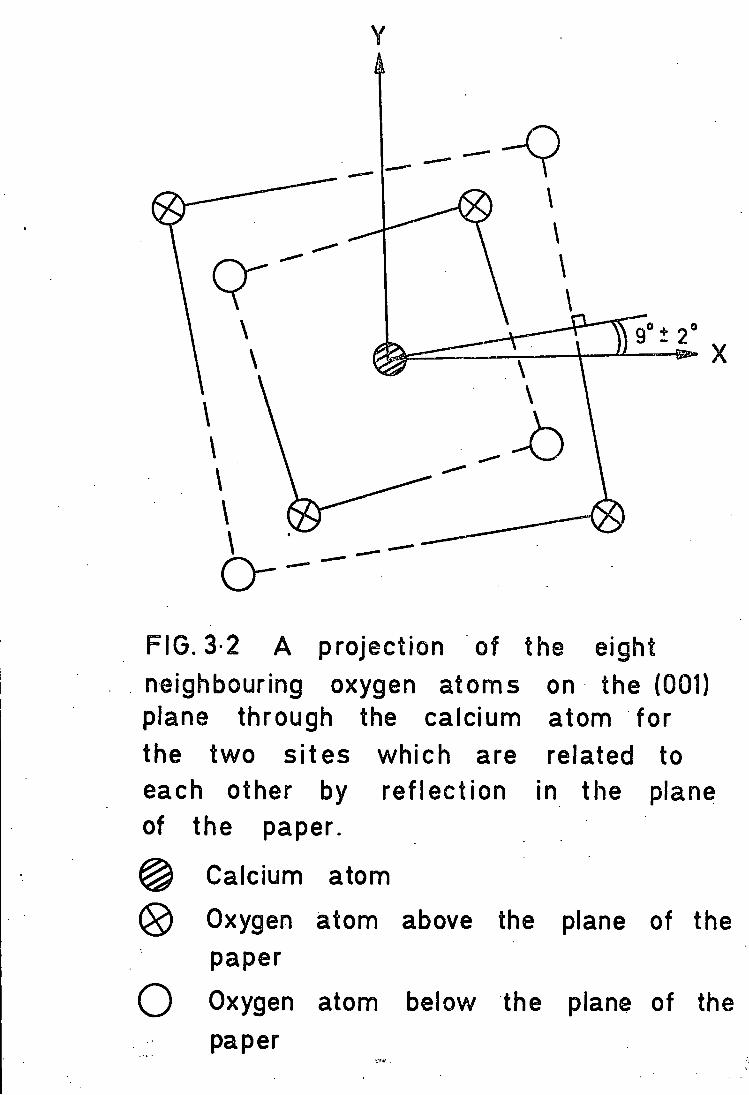
centering about a calcium s i t e as reflected i n the ( 0 0 1 ) plane. This
i s shown i n the projection of the eight oXygen atoms on the ( 0 0 1 ) plane
through the calcium atom for tho two s i t e s . Figure 3.2. The tungsten
atcm i s surrounded by four oxygen atoms i n the same WO group as nearly
-regular tetrahedral (4) with bonding distance 1.784 A. The s i t e symmetry
of both the Ca and W atoms i n CaWO i s S . The di s t o r t e d cube of oxygen
atoms surrounding the Ca^+ s i t e i s twisted at an angle of about 9 ° - 2°
from the u n i t c e l l a-axes i n the ( 0 0 1 ) plane. These surrounding oxygens 2+
provide, the framework of the cr y s t a l f i e l d symmetry at the Ca s i t e ,
the d i r e c t i o n of which was f i r s t determined by Hempstead and Bowers (2)
and was confirmed recently by Buckley ( 5 ) . This property was used to
i d e n t i f y the sense of the + 2 axis i n Gd/Ca.W0 crystals f o r alignment
i n ultrasonic experiments made by Farley ( 6 ) -

• 9 71 X
o 7 o A o Id e
b fit
a = b=5-243A c = 11-376A
V x
F IG . 3 1 The unit cell of C a W 0 4
(Scheelite ) with the oxygen atoms
omitted for clarity.
O Calcium atom
x Tungsten atom
-<?
- 6
Cr FIG. 3-2 A projection of the eight neighbouring oxygen a toms on - the (001) plane through the calcium atom for the two s i t e s which are related to each other by reflection in the plane of the paper.
Calcium atom
Oxygen atom above the plane of the paper
Oxygen atom below the plane of the paper
o

- 24 -
3.2' Crystal Growth
Single c r y s t a l boules of CaWO doped with Gd were grown by the
Czochralski technique (7) by I.R.D. Ltd., Newcastle upon Tyne, with
the c-direction along the growth axis. I t had been reported by Nassau
and Broyer .(8) that the melting point was about 1600°C and t h i s tem
perature was used f o r growth. Gadolinium was added i n the form of the
oxide G d2°3 t o t h e powdered calcium tungstate. In p u l l i n g from the
melt, t r i v a l e n t rare earths can be incorporated without the presence
of a univalent ion by vacancy compensation. As a rare earth ion,
gadolinium substitutes at the calcium sites (8) giving r i s e to one
calcium vacancy f o r each pai r of gadolinium ions to maintain l o c a l •i- 3+
charge n e u t r a l i t y . A l t e r n a t i v e l y Na or Y might have been used fo r
charge compensation, as well as other monovalent and t r i v a l e n t ions;
these two icns are especially convenient since they are not paramagnetic» 2+ o + o are very close to the r i g h t size (Ca radius i s 0.99 A, Na i s 0.94 A
3+ o . and Y i s 0.92 A), and have suitably low v o l a t i l i t i e s . However, a l l
the specimens used here were vacancy compensated. The nominal doping
levels used were 0.005, 0.01 and 0.05 atomic per cent, although
independent analysis (by the Analytical Services Laboratory, Imperial
College) showed that the actual levels were a l l less than about 100
p.p.m. This concentration l e v e l i s well below that at which substitu
t i o n at W sit e s has been reported by Kedzie and Kestigian ( 9 ) . The
very compact nature of the structure of CaWO makes the i n t e r s t i t i a l
s i t e s very u n l i k e l y . Thus, i n the material examined the strongest
p r o b a b i l i t y i s that the gadolinium would have entered the l a t t i c e
s u b s t i t u t i o n a l . ^ at calcium s i t e s .
3-3 The Energy Levels of Gd i n CaW04
The t r i v a l e n t gadolinium ion has seven unpaired electrons i n

- 25 -
the 4f u n f i l l e d s h e l l which make i t h a l f - f i l l e d and give r i s e to a 7 8
ground state (4f ) S . In a host l a t t i c e the gadolinium ions w i l l 7 2
be subjected to a cr y s t a l f i e l d whose symmetry and order of magnitude
depends largely on the surrounding environment. As an S-state ion
gadolinium•should e x h i b i t no f i r s t order c r y s t a l f i e l d s u l i t t i n g f a
feature discussed by Bleaney and Stevens (10). However, the ESK
experiments have shown that small s p l i t t i n g s do e x i s t . The magnitudes
of the i n i t i a l s p l i t t i n g s of Gd"*+ ions i n crystals of the scheelite
series were reported by Vinokurov et a l ( 11 ) . They gave c r y s t a l f i e l d o - 4 - 1 s p l i t t i n g constants b 2 f o r Gd/CaWO at 77 K and 290 K as 916.7 x 10 cm
-4 - 1 and 892.4 x 10 cm respectively. This i s i n exact agreement with the value of b° a t 77 K given by Hempstead and Bowers. I t was also
o shown that a l l the b n values decrease on passing froir; CaWO to
BaMoO i n the scheelite series. This i s because of the regular
increase i n the u n i t c e l l constants (a and c) with increase i n the
ion i c radius of the corresponding cation. Consequently, the Gd-0
distance i n GdO complex w i l l increase i n an unchanged local f i e l d
symmetry which leads to a f a l l i n the strength of the e l e c t r i c f i e l d
and thus amounts to a decrease i n the b° constants ( 1 1 , 1 2 ) . n
Van Vleck and Penney i n 1934 (13) found that f o r an S-state
ion to e x h i b i t s p l i t t i n g of the energy levels, i t i s necessary to go
to a high order perturbation of the c r y s t a l f i e l d applied to d i r e c t
s p i n - o r b i t interactions. But, Abragam and Pryce i n 1951 (14) concluded
th a t these s p l i t t i n g s were i n f a c t too big to be explained by the
above process. They suggested instead that they are due to a spin-
spin in t e r a c t i o n which also couples o r b i t s with spins, since i t
depends on position variables. Their idea was tha t i n the c r y s t a l
field,.even though the ion i s i n an S-state, there w i l l be some
- 26 -
d i s t o r t i o n of the o r b i t s . This i s supposing th a t instead of the charge
cloud being a perfect sphere i t i s s l i g h t l y e l l i p s o i d a l . Then the
dipole-dipole energy of the spins' varies with t h e i r o r i e n t a t i o n with
respect to the axes of the e l l i p s o i d , and thus the eigenvalues depend
on the spin o r i e n t a t i o n . They were able to put forward convincing
arguments that t h i s i s indeed the correct mechanism. So, i n the
tetragonal f i e l d of calcium tungstate the J - 1/2 state s p l i t s i n t o
four Kramers' doublets and paramagnetic resonance then occurs between
the Zeeman levels of these four doublets. The energy l e v e l diagram
for Gd^+ i n calcium tungstate at Q-band was drawn by Buckley (5)
using s t r a i g h t l i n e extrapolation from that predicted by I-larvey and
Kiefte i n 1971 (15) at X-band frequencies. A convincing f i t i n
Buckley's ESR results and several others, especially those of Dernov-
Pegarev et a l (16) f o r Gd/CaMoO , was attained. The ESR spectrum of
only seven lines for M = 1 t r a n s i t i o n s , which was observed by Thorp
et a l (1974) i n t h e i r study of dipolar broadening mechanism i n
Gd^+/CaWO^, gives a further evidence fo r Gd^+ s u b s t i t u t i o n at Ca^4
s i t e s i n a tetragonal symmetry ( 17 ) .
3.4 The Spin-Hamiltonian
A spin Hamiltonian containing r e l a t i v e l y few terms w i l l give
a complete description of the experimental data when given the r i g h t
size of the coe f f i c i e n t s of these terms together with the directions
of the appropriate axes r e l a t i v e t o the c r y s t a l axes where anisotropy
i s present. The most general form of the spin tlamiltonian contains
terms representing the Zeeman int e r a c t i o n of the magnetic electrons
w i t h an external f i e l d , l e v e l s p l i t t i n g s due to i n d i r e c t effects of
the c r y s t a l f i e l d ^ usually referred to as 'fine s t r u c t u r e ' } hyperfine
- 27 -
structure due to the presence of nuclear magnetic dipolesj quadrupole
moments i n the central ion or i n the ligand ions, and the Zeeman i n t e r
action of the nuclear moments with the external f i e l d . In general,
the spin Hamiltonian can be represented by
B = g 3H . S + D | s 2 - S (S + 1 ) | + E (S 2 - S 2) . (3.1) I z J x y
The f i r s t term gives the in t e r a c t i o n with the applied magnetic f i e l d
and the other two terms arise from c r y s t a l f i e l d ' e ffects. Further
terms must be added i f the ion possesses a resultant nuclear magnetic
moment.
Knowing the structure of CaWO c r y s t a l and the symmetries of the
CaO , Hempstead (2), Vinokurov (11) and Kurkin (12) published the o spin Hamiltonian for Gd/CaWO as
H = g„ 3 H S + g, 3 (H S + H S ) + ~ b° 0° z z . - 1 - x x y y 3 2 2
where z i s i n the c-axis of the c r y s t a l and 5-1/2- To sim p l i f y t h i s
expression the constants were re-written as
*2 / *2 " 3
b 4 / B 4 = b 4 / B 4 = b 6 / B 6 = 6 0 (3.3)
b° / B° = 1260 6 6
and then, the spin Hamiltonian reduced to
- 28 -
H = g B H S + g, fl (H S + H S ) 3 1 1 ^ z z x H x x y Y
+ B° 0° + B° 0° + BJ-OJ + B > % B ! 0* (3.4) 2 2 4 4 4 4 6 6 6 6
where each 0™ i s an operator function having the same transformation
properties as the corresponding spherical harmonic Y , and the
coe f f i c i e n t s are parameters to be determined by the experiment. o o 4 o 4 The parameters g„ , g, , b , b , b , b^ , and br can e f f e c t i v e l y be
determined from the measurements of the gadolinium t r a n s i t i o n s with
the magnetic f i e l d 1-1 p a r a l l e l to the c-axis of the cr y s t a l ( i . e .
G = 0°) and with H perpendicular to the c-axis ( i . e . 9 =• 90°). I t 3+ 2+ i s noticed that for Gd , as well as for Mn (2) the arrangement of
2+ the eight oxygen atoms surrounding the dopant ion, (or the Ca s i t e s ) ,
4 o gives b, ~ 10 b„ which d i f f e r s from that of a cubic environment 4 4 4 o where normally b = 5 b, . This conclusion i s i n agreement with 4 4 Wyckoff's discussion of the c r y s t a l structure referred to i n
Section 3,1.
3.5 Experimental observations of ESR spectra of gadolinium i n
calcium tungstate
When discussing the c r y s t a l structure of CaWO i n Section 3.1, 2+
i t was shown that a l l four possible positions of the Ca i n the u n i t c e l l possess a local c r y s t a l f i e l d symmetry of 5^ and are magnetically equivalent. This leads t o the same single spectrum f o r each paramagnetic ion introduced i n t o the host l a t t i c e . The ESR spectrum of 8
Gd7^^ i n CaWO single crystals was reported by Hempstead and Bowers (2)
as consisting of seven widely spaced strong lines due to AM = ± 1 and
a number of weaker tr a n s i t i o n s corresponding to AM = ± 2 , (such

- 29 -
t r a n s i t i o n s are to be expected as i s so l a r g e as t o be comparable
w i t h g0H). They a l s o observed t h a t other weak l i n e s f l a n k e d the strong 155
ones which r e p r e s e n t the h f s due to the odd Gd i s o t o p e s (Gd 14.7% '
157
abundance; Gd 15 .7%) . Both i s o t o p e s have n u c l e a r s p i n 1 = 3 / 2 and
each h f s component has only about 5% of the i n t e n s i t y of the main l i n e .
Here, we w i l l r egard the AM = ± 1 t r a n s i t i o n s due to the even i s o t o p e s
as " c l e a n " l i n e s . A c l e a n l i n e i s d e f i n e d as one c h a r a c t e r i s t i c of
t e t r a g o n a l symmetry, appearing as a symmetrical, w e l l - b a l a n c e d s i g n a l
on a d e r i v a t i v e output. Such a spectrum i s obtained w i t h the 0.005%
Gd sample, and one of the t r a n s i t i o n s , observed w i t h the magnetic f i e l d
H p a r a l l e l to the c r y s t a l l o g r a p h i c a - a x i s i n the (001) plane ( i . e .
w i t h 0 =90°and = 0 ° ) , i s reproduced i n F i g u r e 3 . 3 . The l i n e i s
" c l e a n " and the t r a n s i t i o n remains s i n g l e a t room temperature, 77 K
and 4 . 2 K. T h i s form of l i n e s h a p e i s a l s o observed f o r a l l the Gd
t r a n s i t i o n s over a wide range of angles <j> except near <)> = 5 5 ° . Near
t h i s angle some d i s t o r t i o n i n l i n e shape- i s observed. T h i s d i s t o r t i o n
becomes more pronounced as we lower the temperature of the sample where
the d i s t o r t i o n seems to be " s p l i t t i n g " i n each t r a n s i t i o n . These
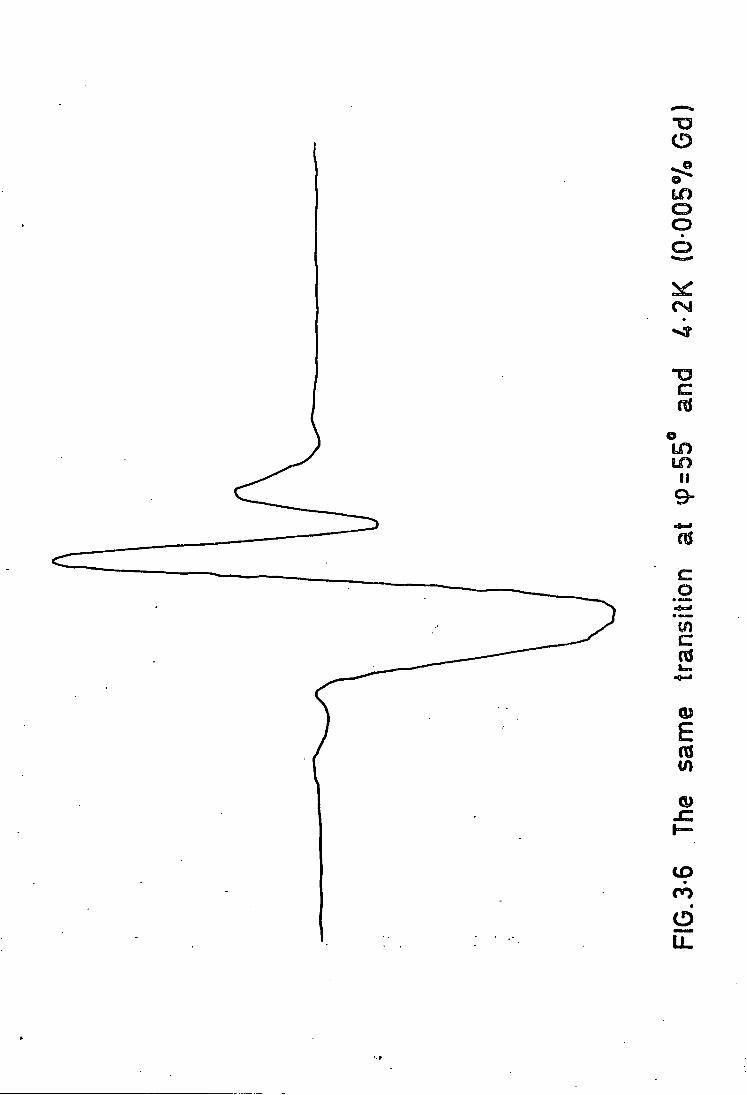
e f f e c t s a re i l l u s t r a t e d by the s p e c t r a shown i n F i g u r e s 3 . 4 , 3.5 and
3 . 6 . The s p l i t t i n g e f f e c t was f i r s t observed i n the f i r s t quadrant o
( i . e . i n the <}> -plane w i t h 0 < <|> < .90 , and + z a x i s i s upwards per
p e n d i c u l a r to the plane of o b s e r v a t i o n ) j measurements were extended
t o the o t h e r quadrants and i t was found t h a t the s p l i t t i n g s a r e very
much more pronounced i n the f i r s t and t h i r d quadrants than i n the
second and f o u r t h . With the h i g h e r c o n c e n t r a t i o n sample (0.05% Gd)
the s p l i t t i n g was observed over a much wider range of angles $ , as
was r e p o r t e d by Buckley ( 5 ) . T h i s i s shown i n F i g u r e 3 . 7 .

(a) <S> = 0° , TEMP =77K
(b) §=0'', TEMP = 4-2K
FIG. 3-3 A "clean" single transition

o
o
CO
C
fi
c o c eg
CO O LL,

O ©
LO O O O
•o c
o Lf> LO
il
i n c
E as 0)
IT) CO O
T 3 O © in o o o •MO
c «j
o Lf> LD II
c o to c
E i n
CO
O

(a) <P = 40
(b) q> =50
(c) <P =60
FIG. 3-7 Splitting observed with 0 0 5 % Gd sample over a wider range of angles 9 .
g -6
Of CO LLI
CO
«*=» O
CD •*-»
O £L CD
CD >
CO >
CD
0) C U
JO) >» u
CD
r - 1 3 CD
CO CSO X3 • rd cn 4_ O ', LL >0
- 30 -
3.6 Comparison with the p r e v i o u s ESR data
The aim of t h i s chapter, as was mentioned e a r l i e r i n
Chapter 1, i s £0 i n v e s t i g a t e the cause and nature of the s p l i t t i n g
i n the Gd main t r a n s i t i o n s observed by Buckley (5) and confirmed by
our r e s u l t s . That i s one of the reasons why we used the same samples
of r e f e r e n c e (5) i n our s t u d i e s . I t i s i n t e r e s t i n g to show t h a t the
shapes of the d e r i v a t i v e s p r e s e n t e d here as F i g u r e s 4 - 7 are due to
genuine e f f e c t s and they are not, f o r example, due to l a c k i n b a l a n c i n g
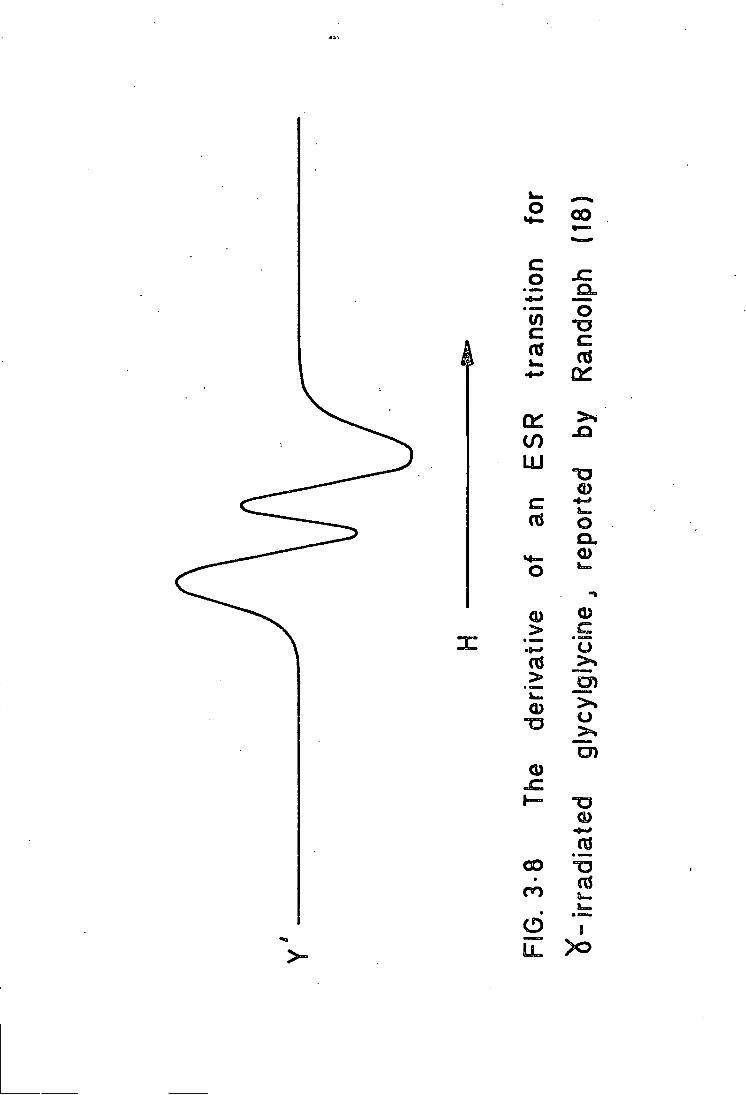
the spectrometer. T h i s could be shown by comparison with F i g u r e 3.0
which shows the d e r i v a t i v e of the fiSR curve of about 1 0 ^ resonant 60
c e n t r e s produced by Co . gamma i r r a d i a t i o n of g l y c y l g l y c i n e r e p o r t e d
by Randolph i n 1960 ( 1 8 ) . However, i t c o u l d not be a matter of
unbalance i n the s i g n a l f o r F i g u r e 3.3 shows t h a t a q u i t e good balance
could be a t t a i n e d i n any c a s e . S e v e r a l workers have s t u d i e d the ESR
•spectra of the r a r e e a r t h ions i n the S c h e e l i t e s e r i e s and we could
f i n d the f o l l o w i n g f e a t u r e s i n t h e i r i n v e s t i g a t i o n s as d e s c r i b e d i n
the next s e c t i o n .
3..6.1 'Anomalous' t r a n s i t i o n s of t r i v a l e n t r a r e e a r t h i c n s i n
s c h e e l i t e s
By 'anomalous' t r a n s i t i o n s we mean any t r a n s i t i o n o t h e r than
the normal e l e c t r o n i c t r a n s i t i o n s f o r which AM = ± 1 i n the ESR s p e c t r a
of r a r e e a r t h i o n s i n s c h e e l i t e s having an u n d i s t o r t e d t e t r a g o n a l
symmetry. Four k i n d s of anomalies.could be e s t a b l i s h e d from the
p r e v i o u s p u b l i s h e d work.
(a) T r a n s i t i o n s due to the v a r i o u s compensation mechanisms f o r the
e x c e s s charge, which a r i s e s from doping the h o s t s c h e e l i t e s w i t h
t r i v a l e n t r a r e e a r t h i o n s , to a c h i e v e charge n e u t r a l i t y . The p u b l i s h e d

- 31 -
ESR data i n d i c a t e d the presence of c e n t r e s of lower symmetry i n a d d i t i o n 3+
to t e t r a g o n a l c e n t r e s . Three nontetragonal c e n t r e s i n the E r doped 3+
samples and two such c e n t r e s i n the Tb doped c r y s t a l s were r e p o r t e d by
Abdulsabirov e t a l i n 1972 ( 1 9 ) . These authors concluded t h a t a l l the
p u b l i s h e d i n f o r m a t i o n on the non t e t r a g o n a l C e ^ + by Mims-Gillen ( 2 0 ) ,
V o l t e r r a - B r o n s t e i n - R o c k n i ( 2 1 ) , N d 3 + by G a r r e t t - M e r r i t t ( 2 2 ) , ( 2 1 ) , and 3+ 3+ Yb by Ranon-Volterra (23) and t h e i r d a t a on the nontetragonal Tb
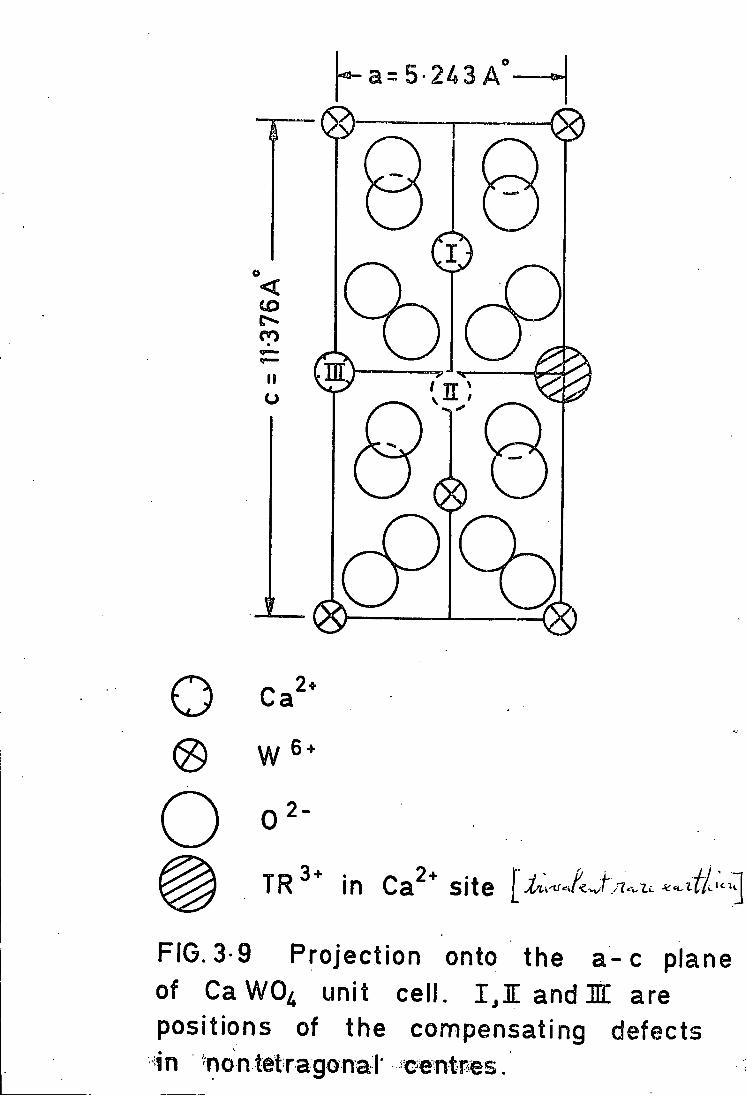
c e n t r e s i n CaWO^ can a l l be i n t e r p r e t e d on the assumption t h a t the com
p e n s a t i n g d e f e c t s a r e l o c a t e d i n one of thre e p o s i t i o n s denoted by I ,
I I , I I I i n the c r y s t a l , F i g u r e 3 . 9 . The 's t r o n g e s t ' nor.t^tragonal c e n t r e s • + 2+
are formed when a compensating d e f e c t , an Na i o n or a Ca vacancy f o r
c r y s t a l s grown w i t h and without sodium compensation r e s p e c t i v e l y i s 2+
l o c a t e d a t the Ca s i t e n e a r e s t t o the t r i v a l e n t i on ( p o s i t i o n I i n
F i g u r e 3 . 9 ) . We a l s o . n o t i c e t h a t these a d d i t i o n a l n o n t e t r a g o n a l c e n t r e s
have d i f f e r e n t parameters and g-valu e s , i n othe r words, they would appear
i n the ESR s p e c t r a a t d i f f e r e n t f i e l d p o s i t i o n s from those of the normal
t e t r a g o n a l t r a n s i t i o n s .
(b) As Kedzie and K e s t i g i a n r e p o r t e d ( 9 ), s u b s t i t u t i o n would occur a t
W H s i t e s a s w e l l as C a ^ + s i t e s w i t h and without adding Na + i o n s f o r
charge compensation. A spectrum of f i v e main l i n e s (plus s m a l l e r l i n e s 3+
due t o h y p e r f i n e s t r u c t u r e ) was observed f o r Nd /CaWO^ c r y s t a l s . The c e n t r a l l i n e of the f i v e t r a n s i t i o n s was the most i n t e n s e and was a t t r i -
3+
buted t o Nd i n the Ca s i t e , w h i l e the four remaining l i n e s were thought
to be due to N d 3 + i o n s i n a W s i t e . Although G a r r e t t and M e r r i t t (22)
and Ranon and V o l t e r r a (23) found t h a t the chemical evidence argues
s t r o n g l y f o r the s u b s t i t u t i o n of N d 3 + i n Ca s i t e s , we s t i l l r e g a r d sub
s t i t u t i o n of r a r e e a r t h i o n s i n W s i t e s as a source f o r anomalous t r a n
s i t i o n s . . I n f a c t , s u b s t i t u t i o n i n W s i t e s , whenever i t o c c u r s , w i l l g i v e
o
a= 5-2-43 A
O C a 2 *
0
6 +
2-
T R ^ + in C a + s i t e [ Xn,^J<^t.n^ * «*- *tL1 c ^
FIG. 3-9 Projection onto the a - c plane of C a W 0 4 unit cel l . 1 ,1 and I E are positions of the compensating defects 4n <non tetragonal -^entves.
- 32 -
t
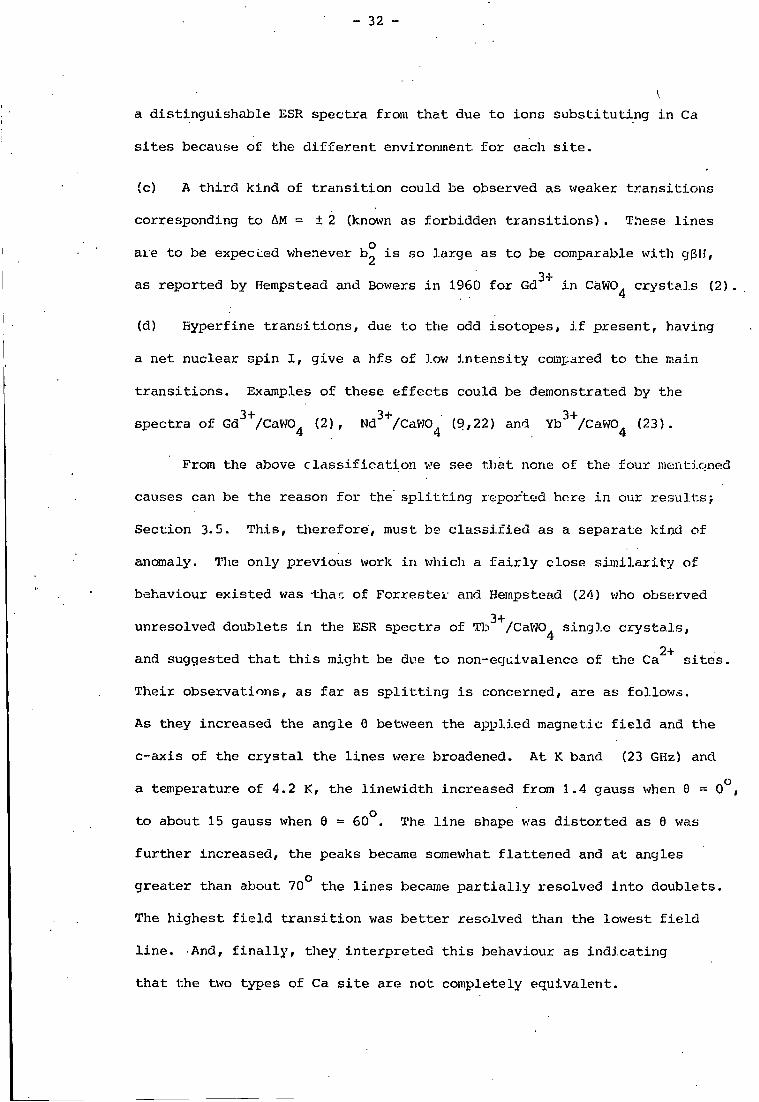
a d i s t i n g u i s h a b l e ESR s p e c t r a from t h a t due to io n s s u b s t i t u t i n g i n Ca
s i t e s because of the d i f f e r e n t environment f o r each s i t e .
(c) A t h i r d k i n d of t r a n s i t i o n could be observed as weaker t r a n s i t i o n s
corresponding to AM = ± 2 (known as forbidden t r a n s i t i o n s ) . These l i n e s o
are to be expected whenever i s so l a r g e as to be comparable with 3 T
as r e p o r t e d by Hempstead and Bowers i n 1960 f o r Gd T i n CaWO^ c r y s t a l s ( 2 ) .
(d) Hyperfine t r a n s i t i o n s , due to the odd i s o t o p e s , i f p r e s e n t , having
a net n u c l e a r s p i n I , g i v e a h f s of low i n t e n s i t y compared to the main
t r a n s i t i o n s . Examples of these e f f e c t s could be demonstrated by the
s p e c t r a of Gd 3 +/CaV70 ( 2 ) , Nd3+/CaWO (9 ,22) and Yb 3 +/CaWO ( 2 3 ) .
From the above c l a s s i f i c a t i o n we see t h a t none of the four mentioned
causes can be the reason f o r the s p l i t t i n g r e p o r t e d here i n our r e s u l t s ;
S e c t i o n 3 . 5 . T h i s , t h e r e f o r e , must be c l a s s i f i e d as a se p a r a t e k i n d of
anomaly. The onl y p r e v i o u s work i n which a f a i r l y c l o s e s i m i l a r i t y of
behaviour e x i s t e d was -thac of F o r r e s t e r and Hempstead (24) who observed
u n r e s o l v e d doublets i n the ESR s p e c t r a of TJ:>3+/CaWO^ s i n g l e c r y s t a l s , 2+
and suggested t h a t t h i s might be due to non-equivalence of the Ca s i t e s .
T h e i r o b s e r v a t i o n s , a s f a r as s p l i t t i n g i s concerned, a r e as f o l l o w s .
As they i n c r e a s e d the angle 8 between the a p p l i e d magnetic f i e l d and the
c - a x i s of the c r y s t a l the l i n e s were broadened. A t K band (23 GHz) and
a temperature of 4 . 2 K, the l i n e w i d t h i n c r e a s e d from 1.4 gauss when 0 = 0 ° ,
to about 15 gauss when 0 = 6 0 ° . The l i n e shape was d i s t o r t e d as 8 was
f u r t h e r i n c r e a s e d , the peaks became somewhat f l a t t e n e d and a t angles
g r e a t e r than about 7 0 ° the l i n e s became p a r t i a l l y r e s o l v e d i n t o d o u b l e t s .
The h i g h e s t f i e l d t r a n s i t i o n was b e t t e r r e s o l v e d than the lowest f i e l d
l i n e . And, f i n a l l y , they i n t e r p r e t e d t h i s behaviour as i n d i c a t i n g
t h a t the two types of Ca s i t e a r e not completely e q u i v a l e n t .

- 33 -
3.7 I n t e r p r e t a t i o n of p r e s e n t r e s u l t s
We attempted t o . r e s o l v e our d e r i v a t i v e curves i n t o s e p a r a t e
a b s o r p t i o n peaks i n order to g e t more i n f o r m a t i o n about the ' e x t r a com-'
ponent'. T h i s was done by i n t e g r a t i n g fy dx, where y i s the o r d i n a t e
of the d e r i v a t i v e curve and dx i s a s m a l l , a r b i t r a r y , increment of mag
n e t i c f i e l d . The r e s u l t s d e p i c t e d i n F i g u r e s 3 .10 and 3.11 show the
c a l c u l a t e d a b s o r p t i o n c u r v e s f o r the d e r i v a t i v e s i n F i g u r e s 3 . 6 and 3 . 5 ,
r e s p e c t i v e l y . I t i s unfortunate t h a t we couJd not get s i g n i f i c a n t
i n f o r m a t i o n about the s e p a r a t i o n of the a b s o r p t i o n peaks o r . t h e i r i n t e n
s i t i e s f o r they a r e , i n most c a s e s , u n r e s o l v e d . However, from our e x p e r i
mental d a t a we have two important f e a t u r e s which might s e r v e as c l u e s
to a c o r r e c t i n t e r p r e t a t i o n .
li) The o c c u r r e n c e of s p l i t t i n g a t s p e c i f i c angles i n the <j>-pla.ne;
t h i s should draw the a t t e n t i o n to the u n i t c e l l s t r u c t u r e to i n s p e c t the
c r y s t a l a t t h e s e a n g l e s .
( i i ) The r e l a t i v e i n c r e a s e i n the s i g n a l of the ' e x t r a component'
compared w i t h the main t r a n s i t i o n as we reduce the temperature from 290 K
to 4 . 2 K, which i n d i c a t e s t h a t the dependence on temperature f o r the two
components i s not e x a c t l y s i m i l a r .
Thus, to s o l v e t h i s problem two p o s s i b i l i t i e s a r i s e : -
(a) We suggest t h a t some of the Gd^ + i o n s may have s l i g h t l y d e f e c t e d
s i t e s which would not d i s t u r b the c r y s t a l f i e l d symmetry r a d i c a l l y i n
t h e i r v i c i n i t y , but cause the t r a n s i t i o n s to s h i f t s l i g h t l y on the f i e l d
a x i s . I f we examine the u n i t c e l l of CaWO^ we see i n the (001) plane;
((j> p l a n e ) , F i g u r e 3 .12 as reported by F a r l e y , Saunders and Chung ( 2 5 ) ,
t h a t the n e a r e s t neighbours to a Ca s i t e a t an angle <(i about 5 0 ° are
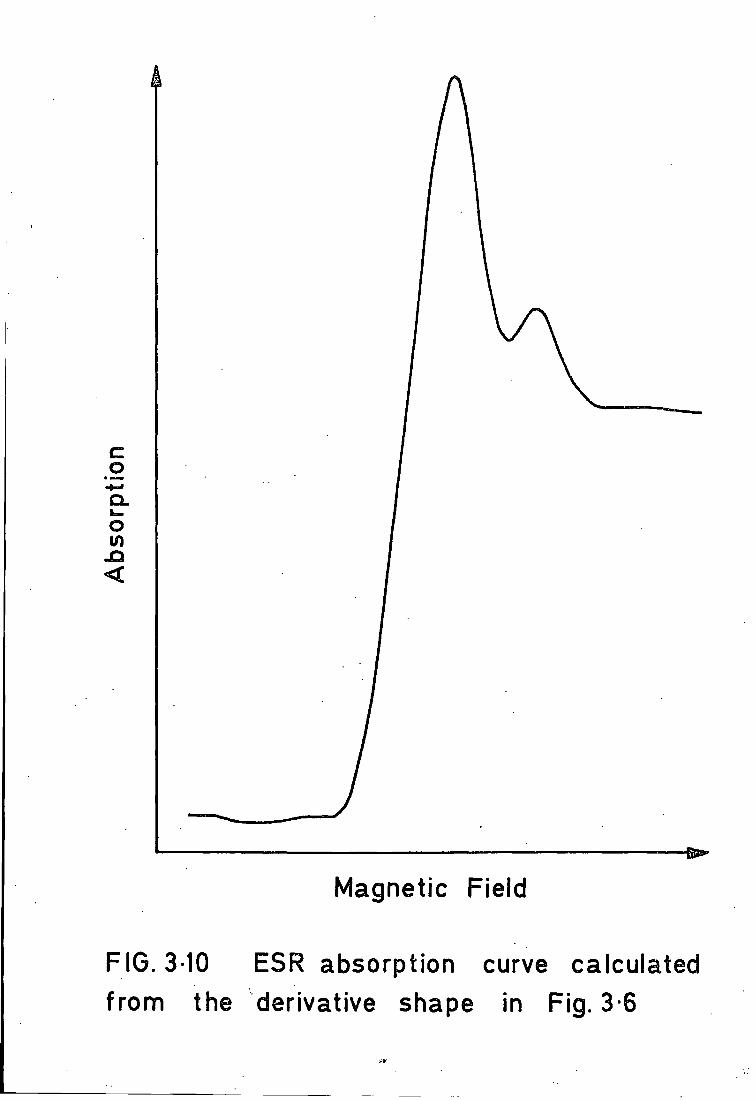
Magnetic Field
F IG . 3-10 E S R absorption curve calculated from the derivative shape in Fig. 3-6
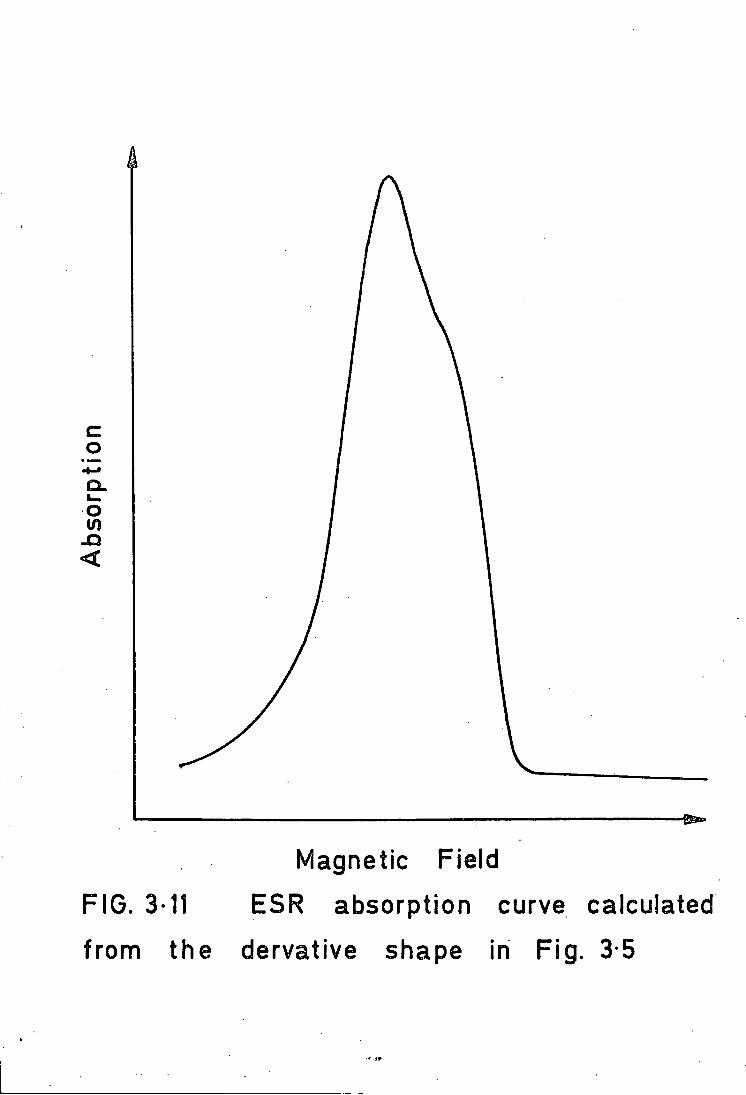
Magnetic Field
F I G . 3-11 E S R absorption curve calculated
from the dervative shape in F ig . 3-5
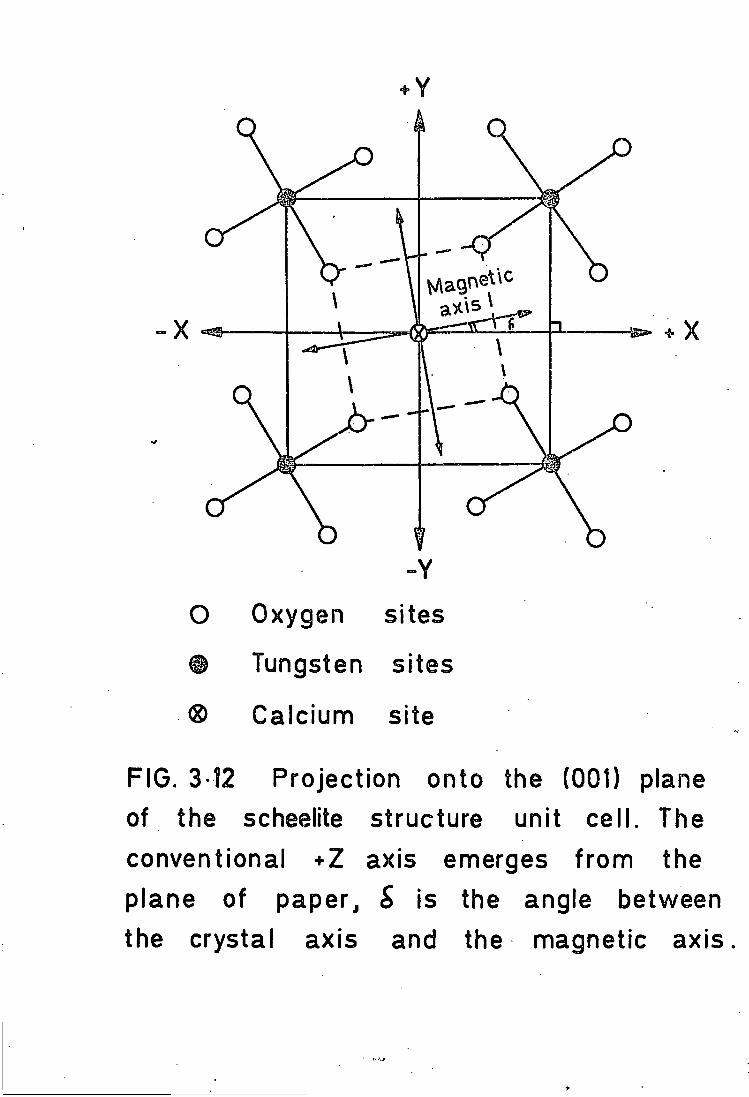
K X "^r tm* + X
\
1
O Oxygen si tes
® Tungsten s i tes
® Calcium site
F IG. 3-12 Projection onto the (001) plane
of the scheelite structure unit ce l l . The
conventional +Z axis emerges from the
plane of paper , S is the angle between
the crystal ax is and the magnetic axis
- 34 -
oxygen i o n s . Knowing t h a t the oxygen i o n s provide the framework of the
c r y s t a l f i e l d symmetry a t the Ca s i t e we should expect some change i n
c r y s t a l f i e l d due to oxygen v a c a n c i e s . I n e f f e c t , we propose an ordered'
oxygen vacancy model. By t h i s model we can a l s o understand the behaviour
of the " e x t r a component" w i t h temperature. As we reduce the temperature
the p o s s i b i l i t y f o r t h e s e oxygen v a c a n c i e s to s e t t l e i n an ordered form
i n c r e a s e s and t h i s l e a d s t o a corresponding i n c r e a s e i n the s i g n a l from 3+
the Gd io n s i n defected s i t e s . T h i s may e x p l a i n the r e l a t i v e i n c r e a s e
i n the s i g n a l of the " e x t r a component" as the temperature d e c r e a s e s . (b) Another p o s s i b i l i t y l i e s i n the i n t e r p r e t a t i o n of F o r r e s t e r and
Hempstead (24) of t h e i r r e s u l t s on Tb^' i n CaWO^, which i s mentioned above
i n S e c t i o n 3 . 6 . 1 . Consequently, we may conclude t h a t the d i s t o r t i o n of ' 3+
the Gd i n CaWO^ which we are r e p o r t i n g i s probably an i n d i c a t i o n t h a t
the two types of Ca s i t e s a r e not completely e q u i v a l e n t .
I n f a c t , we favour v e r y much the f i r s t s uggestion which needs
s t i l l more experimental work to t e s t i t s v a l i d i t y . The second p r o b a b i l i t y ,
however, could be excluded because i t i s a ve r y w e l l e s t a b l i s h e d f a c t t h a t
the four p o s s i b l e p o s i t i o n s of Ca s i t e s i n the u n i t c e l l of CaWO^ when
s u b s t i t u t e d by paramagnetic i o n s , l e a d to i d e n t i c a l paramagnetic resonance
as was f i r s t i n d i c a t e d by Hempstead and Bowers (2) and confirmed by a l l
other workers i n t h e i r s t u d i e s on s c h e e l i t e s .
3.7 .1 Heat-treatments of Gd/CaWO^ samples i n oxygen ambient
and t h e i r i n t e r p r e t a t i o n
We found i t n e c e s s a r y to h e a t t r e a t our samples i n oxygen atmos
phere i n order to e s t a b l i s h the ordered-oxygen vacancy model. Our aim was
to see whether i t i s p o s s i b l e t o f i l l the proposed v a c a n c i e s w i t h oxygen

- 35 -
from o u t s i d e the c r y s t a l , i n which case we would expect the observed
d i s t o r t i o n to v a n i s h , or a t l e a s t t o reduce. The furnace used i n t h e s e
h e a t treatments was b u i l t by W. Button and could reach a maximum tem
p e r a t u r e of about 1200°C. The 0.005% Gd sample was put t o t h i s t e s t ,
f i r s t l y f o r 1 hour a t 1000°C, secondly f o r 40 hours a t 1000°C,and t h i r d l y
f o r 40 hours a t 1200°C. The r e s u l t s of t h e s e h e a t treatment experiments
were as f o l l o w s . A f t e r the f i r s t experiment t h e r e was no change i n the
ESR behaviour of the sample. The change came a f t e r the second experiment
and d i s t o r t i o n of the l i n e shape was observed a t a l l angles <|> , ( i t was o '
o r i g i n a l l y l i m i t e d t o angles <j> near 55 ) . No f u r t h e r change was observed a f t e r the t h i r d h e a t treatment of the sample.
Our i n t e r p r e t a t i o n of these r e s u l t s i s t h a t the ejitended h e a t o o
treatments a t 1000 C and 1200 C f a i l e d to reduce the number of oxygen
v a c a n c i e s , and t h a t the consequence was simply a more random d i s t r i b u t i o n
of these v a c a n c i e s . .This manifested i t s e l f i n the p e r s i s t e n t appearance
of s p l i t t i n g , but now a t a l l f i e l d o r i e n t a t i o n s . I t war: decided not to
attempt h i g h e r h e a t treatment temperatures, because of the p o s s i b l e changes
i n the s i n g l e c r y s t a l s t r u c t u r e which could have attended such treatments,
as reported, by Nassau and Broyer (8) . 3+
The s u g g e s t i o n of two s i t e s f o r Gd i n c a l c i u m t u n g s t a t e i s , i n
f a c t , supported by some other experimental o b s e r v a t i o n s . The r e l e v a n t
evidence comes from measurements of s p i n - l a t t i c e r e l a x a t i o n time of the
same samples under i n v e s t i g a t i o n , and i s summarised as f o l l o w s . 3+
( i ) The measurements o f s p i n - l a t t i c e r e l a x a t i o n f o r Gd i n CaWO,
repor t e d by Thorp, Buckley and Brown (26) showed the dependence of T^
on temperature over the range from 1.5 K to 8 K f o r the 0.01% Gd sample
a t <{> = 10°. T h i s was i l l u s t r a t e d by two l i n e s of s l o p e s 1.0, 0.9
- 36 -
i n d i c a t i v e of d i r e c t p r o c e s s of r e l a x a t i o n i n t h i s r e g i o n . These two
l i n e s were a t t r i b u t e d to the two components of Gd t r a n s i t i o n which was
s p l i t and t h e i r s e p a r a t i o n was about 2 mT a t t h a t angle.
( i i ) Our i n v e s t i g a t i o n of T, i n the temperature range 4.2 K t o 30 K 3+ -3
f o r Gd /CaWO^ re p o r t e d i n Chapter 4 le a d s to a T Raman-type of r e l a x a
t i o n . T h i s suggests the e x i s t e n c e of a. s u b s t a n t i a l number of d e f e c t s
which may l e a d to d e f e c t e d Gd s i t e s , although the e x a c t nature of these
d e f e c t s i s not y e t f u l l y r e s o l v e d .
- 37 -
CHAPTER 4
SPIN-LATTICE RELAXATION IN GADOLINIUM-DOPED CALCIUM TUNGSTATE
4.1 ,Theories of s p i n - l a t t i c e r e l a x a t i o n
Before the d i s c o v e r y of magnetic resonance (by E. Zavoisky i n 1944) ,
W a l l e r i n 1932 ( 1 ) , by measuring s u s c e p t i b i l i t y a t low frequency, suggested
t h a t the s p i n and o r b i t a l angular momenta of a paramagnetic i o n were com
p l e t e l y decoupled, and t h a t the s p i n was i n f l u e n c e d by the l a t t i c e v i b r a
t i o n s (phonons) only by t h e i r modulation of the d i p o l a r c o u p l i n g . T h at
i s to say, the l o c a l magnetic f i e l d , Which e x i s t s a t one i o n because of
the magnetic d i p o l e on a neighbouring i o n , f l u c t u a t e s due t o f l u c t u a t i o n s
of the d i s t a n c e between the two i o n s under -the a c t i o n of the l a t t i c e v i b r a
t i o n s . The r e s u l t i n g r e l a x a t i o n time was too long to e x p l a i n the e x p e r i
mental r e s u l t s of the Leiden groups G o r t e r 1936 ( 2 ) , or the more r e c e n t
ESR s t u d i e s . However, W a l l e r ' s p o s t u l a t e s were the f i r s t advances i n
t h i s f i e l d - , he d i s t i n g u i s h e d s p i n - s p i n from s p i n - l a t t i c e r e l a x a t i o n ,
recognized the p r i n c i p a l types of t r a n s i t i o n , p r o c e s s e s concerned i n the
l a t t e r (now known as d i r e c t and Raman p r o c e s s e s ) and s e t up the quantum
mechanical framework f o r the c a l c u l a t i o n of t h e i r p r o b a b i l i t i e s .
Kronig (3) and Van V l e c k (4,5) independently suggested t h a t t h e r e
i s no d i r e c t i n t e r a c t i o n between the phonon v i b r a t i o n s of a c r y s t a l l a t t i c e
and the paramagnetic energy l e v e l s of an atomic s p i n i n the l a t t i c e . T h e i r
mechanism i s t h a t when the l a t t i c e v i b r a t e s the o r b i t a l motion undergoes
p e r i o d i c changes due to v i b r a t i o n s i n the c r y s t a l l i n e e l e c t r i c f i e l d s .
These changes r e a c t on the s p i n s through the s p i n - o r b i t i n t e r a c t i o n , and
thereby a l t e r t h e i r o r i e n t a t i o n i n the e x t e r n a l magnetic f i e l d . The s p i n
l e v e l s are thus, i n d i r e c t l y connected to the l a t t i c e v i b r a t i o n s , and quanta
of energy can be exchanged between the two. The agreement w i t h the e x p e r i
mental data then i n e x i s t e n c e , (Gorter and h i s c o - w o r k e r s ) , was d i s a p p o i n t i n g ,
- 38 -
e s p e c i a l l y i n t h a t the observed dependence on the temperature and on the
s t r e n g t h of the a p p l i e d magnetic f i e l d was not as p r e d i c t e d . A l s o ,
according to Kronig and Van V l e c k , the s p i n - l a t t i c e r e l a x a t i o n time of a
s p i n should be independent of the s p i n - d e n s i t y , s i n c e the p r o c e s s i n v o l v e s
only the i n d i v i d u a l s p i n and the surrounding l a t t i c e , and not any other •
s p i n s which may be p r e s e n t . Consequently, i t i s concluded t h a t the Kro n i g -
Van V l e c k theory seems to be v a l i d only a t v e r y low s p i n c o n c e n t r a t i o n s ,
much s m a l l e r than those g e n e r a l l y used i n p r a c t i c a l maser c r y s t a l s ,
Paxman (6) and Zverev ( 7 ) .
According to the d e t a i l e d theory, worked out by Kronig and Van Vl e c k
t h e r e should be two c o n t r i b u t i o n s t o the r e l a x a t i o n r a t e . The f i r s t , i s
from a " d i r e c t p r o c e s s " i n which the s p i n r e l a x e s i n e i t h e r d i r e c t i o n , by
e m i t t i n g or absorbing a s i n g l e phonon a t the s p i n t r a n s i t i o n frequency.
The second c o n t r i b u t i o n i s from an " i n d i r e c t " or "Raman" p r o c e s s i n which
a much hi g h e r frequency l a t t i c e - p h o n o n i s s c a t t e r e d by a s p i n and, thus,
changing i t s frequency be enough to absorb the r e l a x a t i o n energy from the.
s p i n . The d i r e c t p r o c e s s should predominate a t l i q u i d helium temperatures,
and somewhere above these temperatures the Raman mechanism should become
s i g n i f i c a n t . One of the aims of t h i s c h a p t e r i s to i n v e s t i g a t e these
f e a t u r e s i n Gd3+/CaWOJ1. 4
Another important theory i n v o l v i n g two-phonon p r o c e s s was
suggested by Orbach (8) and v e r i f i e d e x p e r i m e n t a l l y by F i n n , Orbach and
Wolf i n 1961 (9) and by Manenkov and Prokhorov i n 1962 ( 1 0 ) . The theo
r e t i c a l treatment i s a p p r o p r i a t e to r a r e e a r t h i o n s and l e a d s to p r e d i c t i o n s
which agree both w i t h the e x p e r i m e n t a l l y observed temperature dependence
and w i t h the magnitude of the r e l a x a t i o n time. The dominant r e l a x a t i o n
p r o c e s s i s one i n which a phonon of high energy ( > > kT) i s absorbed by
the s p i n system r e s u l t i n g i n a t r a n s i t i o n from one of the ground s t a t e
- 39 -
doublet l e v e l s to the n e a r e s t e x c i t e d l e v e l . Then, i n a s e p a r a t e s t e p ,
another high energy phonon i s emitted and a t r a n s i t i o n i s e f f e c t e d to the
other l e v e l of the ground s t a t e doublet. The n e t r e s u l t of t h i s "two-
s t e p d i r e c t p r o c e s s " i s the r e l a x a t i o n of the ground s t a t e doublet l e v e l s
which b r i n g s the s p i n system towards thermal e q u i l i b r i u m . Some reas o n s
f o r the s u c c e s s i n the a p p l i c a t i o n o f Crbach's theory to the r a r e - e a r t h
i o n s a r e given by Huang (11) \ the s i t u a t i o n i s u n l i k e t h a t a p p l i c a b l e
to i o n s of the i r o n group where the Kronig-V.^n V l e c k treatment i s much
more v a l i d . I n the r a r e e a r t h s , the s p i n - o r b i t c o u p l i n g i s i n g e n e r a l
strong compared w i t h c r y s t a l f i e l d e f f e c t s , ah e f f e c t which i s due to
the " s c r e e n i n g " of the paramagnetic e l e c t r o n s i n the embedded 4f u n f i l l e d
s h e l l . Thus the s t a t e s of an i o n are p r i m a r i l y of the type J L + S,
and, t h e r e f o r e , c o n t a i n non-zero components of o r b i t a l a n g u l a r momentum.
Through t h e o r b i t a l angular momentum d i r e c t i n t e r a c t i o n between the
magnetic s t a t e s and the l a t t i c e v i b r a t i o n s i s p o s s i b l e by means of o r b i t -
l a t t i c e i n t e r a c t i o n s . The magnetic spin i s thus r e l a t i v e l y s t r o n g l y
coupled to the l a t t i c e . F or t h i s reason s p i n - l a t t i c e r e l a x a t i o n times -12
a r e g e n e r a l l y very s h o r t (T^ ~ 10 s e c a t normal temperatures) and low
temperatures (~20 K) a r e o f t e n n e c e s s a r y to e l i m i n a t e s p i n - l a t t i c e
r e l a x a t i o n broadening of paramagnetic resonance a b s o r p t i o n s . 3+ ?+ 3+ 2+ The S - s t a t e i o n s such a s Gd , Eu" , Fe and Mn must be excepted
from the foregoing d i s c u s s i o n s i n c e t h e i r almost t o t a l l a c k of o r b i t a l
momentum ensures t h a t they a r e l i t t l e a f f e c t e d by c r y s t a l f i e l d s . The
spin-degenerate ground s t a t e of the f r e e i o n becomes i n the c r y s t a l a
group of c l o s e l y spaced l e v e l s whose s p l i t t i n g r a r e l y exceeds 1 cm *
and .the l e v e l s immediately h i g h e r , whose e n e r g i e s are l i k e l y t o be g r e a t e r 4 -1
by a t l e a s t 10 cm , are d e r i v e d from s t a t e s d i f f e r e n t i n o r b i t a l and
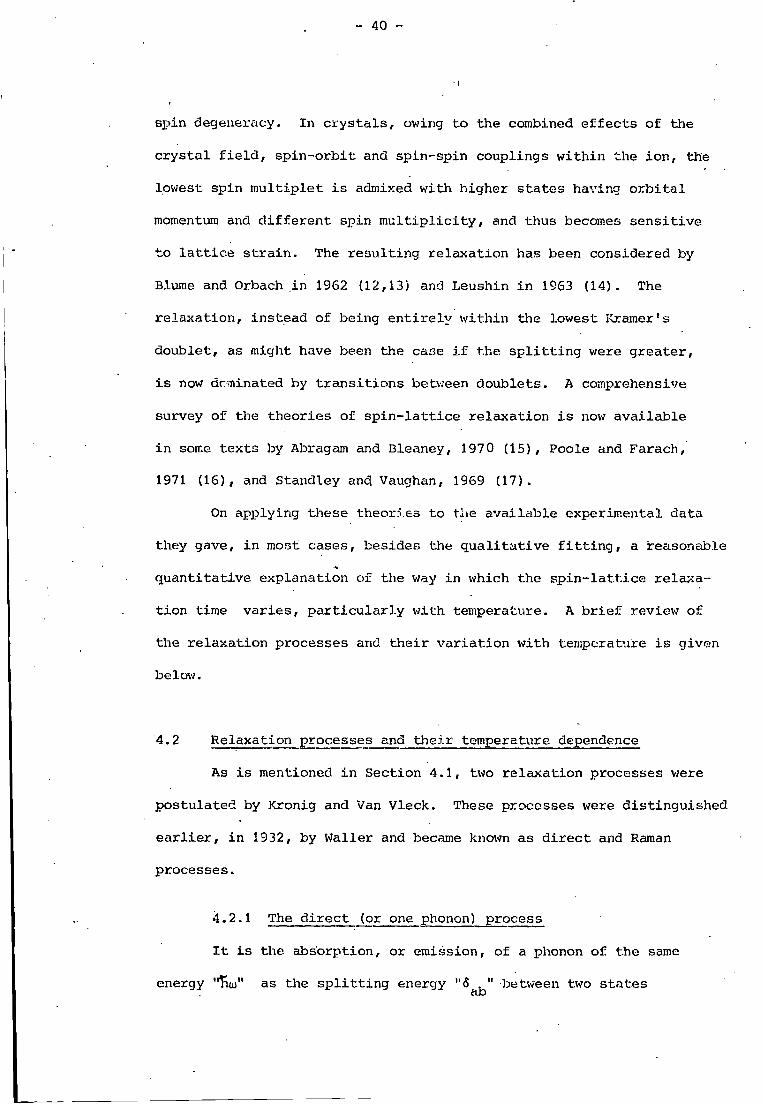
- 40 -
s p i n degeneracy. I n c r y s t a l s , owing to the combined e f f e c t s of the
c r y s t a l f i e l d , s p i n - o r b i t and s p i n - s p i n c o u p l i n g s w i t h i n the i o n , the
lowest s p i n m u l t i p l e t i s admixed w i t h h i g h e r s t a t e s having o r b i t a l
momentum and d i f f e r e n t s p i n m u l t i p l i c i t y , and thus becomes s e n s i t i v e
to l a t t i c e s t r a i n . The r e s u l t i n g r e l a x a t i o n has been c o n s i d e r e d by
Blume and Orbach i n 1962 (12,13) and L e u s h i n i n 1963 ( 1 4 ) . The
r e l a x a t i o n , i n s t e a d of being e n t i r e l y w i t h i n the lowest Kramer's
doublet, as might have been the case i f the s p l i t t i n g were g r e a t e r ,
i s now dominated by t r a n s i t i o n s between d o u b l e t s . A comprehensive
survey of the t h e o r i e s of s p i n - l a t t i c e r e l a x a t i o n i s now a v a i l a b l e
i n some t e x t s by Abragam and Bleaney, 1970 ( 1 5 ) , Poole and F a r a c h ,
1971 ( 1 6 ) , and S t a n d l e y and Vaughan, 1969 ( 1 7 ) .
On applying t h e s e t h e o r i e s to the a v a i l a b l e e x p e r i m e n t a l data
they gave, i n most c a s e s , b e s i d e s the q u a l i t a t i v e f i t t i n g , a reasonable
q u a n t i t a t i v e e x p l a n a t i o n of the way i n which the s p i n - l a t t i c e r e l a x a
t i o n time v a r i e s , p a r t i c u l a r l y w i t h temperature. A b r i e f review of
the r e l a x a t i o n p r o c e s s e s and t h e i r v a r i a t i o n w i t h temperature i s g i v e n
below.
4.2 R e l a x a t i o n p r o c e s s e s and t h e i r temperature dependence
As i s mentioned i n S e c t i o n 4.1, two r e l a x a t i o n p r o c e s s e s were
p o s t u l a t e d by Kronig and Van V l e c k . These p r o c e s s e s were d i s t i n g u i s h e d
e a r l i e r , i n 1932, by W a l l e r and became known as d i r e c t and Raman
p r o c e s s e s .
4.2.1 The d i r e c t (or one phonon) p r o c e s s
I t i s the a b s o r p t i o n , or e m i s s i o n , of a phonon of the same
energy "hV' as the s p l i t t i n g energy "6 . " between two s t a t e s

- 41 -
|a> and |b> r e q u i r e d f o r a resonance t r a n s i t i o n i n the s p i n system
and r e s u l t i n g i n an upwards or downwards t r a n s i t i o n i n t h a t system.
T h i s i s i l l u s t r a t e d d i a g r a m a t i c a l l y i n F i g u r e 4.1a. C a l c u l a t i o n of
the t r a n s i t i o n p r o b a b i l i t y f o r t h i s p r o c e s s f o r a Kramer's doublet
(one i n which the two s p i n s t a t e s a re time conjugates of each other
and have h a l f i n t e g r a l quantum numbers) l e a d s t o the dependence of
T^ on temperature and a p p l i e d magnetic f i e l d as
- 4 - 1
T = a H T (4.1)
w h i l e f o r non-Kramer's i o n s the dependence i s
T - a'H~ 2 T " 1 (4.2)
where a and a" are c o n s t a n t s .
The energy d e n s i t y of phonons a t frequency w w i t h i n a c e r t a i n band
width dui i s g i v e n by
pdw = —— (4.3) ft v exp (tu/kT ) - 1
where v i s the v e l o c i t y of sound i n the c r y s t a l .
The energy d i s t r i b u t i o n of phonons acco r d i n g to a Debye spectrum a t
any p a r t i c u l a r l a t t i c e temperature c o u l d be i l l u s t r a t e d as i n F i g u r e
4.2. Only these phonons, which have e n e r g i e s equal t o the t r a n s i t i o n
energy between the two r e l a x i n g l e v e l s , i n other words, those which
are on "speaking terms" w i t h the s p i n s , can take p a r t i n the d i r e c t
p r o c e s s of r e l a x a t i o n . T h i s i s only an extremely s m a l l f r a c t i o n of
the t o t a l number of phonons and i t can be shown t h a t the d i r e c t
p r o c e s s w i l l predominate only a t lower temperatures ( l i q u i d helium
t e m p e r a t u r e s ) .
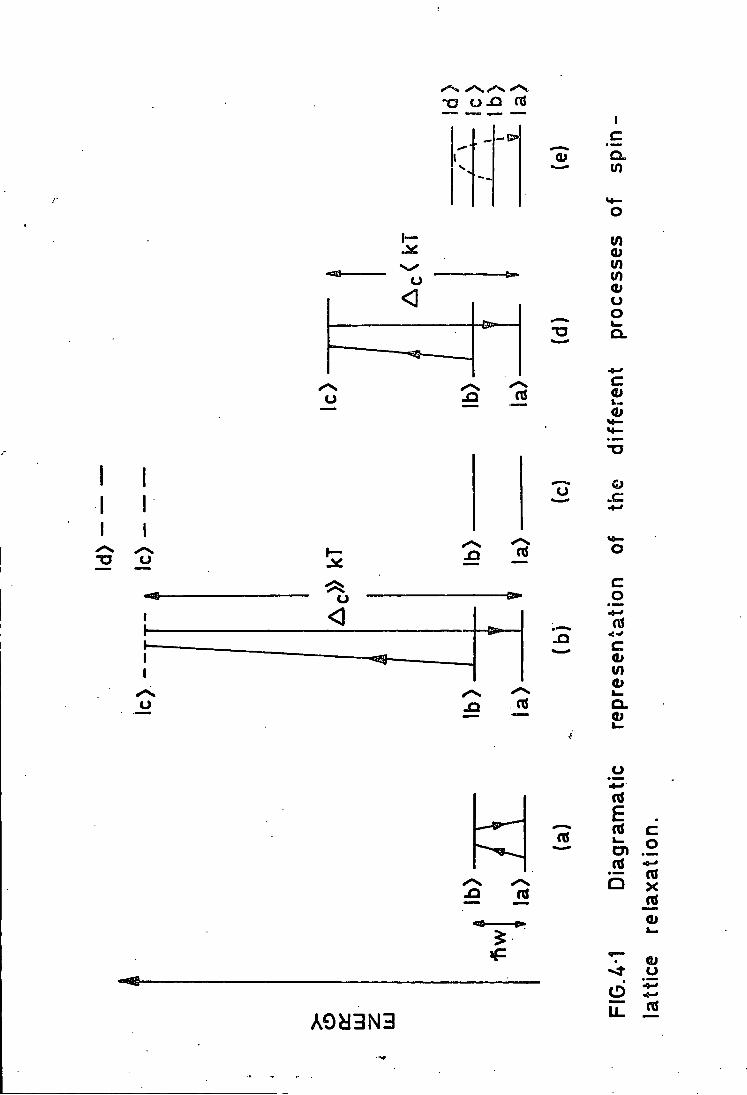
/ V. ^ s .
-CP I a;
i
c en
I— .XL
<3 X J
u
in <u in w <u o o
c
I I I I I I
U
<3 -6s»-
c o •«->
<-* c <b V) <D i _ a. a*
£ en
rt
A9U3N3
c o
x _rt
o rt
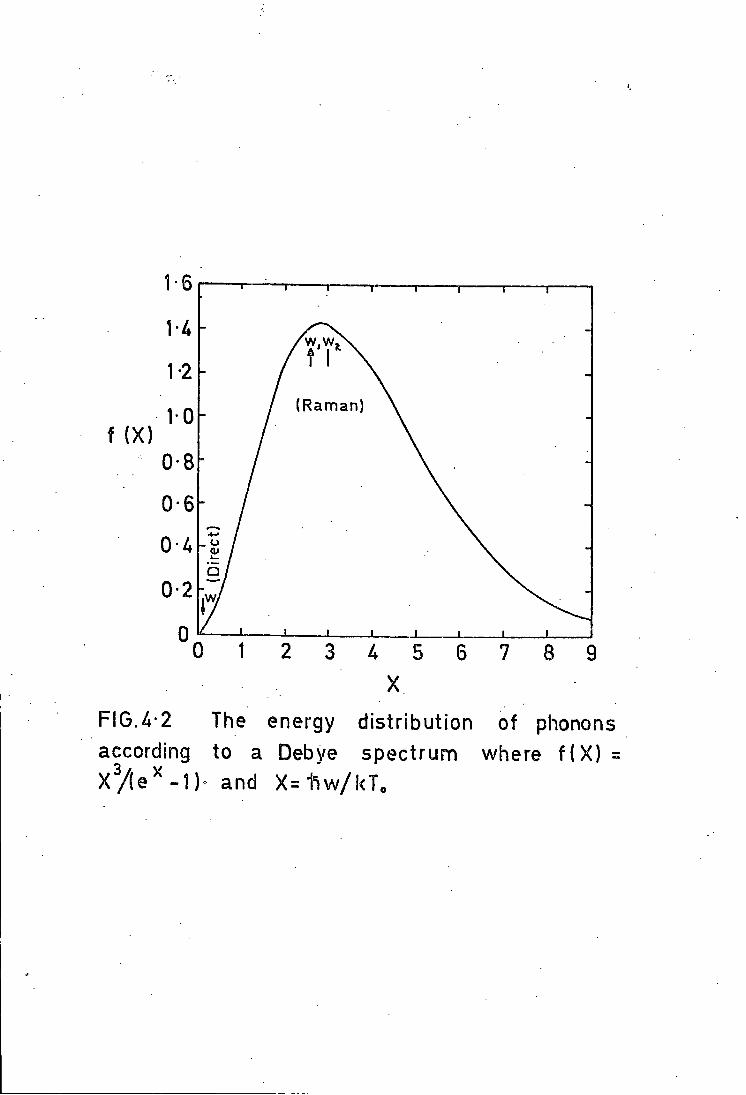
•6
w.w " J " z f I •2
(Raman) 0 f X
0-8
0-6
0-4
0 "0 1 2 3 4 5 6 7 8 9
X
FIG.4-2 The energy distribution of phonons according to a Debye spectrum where f (X ) = X 3 / ( e x - 1 ) - and X="hw/kT .

- 42 -
4.2.2 The two-phonon, Raman p r o c e s s
T h i s p r o c e s s , i n v o l v i n g two high frequency phonons, i s s i m i l a r
to t h a t i n t r o d u c e d by W a l l e r but, here, the i n t e r a c t i o n mechanism i s
e x p l a i n e d by the l i g a n d f i e l d theory r a t h e r than by the magnetic
s p i n - s p i n i n t e r a c t i o n . I n t h i s p r o c e s s the magnetic ion makes a
t r a n s i t i o n from s t a t e |b> to s t a t e |a> , or v i c e v e r s a , accompanied
by the v i r t u a l a b s o r p t i o n of a phonon of angular frequency w and
the e m i s s i o n of a phorion of frequency w . The energy d i f f e r e n c e
fiuj^ - "hui^ i s absorbed, o r emitted, by the s p i n system e f f e c t i n g a
t r a n s i t i o n as i l l u s t r a t e d i n F i g u r e 4..lb. I n the Raman p r o c e s s any
two phonons can p a r t i c i p a t e p r o v i d e d t h a t t h e i r frequency d i f f e r e n c e
i s e q u a l to the resonance frequency of the s p i n system. So, the much
more abundant phonons near- the peak of the energy d i s t r i b u t i o n c:~. tne
phonon spectrum, F i g u r e 4.2, are a l s o a v a i l a b l e . The c a l c u l a t e d
dependences f o r T^ due t o t h i s p r o c e s s a r e , f o r the Kramers i o n s ,
T j = b T ~ 9 + b 1 H~2 T~ 7 (4.4)
-2 -7
where b and h are c o n s t a n t s . The dependence on II T i s only
r e l e v a n t under c e r t a i n c i r c u m s t a n c e s , as d i s c u s s e d by Orbach, 1961 •
(18 ) . F or non-Kramers i o n s the dependence i s
T j = b" T~ 7 (4.5)
where b" i s a c o n s t a n t .
4.2.3 Resonant two-phonon r e l a x a t i o n or Orbach p r o c e s s
As i s mentioned e a r l i e r , t h i s two phonon resonance p r o c e s s
was suggested by Orbach i n 1961 and f i r s t v e r i f i e d by F i n n e t a l i n
1961. Suppose t h a t the magnetic i o n has a s e t of energy l e v e l s such

- 43 -
as t h a t shown i n F i g u r e 4.1c, where t h e r e a r e two low l y i n g s t a t e s | a > ,
|b> (such as a Kramer's d o u b l e t ) , and an e x c i t e d s t a t e | c > whose energy
s e p a r a t i o n A^ i s l e s s than the maximum phonon energy, or
A < Hoi (4.6) c p
where i s the phonon frequency.
I n the Raman p r o c e s s t h e r e were no phonons of energy A , so t h a t t r a n s i -c
t i b n s i n v o l v i n g a v i r t u a l l e v e l c had to be imagined. I t i s , here,
p o s s i b l e f o r an i o n i n , say, s t a t e |b> t o absorb a phonon of the
e x p r o p r i a t e frequency by a d i r e c t p r o c e s s , and be e x c i t e d to the s t a t e
| c > . Then, a second phonon i s emitted by a spontaneous or induced
e m i s s i o n from t h a t s t a t e | c > to f a l l down to s t a t e | a > . T h i s g i v e s an
i n d i r e c t t r a n s f e r of i o n s from s t a t e j b > to | a > , and i n so doing
r e l a x a t i o n o c c u r s between s t a t e | b > and | a > j t h i s may be f a s t e r than the
d i r e c t t r a n s f e r between them because of the much hi g h e r d e n s i t y of phonons
of energy A i n the phonon spectrum. Orbach deduced a r e l a x a t i o n r a t e
which i n g e n e r a l p r a c t i c e becomes ,
T 1 = C exp ( A c/kT) (4.7)
independent of an a p p l i e d magnetic f i e l d except i n so f a r as t h i s may
f i l t e r t he v a l u e A . T h i s r e l a t i o n h o l d s f o r both non-Kramers and Kramers c
i o n s p r o v i d e d t h a t we c o n s i d e r a s i m i l a r treatment f o r the e x c i t e d s t a t e s
as f o r the Kramers doublets i n the Raman a n a l y s i s .
4.2.4 M u l t i p l e ground s t a t e p r o c e s s
Orbach and Blunve (12,13) c o n s i d e r e d the c a s e where a m u l t i
l e v e l Kramers s t a t e i s lowest i n energy. T h i s i s i l l u s t r a t e d i n F i g u r e 4.Id,
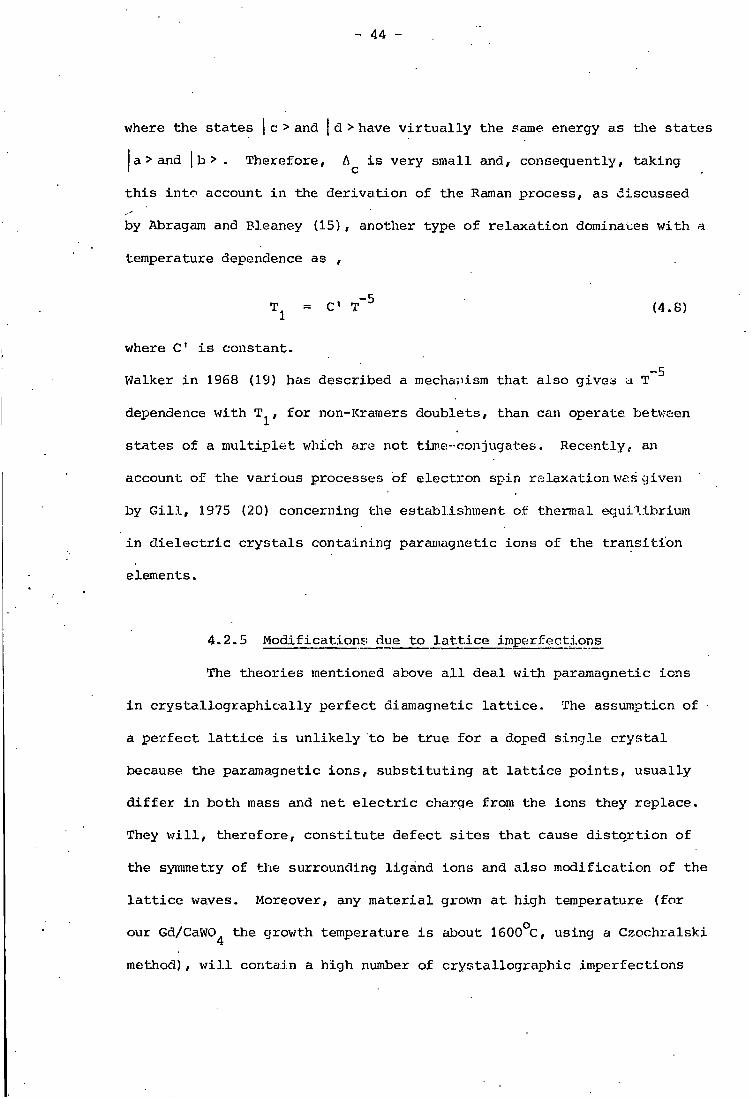
- 44 -
where the s t a t e s | c > and | d > have v i r t u a l l y the same energy as the s t a t e s
|a>and |b> - T h e r e f o r e , i s v e r y s m a l l and, consequently, t a k i n g
t h i s i n t o account i n the d e r i v a t i o n of the Raman p r o c e s s , as d i s c u s s e d
by Abragam and Bleaney ( 1 5 ) , another type of r e l a x a t i o n dominates w i t h a
temperature dependence as ,
T = C 1 T~ 5 (4.8)
where C i s c o n s t a n t . -5
Walker i n 1968 (19) has d e s c r i b e d a mechanism t h a t a l s o g i v e s ti T
dependence w i t h T^, f o r non-Kramers d o u b l e t s , than can operate, between
s t a t e s of a m u l t i p l e t which are not time-conjugates. R e c e n t l y , an
account of the v a r i o u s p r o c e s s e s of e l e c t r o n s p i n r e l a x a t i o n was g i v e n
by G i l l , 1975 (20) concerning the e s t a b l i s h m e n t of thermal e q u i l i b r i u m
i n d i e l e c t r i c c r y s t a l s c o n t a i n i n g paramagnetic i o n s of the t r a n s i t i o n
elements.
4.2.5 M o d i f i c a t i o n s due to l a t t i c e i m p e r f e c t i o n s
The t h e o r i e s mentioned above a l l d e a l with paramagnetic i o n s
i n c r y s t a l l o g r a p h i c a l l y p e r f e c t diamagnetic l a t t i c e . The assumption of
a p e r f e c t l a t t i c e i s u n l i k e l y t o be t r u e f o r a doped s i n g l e c r y s t a l
because the paramagnetic i o n s , s u b s t i t u t i n g a t l a t t i c e p o i n t s , u s u a l l y
d i f f e r i n both mass and n e t e l e c t r i c charge from the i o n s they r e p l a c e .
They w i l l , t h e r e f o r e , c o n s t i t u t e d e f e c t s i t e s t h a t cause d i s t o r t i o n of
the symmetry of the surrounding l i g a n d i o n s and a l s o m o d i f i c a t i o n of the
l a t t i c e waves. Moreover, any m a t e r i a l grown a t high temperature ( f o r
our Gd/CaWO^ the growth temperature i s about 1600°C, us i n g a C z o c h r a l s k i
method), w i l l c o n t a i n a high number of c r y s t a l l o g r a p h i c i m p e r f e c t i o n s
- 45 -
due to the thermal s t r e s s e s i n v o l v e d i n the growth p r o c e s s . A l s o , d e f e c t s
of other types can p l a y an important r o l e , f o r i n s t a n c e , m i c r o f r a c t u r e
r e s u l t i n g when the c r y s t a l i s cooled to the temperature of l i q u i d helium.
As i s e s t a b l i s h e d , s p i n - l a t t i c e i n t e r a c t i o n depends upon the
e x t e n t to which the d i s t a n c e s between a paramagnetic c e n t r e and the
surrounding atoms change under the i n f l u e n c e of l a t t i c e v i b r a t i o n s . The
d i s t u r b a n c e of the c r y s t a l f i e l d a t the paramagnetic i o n due t o the
a l t e r a t i o n of the normal p o s i t i o n s of the l i g a n d s w i l l have the e f f e c t
of i n t r o d u c i n g terms p r o p o r t i o n a l to the x a t t i c e s t r a i n a t the l i g a n d
i o n i n t o the e x p r e s s i o n s of the l a t t i c e p o t e n t i a l .
An a d d i t i o n a l e f f e c t of l a t t i c e d e f e c t s such as i n t e r s t i t i a l
i o n s and s u b s t i t u t i o n a l i o n s , which are of d i f f e r e n t mass from those
they r e p l a c e , i s m o d i f i c a t i o n of the assumed Debye spectrum of phonon
modes. T h i s i n v o l v e s the i n t r o d u c t i o n of e x t r a phonon modes, t h a t may
e i t h e r be l o c a l i z e d a t the d e f e c t s i t e or propagated through the l a t t i c e ,
and a l s o s c a t t e r i n g of normal phonon modes a t the d e f e c t s i t e . The
s c a t t e r i n g of t h e s e waves on c r y s t a l d e f e c t s , though producing s m a l l
changes i n o s c i l l a t i o n amplitudes, can however, l e a d to r e l a t i v e d i s p l a c e
ments of a d j a c e n t atoms much bigger than the displacements produced by
Debye waves, as d i s c u s s e d by Kochelaev i n 1960 ( 2 1 ) . I-Ie c o n s i d e r s t h a t
f o r two-phonon p r o c e s s e s the i n f l u e n c e of d e f e c t s can be unimportant and
t h a t the g r e a t e s t e f f e c t o c c u r s i n the d i r e c t p r o c e s s . He a l s o d e r i v e s
an e x p r e s s i o n f o r the t r a n s i t i o n p r o b a b i l i t y , t a k i n g as an example the. 3+
l o n Cr i n o c t a h e d r a l environment5 h i s a n a l y s i s shows t h a t i t i s
independent of magnetic f i e l d and i n v e r s e l y p r o p o r t i o n a l t o the d i s t a n c e
between the paramagnetic i o n and the d e f e c t s i t e . T h i s means t h a t the
r e l a x a t i o n time depends upon the c o n c e n t r a t i o n of the paramagnetic i o n s

- 46 -
and on the d e n s i t y of d e f e c t c e n t r e s i n the c r y s t a l .
The e f f e c t s of l o c a l i z e d phonon modes c r e a t e d a t d e f e c t s i t e s
have been c o n s i d e r e d by Klemens, 1962 ( 2 2 ) , C a s t l e e t a l , 1963 (23), and
Montre11 and P o t t s , 1955 ( 2 4 ) . Klemens (22) concludes t h a t the only
c o n c e i v a b l e p r o c e s s i n v o l v i n g a l o c a l mode i s one i n which a s p i n - f l i p
i s accompanied by the a b s o r p t i o n and subsequent r e - e m i s s i o n of a l o c a l i z e d
phonon.
When the r e l a t i v e s p a c i n g o f the two s p i n l e v e l s i n a magnetic
f i e l d i s perturbed by a change i n the c r y s t a l f i e l d , due to a s t r a i n e ,
the p e r t u r b a t i o n Hamiltonian i s of the' form
2 IP = A e + B e (4.9)
where A and B a r e a p p r o p r i a t e c o u p l i n g parameter?. The two p r o c e s s e s ,
d i r e c t and Raman, are comparable a t a temperature T g i v e n by Klemens a s , c
. 1 2 I T c ^ 2 ( A / B ) 3 °D ( E / k ) ? ( 4 1 0 )
where 6 D i s the normal Debye temperature, E i s the s p i n energy (micro
wave en e r g y ) , A and B a r e the c o n s t a n t s given i n the s t r a i n e d Hamiltonian
eq u a t i o n ( 4 . 9 ) .
The c o n t r i b u t i o n of the l o c a l i z e d modes t o the Raman r e l a x a t i o n
i s g i v e n by Klernens a s
1 / T R I " \[i^r) M ' e 1 < 4-">.
where 0. = W , / k and E = AE i s the s p i n energy, a). i s the angular
/ 3 h
frequency of the l o c a l mode, v i s the v e l o c i t y of sound, (v = (K a /M )
where K i s the e l a s t i c modulus, M and a a r e the mass and volume of the
c r y s t a l , r e s p e c t i v e l y ^ . A t s u f f i c i e n t l y high temperatures 1/T R^ v a r i e s
- 47 -
2 as T i n the same manner as 1/1'R and, t h u s , makes a comparable cont r i b u t i o n to 1/T where 1/T i s g i v e n by ,
,e/T 9 i f ' 6 X
1/T = 36 TT (B/MvP OJ (T/6) f X e dx (4.12) J ( e X -
I n t h i s equation, the i n t e g r a l i s used to be put i n the form
n x J (x) = / * e dx (4.13)
which has been t a b u l a t e d (25) and i t can be shown t h a t a t s m a l l v a l u e s 5
of x, Jg(>0 tends to x , and a t l a r g e v a l u e s of x the i n t e g r a l goes to
a l i m i t i n g v a l u e of 732.4. Thus, 1/T_ v a r i e s as T' a t temperatures below R
2
about 6/10, and as T" above about 6/2, as was obtained p r e v i o u s l y by
Mattuck and Strandberg ( 2 6 ) . Dy comparing equations (4.11) and (4 . 1 2 ) ,
Klemens concluded t h a t these two Raman p r o c e s s e s become comparable a t
temperatures of about 6/20, the o r d i n a r y Raman p r o c e s s predominates below
t h a t temperature and the e x p o n e n t i a l l y i n c r e a s i n g l o c a l mode Raman p r o c e s s
dominates above t h a t temperature.
Klemens'treatment i s v a l i d only i f the l o c a l mode frequency
i s w e l l s e p a r a t e d from the continuum of l a t t i c e modes. As approaches
0)^, the mode becomes p r o g r e s s i v e l y l e s s l o c a l i z e d . I n the l i m i t as (<k
oecomes equal t o to , 1/T v a n i s h e s and the s p i n - l a t t i c e r e l a x a t i o n i s D RJL
g i v e n by the normal theory. The r e l a t i o n s h i p between w , to D and the
s p a t i a l e x t e n t of the l o c a l mode i s d i s c u s s e d by M o n t r e l l and P o t t s ( 2 4 ) .
C a s t l e , Feldman, Klemens and Weeks, 1963 (23) found t h a t the
Raman r e l a x a t i o n a t d e f e c t s i t e s , c h a r a c t e r i z e d by a low frequency of
l o c a l d i s t o r t i o n , have a lower temperature dependence than the c o r
responding Raman r e l a x a t i o n i n a p e r f e c t l a t t i c e . An e x p l i c i t e x p r e s s i o n

- 48 -
was d e r i v e d w i t h the assumption of harmonic response of the l o c a l
d i s t o r t i o n a t the d e f e c t s i t e . The r e s u l t was a temperature dependence
f o r T^ of the form ,
• . • H 4 ) ' ^ } - t e ) ' ^ ) - ( t ) ' ' * ) * # ^ ) ) ]
(4.14)
where 6^ and 0^ are the Dehye temperatures f o r a d e f e c t e d and p e r f e c t
c r y s t a l r e s p e c t i v e l y , Jn ( x ) i s d e f i n e d i n equation (4.13) and B and B*
are c o n s t a n t parameters whose r a t i o determines which form of Raman
r e l a x a t i o n w i l l dominate. Experimentally", these authors measured the
s p i n - l a t t i c e r e l a x a t i o n a t the d e f e c t s i t e s formed by E 1 c e n t r e s i n
i r r a d i a t e d s y n t h e t i c q u a r t z a t 3 k i l o - o e r s t e a d s over a wide temperature
range from 1.3 t o 250 K. T h e i r d a t a was i n t e r p r e t e d i n terms of c r o s s ,
d i r e c t and Raman r e l a x a t i o n p r o c e s s e s . The dominant f e a t u r e o f the 3
Raman r e l a x a t i o n was a' temperature v a r i a t i o n of about T when the
c h a r a c t e r i s t i c frequency i s s u f f i c i e n t l y low compared t o the Debye f r e
quency.
4.3 Experimental R e s u l t s
From the foregoing a n a l y s i s we r e a l i z e t h a t one of the main
experimental techniques f o r uncovering the u n d e r l y i n g mechanism of a
r e l a x a t i o n p r o c e s s f o r a c e r t a i n magnetic i o n i s to study the dependence
on temperature of the r e l a x a t i o n r a t e . Another measurable p r o p e r t y i s
the magnetic f i e l d dependence. The l a t t e r , however, i s not always con
v e n i e n t s i n c e i t i n v o l v e s the use of s e v e r a l microwave spectrometers
o p e r a t i n g a t d i f f e r e n t f r e q u e n c i e s . I n t h i s study, we are us i n g the
f i r s t technique f o r i t s r e l e v a n c e and convenience.
- 49 -
The samples used i n t h i s work are described e a r l i e r i n
Section 3.2. We were c a r e f u l t o use the same samples as those of Thorp
e t a l (27) f o r the sake of comparison w i t h t h e i r r e s u l t s and t o explore'
the r e l a x a t i o n behaviour over an extended temperature range. The pulse-
s a t u r a t i o n method used i n the previous work was again adopted. To allow
measurement o f s p i n - l a t t i c e r e l a x a t i o n times t o be made over a v/ide
temperature range above 4.2 K, the waveguide housing the specimen was
surrounded by an a r a l d i t e block (type A T I ) , as suggested by W. Hutton,
Figure 4.3. The s p e c i f i c heat of t h i a a r a l d i t e was given by Parkinson
and Quarrington ( 2 8 ) , and due t o i t s high thermal capacity a t low
temperatures i t seemed t o be a s u i t a b l e m a t e r i a l . The a r a l d i t e , which
was o r i g i n a l l y i n a powdered form, was melted a t ~120°C and cured a t -
~140°C o v e r n i g h t . Then i t was machined t o f i t the waveguide and another
piece of a r a l d i t e was prepared as a plunger; t h i s had a piece of brass
attached t o i t s end f o r s h o r t - c i r c u i t i n g the waveguide where the sample
was loc a t e d . With t h i s arrangement the warming-up time was s u f f i c i e n t l y
slow t o permit measurements a t i n t e r m e d i a t e temperatures between 4.2 K
and 30 K t o be made w i t h o u t any a d d i t i o n a l temperature s t a b i l i z a t i o n
equipment5 Copper-copper/constantan thermocouples were used f o r the
temperature measurements.
The a m p l i f i e r system used t o d e t e c t the recovery t o thermal
e q u i l i b r i u m had a dead - time of 10 usee; t h i s dead time determined the
upper temperature l i m i t f o r measurements since i t was found t h a t T
decreased t o the same order as the dead-time a t about 30 K. An estimate
of the t o t a l e r r o r i n measurements of T was between 10 and 15%, the
main e r r o r r e s u l t i n g from misbalance of the b r i d g e , Mason (29).
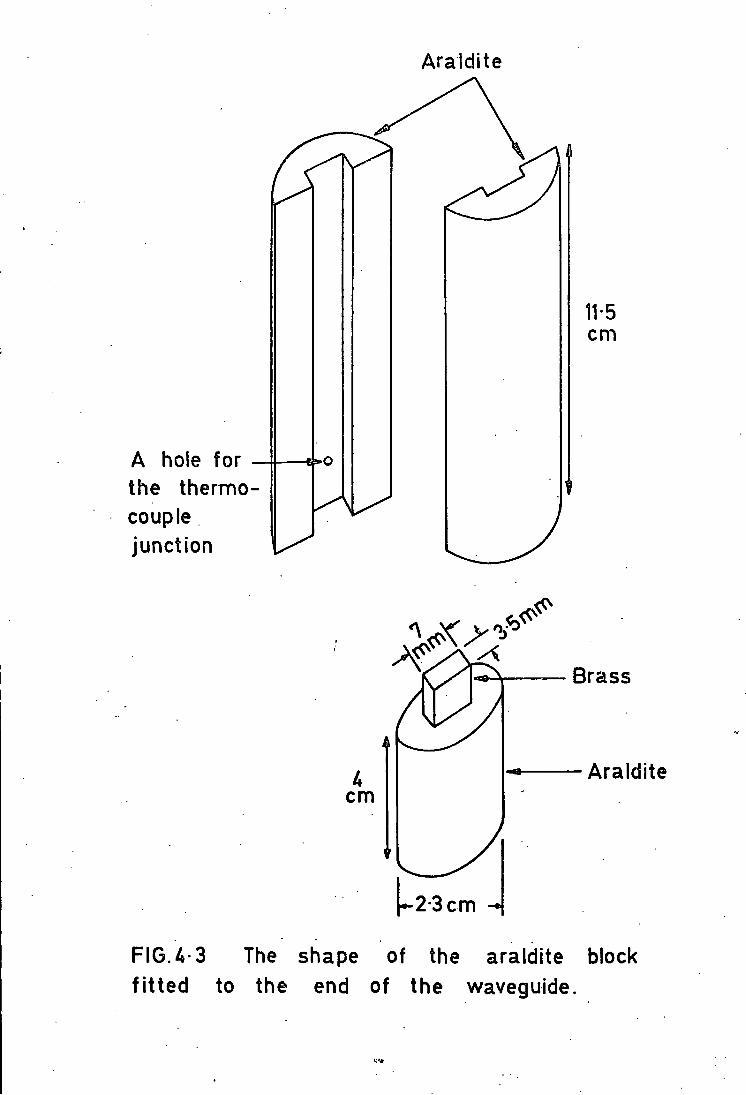
A hole for -the thermocouple junction
ds»0
Araldite
11-5 cm
V 2-3 c m -
B r a s s
Araldite
FIG.4-3 The shape of the araldite block fitted to the end of the waveguide.
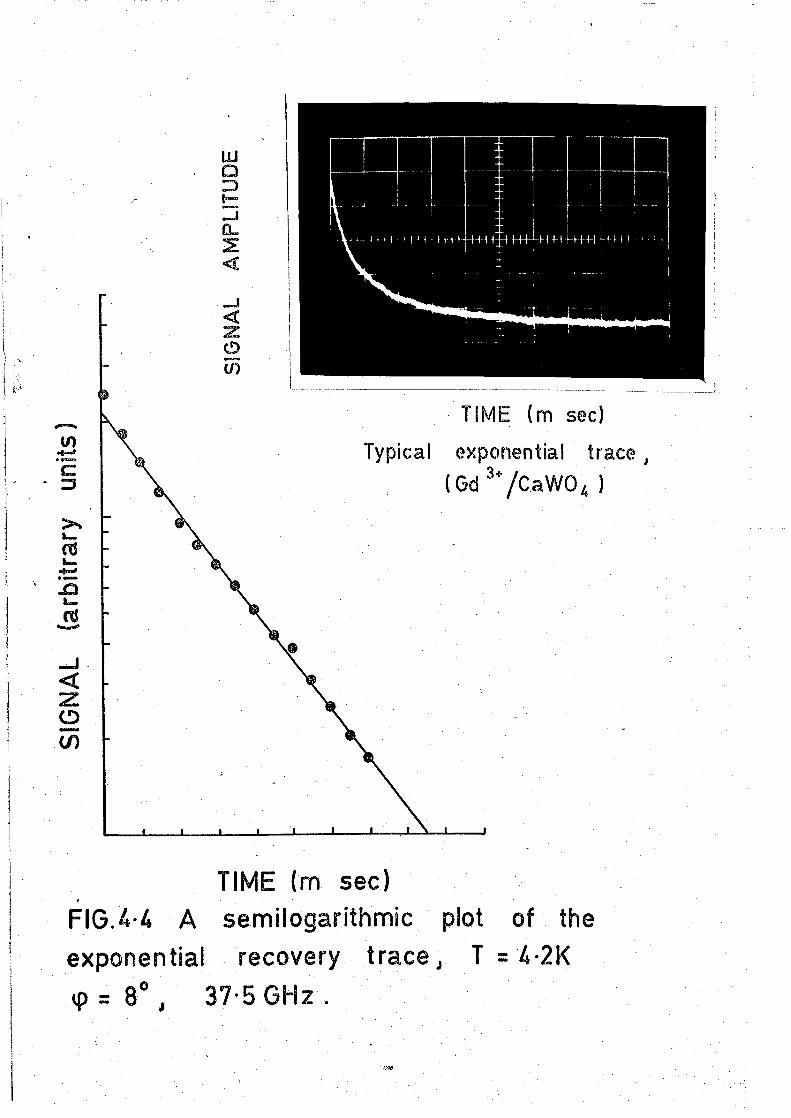
TIME (m sec)
Typical exponential trace (Gd ' / C . a W O * )
X3
CD t o
•
TIME (m sec) FIG.4-4 A semilogarithmic plot of the exponential recovery t race , T = 4-2K 9 = 8°, 37*5 GHz .

- 50 -
4.3.1 -temperature dependence measurements
To enable the d a t a t o be compared d i r e c t l y w i t h the e a r l i e r
r e s u l t s o f Thorp e t a l (27) measurements a r e made w i t h magnetic f i e l d
p e r p e n d i c u l a r to the c - a x i s of the c r y s t a l , i . e . i n the <j>--plane. The
magnetic f i e l d was d i r e c t e d along the magnetic a x i s ( <j> = 8°) because
a t t h i s angle c l e a n s i n g l e ESR l i n e s were observed w i t h the two samples
s t u d i e d here which had nominal c o n c e n t r a t i o n s of 0.005 and 0.05 atomic
p e r cent gadolinium. A t y p i c a l photograph of the e x p o n e n t i a l r e c o v e r y
curve i s shown i n F i g u r e 4.4. The sem i - l - g p l o t o f the r e c o v e r y curve
y i e l d e d a s t r a i g h t l i n e , as p r e v i o u s l y r e p o r t e d (27), i n d i c a t i n g t h a t
the r e c o v e r y could adequately be d e s c r i b e d by a s i n g l e e x p o n e n t i a l j t h i s
i s t r u e f o r a l l the r e c o v e r y t r a c e s observed over the whole temperature
range f o r the samples examined. The form of the temperature v a r i a t i o n
of T j f o r the c r y s t a l c o n t a i n i n g 0.005 a t . % Gd i s shown i n F i g u r e 4.5,
which f o r completeness i n c l u d e s the p r e v i o u s r e s u l t s o btained i n the
1.5 K to 8 K r e g i o n . The f i g u r e shows the occurrence of two d i s t i n c t
regimes i n d i c a t i v e of a d i r e c t and a Raman-type r e l a x a t i o n . At tem
p e r a t u r e s below ?_bout 8 K the v a r i a t i o n f o l l o w s , to w i t h i n experimental
e r r o r , a T^ a T 1 law. I n t h i s temperature range the magnitudes o f T^
ar e found to be 5.8 m s e c a t 4.2 K and 2.8 msec a t 8 K, which a r e i n
c l o s e agreement w i t h the p r e v i o u s measurements. The t r a n s i t i o n tem
p e r a t u r e between the two r e l a x a t i o n regimes i s shown t o be a t n e a r l y
8 K, and above t h i s temperature the s p i n - l a t t i c e r e l a x a t i o n time v a r i e s -3
a s T j a T , g i v i n g a va l u e of T^ = 1.6 m s e c a t 10 K and f a l l i n g only
t o 0.07 m s e c a t 28 K.
The corresponding temperature v a r i a t i o n f o r the nominally
h i g h e r gadolinium c o n c e n t r a t i o n sample, i . e . 0.05 a t . % Gd, i s d e p i c t e d
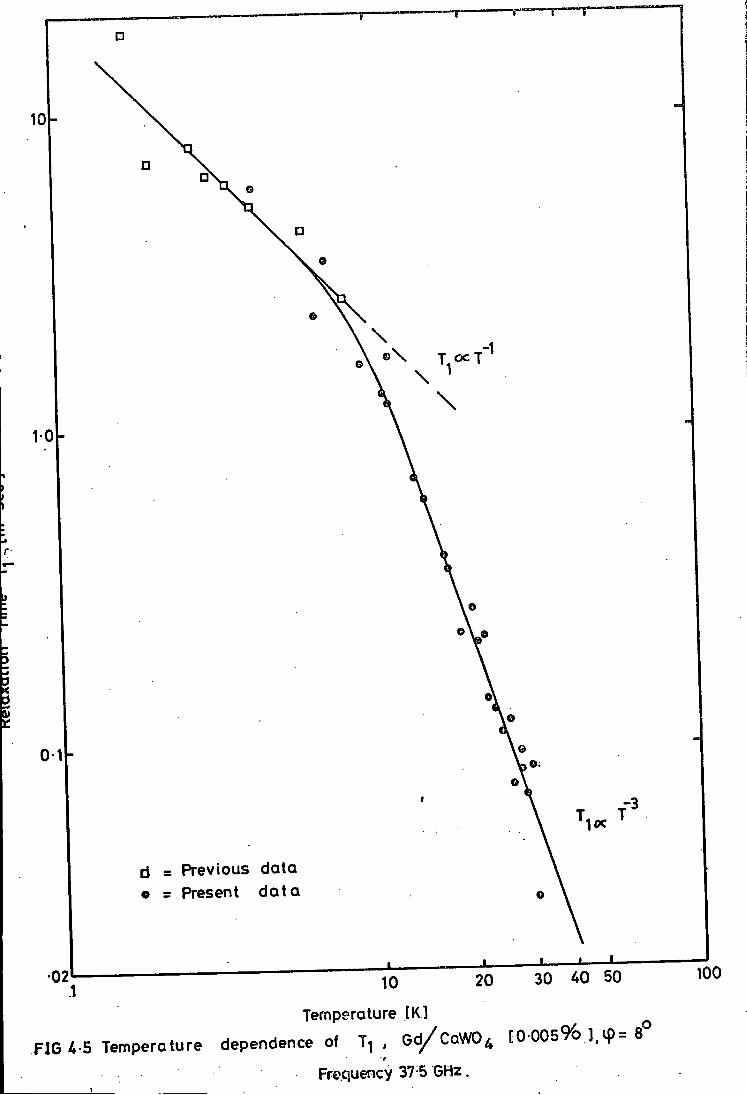
©
10
0-1
d = Previous data o = Present d a t a
•02' 1 10 20 30 AO 50
Temperature [K]
.FIG 4-5 Temperature dependence of T, , G d / C a W 0 4 [ 0 0 0 5 % ] , * =
Frequency 37 5 GHz.

10h
• = Previous data
• = Present data
-36
j i t « 10 20 30 40 50
Temperature I K ]
FIG4-6 Temperature dependence of T j j G d / c a W O ^ [ 0 « 0 5 % ] , i p = 8C
Frequency 37-5 GHz
100

90°
85 75° 65' / 55«
/ V) 45
35
25°
5
Ti (m sec) 8° 1 10 9 8 7 6 5 4 3 2 1
I—H 180° 1 2 3 4 5 6 7 8 9 10
8° Ti (rn sec)
5
25
01 35 /
e 45 / 55° / \ 11 65
270
FIG. 4-7 Angular variation of T, in the ip - plane for
G d 3 y C a W O A (0 005%) , temperature 4-2K , frequency 37-5 GHz.
- 51 -
i n Figure 4.6. A very s i m i l a r behaviour was obtained as w i t h the f i r s t
sample, w i t h two d i s t i n c t v a r i a t i o n s w i t h temperature. The exponents
o f T, i n the lower region of temperature are (-1), i n d i c a t i v e of a d i r e c t
process, and (-3.6) i n d i c a t i v e of a Raman-type r e l a x a t i o n i n the higher
temperature r e g i o n . These values are i n agreement w i t h those obtained
from Figure 4.5. The a c t u a l magnitudes of T^ a t corresponding temperatures,
e.g. 5.8 msec f o r the 0.005 a t . % Gd sample and 5.6 msec f o r the 0.05
a t . % Gd a t 4.2 K suggests t h a t a t these gadolinium l e v e l s T j i s not
s t r o n g l y dependent on co n c e n t r a t i o n .
4.3.2 T^ - angular dependence measurements
I n v e s t i g a t i o n of the angular v a r i a t i o n of T was c a r r i e d out
f o r the sample 0.005 a t . % Gd. Measurements were made i n the <j>-piane
a t 4.2 K and the r e s u l t s .are shown i n Figure 4.7. I t i s found t h a t T^
i s a n i s o t r o p i c i n the plane of measurements. I n the f i r s t quadrant;
(0 < <f> < 90°) , there i s a f a i r l y broad b u t d i s t i n c t minimum between o o
(j> = 45 and $ = 65 . I t i s shown t h a t v a r i e s from a maximum o f
11.6 msec a t <}> -•- 25° t o a minimum o f 4.1 msec a t <J> = 55°; a t t h i t
angle T^ i s reduced by a f a c t o r o f about t h r e e . P o t a t i o n o f the c r y s t a l
through 180° i n order t o examine the range 180° < <j) < 270°; i n the
t h i r d quadrant, revealed a s i m i l a r v a r i a t i o n of T^ w i t h a minimum near
<|> = 235° and a maximum a t <j> = 205°.
4.4 Discussion
4.4.1 The temperature dependence of T^
From the t h e o r i e s o f r e l a x a t i o n mentioned i n Section 4.1, we
may formulate a general equation t h a t gives the dependence o f s p i n - l a t t i c e

- 52 -
r e l a x a t i o n time on temperature as ,
T 1~ 1 AT?"1 + BT n + C exp(-A c/kT) (4.15)
where A, B and C are constants. In the f i r s t term, in the absence of
a bottleneck or cross-relaxation e f f e c t s , m = 1 indicating the occur
rence of a d i r e c t process. In the second termj corresponding to the
Raman process, n = 7 for a non-Kramers ion or n = 9 for a Kramers ion.
The l a s t term represents the Orbach mechanism, where A i s the energy
s p l i t t i n g of the excited state above the ground l e v e l . Usually equation
(4.15) i s applicable only to s a l t s where the paramagnetic ion concen
tr a t i o n i s low so that the experimental conditions approximate to the
assumptions of a single ion theory where any co-operative mechanisms
such as cross-relaxation or exchange interactions between c l u s t e r s of
ions are not involved. As we are dealing with an S-state ion we may
expect that the Orbach-Blume mechanism w i l l be e f f e c t i v e , giving r i s e 5
to a dominating T term i n equation (4.15) instead of the normal Raman 5
process. There i s , i n fa c t , experimental evidence for the T Raman
behaviour i n several S-state ions. For example, B i e r i g e t a l (30)
found t h i s kind of temperature dependence for Gd^/CaF^, Chao-Yuan 2 *H 2 -fr* 2*1*
Huang (11) also observed i t i n Eu /CaF^, Mn / B a F 2 a n d M n / ' S r F 2 " 3
When considering our r e s u l t s on Gd /CaWO we may notice f i r s t
that the Orbach process i s absent. I t i s known that the Orbach process
i s only important i f the s p l i t t i n g A^ i s l e s s than the Debye energy
k0 Q , which i s that of the highest energy phonon i n the l a t t i c e phonon spectrum, i . e . i f
A < kG (4.16) c D
where 9^ i s the Debye temperature. For the gadolinium-doped c r y s t a l s
- 53 -
used we may (in the absence of a d i r e c t determination), reasonably take
6^ as the value for pure CaWO^ since the gadolinium concentration i s low,
Farley (32), using u l t r a s o n i c techniques for e l a s t i c constant determina
tio n s , reported that 9 D = 155 K for pure CaWO . From spectroscopic data
the value of A i s about 30000 cm Dieke (33), and so kG i s much l e s s c D than A (k = 0.695 cm 1 K We thus conclude that the Orbach orocoss c' i s not a possible mechanism. Moreover, i f defect centre? are present
in the c r y s t a l s the e f f e c t i v e Debye temperature may be l e s s than 6^ for
a perfect l a t t i c e j hence the conclusion that the Orbach process i s not
possible remains v a l i d for imperfect c r y s t a l s . Reference back to the
general equation (4.15), suggests therefore that for Gd^ ''/CaWO a v a r i a
t i o n of the form
T 1" 1 = AT™ + BT n (4-17)
may apply with m = 1, and n = 5. The absence of the Orbach term i s
confirmed by the experimental data because when plotting log T^ * versus
T * we do not get a s t r a i g h t l i n e as should be expected i f the recovery
followed an Orbach mechanism, Figures 4.8 and 4.9. A si m i l a r treatment
was followed by Scott and J e f f r i e s (34). This absence of an Orbach type
contribution was also found i n the r e s u l t s obtained with the doped
fluorides quoted above.
Our r e s u l t s , however, show that although there i s a good fit-
to a T var i a t i o n at low temperatures, the v a r i a t i o n above about 8 K
i s much l e s s rapid that T "\ To obtain a formula that f i t s the experi
mental r e s u l t s we followed an analysis s i m i l a r to that used by Scott and
J e f f r i e s . Starting with equation (4.17) we can obtain the values of m
and n from the log-log plots i n Figures 4.5 and 4.6. Knowing them, we
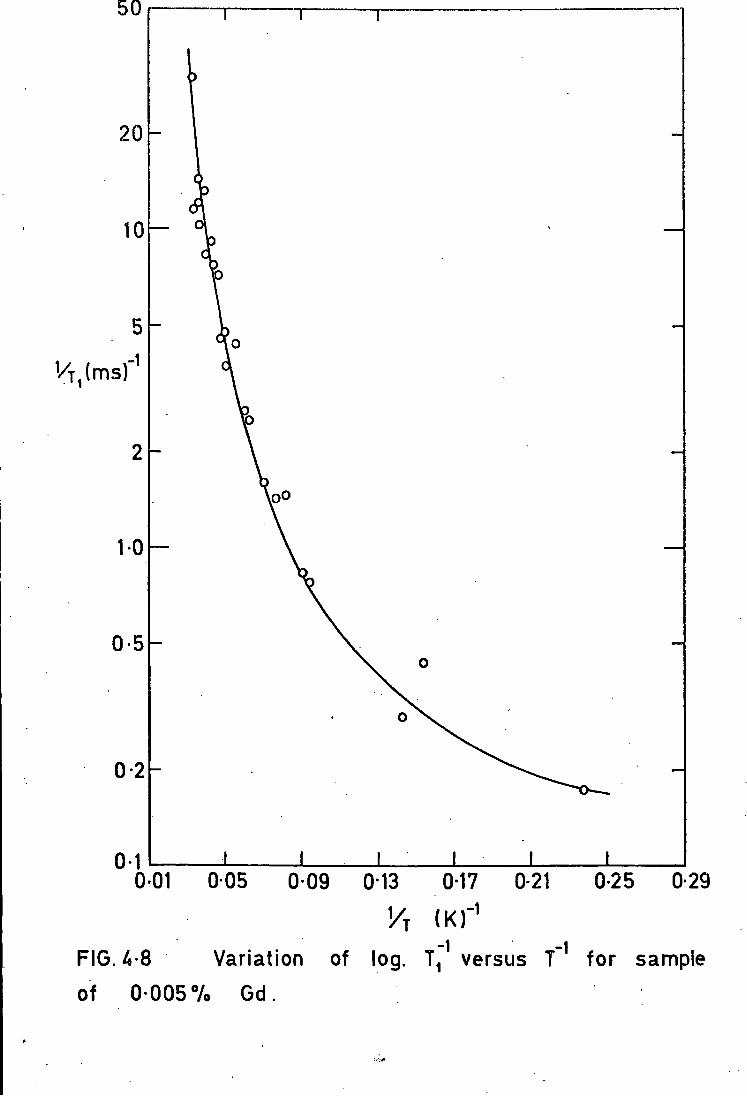
50
20
10
1 / T l ( m s )
oo
•0
0-1 0 0 005 0-21 0-25 0-29 0 0 9 0-17 013
YF (K) FIG. 4-8 Variation of log. T, versus T for sample
of 0 0 0 5 % Gd
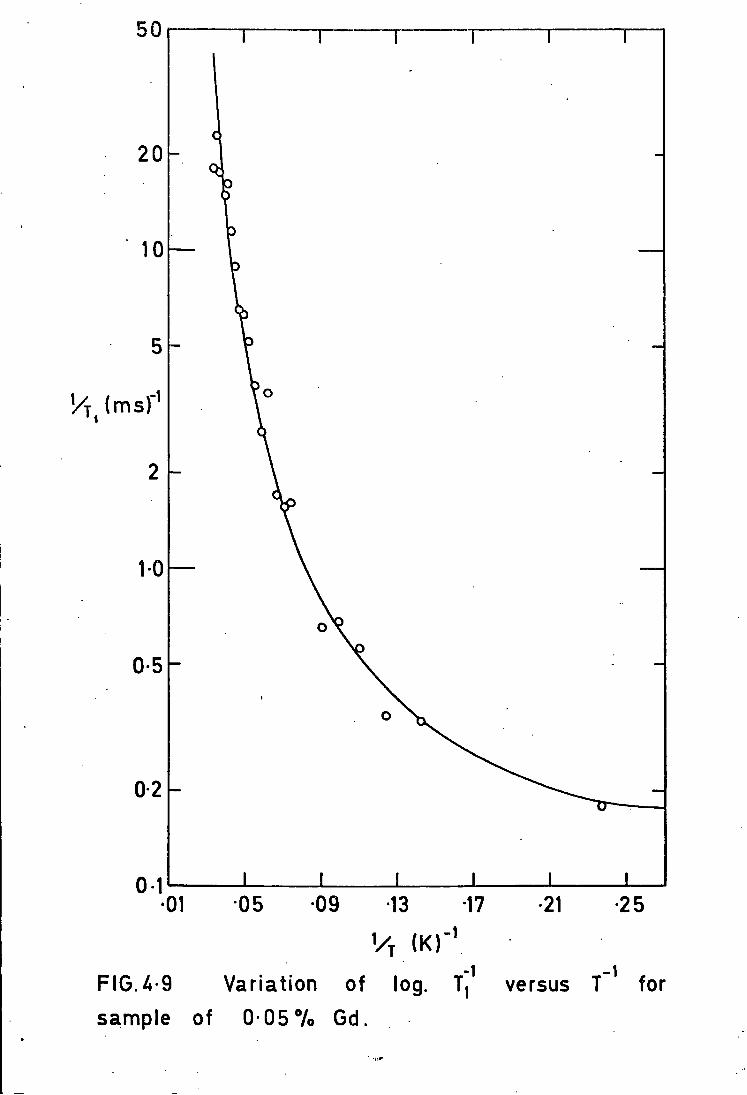
50
20
10
/ T (msj 11
10
0-2
0-1 05 09 01 2 25 3 7
VR (K) FIG.4-9 Variation of log. T, for versus T
sample of 0 0 5 % Gd
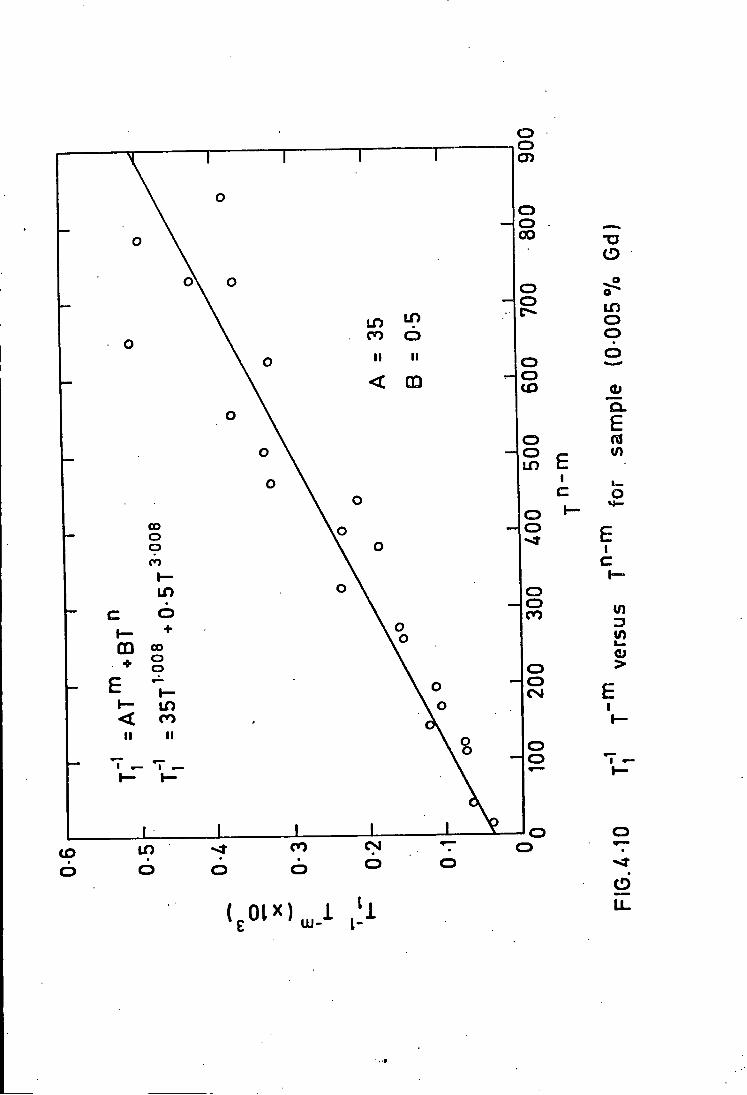
o
oo T3
IN CO
I I o < CD CO <L»
I/) Lf) E
I
CO
CO
Lf) V) CO
m co
CM If) I < CO
I I I I
I
CM CO IX) CO
LL ( - O l X ) . i '1
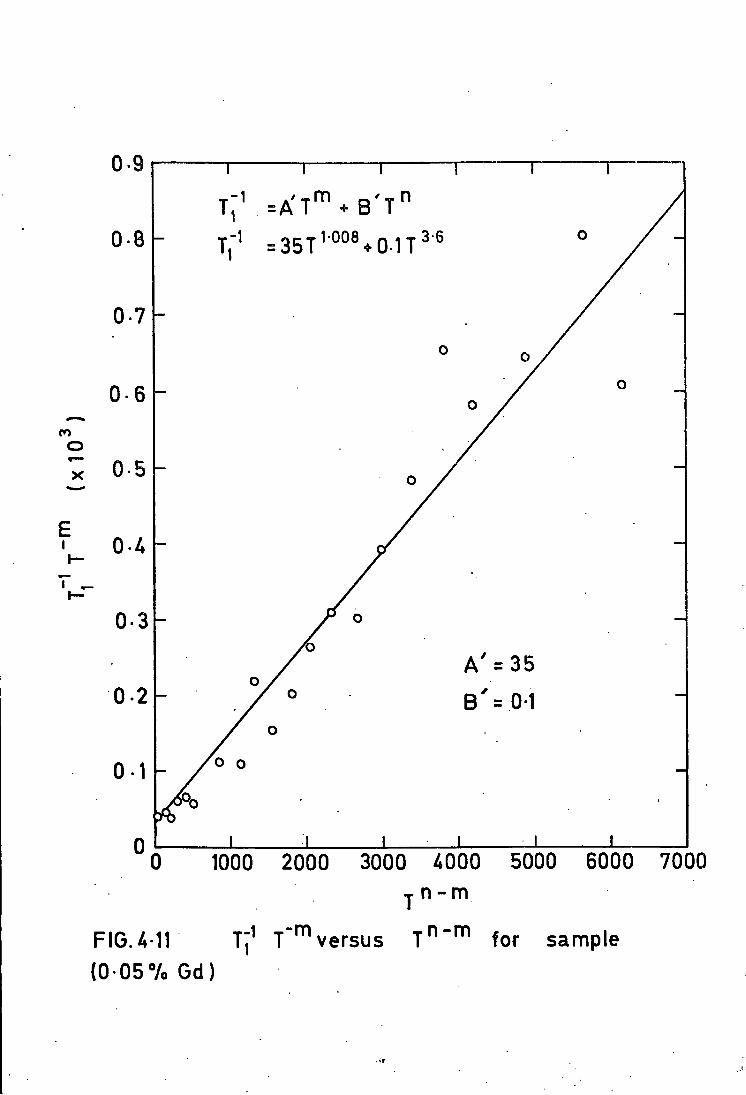
m n B T A T 0-8 1008 + 0 IT 35T
A ' = 35
0-6
0-1
0 I I J I : I —I 1 1 0 1000 2000 3000 4000 5000 6000 7000
T n - m
FIG.4-11 1]] T " m versus T n ~ m for sample (0 0 5 % Gd)
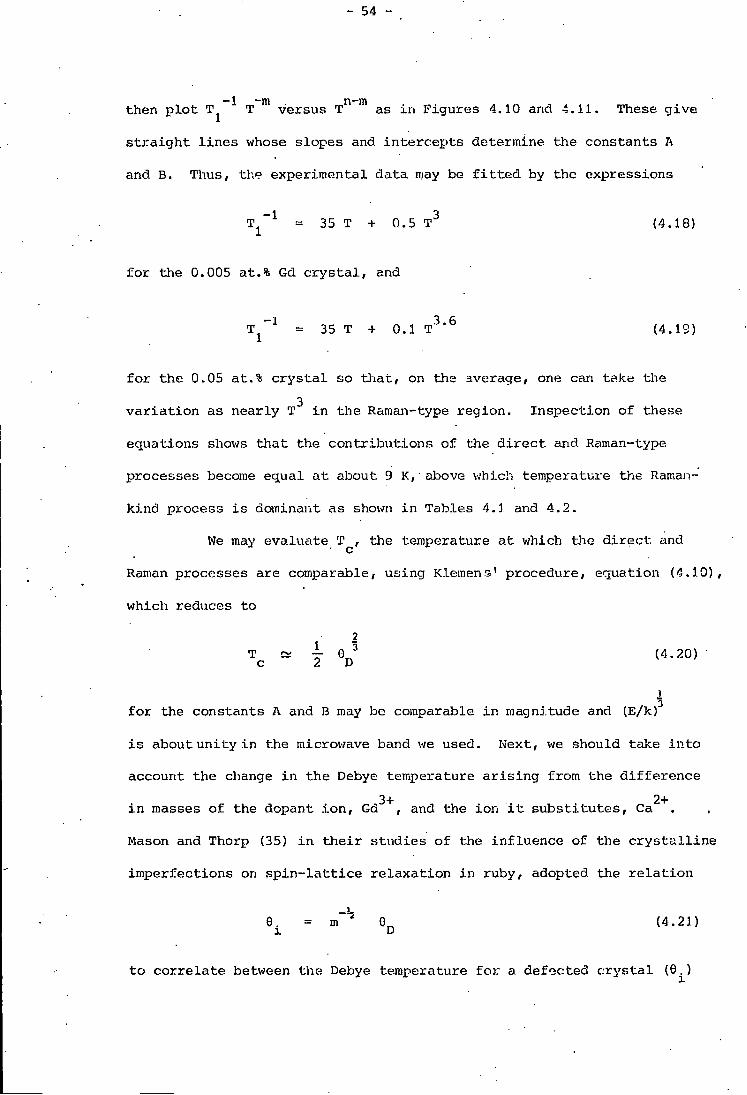
- 54 -
then p l o t * T m v e r s u s T n m as i n F i g u r e s 4.10 and 4.11. These, g i v e
s t r a i g h t l i n e s whose s l o p e s and i n t e r c e p t s determine the c o n s t a n t s A
and B. Thus, the experimental d a t a may be f i t t e d by the e x p r e s s i o n s
T 1 " 1 = 35 T + 0.5 T 3 (4.18)
f o r the 0.005 a t . % Gd c r y s t a l , and
T ^ _ 1 = 35 T + 0.1 T 3 " 6 (4.19)
f o r the 0.05 a t . % c r y s t a l so t h a t , on the average, one can take the 3
v a r i a t i o n as n e a r l y T i n the Raman-type r e g i o n . I n s p e c t i o n of these
equations shows t h a t the c o n t r i b u t i o n s of the d i r e c t and Raman-type
p r o c e s s e s become equal a t about 9 K, • above which temperature the Raman-
kin d p r o c e s s i s dominant as shown i n T a b l e s 4.1 and 4.2.
We may e v a l u a t e T f the temperature a t which the d i r e c t and
Raman p r o c e s s e s a r e comparable, u s i n g Klemens' procedure, equation (4.10),
which reduces to
2 T cs ~ QJ (4.20) C 2 D
f o r the c o n s t a n t s A and B may be comparable i n magnitude and (E/k)"
i s about u n i t y i n the microwave band we used. Next, we should take i n t o
account the change i n the Debye temperature a r i s i n g from the d i f f e r e n c e 3+ 2+ i n masses of the dopant i o n , Gd , and the i o n i t s u b s t i t u t e s , Ca
Mason and Thorp (35) i n t h e i r s t u d i e s of the i n f l u e n c e of the c r y s t a l l i n e
i m p e r f e c t i o n s on s p i n - l a t t i c e r e l a x a t i o n i n ruby, adopted the r e l a t i o n
G. = m"*5 0^ (4.21) 1 D
t o c o r r e l a t e between the Debye temperature f o r a d e f e c t e d c r y s t a l (6^)

F i r s t Term Second Term T o t a l R a t i o
T1R / T1D T (K) T Cms) ^ I D T 1 R ( m s ) 1 / T1R T (ms) 1/T X
R a t i o
T1R / T1D
2 14.21 0.07 248.62 0.004 13.44 0.0074 17.6
3 9.44 0.11 73.43 0.01 8.36 0.12 7.8
3.5 8.08 0.12 46.18 0.02 6.88 0.14 5.7
4.2 6.73 0.15 26.67 0.04 5.37 0.19 4.0
6 4.69 0.21 9.13 0.11 3.10 0.32 1.9
8 3.51 0.28 3.84 . 0.26 1.83 0.54 l . i
9 3.12 0=32 2,70 0.37 1.45 0.69 0.9
10 2.81 0.36 1.96 •0.51 1.16 0.87 0.7
12 2.33 0.43 1.13 0.88 0,76 1.31 0.5
14 2.00 0.50 0.71 1.40 0.53 1.90 0.4
16 1.75 0.57 0.48 2.10 0.38 2.67 0.3
18 1.55 0.64 0.34 2.98 0.28 3.63 0.2
20 1.39 0.72 0.24 4.10 0.21 4.82 0.2
22 1.27 0.79 0.18 5.46 0.16 6.25 0.1
24 1.16 0.86 0.14 7.10 0.13 7.96 0.1
26 1.07 0.93 0.11 9.02 0.10 9.95 0.1
28 0.99 1.01 0.09 11.27 0.08 12.28 0.1
30 0.93 1.08 0.07 13.87 0.07 14.95 0.1
T a b l e 4.1: E v a l u a t i o n of the f i t t i n g equation, -1 3 T^ = 35 T + 0.5 T f o r temperatures from
2 K up to 30 K.

T (K) F i r s t Term Second Term To t a l Ratio T 1 D(ms) 1 / T1D T 1 R&»8) ^ I R Tj(ms) T1R / T1D
'2 14.21 6.07 824.69 0.001 13.97 0.071 53.7
3 9.44 0.11 191.59 0.005 8.99 0.115 20.4
3.5 8.08 0.12 110.00 0.009 7.53 0.129 13.6
4 6.73 0.15 57.06 0.02 6.02 0.17 8.5
6 4.69 0.21 15.80 0.06 3.62 0.27 3.4
8 3.51 0.28 5.61 0.18 2.16 0.46 1.6
9 3.12 0.32 3.67 0.27 1.69 0.59 1.2
10 2.81 0.36 2.51 0.40 1..33 0.76 0.9
12 2.33 0.43 .1.30 0.77 0.84 1.20 O.C
14 2.00 0.50 0.75 1.34 0.54 1.84 0.4
16 1.75 0.57 0.46 2.16 0.37 2.73 0.3
18 1.55 0.64 . 0.30 3.30 0.25 3.94 0.2
20 1.39 0.72 0.21 4.83 0.18 5.54 0.2
22 1.27 0.79 0.15 6.80 0.13 7.59 0.1
24 1.16 0.86 0.11 9.31 0.10 10.17 0.1
26 1.07 0.93 ' 0.08 12.41 0.07 13.34 0.1
28 0.99 1.01 0.06 16.21 0.06 17.22 0.1
30 0.93 1.08 0.05 20.78 0.05 21.86 \
0.1
Table 4.2: Evaluation of the f i t t i n g equation ,
for temperatures from 2 K to 30 K.

- 55 -
and that of a perfect c r y s t a l (6^) , where ITI i s the mass r a t i o of the
dopant ion to that which i t replaces. Knowing that 0^ = 155 K and the
atomic weights of Gd and Ca are 157.25 and 40.08 respectively, we find
that 6. = 78 K. Substituting t h i s value, 0. instead of 8 i n Equation i l D ^ (4.20) we get T - 9 K which i s almost the same as the values given
from the experimental data (Figures 4.5 and 4.6) and those given from
f i t t i n g expressions (Table 4.1 and 4.2).
The explanation of the observed T^ va r i a t i o n appears to l i e
i n the presence of defects i n the c r y s t a l s . As i s mentioned i n Section -3
4.2.5, a T v a r i a t i o n with T^ i n the Raman region was predicted by
Castle e t a l (23) and f i t t e d the observed behaviour of i r r a d i a t i o n
centres i n quartz.
Also, a study of the temperature dependence of the relaxation
times for ruby single c r y s t a l s from 1.5 K to 120 K reported by Mason and
Thorp (35) has shown that the chromium ions occupy two types of s i t e s
within the l a t t i c e , one perfect and the other distorted. Although these
workers were studying d i f f e r e n t c r y s t a l s with a d i f f e r e n t dopant t h e i r
suggestion of the type of defect present i n the ruby c r y s t a l s i s of
much i n t e r e s t because i t i s very s i m i l a r to the suggestion which i s made
i n Section 3.7. I t seems l i k e l y that t h i s sort of defect i s a possible 3
reason for the observed T behaviour although detailed analysis i s s t i l l
needed for confirmation.
In order to present some figures for defect d e n s i t i e s i n
Gd^+/CaWO^ we notice that with the entry of Gd^ + ion into a Ca^ + s i t e
the formation of one calcium vacancy for every tv/o Gd"^+ ions occurs, 18 -3
which amounts to a calcium vacancy density of about 10 cm Besides,
concentrations of calcium' and oxygen vacancies are also formed as Schottky
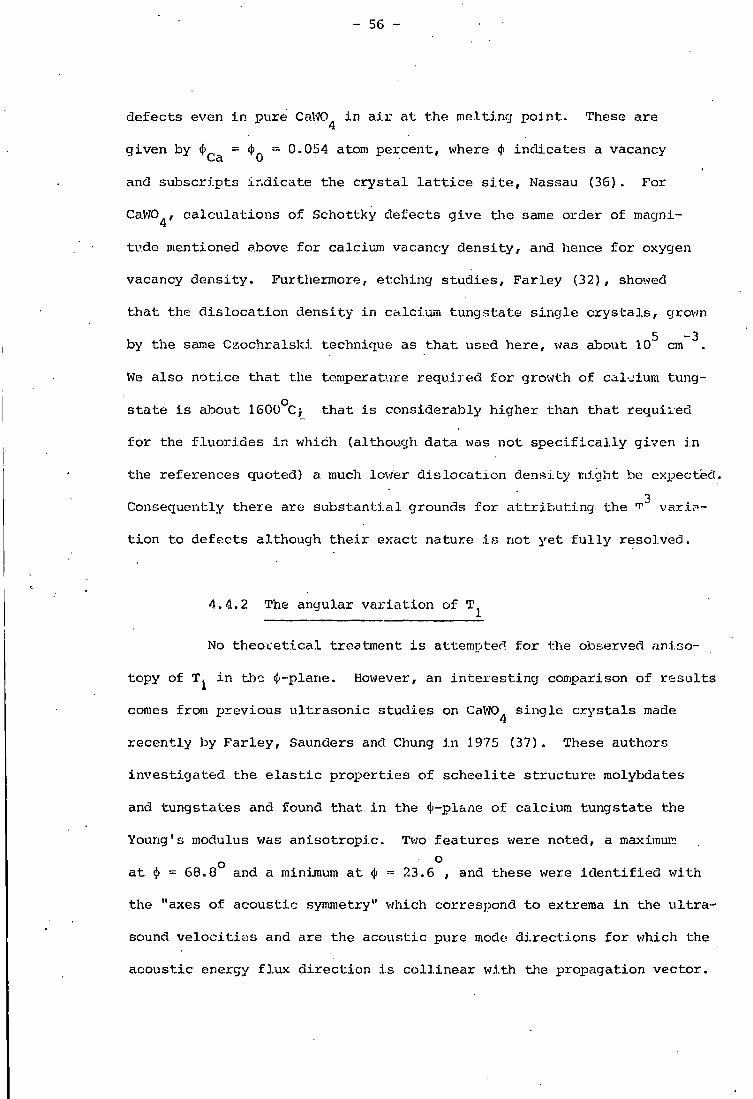
- 56 -
defects even i n pure CaWO^ i n a i r at the melting point. These are
given by <j> = <|> = 0.054 atom percent, where <J> indicates a vacancy Ca 0
and subscripts indicate the c r y s t a l l a t t i c e s i t e , Nassau ( 3 6 ) . For
CaWO^, calculations of Schottky defects give the same order of magni
tude mentioned above for calcium vacancy density, and hence for oxygen
vacancy density. Furthermore, etching studies, Farley ( 3 2 ) , showed
that the d i s l o c a t i o n density in calcium tungstate single c r y s t a l s , grown 5 -3
by the same Czochralski technique as that used here, was about 10 cm
We also notice that the temperature required for growth of caloium tung
state i s about 1600°C; that i s considerably higher than that required
for the fluorides in which (although data was not s p e c i f i c a l l y given i n
the references quoted) a much lower dislocation density might be expected.
Consequently there are substantial grounds for attributing the T" varip-
tion to defects although t h e i r exact nature i s not yet f u l l y resolved.
4.4.2 The angular variation of T^
No t h e o r e t i c a l treatment i s attempted for the observed ani.so-
topy of T^ i n the (j)-plane. However, an int e r e s t i n g comparison of r e s u l t s
comes from previous ultrasonic studies on CaWO single c r y s t a l s made
recently by Farley, Saunders and Chung i n 1975 ( 3 7 ) . These authors
investigated the e l a s t i c properties of sc h e e l i t e structure molybdates
and tungstates and found that i n the <t>-plane of calcium tungstate the
Young's modulus was anisotropic. Two features were noted, a maximum
at $ = 68.8° and a minimum a t <j) = 23.6 , and these were i d e n t i f i e d with
the "axes of acoustic symmetry" which correspond to extreroa i n the u l t r a
sound v e l o c i t i e s and are the acoustic pure mode directions for which the
acoustic energy flux direction i s c o l l i n e a r with the propagation vector.
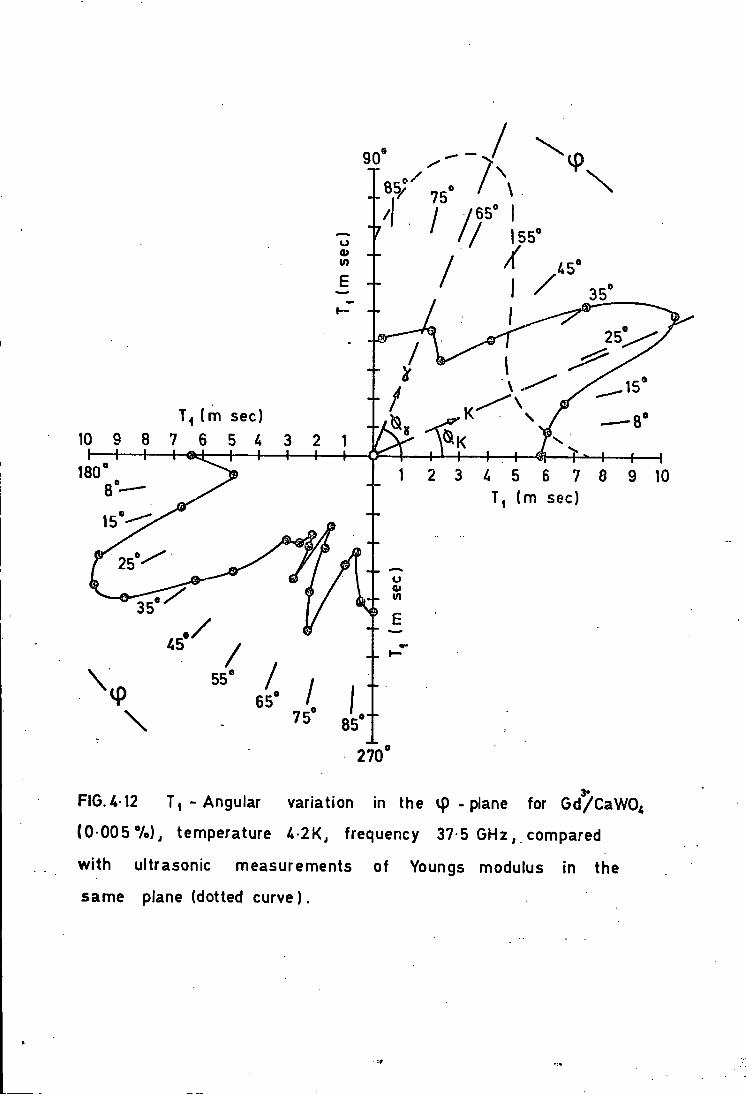
J ^ 90
/ 85? \ 75 65°
7 155°
/ 10 45
35
25 /
15
K T, (m sec) 8 10 9 8 7 6 5 4 3 2 1
180° 1 2 3 4 5 6 7 8 9 10 8° T, (m sec) 15'
2 5 ^
in 35
45 / / \ o 55
•\ _ __ O 65
75 85
270°
FIG. U-12 T, - Angular variation in the vp - plane for Gcf/CaWO*
(0 0 0 5 % ) , temperature 4-2K, frequency 37-5 GHz , compared
with ultrasonic measurements of Youngs modulus in the
same plane (dotted curve) .
- 57 -
The positions of extrema i n our var i a t i o n show a remarkable c o i n c i
dence with the "acoustic axes of symmetry" of the c r y s t a l . The u l t r a
sonic and relaxation data are compared in Figure 4.12. They show a
close f i t between the direction of the minimum of T^ and the acoustic
Y-ai:is, and also of the maximum of T^ with the acoustic k-axis. The
r a t i o of Young's modulus along the y and k axes was given as 2.1 at 295 K,
compared with the r a t i o of about 2.1 at 4.2 K for the s p i n - l a t t i c e relaxa
tion rates i n these d i r e c t i o n s . I t appears that the maximum relaxation
rate ( i . e . minimum T^) occurs when the ultrasound v e l o c i t y i s greatest
and vice versa. The acoustic axes have 4/mmm symmetry in calcium tungstate
and t h i s accounts, on the same basis, for the maximum and minimum valuer-
of T found between 4» = 180° and $ • = 270°.
- 58 -
CHAPTER 5
3+ SPIN-LATTICE RELAXATION OF Fe IN IRON DOPED MAGNESIUM OXIDE
The main i n t e r e s t i n studying the s p i n - l a t t i c e relaxation of Fe"^+
i n magnesium oxide single c r y s t a l s i s that i t provides another example of
an S-state ion i n a well known l a t t i c e structure. Although iron doped
magnesium oxide has received a great deal of attention from previous
workers, most of t h e i r ESR studies were at X-band frequencies ( ~ 9 GHz). 3+
The ESR spectrum of Fe /MgO at magnetic f i e l d s of 13.5 KG ( i . e . Q-band
frequencies) was reported by Cheng and Kemp i n 1971 (1). They used a
method combining magnetic-circular-dichroism (MCD) and electron spin
resonance (ESR) for studying the s p i n - l a t t i c e relaxation mechanism. No
T^ values were published i n their work. S p i n - l a t t i c e measurements,
however, received l e s s attention and almost nothing was published at
higher freuqnecies. Hence, our measurements of T^ at Q-band . (37.5 GHz)
are thought to contribut something to t h i s f i e l d .
5.1 C r y s t a l structure, doping and charge compensation
The magnesium oxide structure i s that of the well-known sodium
chloride; of the type MX, where M denotes the metal ion or atom and X
an electronegative element, e.g. oxygen i n the oxides, or fluorine or
chlorine i n the halides, etc. The l a t t i c e i s face-centred cubic of 5
space group 0^ as indicated by Cornwell (2), (the point group 0^ and the
assignment of superscript by Schonflies i s rather a r b i t r a r y ) . Each
magnesium atom has a coordination number of s i x , the neighbours being
at the v e r t i c e s of a regular octahedron. In t h i s octahedral co-ordination 2+ 2-
the ionic r a d i i , according to Kelly and Groves (3) for Mg and 0 are
0.65 ? and 1.40 A respectively. Wyckoff (4) gave the l a t t i c e parameter
- 59 -
as a Q = 4.2112 By doping the single c r y s t a l s of MgO with iron, the
l a t t e r i s expected to go into the l a t t i c e by substitution at the mag-3+
nesium s i t e s ; ths predominant valency state i s Fe as concluded by
Thorp, Vasquez, Adcock and Hutton (5) i n t h e i r recent work on FSR l i n e -
widths of Fe^+ i n MgO, whose o p t i c a l measurements also revealed features
3+
in d i c a t i v e of Fe . This, besides the observed ESR spectra at X- and
Q-bands (9.1 and 35.5 GHz) gave confirmation of the i r conclusion.
Further support i s given by the comparison of the i o n i c r a d i i of F e ^ +
o 2+ which at 0.64 A (3) i s almost the same as the corresponding Mg ion.
The extra p o s i t i v e charge on the F e ^ + ion however requires that there
should be some mechanism for charge compensation in the c r y s t a l . Actually,
three processes for achieving charge n e u t r a l i t y could be e f f e c t i v e as
discussed by Wertz and Auzins (6). F i r s t , compensation might occur with
an extra electron on an oxygen icn, O . However, t h i s was dismissed as
representing a very unstable configuration. This leaves us with two
reasonable p o s s i b i l i t i e s outside the oxygen octahedron. One i s repiace-2+ +1 ment of a Mg ion by a unipositive ion such as the L i ion, which v/as
postulated by Prener (7). From the i o n i c r a d i i point of view, t h i s should
f i t r eadily i n the c r y s t a l (with Na+* l e s s l i k e l y ) , while any other
unipositive ion i s probably too large to f i t without undue d i s t o r t i o n . 2+
The al t e r n a t i v e i s to have Mg vacancies d i s t r i b u t e d at random through
out the c r y s t a l . The p o s s i b i l i t y of i n t e r s t i t i a l O * ions was rejected,
since there i s hardly room i n the l a t t i c e to accommodate them.
5.2 Experimental r e s u l t s and discussion
The single c r y s t a l s of iron-doped magnesium oxide upon which measure
ments were made were obtained from V7 & C Spicer Ltd. (Cheltenham), having
been grown by electrofusion using pure powdered f e r r i c oxide and pure
- 60 -
powdered magnesia as the st a r t i n g materials. Since there was no
deliberate doping of a univalent element to maintain charge n e u t r a l i t y
one may invoke the vacancy compensation mechanism. The iron concentra
tions i n the samples used i n t h i s work were 140, 310 and 710 p.p.m.;
these had been determined by op t i c a l spectrographic analysis (Johnson-
Matthey Ltd.) to an accuracy of about 2%. Neither o p t i c a l examination
nor x-ray back r e f l e c t i o n photographs, used to orient the samples,
revealed any evidence of macroscopic cracking, flaws, s t r a i n or mosaic
formation. This led us to assume that the samples were of good c r y s t a l
l i n e q uality.
The pulse saturation technique, as mentioned before, was used for
the s p i n - l a t t i c e relaxation measurements a t 37.5 GHz. Measurements were
car r i e d out for the central £ •*—>• - t r a n s i t i o n at 4.2 K, except when
otherwise mentioned elsewhere.
5.2.1 Observation of two decay rates
The c r y s t a l s were oriented so that the magnetic f i e l d H was along
the <100> direc t i o n . In most of the semi-logarithmic plots produced from
the photographs of the exponential decay curves, the existence of two
relaxation rates could be observed as i n Figure 5.1. The longer relaxa
tion time was taken as the s p i n - l a t t i c e relaxation time T^, w h i l s t the
shorter relaxation time could be attributed to some contribution from
the energy l e v e l s of the system i n a cross-relaxation mechanism, as
discussed by Manenkov and Prokhorov (8). Previous experimental r e s u l t s
on Fe^+/MgO at 10 GHz by Castle and Feldman gave two values for the
exponents i n the rate equation and were published by Shiren (9). In a
preceding publication, Shiren (10) reported measurements of spin-phonon 3+ 2+ 3+ 2+ 2+ i n t e r a c t i o n s for iron group ions Cr , Mn , Fe , Fe and Ni in MgO,
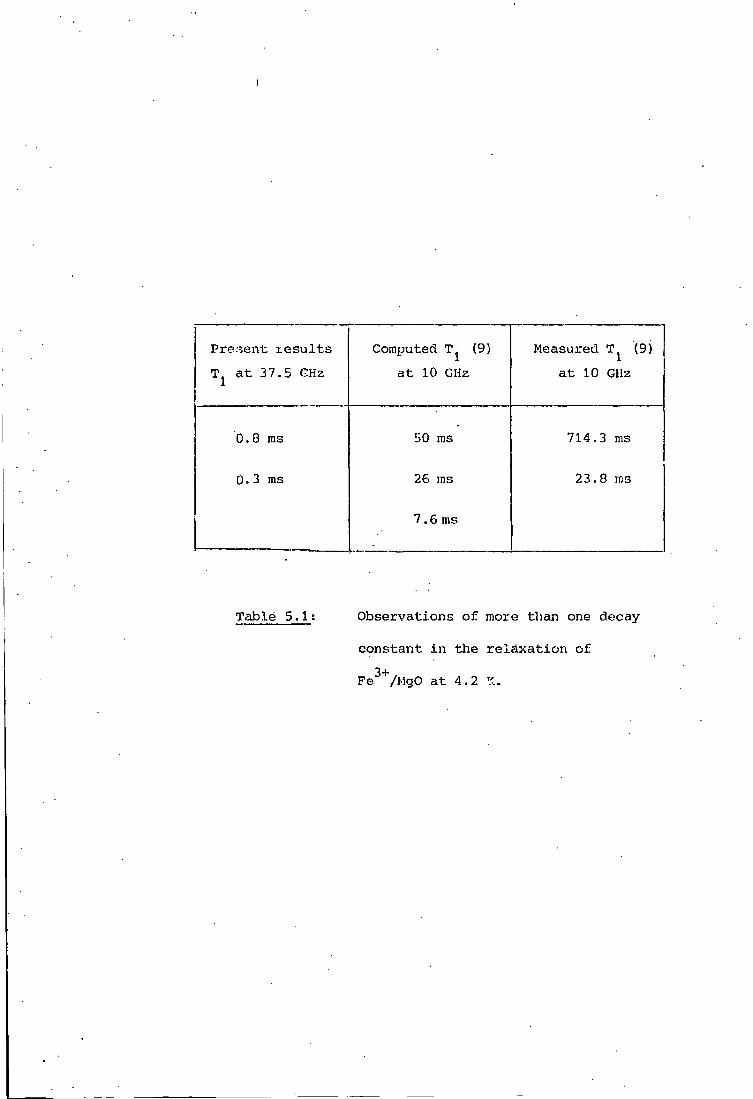
Present r e s u l t s Computed Tj (9) Measured (9) 1 at 37.5 GHz at 10 GHz at 10 GHz
0.8 ms 50 ms 714.3 ms
0.3 ms 26 ms 23.8 ms
7 .6 ms
Table 5.1: Observations of more than one decay
constant i n the relaxation of 3+
Fe /MgO at 4.2 \'.
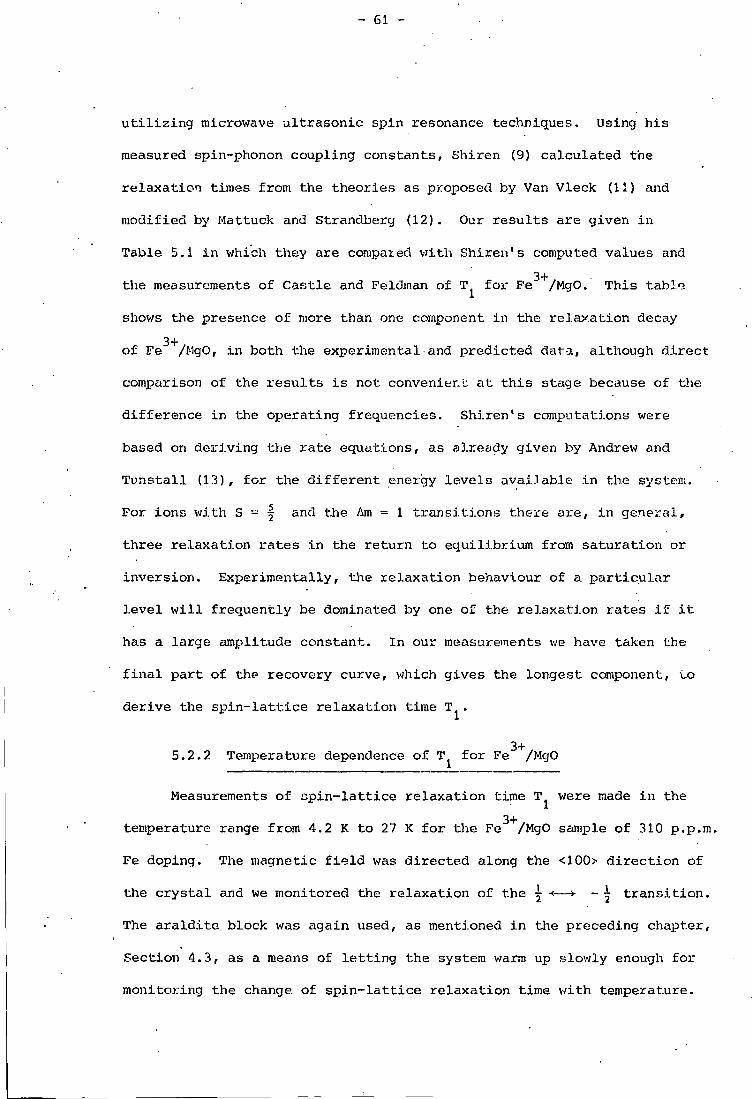
- 61 -
u t i l i z i n g microwave ult r a s o n i c spin resonance techniques. Using his
measured spin-phonon coupling constants, Shiren (9) calculated the
relaxation times from the theories as proposed by Van Vleck (11) and
modified by Mattuck and Strandberg (12). Our r e s u l t s are given i n
Table 5.1 i n which they are compared with Shiren's computed values and
the measurements of Castle and Feldjnan of T^ for Fe"^+/MgO. This table
shows the presence of more than one cormponent in the relaxation decay
of Fe^+/MgO, in both the experimental and predicted data, although direct
comparison of the r e s u l t s i s not convenient at t h i s stage because of the
difference in the operating frequencies. Shiren's computations were
based on deriving the rate equations, as already given by Andrew and
T u n s t a l l (13), for the d i f f e r e n t energy l e v e l s available i n the system.
For ions with S = | and the Am = 1 t r a n s i t i o n s there are, i n general,
three relaxation rates in the return to equilibrium from saturation or
inversion. Experimentally, the relaxation behaviour of a p a r t i c u l a r
l e v e l w i l l frequently be dominated by one of the relaxation rates i f i t
has a large amplitude constant. In our measurements we have taken the
f i n a l part of the recovery curve, which gives the longest component, to
derive the s p i n - l a t t i c e relaxation time T^.
3+ 5.2.2 Temperature dependence of T^ for Fe /MgO
Measurements of s p i n - l a t t i c e relaxation time T^ were made i n the 3+
temperature range from 4.2 K to 27 K for the Fe /MgO sample of 310 p.p.m.
Fe doping. The magnetic f i e l d was directed along the <100> direction of
the c r y s t a l and we monitored the relaxation of the j -<—*• - ~ t r a n s i t i o n .
The a r a l d i t e block was again used, as mentioned i n the preceding chapter,
Section 4.3, as a means of l e t t i n g the system warm up slowly enough for
monitoring the change of s p i n - l a t t i c e relaxation time with temperature.
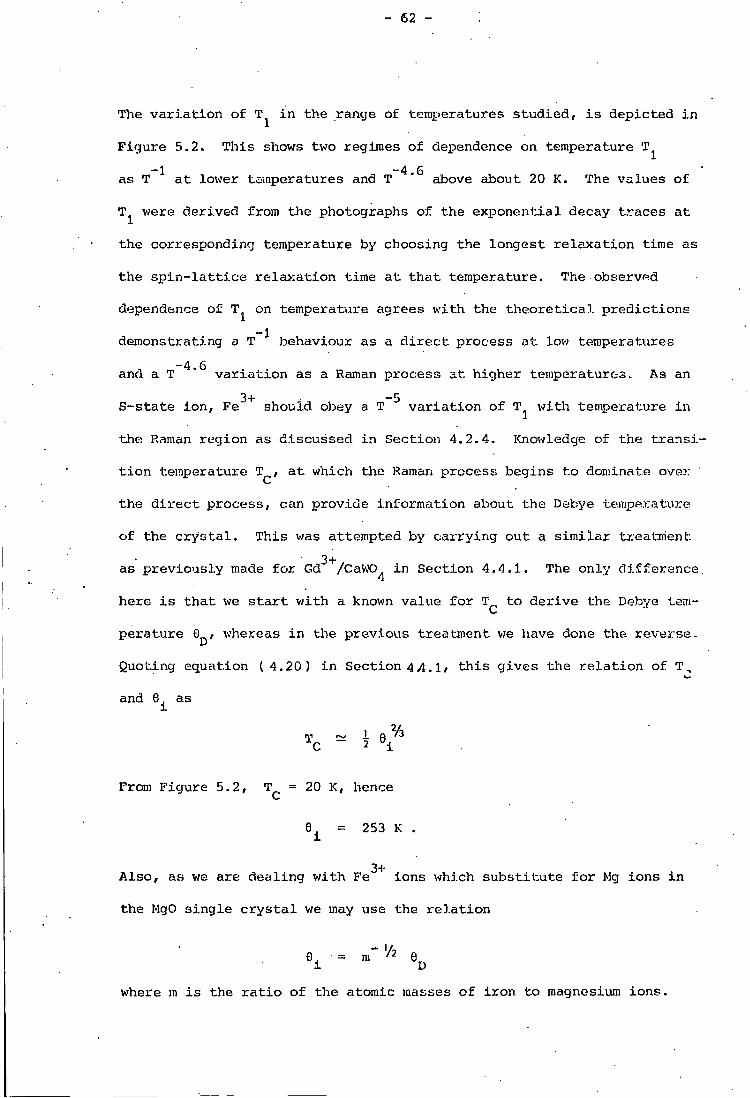
- 62 -
The va r i a t i o n of T^ i n the range of temperatures studied, i s depicted i n
Figure 5.2. This shows two regimes of dependence on temperature T -1 -4.6
as T at lower temperatures and T " above about 20 K. The values of
T^ were derived from the photographs of the exponential decay traces at
the corresponding temperature by choosing the longest relaxation time as
the s p i n - l a t t i c e relaxation time a t that temperature. The observed
dependence of T^ on temperature agrees with the th e o r e t i c a l predictions demonstrating a T * behaviour as a d i r e c t process a t low temperatures
-4.6 and a T * va r i a t i o n as a Raman process at higher temperatures. As an 3+ -5 S-state ion, Fe should obey a T var i a t i o n of T^ with temperature i n the Raman region as discussed in Section 4.2.4. Knowledge of the t r a n s i
tion temperature T^, a t which the Raman process begins to dominate over '
the d i r e c t process, can provide information about the Debye temperature
of the c r y s t a l . This was attempted by carrying out a s i m i l a r treatment
as previously made for Gd^/CaWO^ in Section 4.4.1. The only difference,
here i s that we s t a r t with a known value for T to derive the Debye tem
perature 0 D, whereas i n the previous treatment we have done the reverse.
Quoting equation ( 4.20) i n Section 4 4.1, t h i s gives the r e l a t i o n of
and 6. as i
T — i 0.2/3
C 2 l
From Figure 5.2, T^ = 20 K, hence
0. = 253 K . l
Also, as we are dealing with Fe^ H ions which substitute for Mg ions i n
the MgO single c r y s t a l we may use the r e l a t i o n
0. = m" 1 / 2 0^ i D where m i s the r a t i o of the atomic masses of iron to magnesium ions.
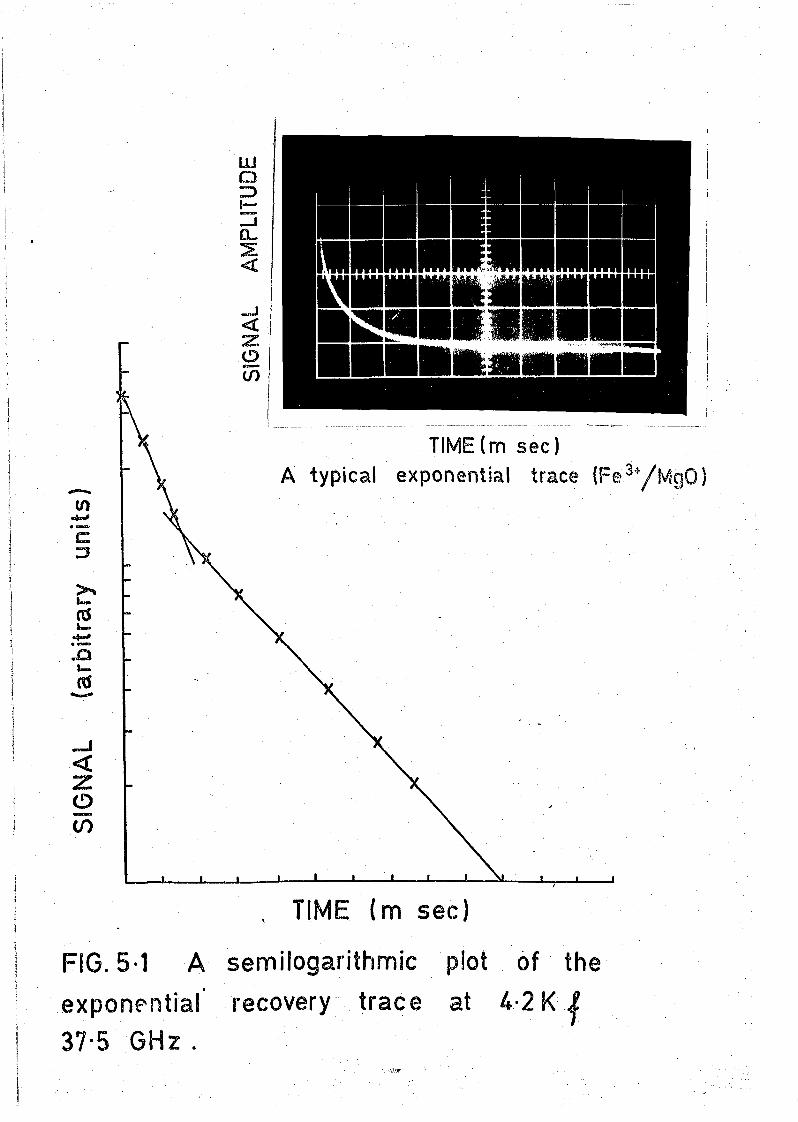
UJ
fx.
••• < ! •MMM MMHM • • • M M I m ^ .
• • • M l * a •
TIME(m sec)
A typ ica l exponential trace {Fe 3 yiv1g0
t a l l
<
CO
•
TIME (m sec)
FIG. 5-1 A semilogarithmic plot of the
exponential recovery trace at 4 2 K |
37-5 GHz .
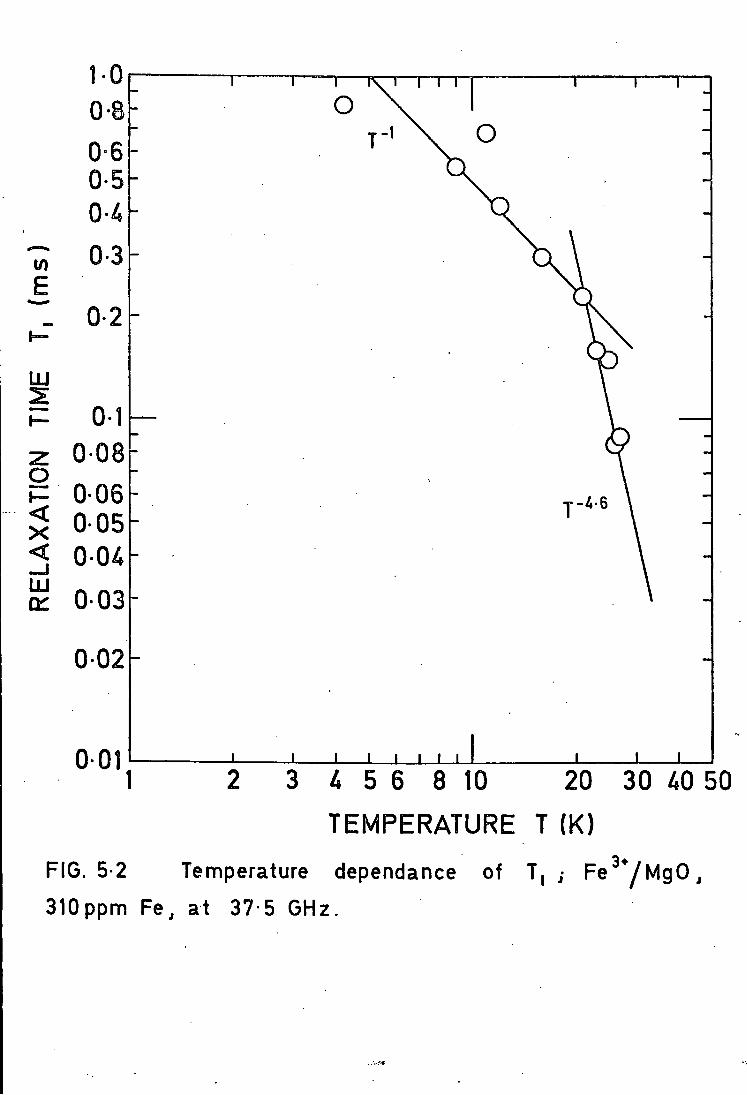
V)
E
LLJ 2
g
< x < LU
4 5 6 8 10 20 30 40 50
TEMPERATURE T (K) 3* FIG. 5-2 Temperature dependance of T, ; Fe / M g O ,
310ppm F e , at 37-5 GHz .

- 63 -
Therefore ,
e = / 55.847 \" 2 i \ 24.305 j D
or ,
0 D = 383 K .
For comparison, we find from the physical tables (;L4) that the Debye
temperature for MgO has been given as 946 K. This was reported by
Barron et a l , 1959 ( 1 5 ) , when studying the heat capacity of c r y s t a l l i n e
magnesium oxide. I t was found that t h e i r published value was the Debye
temperature at 0 K (0Q) and from t h e i r plotting of 0^ versus temperature
in the range 20 < T < 300 K we found that 6 at 77 K i s nearly 750 K.
This shows that our estimated 0 Q i s f a r below that published by Barron
et a l . Reasons for the discrepancy i n the r e s u l t s may be (a) the
differences i n the experimental techniques, (b) the preparation of tiie
samples examined.- This l a t t e r condition may include the p a r t i c l e s i z e
of MgO, the surface roughness and other possible factors such as con
tamination of the surfaces by adsorbed gases.
This value of T„ i s i n exact agreement with that reported by
Pace, Sampson and Thorp, 1961 (16) i n t h e i r studies on synthetic sapphire
(Fe^/Al^O ) at 34.6 GHz. Using a pulse saturation method, they found
that the main features of the v a r i a t i o n of the relaxation times show a
T * dependence on temperature up to 10 K and a t r a n s i t i o n to a region
of T ^ occurs at about 20 K.
Kask et a l , 1963 (17) studied the paramagnetic relaxation of
the F e ^ + ion i n corundum (Al^O^) i n the 3-cm range by u t i l i z i n g the
pulse saturation method. The temperature dependence of T was determined
i n the i n t e r v a l 2 - 8 0 K. I t was shown that T v a r i e s approximately as
- 64 -
T i n the region from 2 to 5 K. In the i n t e r v a l 5 - 15 K, varied
anomalously slowly and in the 20 - 80 K range varied as T ^.
5.2.3 Concentration dependence of
Measurements of T for the Fe"^+/MgO samples available gave the
values presented i n Table 5.2. Again, we emphasize that the s p i n - l a t t i c e
relaxation time T^ was chosen as the longer time i n the semi-logarithmic
plots of the recovery traces photographs. These were taken at 4.2 K with
the magnetic f i e l d I-I along the <100> di r e c t i o n .
I t has long been observed that at s u f f i c i e n t l y low temperatures
and s u f f i c i e n t l y high concentrations of paramagnetic impurities the
transfer of energy from a spin system- to the l a t t i c e may be dominated by
concentration-dependent relaxation processes. One explanation wss suggested
by Van Vleck, 1960 (18), i . e . that the spins in the c r y s t a l cross relax
to some paramagnetic s i t e s which relax rapidly to the l a t t i c e . The rapidly
relaxing s i t e s may, for example, cons i s t of spins of a paramagnetic species
having exceedingly short s p i n - l a t t i c e relaxation times, spins located i n
distorted c r y s t a l f i e l d s , or exchange-coupled c l u s t e r s of two or more
ions which relax rapidly co the l a t t i c e as a r e s u l t of phonon modulation
of the exchange coupling. In studying the s p i n - l a t t i c e relaxation of C r ^ +
ions i n ruby c r y s t a l s , Standley and Vaughan, 1965 (19) suggested that the
observed concentration-dependence i s possibly due to impurity ions that
constitute the f a s t relaxing centres. Solomon i n 1966 (20) studied the 2+
concentration-dependence of s p i n - l a t t i c e relaxation times for Mn and 3+
Fe i n MgO at 9.6 GHz u t i l i z i n g the technique of saturation recovery.
He found that T^ i s roughly proportional to the inverse of concentration.
S i m i l a r l y , we apply t h i s law to our r e s u l t s and i t gives the values
presented i n the l a s t column i n Table 5.2. The agreement between the
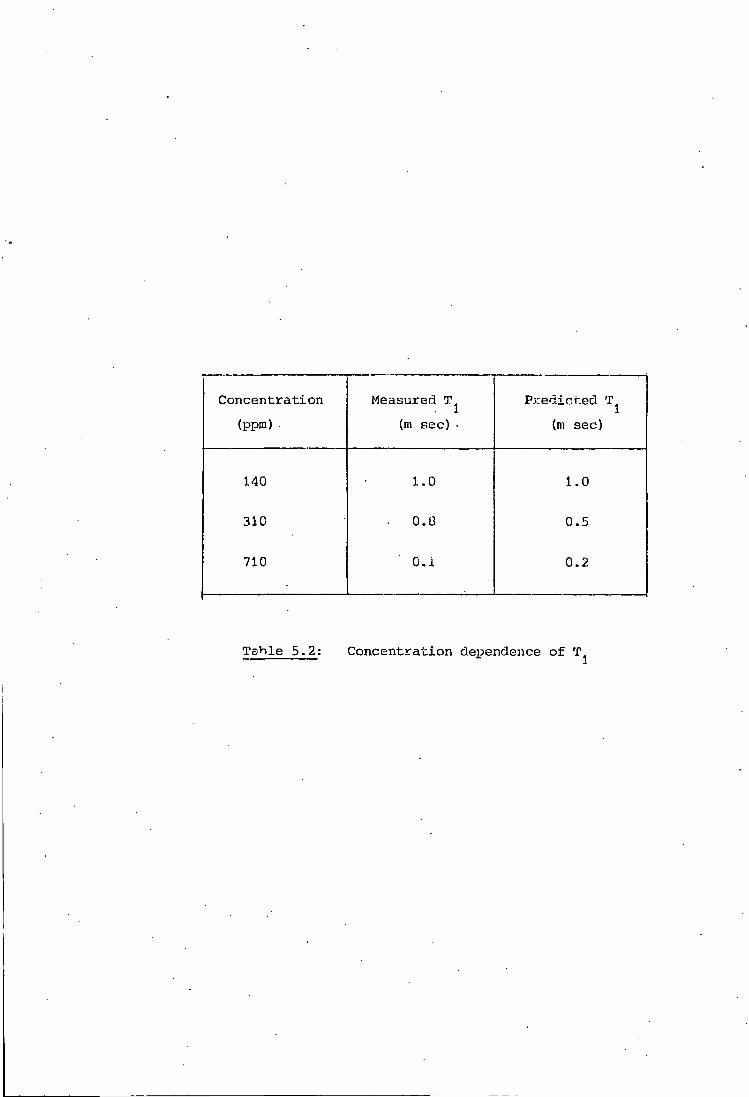
Concentration (ppm)
Measured (m sec) •
Predicted T (m sec)
140 1.0 1.0
310 0.0 0.5
710 O.i 0.2
Table 5.2: Concentration dependence of T
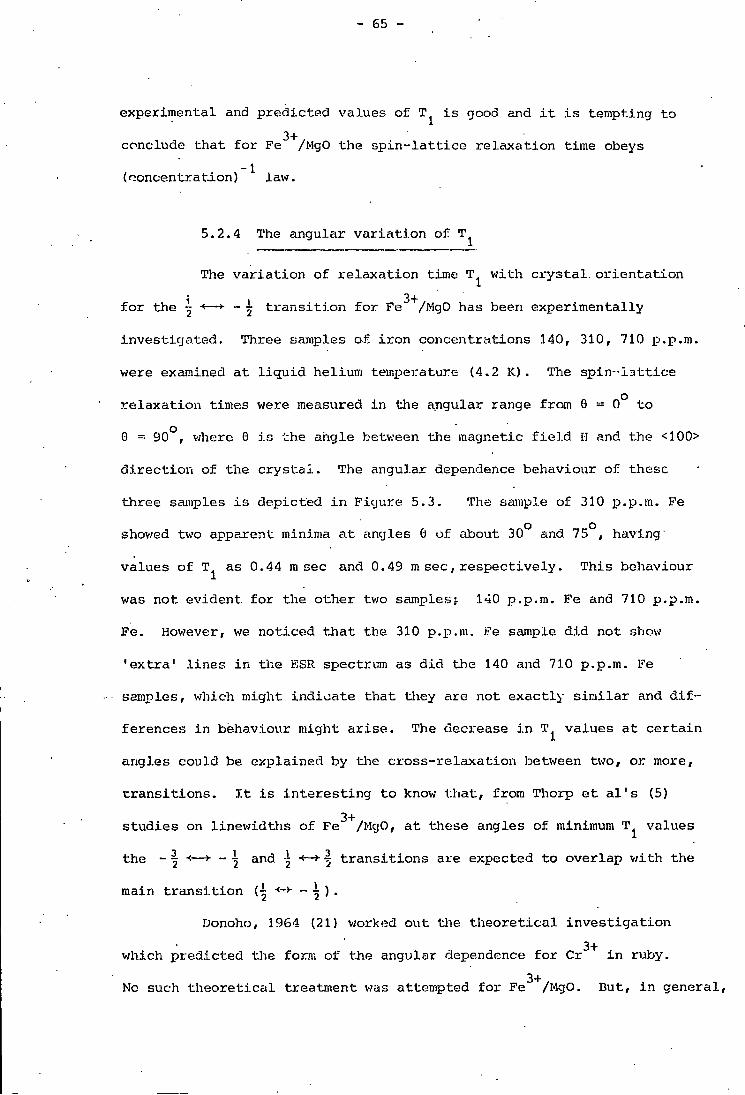
- 65 -
e x p e r i m e n t a l and p r e d i c t e d v a l u e s o f i s good and i t i s t e m p t i n g t o 3+
c o n c l u d e t h a t f o r Fe /MgO t h e s p i n - l a t t i c e r e l a x a t i o n t i m e obeys
( c o n c e n t r a t i o n ) * law.
5.2.4 The a n g u l a r v a r i a t i o n o f T
The v a r i a t i o n o f r e l a x a t i o n t i m e T. w i t h c r y s t a l , o r i e n t a t i o n 1
f o r t h e ~ •*—»• - j t r a n s i t i o n f o r Fe^+/MgO has been e x p e r i m e n t a l l y
i n v e s t i g a t e d . Three samples o f i r o n c o n c e n t r a t i o n s 140, 310, 710 p.p.m.
were examined a t l i q u i d h e l i u m t e m p e r a t u r e (4.2 K ) . The s p i n - l a t t i c e
r e l a x a t i o n t i m e s were measured i n t h e a n g u l a r range f r o m 0 = 0° t o
6 = 90°, where 6 i s t h e a n g l e between t h e m a g n e t i c f i e l d E and t h e <100>
d i r e c t i o n o f t h e c r y s t a l . The a n g u l a r dependence b e h a v i o u r o f t h e s e
t h r e e samples i s d e p i c t e d i n F i g u r e 5.3. The sample o f 310 p.p.m. Fe o o
showed two a p p a r e n t minima a t a n g l e s G o f ab o u t 30 and 75 , h a v i n g '
v a l u e s o f T^ as 0.44 msec and 0.49 m sec, r e s p e c t i v e l y . T h i s b e h a v i o u r
was n o t e v i d e n t f o r t h e o t h e r two samples^ 140 p.p.m. Fe and 710 p.p.m.
Fe. However, we n o t i c e d t h a t t h e 310 p.p.m. Fe sample d i d n o t show
' e x t r a ' l i n e s i n t h e ESR spectrum as d i d t h e 140 and 710 p.p.m. Fe
samples, w h i c h m i g h t i n d i c a t e t h a t t h e y a r e n o t e x a c t l y s i m i l a r and d i f
f e r e n c e s i n b e h a v i o u r m i g h t a r i s e . The decrease i n T v a l u e s a t c e r t a i n
a n g l e s c o u l d be e x p l a i n e d by t h e c r o s s - r e l a x a t i o n between t w o , o r more,
t r a n s i t i o n s . I t i s i n t e r e s t i n g t o know t h a t , f r o m T h o rp e t a l ' s (5) 3+
s t u d i e s on l i n e w i d t h s o f Fe /MgO, a t t h e s e a n g l e s o f minimum T^ v a l u e s
t h e - | <—• - \ and ~ <—*• \ t r a n s i t i o n s a r e e x p e c t e d t o o v e r l a p w i t h t h e
main t r a n s i t i o n {- - ) .
Donoho, 1964 (21) worked o u t t h e t h e o r e t i c a l i n v e s t i g a t i o n
w h i c h p r e d i c t e d t h e f o r m o f t h e a n g u l a r dependence f o r C r ^ + i n r u b y .
No such t h e o r e t i c a l t r e a t m e n t was a t t e m p t e d f o r Fe"*+/MgO. B u t , i n g e n e r a l ,
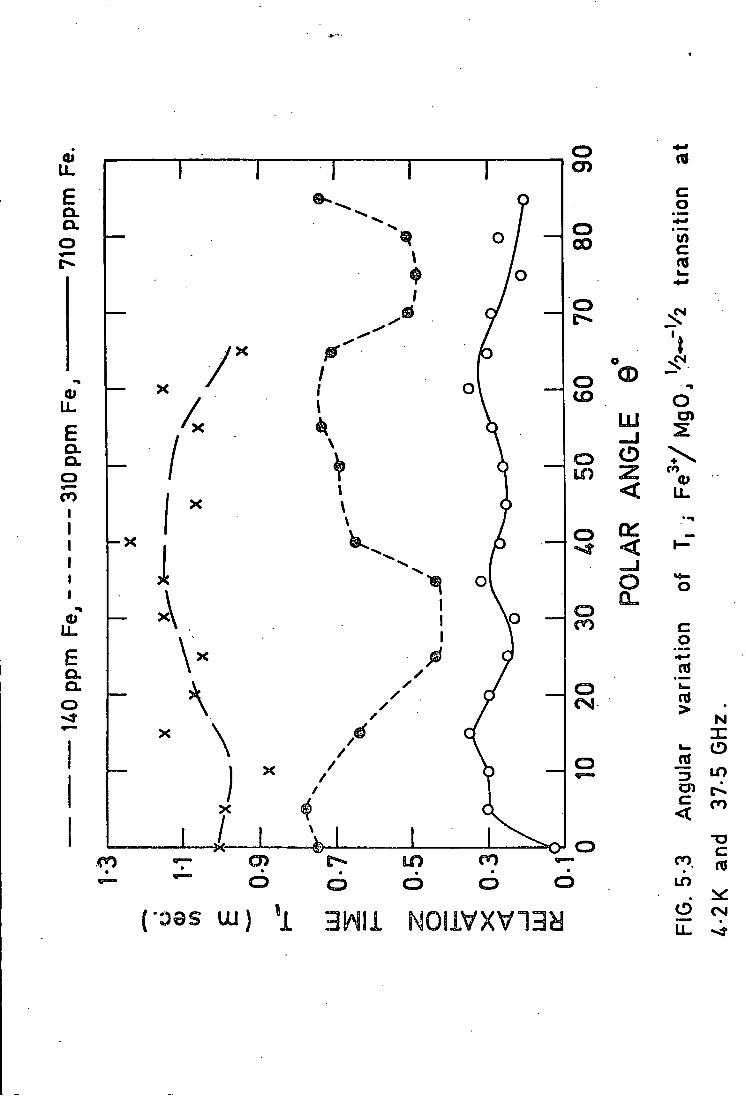
4
as Of LL
10 GO \
/" CM o CD
a» CO LL. LU
CO
<L LL CO
DC
O o CO LL
\ ns CM
N 4 \
) CD r*.
4 CO <
I P£ I 0 0 CD LO CO as
in o 5—
O CM 1 D 9 S ai) 1 3WH N0LLVXV13U LL ^
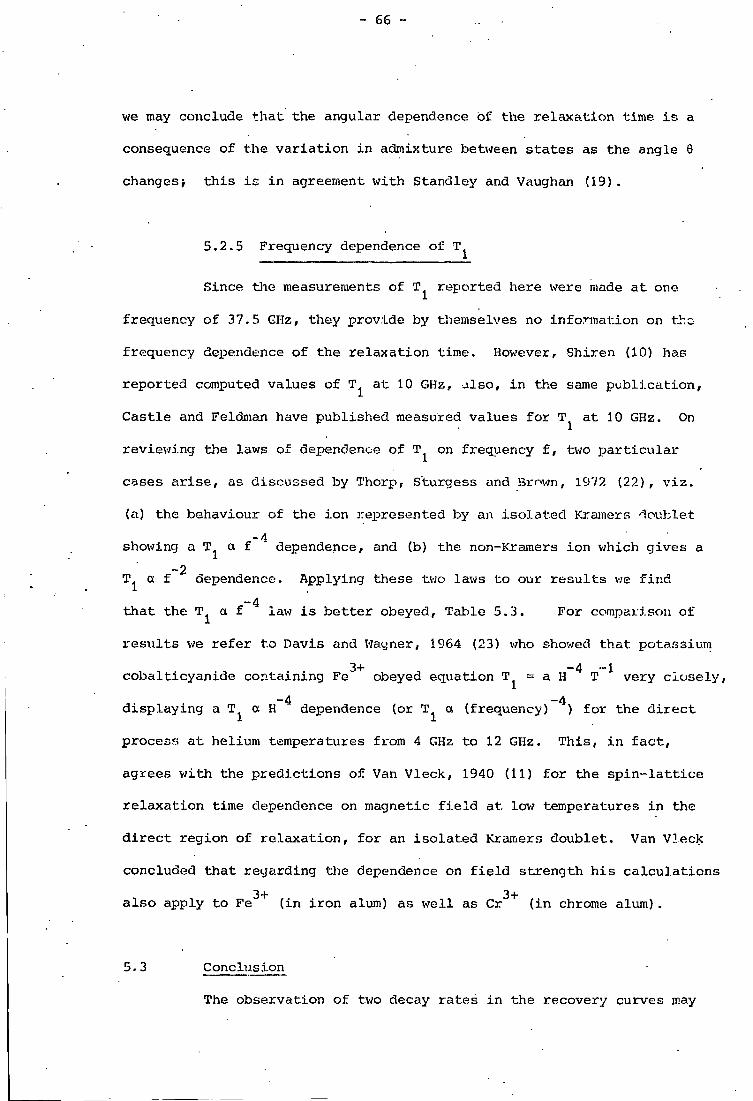
- 66 -
we may c o n c l u d e t h a t t h e a n g u l a r dependence o f t h e r e l a x a t i o n t i m e i s a
consequence o f t h e v a r i a t i o n i n a d m i x t u r e between s t a t e s as t h e a n g l e 0
changes; t h i s i s i n agreement w i t h S t a n d l e y and Vaughan ( 1 9 ) .
5.2.5 Frequency dependence o f
Si n c e t h e measurements o f r e p o r t e d h e r e were made a t one
f r e q u e n c y o f 37.5 GHz, t h e y p r o v i d e by them s e l v e s no i n f o r m a t i o n on t h e
f r e q u e n c y dependence o f t h e r e l a x a t i o n t i m e . However, S h i r e n (10) has
r e p o r t e d computed v a l u e s o f a t 10 GHz, a l s o , i n t h e same p u b l i c a t i o n ,
C a s t l e and Feldman have p u b l i s h e d measured v a l u e s f o r a t 10 GHz. On
r e v i e w i n g t h e laws o f dependence o f on f r e q u e n c y f , two p a r t i c u l a r
c ases c i r i s e , as d i s c u s s e d by T h o r p , S'turgess and Brown, 1972 ( 2 2 ) , v i z .
(a) t h e b e h a v i o u r o f t h e i o n r e p r e s e n t e d by an i s o l a t e d Kramers d o u b l e t
showing a a f dependence, and (b) t h e non-Kramers i o n w h i c h g i v e s a ~2
a f dependence. A p p l y i n g t h e s e two laws t o o u r r e s u l t s we f i n d -4
t h a t t h e a f law i s b e t t e r obeyed, T a b l e 5.3. For comparison o f r e s u l t s we r e f e r t o D a v i s and Wayner, 1964 (23) who showed t h a t p o t a s s i u m
3+ -4 -1 c o b a l t i c y a n i . d e c o n t a i n i n g Fe obeyed e q u a t i o n T = a H T v e r y c l o s e l y , -4 -4 d i s p l a y i n g a T^ a H dependence ( o r T^ a ( f r e q u e n c y ) ) f o r t h e d i r e c t
p r o c e s s a t h e l i u m t e m p e r a t u r e s f r o m 4 GHz t o 12 GHz. T h i s , i n f a c t ,
a g r e e s w i t h t h e p r e d i c t i o n s o f Van V l e c k , 1940 (11) f o r t h e s p i n - l a t t i c e
r e l a x a t i o n t i m e dependence on m a g n e t i c f i e l d at. low t e m p e r a t u r e s i n t h e
d i r e c t r e g i o n o f r e l a x a t i o n , f o r an i s o l a t e d Kramers d o u b l e t . Van V l e c k
c o n c l u d e d t h a t r e g a r d i n g t h e dependence on f i e l d s t r e n g t h h i s c a l c u l a t i o n s 3+ 3+ a l s o a p p l y t o Fe ( i n i r o n alum) as w e l l as Cr ( i n chrome a l u m ) .
5.3 C o n c l u s i o n
The o b s e r v a t i o n o f tv/o decay r a t e s i n t h e r e c o v e r y c u r v e s may
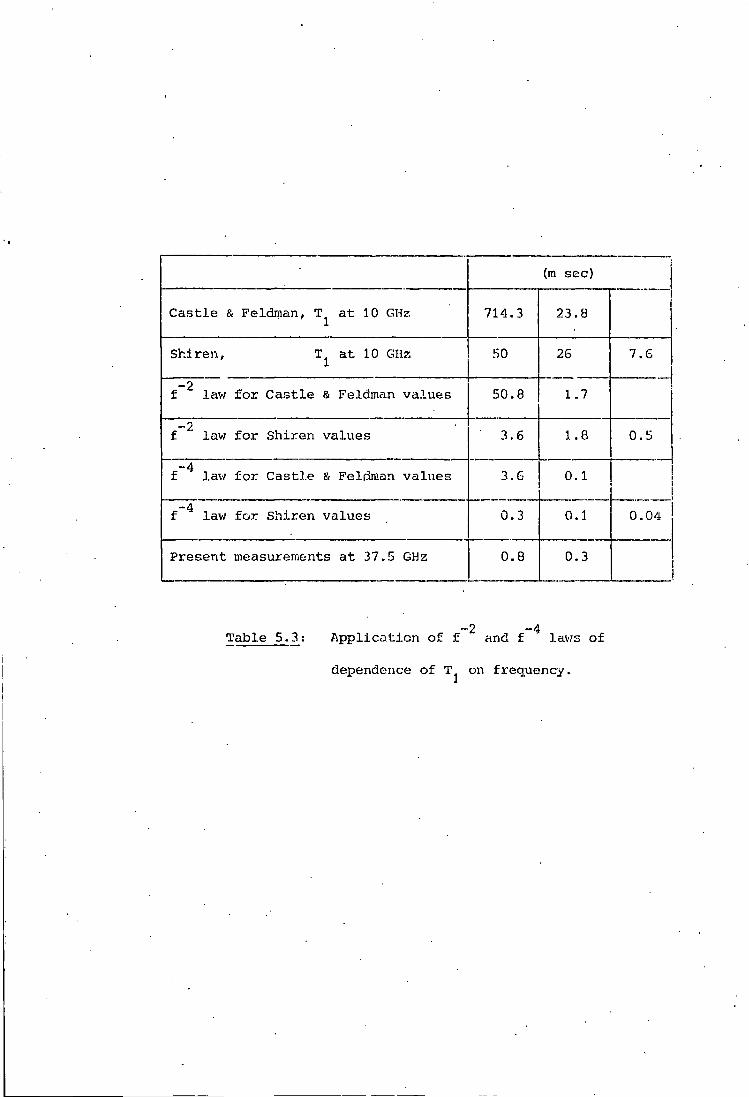
(m sec)
C a s t l e & Feldman, T a t 10 GHz 714.3 23.8
S h i r e n , T a t 10 GHz 50 26 7.6
-2 f lav; f o r C a s t l e & Feldman v a l u e s 50.8 1.7
f Z law f o r S h i r e n v a l u e s 3.6 1.8 0.5
-4 f law f o r C a s t l e & Feldman v a l u e s 3.G 0.1
-4 f lav/ f o r Shxren v a l u e s 0.3 0.1 0.04
P r e s e n t measurements a t 37.5 GHz 0.8 0.3
Ta b l e 5.3: A p p l i c a t i o n of f and f laws of
dependence of T on frequency.
- 67 -
i n d i c a t e t h a t t h e r e i s a c o n t r i b u t i o n f r o m t h e o t h e r energy l e v e l s o f
t h e F e ^ + system. However, t h i s c o u l d n o t be due t o a f a s t r e l a x i n g
c e n t r e , as i n t h e case o f exchange i n t e r a c t i o n , because t h e two measured 3+
r a t e s a r e comparable i n m a g n i t u d e . We may c o n c l u d e t h a t Fe i o n s i n
MgC c r y s t a l s behave as e x p e c t e d f r o m t h e t h e o r y f o r an S - s t a t e i o n
r e g a r d i n g t h e T ^ - t e m p e r a t u r e dependence, s i n c e i t has shown an a p p r o x i --5
mate T dependence. W i t h t h e i r o n c o n c e n t r a t i o n s a v a i l a b l e we have
seen t h a t T v a r i e s a p p r o x i m a t e l y as t h e i n v e r s e o f t h e c o n c e n t r a t i o n - ,
a b e h a v i o u r w h i c h was r e p o r t e d p r e v i o u s l y f o r s e v e r a l materia!! s. The
a n g u l a r v a r i a t i o n o f T" r e v e a l e d some f e a t u r e s o f c r o s s - r e l a x a t i o n o f
c e r t a i n t r a n s i t i o n s w i t h t h e main t r a n s i t i o n under e x p e r i m e n t . T h i s
m a n i f e s t e d i t s e l f i n t h e d e c r e a s e o f a t s p e c i f i c a n g l e s . F i n a l l y . -
c o m p a r i s o n o f o u r measurements o f T^ a t 37.5 GHz w i t h p u b l i s h e d r e s u l t s
a t 10 GHz r e v e a l e d t h a t t h e dependence o f T on f r e q u e n c y obeys, a -4
T^ a ( f r e q u e n c y ) b e h a v i o u r w h i c h i s e x p e c t e d f o r Kramers' i o n s
a c c o r d i n g t o t h e p r e s e n t t h e o r i e s .
- 68 -
CHAPTER 6
CAVITY GROWTH I N NEUTRON IRRADIATED MAGNESIUM OXIDE.
W i t h t h e knowledge a c q u i r e d a b o u t t h e ESR b e h a v i o u r o f F e ^ + i n
MgO s i n g l e c r y s t a l s we were a b l e t o c o n t r i b u t e t o t h e s t u d y o f c a v i t y
g r o w t h i n n e u t r o n i r r a d i a t e d magnesium o x i d e . T h i s was a c h i e v e d by t h e
i n v e s t i g a t i o n o f t h e ESR s p e c t r a a f t e r a n n e a l i n g t h e samples i n t h e
t e m p e r a t u r e range f r o m 1475 t o 1775°C and a subsequent s t u d y f o l l o w e d
( i n c o l l a b o r a t i o n w i t h G J R u s s e l l ) u s i n g t r a n s m i s s i o n e l e c t r o n m i c r o s
copy (TEM). S i n c e we w i l l be d e a l i n g w i t h a r a t h e r new t o p i c , we t h i n k
i t may be r e a s o n a b l e t o b e g i n w i t h some i n t r o d u c t i o n t o t h e n u c l e a t i o n
and g r o w t h o f c a v i t i e s .
6.1 I n t r o d u c t i o n
The g r o w t h o f c u b o i d a l c a v i t i e s i s a f e a t u r e o f i r r a d i a t i o n damage
o c c u r r i n g i n i o n i c s i n g l e c r y s t a l s . To n u c l e a t e t h e s e d e f e c t s and t o
s u s t a i n t h e i r g r o w t h i t i s n e c e s s a r y t o c r e a t e a s u f f i c i e n t numb?.r o f
v a c a n c i e s w i t h a m o b i l i t y h i g h enough t o a l l o w a g g l o m e r a t i o n . F o r t h i s t o
o c c u r i n magnesium o x i d e , Morgan and Bowen, 1967 (1) have shown t h a t i t i s 20
n e c e s s a r y t o i r r a d i a t e t o a dose e x c e e d i n g 10 n v t ( i n t h i s n o t a t i o n n
i s t h e number o f n e u t r o n s p e r u n i t volume, v t h e v e l o c i t y o f n e u t r o n s and
t i s t h e t i m e o f exposure) and s u b s e q u e n t l y t o a n n e a l i n a r g o n a t a tem
p e r a t u r e g r e a t e r t h a n 1500°C f o r one h o u r . I n a d d i t i o n t o t h e p r o d u c t i o n
o f v a c a n c i e s , e xposure t o such i r r a d i a t i o n r e s u l t s i n t h e t r a n s m u t a t i o n
o f magnesium and oxygen n u c l e i t h e r e b y p r o d u c i n g m a i n l y i n e r t gas atoms
o f neon and h e l i u m , as d i s c u s s e d by W i l k s , 1966 ( 2 ) . Morgan and Bowen
de m o n s t r a t e d t h a t t h e c a v i t i e s i n ann e a l e d m a t e r i a l c o n t a i n e d t h e s e gases
a t low p r e s s u r e .
69 -
I n t h e case o f t h e a l k a l i h a l i d e s i t has been shovm t h a t i m p u r i t y
atoms o f t e n p l a y an i m p o r t a n t r o l e i n r a d i a t i o n damage p r o c e s s e s . The
MgO s t u d i e d by Morgan and Bowen was known .to c o n t a i n a r e l a t i v e l y l a r g e
i m p u r i t y c o n c e n t r a t i o n o f about 500 ppm w h i c h was c h i e f l y Fe, A l , Ca and
S i . Thus i t i s e x p e c t e d t h a t a t l e a s t some o f t h e s e i m p u r i t i e s may be
i n v o l v e d i n t h e c a v i t y g r o w t h p r o c e s s . However, t o d a t e , no e v i d e n c e f o r
t h e c o r r e l a t i o n between i m p u r i t y c o n t e n t and c a v i t y g r o w t h has been r e p o r t e d
and t h e aim o f t h i s s t u d y was t o i n v e s t i g a t e i f any such r e l a t i o n s h i p
e x i s t e d . T r a n s m i s s i o n e l e c t r o n m i c r o s c o p y on i t s own was i n a d e q u a t e t o
i d e n t i f y i m p u r i t i e s so a complementary t e c h n i q u e was n e c e s s a r y . Such a
t e c h n i q u e i s t h a t o f E l e c t r o n s p i n resonance w h i c h i s n o t o n l y c a p a b l e o f
d e t e c t i n g v e r y , low l e v e l s o f c e r t a i n i m p u r i t i e s , b u t i s a l s o u s e f u l f o r
m o n i t o r i n g changes i n l o c a l e n v i r o n m e n t s . ESR has a l r e a d y been used
e x t e n s i v e l y i n t h e s t u d y o f n e u t r o n i r r a d i a t i o n damage i n MgO and o f t h e
e f f e c t o f a n n e a l i n g a t t e m p e r a t u r e s below t h a t n e c e s s a r y t o n u c l e a t e d
c a v i t i e s , as i n d i c a t e d by Henderson e t a l , 1971 ( 3 ) . Thus i t was i n t e n d e d
i n t h i s work t o e x t e n d t h e use o f t h i s t e c h n i q u e t o t h e s t u d y o f samples
c o n t a i n i n g c a v i t i e s and t o c o r r e l a t e t h e r e s u l t s w i t h TF.M o f t h e same
samples.
6.2 E x p e r i m e n t a l
The s i n g l e c r y s t a l s o f MgO used f o r t h i s s t u d y were o b t a i n e d f r o m
Semi-Elements I n c . , Saxonburgh, Pa. C l e a v e d specimens h a v i n g d i m e n s i o n s 3
o f a b o u t 10 x 4 x 0.5 mm were g i v e n a h e a t t r e a t m e n t f o r 18 h o u r s a t
1300°C i n an a m b i e n t o f hydrogen b e f o r e b e i n g i r r a d i a t e d t o a d o s e . o f 20
3.66 x 10 n v t i n t h e H a r w e l l D i d o r e a c t o r . The i r r a d i a t i o n t e m p e r a t u r e o
was a b o u t 150 C. P o s t - i r r a d i a t i o n a n n e a l i n g t r e a t m e n t s , each o f one hour
d u r a t i o n , were c a r r i e d o u t o v e r a range o f t e m p e r a t u r e s a t 50°C i n t e r v a l s
- 70 -
between 1475 and 1775 C i n an atmosphere o f a r g o n . The h e a t i n g up and
c o o l i n g p e r i o d s were s h o r t compared w i t h one hour a n n e a l i n g t i m e ; t o
a c h i e v e t h e l a t t e r . - t h e samples were a i r - c o o l e d .
ESR s p e c t r a i n t h e r e g i o n o f m a g n e t i c f i e l d c o r r e s p o n d i n g t o t h e
g - v a l u e o f t h e f r e e e l e c t r o n were o b t a i n e d f o r each o f t h e a n n e a l e d samples.
A l l measurements were made a t Q-band (35 GHz) and l i q u i d n i t r o g e n tem
p e r a t u r e (77 K ) . The m a g n e t i c f i e l d d i r e c t i o n was i n a { 1 0 0 } p l a n e o f
each specimen. C a l i b r a t i o n o f t h i s m a g n e t i c f i e l d was made u s i n g a t r a c e
o f D.P.P.H., t h e g - v a l u e o f w h i c h was t a k e n t o be 2.0C37, s u p p l e m e n t i n g
t h e e l e c t r o m a g n e t c a l i b r a t i o n o b t a i n e d e m p l o y i n g t h e p r o t o n / l i t h i u m
resonance t e c h n i q u e .
A f t e r e x a m i n a t i o n by ESR t h e samples v/ere c l e a v e d and t h e f l a k e s •
so p r o d u c e d v/ere f u r t h e r r e d u c e d i n t h i c k n e s s by c h e m i c a l p o l i s h i n g u s i n g
p h o s p h o r i c a c i d a t a b o u t 150°C (see f o r i n s t a n c e Washburn e t a l ( 4 ) ) : The
t h i n n e d samples v/ere examined i n a JEM 120 e l e c t r o n m i c r o s c o p e by
G J R u s s e l l (5) who p r o d u c e d a number o f m i c r o g r a p h s r e c o r d e d f r o m d i f
f e r e n t a r e a s f o r each a n n e a l e d specimen t o d e t e r m i n e t h e s i z e d i s t r i b u t i o n
o f t h e c a v i t i e s . The sample o r i e n t a t i o n was c l o s e t o a <100> d i r e c t i o n i n
a l l cases.
6.3 R e s u l t s
6.3.1 T r a n s m i s s i o n E l e c t r o n M i c r o s c o p y
E x a m i n a t i o n by TEM showed t h a t t h e sample a n n e a l e d a t 1475°C con
t a i n e d i n t e r s t i t i a l d i s l o c a t i o n l o o p s and t a n g l e s as seen i n F i g u r e 6.1.
T h i s damage i s s i m i l a r t o t h a t d e s c r i b e d and d i s c u s s e d by Groves and
K e l l y , 1963 (6) and by Bov/en and C l a r k e , 1964 ( 7 ) . I n a l l t h e samples o
an n e a l e d above 1500 C c u b o i d a l c a v i t i e s as seen i n F i g u r e s 6.2a and 6.2b
were p r e s e n t . These f i g u r e s , w h i c h v/ere r e c o r d e d f r o m t h e sample annealed
- 71 -
a t 1675 C, shew t h a t t h e c a v i t i e s range i n s i z e f r o m a b o u t 50 t o 300 A
and a r e bounded by { l 0 0 ) f a c e s . The d i s l o c a t i o n s w h i c h were s t i l l p r e s e n t
i n t h o s e samples a n n e a l e d a t t e m p e r a t u r e s g r e a t e r t h a n 1500°C were o f t e n
a s s o c i a t e d w i t h c a v i t i e s . T h i s o b s e r v a t i o n i s i n agreement w i t h t h a t o f
Morgan and Bowen ( 1 ) , b u t we w o u l d f u r t h e r p o i n t o u t t h a t d i s l o c a t i o n s
f r e q u e n t l y appeared t o be p i n n e d by the c a v i t i e s as a t A i n F i g u r e 6.2a.
T h i s p i n n i n g was such t h a t t h e o r i e n t a t i o n o f t h e d i s l o c a t i o n s c l o s e t o
t h e c a v i t i e s was near t o a <110> d i r e c t i o n , as a t A i n F i g u r e 6.2b.
The h i s t o g r a m s i n F i g u r e 6.3 show t h e s i z e d i s t r i b u t i o n o f t h e
c a v i t i e s as a f u n c t i o n o f a n n e a l i n g t e m p e r a t u r e . They were d e r i v e d f r o m
a t l e a s t t e n m i c r o g r a p h s t a k e n f r o m d i f f e r e n t a r e a s f o r each a n n e a l e d '
sample. The main o b s e r v a t i o n t o be made f r o m t h e s e s i z e d i s t r i b u t i o n s i s
t h a t t h e mean c a v i t y s i z e i n c r e a s e s d r a m a t i c a l l y on a n n e a l i n g a t a tem
p e r a t u r e e x c e e d i n g some v a l u e between 1575 and 1625°C. A n n e a l i n g a t
h i g h e r t e m p e r a t u r e s t h a n t h i s does n o t appear t o p r o d u c e any f u r t h e r
i n c r e a s e i n c a v i t y s i z e o r s i g n i f i c a n t change i n t h e s i z e d i s t r i b u t i o n .
The t o t a l c a v i t y volume p e r u n i t c r y s t a l volume and t h e c o n c e n t r a
t i o n o f c a v i t i e s f o r each annealed sample have a l s o been e s t i m a t e d and a r e
g i v e n i n T a b l e 6.1. F o r t h e p u r p o s e o f t h e s e c a l c u l a t i o n s a mean specimen
t h i c k n e s s f o r t h e t o t a l a r e a f r o m w h i c h t h e s i z e d i s t r i b u t i o n s were
o b t a i n e d was t a k e n t o be 1000 A*, a t y p i c a l sample t h i c k n e s s f o r t r a n s
m i s s i o n m i c r o s c o p y . A c c e p t i n g t h e crudeness o f t h i s a p p r o x i m a t i o n , T a b l e
6.1 shows t h a t t h e l a r g e i n c r e a s e i n c a v i t y s i z e w h i c h o c c u r s a t 1625°C
(see F i g u r e 6.3) i s accompanied by a l a r g e i n c r e a s e i n t h e r a t i o o f t h e
t o t a l c a v i t y volume t o c r y s t a l volume. The c a v i t y c o n c e n t r a t i o n r e m a i n s
more o r l e s s unchanged.
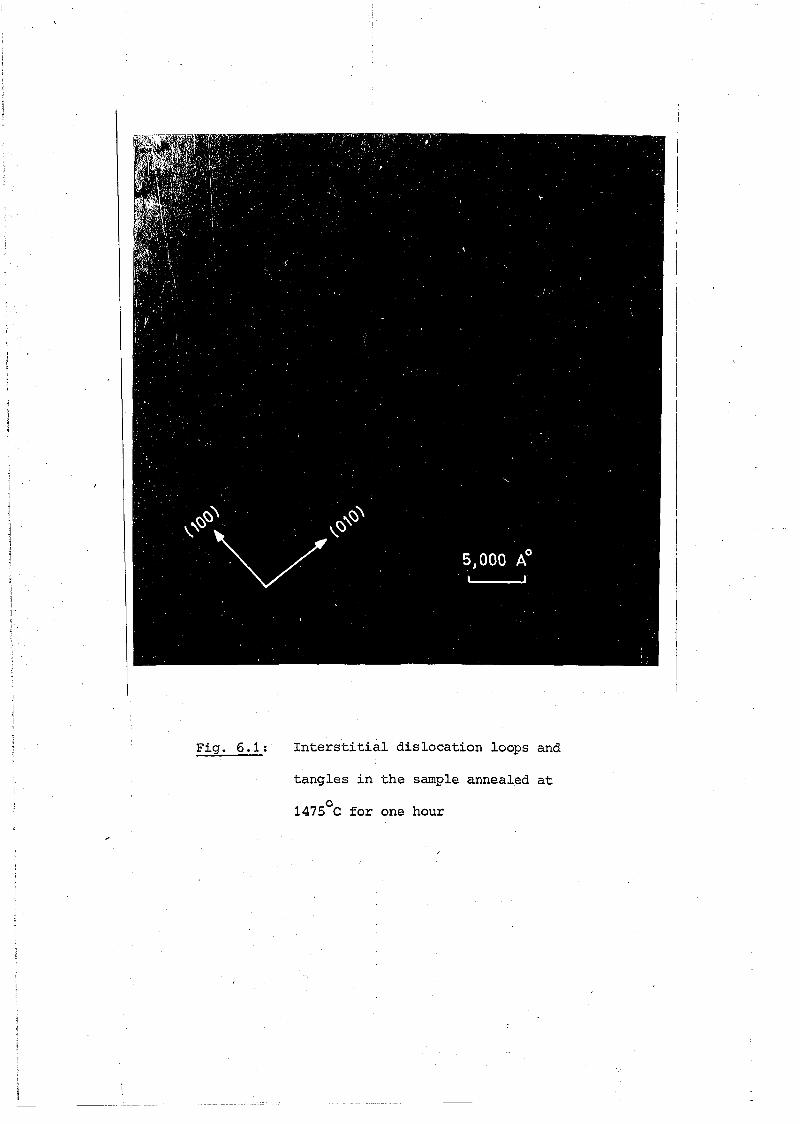
F i g . 6.1: I n t e r s t i t i a l d i s l o c a t i o n l o o p s and
t a n g l e s i n t h e sample annealed a t o
1475 C f o r one hour

(a)
F i g . 6.2: The p i n n i n g o f d i s l o c a t i o n s a t c a v i t i e s i n
t h e sample a n n e a l e d a t 1675°C.
I n (a) b o t h s e c t i o n s o f t h e d i s l o c a t i o n a t
"A" a r e a p p r o x i m a t e l y i n the p l a n e o f t h e f o i l .

(b)
F i g . 6.2: The p i n n i n g o f d i s l o c a t i o n s a t c a v i t i e s i n
t h e sample annealed a t 1675°C.
I n (b) one s e c t i o n o f t h e d i s l o c a t i o n a t
'A' i s a l m o s t p e r p e n d i c u l a r t o t h e p l a n e
o f t h e f o i l .
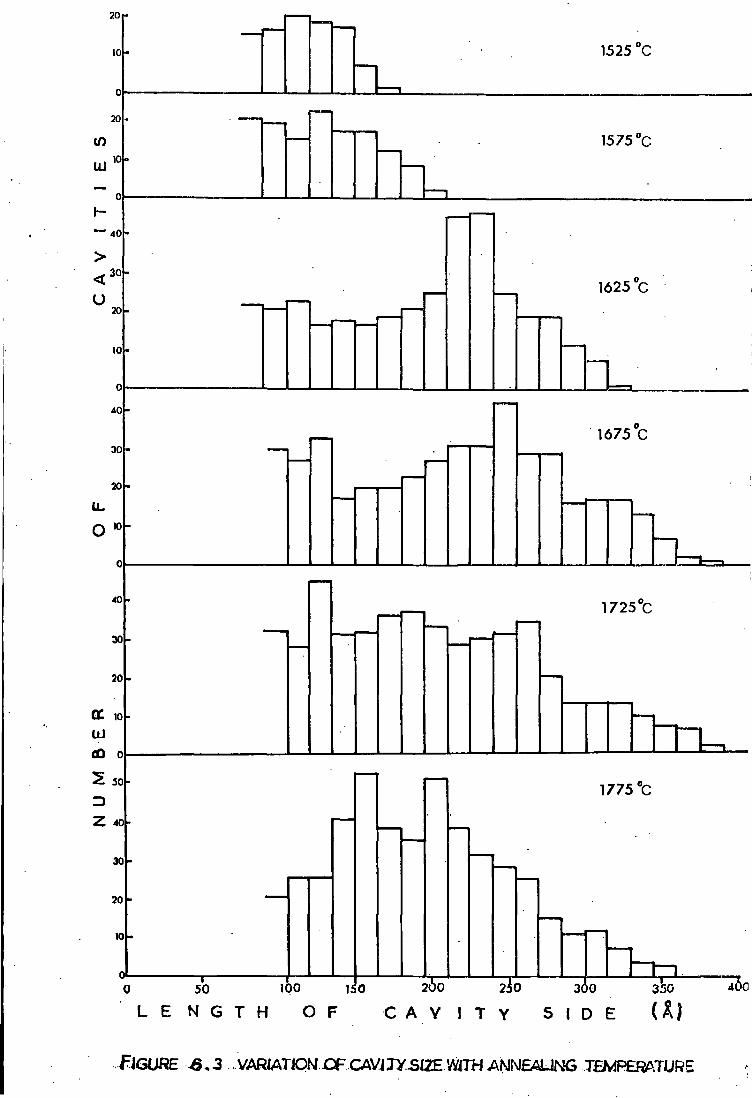
20r-
10
o
20
10
< u
40
30
20
10
0
40
30
20
o 1 0
40
30
20
DC io
ID
CO 0
2 50
3
Z 40
30
20
10
1525 C
1575 °C
1625 C
t L
1675 C
1725 t
1775 °C
0 50 100 150
L E N G T H O F 2O0 250 300
C A V I T Y S I D E
T 350
FJGURE G.3 VARIATION CF CAVm^IZE MTHAMEAUNG TEMPERATURE
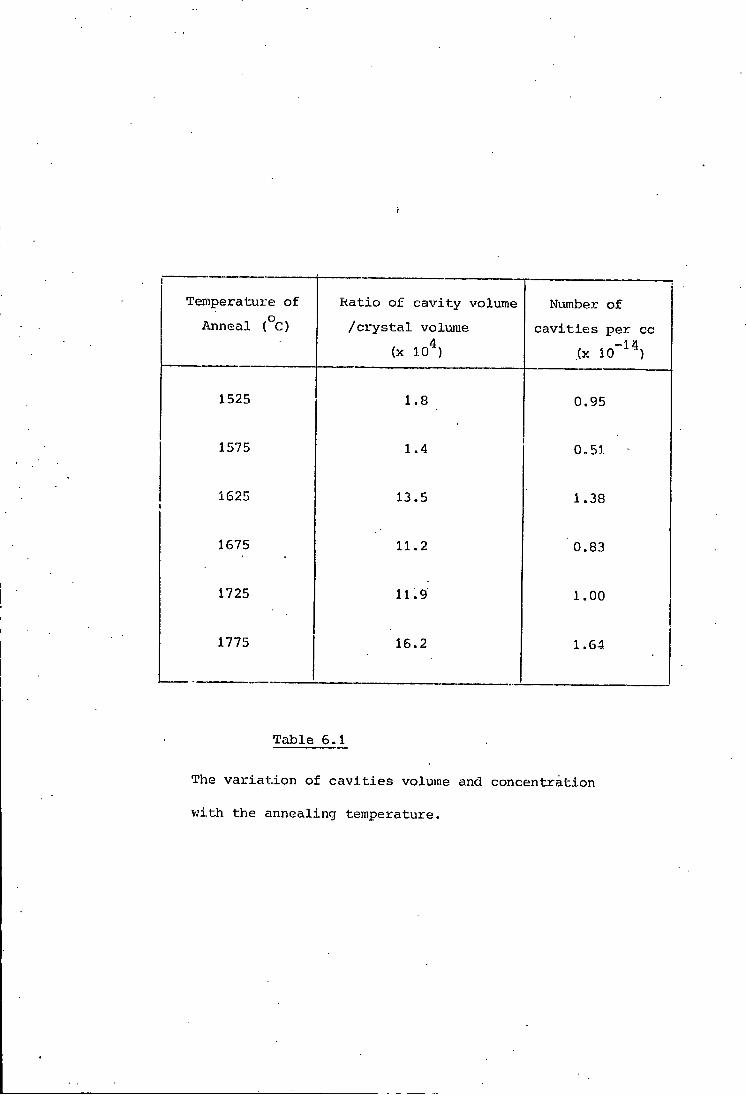
Temperature o f A n n e a l (°C)
K a t i o o f c a v i t y volume / c r y s t a l volume
4 (x 10 )
Number o f c a v i t i e s p e r cc
-14 (x 10 *)
1525 1.8 0.95
1575 1.4 0.51
1625 13.5 1.38
1675 11.2 0.83
1725 11.9' 1.00
1775 16.2 1.64
T a b l e 6.1
The v a r i a t i o n o f c a v i t i e s volume and c o n c e n t r a t i o n
w i t h t h e a n n e a l i n g t e m p e r a t u r e .
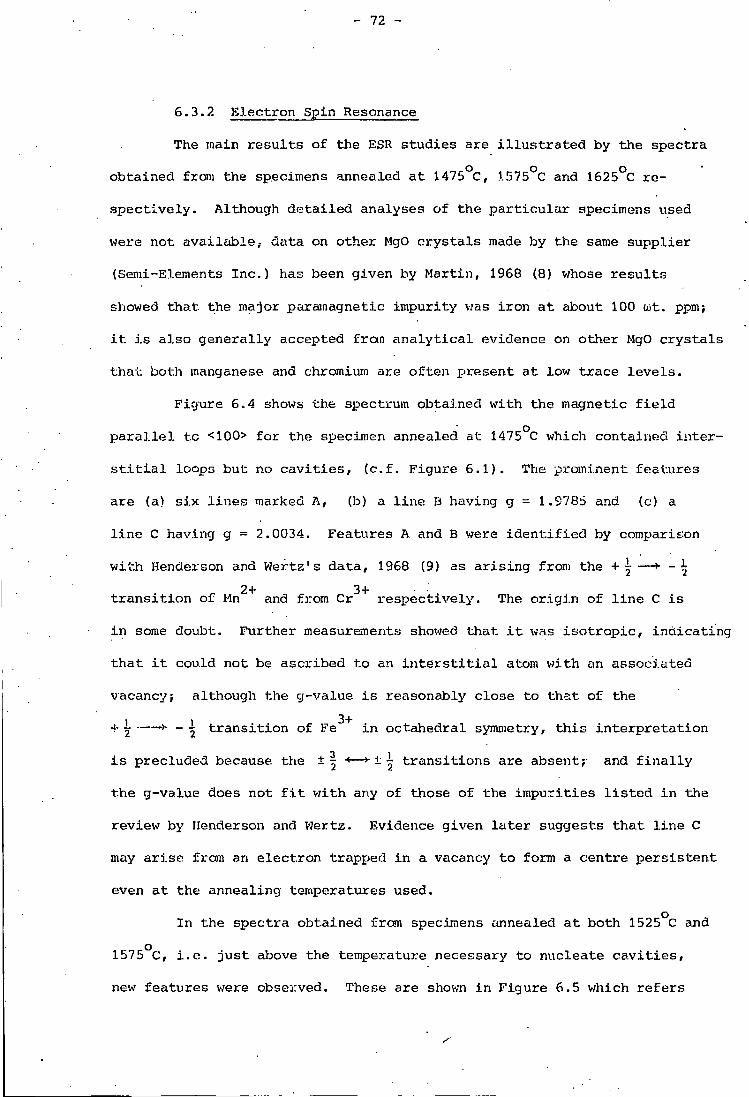
- 72 -
6.3.2 E3.ectron S p i n Resonance
The main r e s u l t s o f t h e ESR s t u d i e s a r e i l l u s t r a t e d by t h e s p e c t r a
o b t a i n e d f r o m t h e specimens a n n e a l e d a t 1475°C, J.575°C and 1625°C r e
s p e c t i v e l y . A l t h o u g h d e t a i l e d a n a l y s e s o f t h e p a r t i c u l a r specimens used
were n o t a v a i l a b l e , d a t a on o t h e r MgO c r y s t a l s made by t h e same s u p p l i e r
(Semi-Elements I n c . ) has been g i v e n by M a r t i n , 1968 (8) whose r e s u l t s
showed t h a t t h e m a j o r p a r a m a g n e t i c i m p u r i t y was i r o n a t a b o u t 100 u t . ppm;
i t i s a l s o g e n e r a l l y a c c e p t e d f r o m a n a l y t i c a l e v i d e n c e on o t h e r MgO c r y s t a l s
t h a t b o t h manganese and chromium a r e o f t e n p r e s e n t a t low t r a c e l e v e l s .
F i g u r e 6.4 shows t h e s p e c t r u m o b t a i n e d w i t h t h e m a g n e t i c f i e l d
p a r a l l e l t c <100> f o r t h e specimen a n n e a l e d a t 1475°C w h i c h c o n t a i n e d i n t e r
s t i t i a l l o o p s b u t no c a v i t i e s , ( c . f . F i g u r e 6.1). The p r o m i n e n t f e a t u r e s
a r e (a) s i x l i n e s marked A, (b) a l i n e B h a v i n g g = 1.9785 and (c) a
l i n e C h a v i n g g = 2.0034. F e a t u r e s A and B were i d e n t i f i e d by comparison
w i t h Henderson and Wertz's d a t a , 1968 (9) as a r i s i n g f r o m t h e + — > 2+ 3+
t r a n s i t i o n o f Mn and f r o m Cr r e s p e c t i v e l y . The o r i g i n o f l i n e C i s
i n some d o u b t . F u r t h e r measurements showed t h a t i t was i s o t r o p i c , i n d i c a t i n g
t h a t i t c o u l d n o t be a s c r i b e d t o an i n t e r s t i t i a l atom w i t h an a s s o c i a t e d
vacancy; a l t h o u g h t h e g - v a l u e i s r e a s o n a b l y c l o s e t o t h a t o f t h e i i 3+ + • - ~ t r a n s i t i o n o f Fe i n o c t a h e d r a l symmetry, t h i s i n t e r p r e t a t i o n
i s p r e c l u d e d because t h e ± j •«—*• ± ^ t r a n s i t i o n s a r e a b s e n t ; and f i n a l l y
t h e g - v a l u e does n o t f i t w i t h any o f t h o s e o f t h e i m p u r i t i e s l i s t e d i n t h e
r e v i e w by Henderson and W ertz. Evidence g i v e n l a t e r s u g g e s t s t h a t l i n e C
may a r i s e f r o m an e l e c t r o n t r a p p e d i n a vacancy t o f o r m a c e n t r e p e r s i s t e n t
even a t t h e a n n e a l i n g t e m p e r a t u r e s used. o
I n t h e s p e c t r a o b t a i n e d f r o m specimens a n n e a l e d a t b o t h 1525 C and o
1575 C, i . e . j u s t above t h e t e m p e r a t u r e n e c e s s a r y t o n u c l e a t e c a v i t i e s ,
new f e a t u r e s were o b s e r v e d . These a r e shown i n F i g u r e 6.5 w h i c h r e f e r s

CD
II
to
OQ
0> r r in
in
in uJ Lf)
in
ID ii
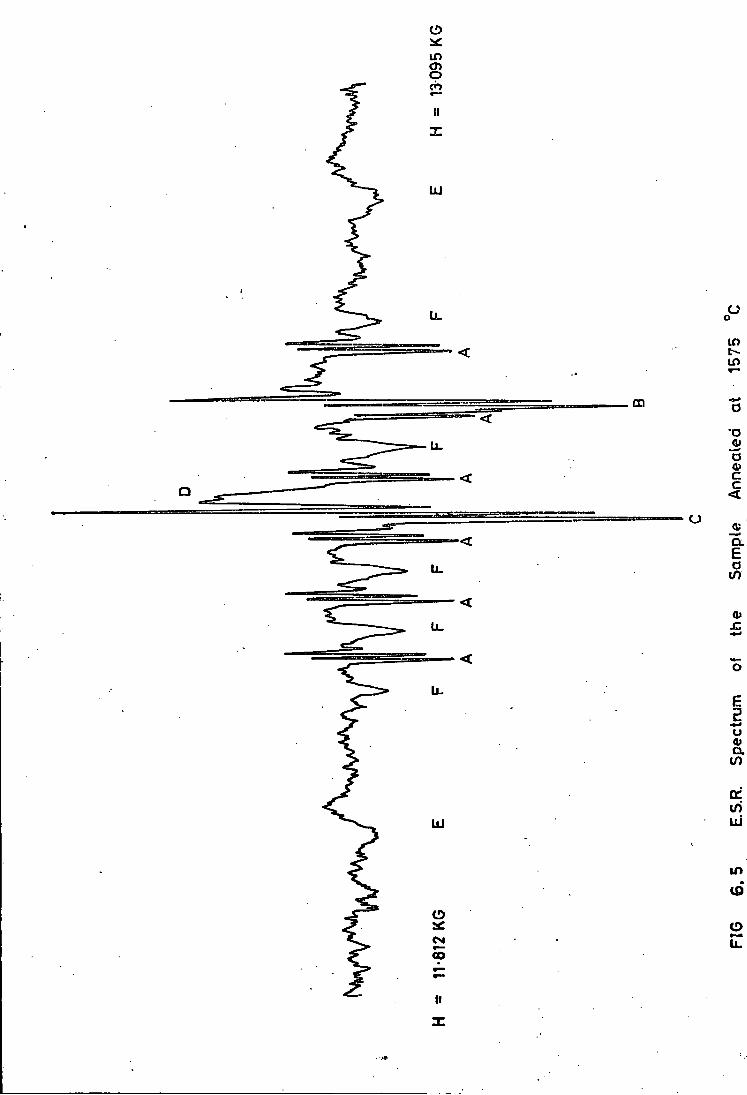
i n
CO
II
i n
m
to
0>
0)
10
10 LU
in (0
CD
CM 00

o CM
II X
CO a c c <
o
i n
II X
to a specimen annealed a t 1575°C. The most important change i s the
o c c u r r e n c e of the new l i n e s marked D and E; the g-value of 2.0031 f o r
the D t r a n s i t i o n , together w i t h the observed a n i s o t r o p y of E l i n e s , 3+
f i t w e l l w i t h r e p o r t e d data on Fe (9,10) and enable them to be
i d e n t i f i e d as the - *- -jj and ± | ± J- t r a n s i t i o n s r e s p e c t i v e l y of „ 3+ . , ^ , , ^ . „ 3+ .
F e i n o c t a h e d r a l symmetry, i . e . Fe i o n s occupying magnesium s i t e s .
The other d i f f e r e n c e s appear t o be a s s o c i a t e d w i t h l o c a l i s e d d e t a i l e d
changes i n the manganese environment; they i n c l u d e a d d i t i o n a l t r a n s i t i o n s
c l o s e to each of the s i x A l i n e s and a l s o t r a n s i t i o n s F s i t u a t e d midway
between the A l i n e s . The t r a n s i t i o n s F are of low i n t e n s i t y and have
the same s e p a r a t i o n as the A l i n e s .
The s p e c t r a of specimens annealed above 1575°C (e.g. F i g u r e 6.6)
d i f f e r from those j u s t d e s c r i b e d i n two major r e s p e c t s . I n the f i r s t
p l a c e t h e r e i s no i n d i c a t i o n of the D and E l i n e s corresponding t o Fe^'
i n o c t a h e d r a l symmetry; secondly, the a d d i t i o n a l l i n e s i n F i g u r e 6.5 2+
which were a t t r i b u t e d to Mn are much l e s s pronounced. Comparison c f 2+
a l l the s p e c t r a shows t h a t the i n t e n s i t y r a t i o of the Mn h y p e r f i n e and 3+
C r l i n e s remained approximately c o n s t a n t throughout a l l the annealing 2+
treatments and consequently the h y p e r f i n e components of Mn c o u l d be
used as an i n t e n s i t y r e f e r e n c e , c . f . ( 1 1 ) . On t h i s b a s i s i t appears
t h a t i n F i g u r e 6.6 the i n t e n s i t y of l i n e C has i n c r e a s e d by approximately
two times, i n d i c a t i n g t h a t a n n e a l i n g a t 1625°C produces a two-fold
i n c r e a s e i n the number of c e n t r e s r e s p o n s i b l e f o r l i n e C.
6-4 D i s c u s s i o n
An important c o n c l u s i o n of Morgan and Bowen (1) from t h e i r s t u d i e s
of neutron i r r a d i a t e d and annealed MgO was t h a t to n u c l e a t e c a v i t i e s
i t was n e c e s s a r y to anneal samples i r r a d i a t e d t o a dose i n e x c e s s of
- 74 -
10 n v t a t a temperature g r e a t e r than 1500 C i n an ambient of argon.
T h i s minimum c r i t i c a l temperature was a t t r i b u t e d t o the a c t i v a t i o n
energy a s s o c i a t e d w i t h vacancy m o b i l i t y . I n a d d i t i o n , the r e s u l t s of
the a n n e aling s t u d i e s d e s c r i b e d here concerning the n u c l e a t i o n and growth
of c a v i t i e s would suggest t h a t another c r i t i c a l temperature f o r the growth
e x i s t s i n the temperature range of 1575 to 1625°C. While a n n e a l i n g above
some temperatures w i t h i n t h i s range does not produce any s i g n i f i c a n t change
i n the c o n c e n t r a t i o n of c a v i t i e s , the r a t i o of t o t a l c a v i t y volume to
u n i t volume of c r y s t a l i n c r e a s e s by an order of magnitude. T h i s must
s i m i l a r l y be accounted f o r by the movement of v a c a n c i e s and consequently
R u s s e l l e t a l (12) proposed t h a t , f o l l o w i n g the n u c l e a t i o n of c a v i t i e s ,
some mechanism e x i s t s which impedes f u r t h e r growth of these d e f e c t s u n t i l
another c r i t i c a l temperature ( f o r an hour a n n e a l i n g p e r i o d ) i s exceeded.
An i n d i c a t i o n of the nature of t h i s mechanism can be i n f e r r e d from the
r e s u l t s of.our ESR measurements as w i l l be d i s c u s s e d l a t e r .
One f e a t u r e of c a v i t i e s which was noted by Morgan and Bowen (1)
was t h a t they were o f t e n l o c a t e d a t cusps i n d i s l o c a t i o n l i n e s . I n the
p r e s e n t a n nealing s t u d i e s we have found t h a t t h e s e cusps correspond to
two s e c t i o n s of d i s l o c a t i o n each pinned to a cor n e r of a c a v i t y and l y i n g
c l o s e to a <110> d i r e c t i o n i n the immediate p r o x i m i t y o f the c a v i t y as
i n F i g u r e s 6.2a and 6.2b. The a s s o c i a t i o n of c a v i t i e s w i t h d i s l o c a t i o n s
i s i n t e r p r e t e d as f o l l o w s . When an i n t e r s t i t i a l loop, which i s s t i l l
p r e s e n t i n a sample a t an an n e a l i n g temperature g r e a t e r than 1500°C,
moves through the c r y s t a l i t i s probable t h a t the i n t e r a c t i o n w i t h .the
c a v i t i e s p r e s e n t w i l l r e s u l t i n p a r t i a l a n n i h i l a t i o n of the loop by
v a c a n c i e s from the c a v i t i e s . The movement of the p a r t s o f the loop near
c a v i t i e s w i l l consequently be impeded. I t i s f u r t h e r suggested t h a t
the observed <110> o r i e n t a t i o n of d i s l o c a t i o n s i n the r e g i o n of c a v i t i e s
- 75 -
i s r e l a t e d to a f a v o u r a b l e c o n f i g u r a t i o n f o r the above a n n i h i l a t i o n
p r o c e s s to occur. T h i s i s a t t r i b u t e d to the f a c t t h a t i n the NaCl
s t r u c t u r e (which a l s o a p p l i e s to Mg'O), the u n i n t e r r u p t e d rows of anions
and of c a t i o n s i n <110> d i r e c t i o n s make d i f f u s i o n of v a c a n c i e s of e i t h e r
type more l i k e l y i n t h e s e d i r e c t i o n s than i n o t h e r s .
The ESR r e s u l t s show t h a t the n u c l e a t i o n of c a v i t i e s , i n the o o
samples annealed a t 1525 C and 1575 C, i s accompanied by the appearance 3+
of Fe i n o c t a h e d r a l symmetry. As mentioned e a r l i e r , a n a l y s i s of
• m a t e r i a l made by the same s u p p l i e r has shown t h a t i r o n was p r e s e n t i n
the specimens ( 8 ) . Due to the p r e - i r r u d i a t i o n heat treatment i n hydrogen
i t i s most l i k e l y t h a t any i r o n p r e s e n t w i l l be i n the d i v a l e n t s t a t e ,
c . f . ( 1 3 ) ; t h i s view i s supported by the absence of Fe"*1 l i n e s i n o
specimens annealed a t temperatures below 1500 C ( F i g u r e 6.4) . As the p o s t - i r r a d i a t i o n a n n ealing took p l a c e i n an i n e r t atmosphere
2+ 3+ the c a t i o n v a c a n c i e s n e c e s s a r y f o r the c o n v e r s i o n of Fe i n t o Fe on
o r>
i n c r e a s i n g the annealing temperature from. 1475 C to 1525 C must have come
from w i t h i n the c r y s t a l . An adequate supply of v a c a n c i e s i s known t o be
produced when the vacancy c l u s t e r s , which a r e about 7 A i n diameter and
which are p r e s e n t i n s i m i l a r l y t r e a t e d specimens, suddenly c o l l a p s e on
annealing a t about 1500°C, Martin, 1966 ( 1 4 ) . The disappearance of the 3+ o F e l i n e s a t temperatures above 1625 C c o u l d be e x p l a i n e d e i t h e r by a
3+ 2+ r e d u c t i o n of Fe i n t o Fe by the outward d i f f u s i o n of c a t i o n v a c a n c i e s
3+ 3+ or by the trapping of v a c a n c i e s near the Fe s i t e s , c r e a t i n g an Fe
vacancy complex, as r e p o r t e d by Henderson e t a l , 1971 ( 1 5 ) , whose ESR
would probably f a l l i n the low magnetic f i e l d r e g i o n o u t s i d e the p r e s e n t
range of measurement. Since, the subsequent growth of the c a v i t i e s
i n d i c a t e s t h a t a l a r g e number of v a c a n c i e s a r e r e t a i n e d i n the c r y s t a l
the outward d i f f u s i o n e x p l a n a t i o n appears u n l i k e l y and the t r a p p i n g
- 76 -
mechanism more probable.
I n view of the E5R evidence we envisage the c a v i t y n u c l e a t i o n
and growth proceeding by two s t a g e s as f o l l o w s . On a n n e a l i n g j u s t above
1500°C a c r i t i c a l vacancy m o b i l i t y i s exceeded and s m a l l c a v i t i e s a r e
n u c l e a t e d i n the manner d e s c r i b e d by Morgan and Bowen ( 1 ) . Simultan
eously t h e r e i s a c o n v e r s i o n of i r o n to Fe i n o c t a h e d r a l symmetry a t
magnesium s i t e s ; t h i s c o n v e r s i o n u s e s v a c a n c i e s r e l e a s e d when c l u s t e r s
c o l l a p s e a t about 1500°C which then form charge compensating c e n t r e s f o r
the Fe"^H i o n s . A f t e r n u c l e a t i o n n e g l i g i b l e c a v i t y growth o c c u r s u n t i l
an annealing temperature of 1625°C (for. one hour) i s reached, see F i g u r e
6.3. T h i s behaviour i s a t t r i b u t e d to mobile v a c a n c i e s being trapped 3+
near the Fe s i t e s i n p r e f e r e n c e to condensation a t c a v i t i e s . A c a l c u
l a t i o n , based on the observed c a v i t y growth between the a n n e a l i n g tem-
o o p e r a t u r e s of 1575 C and 1625 C and an i r o n i m p u r i t y l e v e l o f 100 tot. ppm, shows t h a t - t h e number of v a c a n c i e s r e q u i r e d to a s s o c i a t e w i t h a l l the
3+
Fe i s some two o r d e r s of magnitude l e s s than the number r e q u i r e d to
account f o r the c a v i t y growth. When t h i s stage i s completed, c a v i t y
growth can proceed. I t i s suggested t h a t the presence of i r o n i s not
expected to a l t e r the magnitude of u l t i m a t e growth s i g n i f i c a n t l y . How
eve r , the e x t e n t to which growth i s impeded, and hence the a n n e a l i n g
temperature n e c e s s a r y f o r the l a s t growth s t a g e , would be expected to
i n c r e a s e w i t h i r o n c o n c e n t r a t i o n . F u r t h e r evidence which i n d i c a t e s t h a t
c a v i t y growth i s incomplete when annealing a t 1500°C i s p r o v i d e d by the
measurements of Bowen (16) , who recorded the d e n s i t y v a r i a t i o n w i t h
a n n e a l i n g temperature f o r s i m i l a r l y t r e a t e d MgO. H i s r e s u l t s suggest
t h a t c a v i t y formation i s a two stage p r o c e s s , as our s t u d i e s u s i n g
d i f f e r e n t techniques (TEM and ESR) have confirmed to be the c a s e . I n •
a d d i t i o n , the high p r e c i s i o n X-ray measurements of B r i g g s and Bowen,
- 77 -
1968 (17) showed t h a t complete r e c o v e r y of the l a t t i c e parameter to the
u n i r r a d i a t e d v a l u e d i d not occur u n t i l the annealing temperature reached
about 1750°C. However, i n t e r p o l a t i o n of t h e i r d a t a would suggest t h a t
most of the r e c o v e r y had occurred a t about 1650°C. So, a l l o w i n g f o r
the f a c t t h a t t h e i r m a t e r i a l was i r r a d i a t e d t o more than t w i c e the dose
of t h a t used i n t h i s study, i t i s concluded t h a t t h e r e i s a r e a s o n a b l e
c o r r e l a t i o n between the minimum temperature a t which we have found i t
n e c e s s a r y to anneal to produce most of the c a v i t y growth and t h a t reported
by T r i g g s and Bowen to o b t a i n almost complete r e c o v e r y of the l a t t i c e
parameter. To our knowledge t h i s i n f l u e n c e of an i m p u r i t y on the move
ment of v a c a n c i e s and c a v i t y growth has not p r e v i o u s l y been r e p o r t e d .
Here i t appears t h a t i r o n p l a y s a s i g n i f i c a n t r o l e . I t . i s p o s s i b l e t h a t
other i m p u r i t i e s may a c t i n a s i m i l a r way, but t h i s remains to be
e s t a b l i s h e d .

- 78 -
REFERENCES - CHAPTER 1
1. C F Hempstead and K D Bowers (1959) Phys. Rev. 118 131
2. H E D S c o v i l , G Feher and II S e i d e l (1957) Phys. Rev. L e t t .
105 762
3. L F Johnson, G D Boyd, K Nassau and R R Soden (1962)
Phys. Rev. 126 1406
4. J M F a r l e y (1973) Ph.D. T h e s i s U n i v e r s i t y of Durham
5. H P Bu-jkley (1973) Ph.D. T h e s i s U n i v e r s i t y of Durham-
6. G Brown, C J K i r k b y and J S Thorp (1974) J . Mat. S c i .
9 65
7. J S Thorp, G Brown and H P Buckley (1974) J . Mati S c i .
9 1337
C. J S Thorp, H P Buckley and G Brown (1974) J . Mat. S c i .
L e t t . 9 864
9. A V Komandin, R D Shapovalova and N P M i k h a i l o v a (1960)
R u s s i a n J . Phys. Chera. 34 979
10. W S Brower and P H Fang (1969) J . Appl. Phys. 40 4988
11. R A Vasquez (1975) M.Sc. T h e s i s U n i v e r s i t y of Durham
12. J S Thorp, R A Vasquez, C Adcock and W Button (1976)
J . Mat. S c i . 11 89
13. G J R u s s e l l , E A E Ammar and J S Thorp (1976) (to be
p u b l i s h e d )
14. I Waller (1932) Z. Phys. 79 370
15. N B.loembergen, S Shapiro, P S P c r s h a n and J O Artman (1959)
Phys. Rev. 114 445
16. W J C Grant (1964) Phys. Rev. 134 A1554
17. K J S t a n d l e y and R A Vaughan (1969) ' E l e c t r o n s p i n
r e l a x a t i o n phenomena i n s o l i d s ' Adam H i l g e r L t d . London
- 79 -
Chapter 1 (Continued)
10. P S Pershan (1960) Phys. Rev. 117 109 "
19. W B Mims and 0 D McGee (1960) Phys. Rev. 119 1233
20. U Kh Kopvillem (1961) Sov. Phys. S o l i d S t a t e 3 865
21. A II E s c h e n f e l d e r and R T Weidner (1953) Phys. Rev. 92 869
22. S Feng and N Bloembergen (1963) Phys. Rev. 130 531
.23. C F D a v i s , N W P Strandberg and R L Kyhl (1958) Phys.
Rev. I l l 1268
24. J G C a s t l e , P F C h e s t e r and P E Wagner (1960) Phys: Rev.
119 953
25. G Brown and J S Thorp (1967). B r i t . J . Appl. Phys. 18 1
26. J i-Ierve and J P e s c i a (1960) C. R. Acad. S c i . 251 665
27. W I Dobrov and M E Browne (1963) 'Paramagnetic Resonance'
(Academic P r e s s ) 2 447
28. C J G o r t e r (1947) 'Paramagnetic r e s o n a n c e 1 E l s e v i e r
Pub. Co.
29. A H Cooke (1950) Rep. Prog. Phys. 13 276
30. K D Bowers and W B Mims (1959) Phys. Rev. 115 285
31. J H Pace, D F Sampson and J S Thorp (1960) P r o c . Phys. Soc.
76 697
32. A E Siegman (1964) 'Microwave s o l i d - s t a t e masers 1 McGraw-Hill Co.
New York
33. C J K i r k b y (1967) Ph.D. T h e s i s U n i v e r s i t y of Durham
34. G Brown (1967) Ph.D. T h e s i s U n i v e r s i t y of Durham
35. C G Montgomery (1948) 'Technique of microwave measurements'
McGraw-Hill Hew York

- 80 -
REFERENCES - CHAPTER 2
1. A V Komandin, R D Shapovalova and N P Mi k h a i l o v a (1960)
R u s s i a n J . Phys. Chem. 34 979
2. W S Brower and P II Fang (1969) J . Appl. Phys. 40 4988
i b i d . (1967) 38 2391
3. A Z a l k i n and D H Templeton (1964) J . Chem. Phys. 40 501
4. J C z o c h r a l s k i (1918) Z. Phys. Chem. 92 219
5. Marconi I n s t r u m e n t s L t d . Handbook No. OM 1245 (1960)
6. A II S c o t t and H L C u r t i s (1939) J . Res. Nat. Dur. Stand. 22 747
7. G Brown, C J K i r k b y and J S Thorp (1974) J . Mat. S c i . 9 65
8. J S Thorp, H P Buckley and G Brown (1974) i b i d . 9 864
- 81 -
REFERENCES - CHAPTER 3
1 . R W G Wyckoff ' C r y s t a l S t r u c t u r e s ' ( I n t e r s c i e n c e New York 1948 )
2. C F Hempstead and K D Bowers ( 1 9 6 0 ) Phys. Rev. 118 131
3 . ' A A r b e l and R J Stokes ( 1 9 6 5 ) J . Appl. Phys. 36 1460
4 . A Z a l k i n and D H Templeton ( 1 9 6 4 ) J . Chem. Phys. 40 501
5 . H P Buckley ( 1 9 7 3 ) Ph.D. T h e s i s U n i v e r s i t y of Durham
6 . J M F a r l e y ( 1 9 7 3 ) Ph.D. T h e s i s U n i v e r s i t y of Durham
7 . J C z o c h r a l s k i ( 1 9 1 8 ) Z. Phys. Chera. . 92 2 1 9
8 . K Nassau and A M Broyer ( 1 9 6 2 ) J . Appl. Phys. 33 3064
9 . R W Kedzie and M K e s t i g i a n ( 1 9 6 3 ) Appl. Fhys. L e t t e r s 3 86
1 0 . B Bleaney and K W 1-1 Stevens ( 1 9 5 3 ) Rep. Prog. Phys. 16 108
1 1 . V M Vinokurov and V G Stepanov ( 1 9 6 7 ) Sov. Phys. S o l . S t a t e •
9 844
1 2 . N Ku r k i n and L Ya Shekun ( 1 9 6 5 ) Sov. Phys. S o l . S t a t e 6 1 5 6 0
1 3 . J H Van V l e c k and W G Penney ( 1 9 3 4 ) P h i l . Mag. 17 961
1 4 . A Abragam and M H L Pryce ( 1 9 5 1 ) Proc. Roy. Soc. A 2 0 5 135
1 5 . J S M Harvey and H K i e f t e ( 1 9 7 1 ) Canad. J . Phys. 49 9 9 5
1 6 . V F Dernov-Pegarev, M M Zaripov, M I Samoilovich and V G Stepanov
( 1 9 6 6 ) Sov. Phys. S o l . S t a t e 8 197
1 7 . J S Thorp, G Brown and H P Buckley ( 1 9 7 4 ) J . Mat. S c i . 9 1337
1 8 . M L Randolph ( 1 9 6 0 ) Rev. S c i . I n s t . 31 9 4 9
1 9 . R Yu A b d u l s a b i r o v , A A A n t i p i n , I N K u r k i n , E A Tsvetkov,
Yu K C h i r k i n and V I S h l e n k i n ( 1 9 7 2 ) Sov. Phys. S o l . S t a t e
14 255
2 0 . W B Mims and R G i l l e n ( 1 9 6 7 ) J . Chem. Phys. 47 3 5 1 8
- 82 -
Chapter 3 (Continued)
21. V V o l t e r r a , J B r o n s t e i n and M Rockni (1966) Appl. Phys. L e t t e r s
8 212
22. C G B G a r r e t t and F R M e r r i t t (1964) Appl. Phys. L e t t e r s 4 31
23. U Ranon a:.id V V o l t e r r a (1964) Phys. Rev. 134 A1483
24. P A F o r r e s t e r and C F Hempstead (1962) Phys. Rev. 126 923
25. J M F a r l e y , G A Saunders and D Y Chung (1975) J . Phys. C;
S o l . S t . Phys. 8 780
26. J S Thorp, II P Buckley and G Brown (1974) J . Mat. S c i . L e t t e r s
9 864

- 83 -
REFERENCES - CHAPTER 4
1. I W a l l e r (1932) Z. Phys. 79 370
2. C J G o r t e r (1936) P h y s i c a 3 503
3. R de L Kronig (1939) P h y s i c a 6 33
4. J H Van V l e c k (1939) J . Chem. Phys. 7 72
5. J H Van V l e c k (1940) Phys. Rev. 57 426; erratum i b i d (1940)
1052
6. D I I Paxman (1961) Proc. Phys. Soc. London 70 180
7. G M Zverev (1961) Sov. Phys. .TETP 13 1175
8. R Orbach (1961) Proc. Roy. Soc. 264A 458
9. C P B F i n n , R Orbach and W P Wolf (1961) Proc. Phys. Soc.
London 77 261
10. A A Manenkov; and A M Prokhorov (1962) Sov. Phys. JETP 15 S51
l i . . Chao-Yuan Huang (1965) Phys. Rev. 139 A241
12. R Orbach and M Blume (1962) Phys. Rev. L e t t e r s 8 478
13. M Blume and R Orbach (1962) Phys. Rev. 127 1587
14. A M Le u s h i n (1963) Sov. Phys. S o l . S t . 5 440
15. A Abraganv and B Bleaney (1970) ' E l e c t r o n paramagnetic resonance
of t r a n s i t i o n i o n s ' Clarendon P r e s s Oxford.
16. C P Poole and I I A Farach (1971) ' R e l a x a t i o n i n magnetic resonance'
Academic P r e s s Ne^ York
17. K J Standley and R A Vaughan (1969) ' E l e c t r o n s p i n r e l a x a t i o n
phenomena i n s o l i d s ' H i l g e r London
18. R Orbach (1961) Proc. Roy. Soc. 264A 485
19. M B Walker (1968) Can. J . Phys. 46 1347
20. J C G i l l (1975) Rep. Prog. Phys. 38 91
21. B I Kochelaev (1960) Sov. Phys. Doklady 5 349
- 84 -
Chapter 4 (Continued)
22. P G Klemens (1962) Phys. Rev. 125 1795
23. J"G C a s t l e J r . , D W Feldman, P G Klemens and R A Weeks (1963)
Phys. Rev. 130 577
24. E W M o n t r e l l and R B P o t t s (1955) Phys. Rev. 100 525
25. W M Rogers and R L Powell (1958) T a b l e s of T r a n s p o r t I n t e g r a l s ,
N a t i o n a l Bureau of Standards,. C i r c u l a r No.535 (U.S. Government
P r i n t i n g O f f i c e Washington D.C.)
26. R Mattuck and M W P Strandberg (1960) Phys. Rev. 119 1204
27. J S Thorp, H P Buckley and G Brown (1974) J . Mat. S c i . L e t t e r s
9 864
28. D H Par k i n s o n and J E Quarrington "(1954) B r i t . J . Appl. Phys.
5 219
29. D R Mason (1966) Ph.D. T h e s i s U n i v e r s i t y of Durham
30. R W B i e r i g , . M J Weber and. S I Warshaw (1964) Phys. Rev. 1.34
A15C4
31. J B Horak and A W N o l l e (1967)- Phys. Rev. 153 372
32. J M F a r l e y (1973) Ph.D. T h e s i s U n i v e r s i t y o f Durham
33. G H Dieke (1969) 'Spectra and energy l e v e l s of r a r e e a r t h i o n s
i n c r y s t a l s 1 Wiley New York
34. P I. S c o t t and C D J e f f e r i e s (1962) Phys. Rev. 127 32
35. D R Mason and J S Thorp (1967) Phys. Rev. 157 191
36. K Nassau (1963) J . Phys. Chem. S o l . 24 1511
37. J M F a r l e y , G A Saunders and C Y Chung (1975) J . Phys. C :
S o l . S t . Phys. 8 780
- 85 -
REFERENCES - CHAPTER 5
1. J C Cheng and J C Kemp (1971) Phys. Rev. B4 2841
2. J F C o r n w e l l (1969) 'Group theory and e l e c t r o n i c energy bands
i n s o l i d s ' North-Holland
3. A K e l l y , and G W Groves (1970) ' C r y s t a l l o g r a p h y and c r y s t a l
d e f e c t s ' Longman Group L t d . London
4. R W G Wyckoff (1965) ' C r y s t a l s t r u c t u r e s ' Vol.1 " i n t e r s c i e n c e
New York
5. J S Thorp, R A Vasquez, C Adcock and W Button (1976) J . Mat.
S c i . 11 89
6. J E Wertz and P Auzins (1957) Phys. Rev. 106 484
7. J S Prener (1953) J . Chem. Phys. 21 160
3. A A Manenkov and A M Prokhorov (1962) Sov. Phys. JETP 15 54
9. N S S h i r e n (1962) Proc. XI Colloque Ampere pp.114
10. N S S h i r e n (1962) B u l l . Am. Phys. Soc. 7 29
11. J II Van V l e c k (1940) Phys. Rev. 57 426 '
12. a D Mattuck and M W P Strandberg (1960) Phys. Rev. 119 1204
13. E R Andrew and D P T u n s t a l l (1961) Proc. Phys. Soc. 78 1
14. American I n s t i t u t e of P h y s i c s Handbook, 3rd ed. (1972) McGraw-Hill
New York
15. T H K Barron., W T Berg and J A Morrison (1959) Proc. Roy. Soc.
London Ser.A 250 70
16. J H Pace, D F Sampson and J S Thorp (1961) Proc. Phys. Soc. 77 257
17. N E Kask, L S Kornienko and A I Smirnov (1963) Sov. Phys. S o l .
S t . 5 1212
18. J H Van V l e c k (1960) Quantum E l e c t r o n i c s (Columbia U n i v e r s i t y
P r e s s New York) p.392
- 86 -
Chapter 5 (Continued)
19. K J Stan d l e y and R A Vaughan (1965) Phys. Rev. 139 A1275
20. P R Solomon (1966) Phys. Rev. 152 452
21. P L Donoho (1964) Phys. Rev. 133 A1080
22. J S Thorp, G L S t u r g e s s and G Brown (1972) J . Mat. S c i . 7 215
23.. D A Da v i s and P E Wagner (1964) Phys. Rev. L e t t . 12 141

- 87 -
REFERENCES - CHAPTER 6
1. C S Morgan and D H Bowen (1967) P h i l . Mag. 16 165
2. R S Wilks (1966) J . Nucl. Mater. 19 351
3. B Henderson, D H Bowen, A B r i g g s and R D King (1971) J , Phys.
C: S o l . S t . Phys. 4 1496
4. J Washburn, G W Groves, A K e l l y and G K Williamson (1960)
P h i l . Mag. 5 991
5. G J R u s s e l l (1976) Ph.D. T h e s i s U n i v e r s i t y of Durham
6. G W Groves and A K e l l y (1963) P h i l . Mag. 8 1437
7. D H Bowen and F J P C l a r k e (1964) P h i l . Mag. 9 413
8. D G Martin (1968) J . Phys. C: S o l . S t . Phys. I 333
9. p. Henderson and J E Wertz (1968) Adv. Phys. 17 749
10. J S Thorp, R A Vasquez, C Adcock and W I-iutton (1976)
J . Mat. S c i . 11 89
11. R D King and B Henderson (1967) P r o c . of B r i t . Ceramic Soc.
9 63
12. G J R u s s e l l . . E A E Ammar and J S Thorp (1976) (to be p u b l i s h e d )
13. R W Davidge (1967) J . Mat. S c i . 2 339
14. D G Martin (1966) A E R E Rep. No. R5269 243
15. B Henderson, J E Wertz, T P P H a l l and R D Dowsing (1971)
J . Phys. C: S o l . S t . Phys. 4 107
16. D H Bowen (1966) A E R E Rep. No. R5269 461
17. A B r i g g s and D H Bowen (1968) Mass T r a n s p o r t i n Oxides,
Nat. Bur. Stand. S p e c i a l Pub. (Washington U S Govt. P r i n t i n g
O f f i c e ) 296 103
- 88 -
APPENDIX
PUBLICATIONS
1. 'The d i e l e c t r i c c o n s t a n t s of CaWO,, Nd/Ce.WO, and Gd/CaWO ' 4 4 4
J 3 Thorp and E A E Ammar (1975) J . Mat. S c i . 10 918
2. ' S p i n - l a t t i c e r e l a x a t i o n i n gadolinium-doped c a l c i u m t u n g s t a t e '
J S Thorp and E A E Ammar (1976) J . Mat. S c i . 11 1215
3. 'Cavity growth i n r.eut::on-irradiated magnesium oxide'
G J R u s s e l l , E A E Arnmar and J S Thorp (1976)
J . Mat. S c i . (to be pu b l i s h e d )
4. !Q-banr; ESP s p e c t r a of gamma-irradiated Pyrex' G Brown,
E A E Ammar and J S Thorp (1976) J . Mat. S c i .
(to be publ i s h e d )
( 2 7 0CTI976 J V . s; now J