dtn-based nanosatellite architecture and hot spot ... · dtn-based nanosatellite architecture and...
TRANSCRIPT
1
DTN-based Nanosatellite Architecture and Hot SpotSelection Algorithm for Remote Areas Connection
Mario Marchese, Senior Member, IEEE, Fabio Patrone, Member, IEEE, and Marco Cello, Member, IEEE
Abstract—To extend the network coverage to rural andremote areas, there are different solutions with their advantagesand disadvantages. We propose to use a nanosatellite networkand to exploit the ability to cope with large delays anddisruptions provided by the Delay and Disruption TolerantNetworking (DTN) paradigm. The connection from remoteareas is managed through ground stations called cold spots thatcollect data from rural nodes and address them to thenanosatellites. Nanosatellites carry and download data to hotspots that address them to the Internet destinations. On thereverse direction, Internet data are addressed to hot spots,uploaded on nanosatellites and delivered to the ruraldestinations through cold spots. The problem of choosing the“optimal” hot spot where to address data from the Internetsource is important because a wrong choice could lead to largedelivery delays. In this paper, we propose “gRANteD”: aNanosatellite-DTN Network for rural and remote areas.gRANteD includes “HotSel”, a hot spot selection algorithm tominimize the delivery time of all data destined to rural users.The performance evaluation is carried out through a DTNmodule which implements gRANteD and HotSel, within theframework of Network Simulator 3 (NS3).
Keywords—Remote areas connection, satellite networks,nanosatellite communications, TCP/IP, DTN.
I. INTRODUCTION
A. The use of nanosatellites for network access in rural areas
The digital divide in the world is still evident [1]. One ofthe reasons is that many countries do not have a suitable ICTinfrastructure to provide network connection at least in givenperiods of the day for specific non-real-time services.Satellites and Multi-Layered Satellite Networks [2] can be analternative solution but current technologies require highcosts in the construction, launch, and maintenance.Nanosatellites [3] have been recently proposed as acost-effective solution to extend the network access in ruraland remote areas. The main reasons for the development anduse of nanosatellites are, for now: enabling low data ratecommunications, gathering data from multiple points, andinspecting the activities of larger satellites. CubeSat [4],which requires 0.1% of the cost of a classical LEO satellite,
Copyright (c) 2015 IEEE. Personal use of this material is permitted.However, permission to use this material for any other purposes must beobtained from the IEEE by sending a request to [email protected] Marchese and Fabio Patrone are with Dept. of Electric, Electronic,Telecommunication Engineering, and Naval Architecture (DITEN), Univ. ofGenoa (Italy). E-mails: [email protected], [email protected] Cello is with Nokia Bell Labs, Dublin, Ireland. E-mail:[email protected]
is aimed at enabling a constellation of nanosatellites forEarth imaging even if other applications are not excluded.Nanosatellites main reference applications are non-real timeservices. Low data rate real-time service (e.g. web browsing)might be provided at cost of a large number of nanosatellitesin the constellation and of Earth stations, as also shown inthis paper. Otherwise, it is possible to refer to a sort ofdelay-tolerant web browsing where a larger delay than theone of regular web services may be tolerated.
B. Introduction to gRANteD and HotSel
In this scenario we would like to get a transparentbidirectional communication between the users in the ruralareas and the servers on the Internet. Communications mustbe based on the TCP/IP protocol stack running on endpointsin order to avoid software modifications on Internet serversand to make rural endpoints real hosts of the Internet. Toreach this aim we propose “gRANteD”, a novel architectureable to guarantee a transparent communication amongTCP/IP endpoints through a Delay and Disruption TolerantNetworking (DTN)-based heterogeneous network. Differentlyfrom Geostationary Earth Orbit (GEO) satellite networks, innanosatellite networks there is hardly or never a persistentcommunication path between rural nodes and destinationservers, because all links may be not up at the same time [5].The DTN architecture [6] provides long term informationstorage at intermediate nodes so tackling link disruptions,very long delays, and intermittent connectivity. The action iscarried out through an overlay protocol, called BundleProtocol (BP) [7], developed on top of either transport (suchas TCP and UDP) and lower layer (such as Bluetooth andEthernet) protocols. BP data unit is called “bundle”, which isa message that encapsulates application layer protocol dataunits.
Accordingly, gRANteD performance is heavily affected bythe time that bundles must wait in ground stations andnanosatellites buffers. On the path from rural nodes to theInternet (forward path), data delivered to the cold spotmanaging the remote region and uploaded to nanosatellitesare downloaded to the first available hot spot along the path.Even if the dynamic choice of uploading nanosatellites anddownloading hot spots might bring advantages to the overallcommunication, the forward path is not considered foroptimization in this paper. On the reverse path, a server onthe Internet that wants to reply to a rural user has some hotspot alternatives to whom it can deliver data. Different hotspots can send data to the destination with different deliverydelays depending on the number, position, and buffer

2
occupancy of the nanosatellites they come in contact with.The problem of choosing the “best” hot spot impacts on thedelivery delay. To tackle this issue we introduce “HotSel”, ahot spot selection mechanism, part of the gRANteDarchitecture, able to minimize the delivery time.
C. Structure of the paper
The remainder of this paper is structured as follows.Section II describes the state of the art. Section III presentsthe reference scenario of a nanosatellite-DTN-based networkto connect remote areas. Section IV describes the gRANteDarchitecture. The proposed HotSel algorithm is described inSection V. Sections VI and VII provide, respectively, adescription of the Bundle Protocol extension necessary forgRANteD and HotSel and of the DTN solution implementedin the NS3 simulator. The performance analysis is shown inSection VIII. Conclusions are drawn in Section IX.
II. STATE OF THE ART
Connecting remote areas where there is no terrestrialinfrastructure or where it is damaged to the Internet is not arecent challenge. [8] proposes a method to establish acommunication with the Internet for the nomadic Saamipopulation by using DTN mobile devices. [9] introducesDakNet, an ad-hoc wireless network that providesasynchronous connectivity based on rural kiosks and portablestorage devices mounted on a bus, a motorcycle or a bicycle.A similar architecture, again based on mechanic backhauls, isdescribed in [10]. The architecture used in [11] is amulti-hop mesh network composed of long-distance 802.11links. A communication system based on the combination ofUAVs, DTN wireless technologies, and regular traffic ofboats has been proposed in [12]. [13] exploits publictransportation and commuting vehicles such as taxisequipped with wireless DTN-enabled devices. Some of thedescribed architectures offer valid and inexpensive solutions(e.g., with an investment of $15 million, the mentionedDakNet [9] could equip 50 000 rural buses in India), but maysuffer from performance limits and insecurities due to theuse of mechanic backhauls.
Concerning emergency communication systems in case oflarge-scale disasters that can damage and temporarily turn offthe telecommunication infrastructure: [14] proposes amultihop Device-to-Device (D2D) communication networkbased on DTN/MANET terminals; [15] exploits the use ofballoons, electric vehicles, and UAVs; and [16] proposes touse a Disaster Information Network System based on DTNwith Cognitive Wireless Network (CWN). Enlarging Internetaccess is very useful also for healthcare in rural areas [17][18].
The Internet Research Task Force (IRTF) created aworking group called Global Access to the Internet for All(GAIA) in 2014 [19] aimed at increasing the interest on thechallenges and opportunities in enabling global Internetaccess. Projects related to GAIA, including Project Loon andInternet.org mentioned below, are summarized in [20].Project Loon [21] is an initiative by Google which involves
the use of balloons in the stratosphere, at an altitude of about20 km. Internet.org [22] is a project started by Facebook inpartnership with other companies, non-profit organizations,and governments. Internet.org goal is to create a wirelessnetwork by using Free Space Optics and radio waves.
Other projects of main interest are: architectuRE for anInternet For Everybody (RIFE) [23]; Aerial Base Stationswith Opportunistic Links for Unexpected and TemporaryEvents (ABSOLUTE) [24]; SpaceX and partners [25]; andOneWeb [26].
Existing commercial satellite networks may be analternative to connect remote areas to the Internet. Iridium[27], Globalstar [28], and Orbcomm [29] are LEO satelliteconstellations that provide phone and data communicationservices, such as Iridium Certus, the new service platform tobe powered by the new Iridium NEXT constellation [30].Inmarsat [31] is a GEO satellite constellation for voice anddata services. These solutions offer a complete coverage,they do not involve disruptive links and may be used to offeralso real-time services. Even if performances are good, theyare very expensive due to the production and launch costs ofsatellites. For example, after its complete deployment, theIridium NEXT network will be composed of 81 satellitesable to offer a transmission rate of up to 1.4 Mbps in L-bandfrequency with an estimated cost of about $3 billion. TheInmarsat’s Global Xpress (GX) constellation is formed offour Ka-band, high-speed mobile broadband communicationsGEO satellites, with a cost of $1.6 billion.
III. NANOSATELLITE-DTN-BASED NETWORK FOR RURAL
ACCESS: REFERENCE SCENARIO
The joint use of nanosatellites and DTN paradigm [3] allowsavoiding the drawbacks of mechanic backhauls and assureslower costs than GEO and LEO existing commercial satellitenetworks even if, as said in the introduction, it can’t currentlyprovide a continuous overall coverage and, consequently, real-time services.
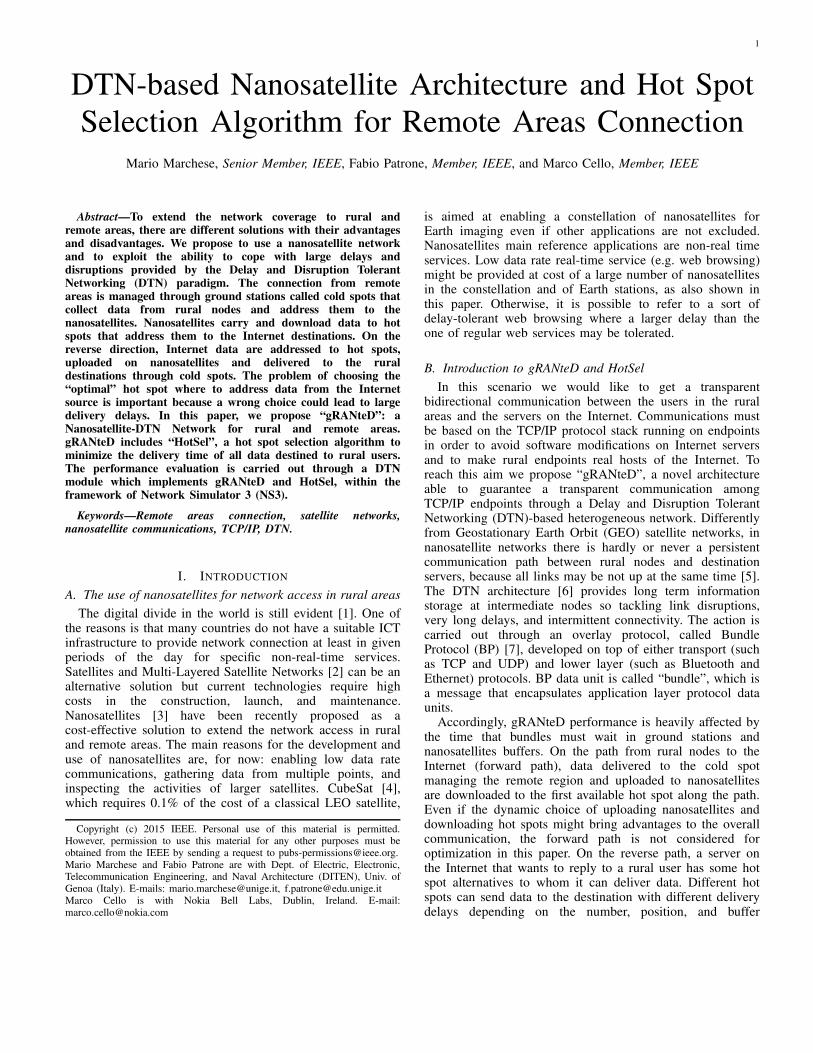
Figure 1 shows the reference scenario (partially taken from[3]) of a Nanosatellite-DTN network.
The following types of nodes are used and depicted in Figure1.
• Rural nodes (R1, . . . , RN , RN+1, . . . , RM ): representthe users located in rural and remote areas.
• Cold Spots (CS1 and CS2): are the ground stationsthat, on one hand, collect all data from rural nodes inorder to upload them on nanosatellites, and, on theother hand, download data destined to rural users fromnanosatellites.
• Hot Spots (HS1 and HS2): are the ground stationsthat, on the forward direction, download data fromnanosatellites and forward them to the destinationnodes in the Internet, and, on the reverse direction,upload data on the nanosatellites that will deliver themto the destination rural nodes.
• Nanosatellites (SAT1, SAT2, and SAT3): are thenanosatellites which exchange data with groundstations (both hot and cold spots). They change theirposition along their orbit.
3
SAT2
CS1
R1
DC
Internet
RN. . .
CS2
HS1 HS2
SAT1
SAT3
RN+1 RM. . .
Figure 1: Nanosatellite network scenario.
• Internet node (D): is an Internet node (e.g. Database,Mail, Web Server, Remote Controller, . . . ) which acts asthe destination of all rural nodes requests.
• Central node (C): its purpose is to receive all ruralnodes requests in order to collect all responses and toforward each of them back to the proper hot spot. Inpractice C is the decision maker that will implementthe HotSel algorithm within the gRANteD architecture.
When a rural user, for example R1, wants to connect tothe Internet, it sends its request to the cold spot (e.g., CS1)that manages the remote region where it is located. CS1 waitsthe transit of the next nanosatellite (SAT1 in the example inFigure 1). If the nanosatellite has sufficient storage, it acceptsand transports the request. When it comes in contact with thefirst hot spot on its route (HS2), it delivers the request to it.No dynamic choice of the hot spot where to deliver forwardrequests is forecast in this paper: the request is sent to the firsthot spot met along the path. HS2 forwards the message to thecentral node C. C reads the message to know which is thedestination node (e.g. D) and delivers the request to it. On thereverse path, D sends back the response to the central node. Cselects one of the hot spots under its control and forwards theresponse to it. The selected hot spot uploads the message ona nanosatellite that transfers it to the proper cold spot whichfinally delivers the response to the rural node R1.
IV. GRANTED ARCHITECTURE
Links between cold spots and nanosatellites and betweennanosatellites and hot spots are not permanently activesatellite links. Relying the communications from/tonanosatellites on DTN tackles this situation. The gRANteDarchitecture and related nodes are shown in Figure 2.
Cold spots have to connect with both rural hosts andnanosatellites, so these nodes must have both a TCP/IP and aDTN interface. Hot spots are completely DTN nodes because
their purpose is only to forward the bundles received fromnanosatellites to the central node and to upload all thebundles sent by the central node on nanosatellites. Thecentral node has both a TCP/IP interface, which allows it toestablish a TCP connection with the destination node inorder to collect all the information required by the sourcenode, and a DTN interface aimed of creating and forwardingbundles to hot spots. The connection is split into three parts,as clear in Figure 2. The highest layer of the Central Nodeand of all Cold Spots is indicated as Application*. It is aparticular relay layer extracting information from bundlesand, if needed, uniquely associating each received request toits source node. The central node has the samecharacteristics. It is also important to remark the relay actionof the Bundle Layer [5] at hot spot and cold spot nodes,which allows not only the information storage at intermediatenodes but also the implementation of dedicated protocolstacks for single network portions, as happens over thesatellite links in Figure 2. The satellite-dedicated protocolstack has been left unspecified in Figure 2. Actually it caninclude, if necessary, a satellite-specific transport, network,and data link layer, as done in this paper (Section VII) forimplementation reasons, but, given the nature ofpoint-to-point connectivity in this case and the chance to usethe routing functions included in the Bundle Layer, the useof a satellite data link layer may be enough.
V. HOT SPOT SELECTION
A. HotSel Implementation
In this section we describe “HotSel”, the dynamic hot spotselection method implemented in the central node C.
HotSel computes the optimal hot spot choice to minimizethe delivery time of each bundle destined to rural users. Todo this, the central node needs to know, in each time instant,the current position of nanosatellites and hot/cold spots (thisinformation is supposed to be known in this paper1), andhow hot spots and nanosatellites buffer occupancy willevolve, in order to predict how much data will be loaded oneach satellite and when the new bundle will be served. Inparticular, at each bundle arrival, for each “candidate” hotspot, the algorithm computes the number of nanosatellitesnecessary to upload the already queued bundles and the newarrived one. To fulfil this aim, HotSel analyses eachnanosatellite in order to estimate its buffer occupancyevolution in the near future. No other parameter isconsidered by HotSel to make the hot spot choice as simplestas possible. The literature contains papers, partially from thesame authors, about the choice of the Earth Station where toaccess the satellite from a sensor network [33], where othermetrics possibly contrasting with each other such as packetloss rate, average packet delay, and energy consumption areconsidered by using the Multi-Attribute Decision Making(MADM) environment. The use of other metrics, which
1as also done by the Contact Graph Routing (CGR) [32] which may beconsidered the state of the art concerning LEO satellite networks and wheredecisions are made by using only information about contacts, which dependon the number and position of satellites and hot/cold spots

4
TCP
Bundle Layer Bundle LayerBundle Layer
IP
Data Link
Satellite-
dedicated
protocol
stack
Satellite Hot spot DestinationSource Cold spot Central Node
TCP
IP
Data Link
TCP
IP
Data Link
TCP
IP
Data Link
TCP
IP
Data Link
TCP
IP
Data Link
ApplicationApplication* Application*
ApplicationBundle Layer
Satellite-
dedicated
protocol
stack
Satellite-
dedicated
protocol
stack
Satellite-
dedicated
protocol
stack
Figure 2: Network Architecture.
requires to take measures or to estimate metric valuesthrough theoretical models, needs an attentive analysis withrespect to time, computational load, and implementationissues also considering current Bundle Protocol [7] standard,and may be considered for future research.
A preliminary description and evaluation of HotSel can befound in [34] and [35]. Similar studies related to routing havebeen performed in [36] and [37].
HotSel algorithm is shown in Figure 3. A bundle BJ needsto be transmitted to CSJ , J ∈ CS, being CS = {1, NCS}the set of cold spots identifiers and J the index identifying aspecific element within CS. For each hot spot HSi, i ∈ HS,being HS = {1, NHS} the set of hot spots identifiers and ithe index identifying a specific element within HS, HotSelcomputes the delivery time Di,J needed to transmit BJ usingHSi as hot spot. The number of bundles dHS
i,J queued on HSi
and directed to CSJ is updated considering the new arrivedbundle BJ . The new value is dHS
i,J ← dHSi,J+1. Then the function
ComputeNumberNanosatellites computes the number Si
of nanosatellites on the constellation that HSi uses to uploadthe queued data (dHS
i,J ) destined to CSJ .The delivery time Di,J is computed as:
Di,J = wi,k + (Si − 1)W
NSAT
+ ti,J , (1)
where wi,k is the flight time from its current position to HSi
of the first nanosatellite SATk that will come in contact withi, k ∈ SAT , being SAT = {1, NSAT} the set ofnanosatellite identifiers and k a specific nanosatellite index.NSAT is the overall number nanosatellites. Being W theoverall revolution time of each nanosatellite, W
NSATis the
average flight time between two nanosatellites. ti,J is theflight time of each SATk, ∀k ∈ SAT , between its contactwith HSi and CSJ . HotSel iterates on all hot spots. Theoptimal io − th HS (HSio) that minimizes the delivery timeof the bundle BJ is:
io = argmini∈HS
Di,J . (2)
B. Function ComputeNumberSatellites
The implementation of the functionComputeNumberNanosatellites is reported in Figure 4.
Input: BJ - bundle destined to CSJ ; HS, CS,SAT - set of hotspots, cold spots and nanosatellites, respectively;
Output: io - HSi that minimizes the delivery time of bundle BJ ;
1 foreach hot spot i ∈ HS do
2 dHSi,J← dHS
i,J+ 1;
3 Si ← ComputeNumberNanosatellites (dHSi,J
);
4 Di,J ← wi,k + (Si − 1) WNSAT
+ ti,J ;
5 io = argmini∈HS
Di,J ;
Figure 3: HotSel algorithm
1 function ComputeNumberNanosatellites (di,J );2 nanosatellite k ← first nanosatellite comes in contact with HSi;3 Si = 0 repeat
4 nextHS(k): next HS on the path of SATk;5 CSk: subset of CS on the path of SATk between
nextHS(k)− 1 and nextHS(k) ;6 UploadDataOnSAT (k, nextHS(k), CSk);7 Si ← Si + 1;8 k ← k − 1;
9 until dHSiJ
= 0;10 return Si;
Figure 4: Function ComputeNumberNanosatellites
SATk is selected as the first nanosatellite that will comein contact with HSi (Line 2). The function enters in ado-while loop in which SATk is virtually moved on its path,also downloading data to cold spots and uploading data fromhot spots until it comes in contact with HSi. The action ofuploading from cold spots and downloading to hot spots,belonging to the forward channel actions, is neglected in thispaper, as said before. At the contact the amount of HSi
queued data to be uploaded will depend on the residualtransport capacity of SATk. SATk movement and relativedata upload from hot spots and download to cold spots issimulated by using the function UploadDataOnSAT shownin Figure 5 and explained in the next subsection. If SATk
comes in contact with other hot spots and cold spots duringthe virtual movement, the relative queues are updatedaccording to the data stored in the nodes. Lines 4 and 5 in

5
Figure 4 define two variables: nextHS(k), which representsthe next hot spot with which SATk will come in contact, andCSk, which is the set of cold spots that are located betweenthe two hot spots where SATk is currently positioned. Weindicate with nextHS(k) − 1 the hot spot beforenextHS(k) on the clockwise orbit path. Referring to Figure1 and assuming SATk as SAT3, it is true thatnextHS(k) = HS1, CSk = CS2 andnextHS(k) − 1 = HS2. When SATk has virtually receivedthe data from HSi and from the other hot spots, the variableSi is incremented by 1 and the next nanosatellite is analysed(k ← k − 1 means that the nanosatellite behind k isanalysed). The loop terminates when all the bundles queuedin HSi and destined to CSJ have been virtually uploaded(diJ = 0). Obviously, at the end of the loop, the variable Si
contains the number of nanosatellites necessary to completethis operation.
C. Function UploadDataOnSAT
The aim of the function UploadDataOnSAT is to simulatethe movement of SATk along its path and the consequent dataupload/download, having HSi, nextNS(k), and CSk as input.
1 function UploadDataOnSAT (k, nextHS(k), CSk);2 if nextHS(k) = i then
3 if CSk 6= ∅ then
4 dSATk,j
= 0 ∀j ∈ CSk;
5 calculate pi,j,k using Eqs. (3) − (5);6 dHS
i,j ← dHSi,j − pi,j,k, ∀j ∈ CS;
7 dSATk,j← dSAT
k,j+ pi,j,k, ∀j ∈ CS;
8 else
9 if CSk 6= ∅ then
10 dSATk,j
= 0 ∀j ∈ CSk;
11 calculate pl,j,k using Eqs. (8) − (10);12 dHS
l,j← dHS
l,j− pl,j,k, ∀j ∈ CS;
13 dSATk,j← dSAT
k,j+ pl,j,k, ∀j ∈ CS;
14
15 nextHS(k)← nextHS(k) + 1;16 CSk ← subset of CS on the path of SATk between
nextHS(k)− 1 and nextHS(k) ;17 UploadDataOnSAT (k, nextHS(k), CSk);
Figure 5: Function UploadDataOnSAT
In case the next hot spot with which SATk comes incontact is just the analysed HSi (as HS1 in Figure 1 withSAT1), the lines 3-7 in Figure 5 are processed. If there is atleast one cold spot in the orbit portion in which SATk islocated (CSk 6= ∅), SATk downloads all the data destined tothose cold spots and then sets the number of bundles storedon SATk and destined to CSj to zero: dSAT
k,j = 0, ∀j ∈ CSk.The assumption that a generic nanosatellite can download alldata destined to a given cold spot simplifies the computationsand the description of the algorithm but introduces aconstraint on the amount of bundles that can be uploaded onthe satellite itself, given the “download to cold spots/upload
from hot spots” transmission rates and the time window ateach nanosatellite transit. We suppose this amount of datafixed and equal to Q. This means that, in each orbit round,each SATk cannot carry more than Q bundles from hot spotsand can download to the destination cold spot only thisamount of data. In practice, from the operative viewpoint, thebehaviour is the same as if each nanosatellite had separatedonboard buffers for destination cold spot and each buffer hada maximum length of Q bundles.
After this operation, SATk is virtually moved until it comesin contact with HSi. HotSel computes the number pi,j,k ofbundles destined to CSj that HSi will upload on SATk asfollows:
pi,j,k, ∀j ∈ CS (3)
s.t.
pi,j,k ≤ min[dHSi,j , Q−dSAT
k,j ], (4)∑
∀j∈CS
pi,j,k ≤ Q; (5)
Constraints 4 and 5 mean, respectively, that: 1) HSi cannotupload more data than those it has stored and it cannot uploadmore than Q−dSAT
k,j data destined to CSj . In this way SATk
will not carry more than Q data destined to CSj and it willempty the buffer dedicated to CSj when it will come in contactwith CSj . 2) The total amount of data that HSi uploads toSATk is bounded by Q.
Finally, hot spot and nanosatellite buffer occupancies areupdated:
dHSi,j ← dHS
i,j − pi,j,k, ∀j ∈ CS (6)
dSATk,j ← dSAT
k,j + pi,j,k, ∀j ∈ CS. (7)
Alternatively, if the next hot spot with which SATk comesin contact is not HSi (Lines 8-17 in Figure 5), as HS1 inFigure 1 with SAT2, HotSel proceeds making the calculationsdescribed before but considering the next hot spot with whichSATk comes in contact, called HSl. In particular:
pl,j,k, ∀j ∈ CS (8)
s.t.
pl,j,k ≤ min[dHSl,j , Q−dHS
k,j ], (9)∑
∀j∈CS
pl,j,k ≤ Q; (10)
The equations above are derived from Eq. (3), (4), and (5)with the substitution of i with l. Then HSl and SATk bufferoccupancies are updated:
dHSl,j ← dHS
l,j − pl,j,k, ∀j ∈ CS (11)
dSATk,j ← dSAT
k,j + pl,j,k, ∀j ∈ CS. (12)
Finally, SATk is virtually moved to the next orbit portion (itwould be moved after HS2 in Figure 1): nextHS(k) and CSkare updated and UploadDataOnSAT is called recursively.
To make this algorithm usable in any nanosatellite networktopology is necessary that:

6
• the overall buffer of each hot spot has always enoughfree space to store the messages received from the centralnode;
• the overall buffer of all nanosatellites is big enough inorder to allow storing the maximum possible amount ofdata destined to each cold spot; it practice, it has to beat least Q ·NHS bundles.
VI. NEEDED EXTENSION TO THE BUNDLE PROTOCOL
Given the requirements of HotSel, it is necessary to define aproper extension of the standard version of the Bundle Protocol[7] in order to handle the following aspects:
• Nanosatellites must forward status information about thenumber of bundles stored on board for any destinationcold spot;
• Hot spots must periodically forward status informationabout the number of stored bundles for any destinationcold spot to the central node.
In practice, it is necessary to introduce a special statusbundle which contains hot spot and nanosatellite bufferoccupancy information (i.e. the status information) used tocorrectly implement the hot spot selection. The status bundlemay be practically implemented in the extension blocksenvisioned in [7]. In this view, the implementation of HotSelis fully compliant with the original BP standard.
VII. DTN IMPLEMENTATION IN NS3
The aim is to test gRANteD and HotSel over a simulatednanosatellite network scenario. The developed simulator isbased on the software Network Simulator 3 (NS3). We haveimplemented an additional module which includes apersonalized and lighter version of the Bundle Protocol, animplementation of the main characteristics of the DTNparadigm, functions related to the LEO satellite movement,the proposed gRANteD architecture, and the HotSelalgorithm. Due to the operative limitations of the usedsimulation tool concerning nanosatellite and DTNenvironments, some approximations have been carried on topursue the aim.
A. gRANteD Architecture Implementation
Explicitly referring to Figure 2: links between Destinationsand Central Node are not modelled. The two nodes are thesame in the simulations. The Central Node is the destinationof all requests and the origin of the return channel.
The links between Cold Spots and Rural Nodes and betweenHot Spots and Central Node use the following protocols: TCP,IP, and Ethernet. They are simulated in NS3 by using NS3 TCP,IP, and CSMA modules. The sender node opens a transmissionTCP socket for each transmitting bundle. It is so possible toachieve multiple contemporary bundle transmissions.
The satellite-dedicated protocol stack acting over the linksbelonging to the Space Segment is approximated as follows.An overall block composed of transport, network, and datalink protocols has been chosen to simplify theimplementation over NS3. Concerning the data link layer, we
adapt the NS3 Wi-Fi module opportunely setting someparameters in order to allow the transmission at distancesmuch bigger than the ones of standard Wi-Fi networks. Wemade this choice because even though several Satellite DataLink layer protocols have been defined [38], no one isavailable in NS3. Since the focus of this work is not relatedto the design and test of a satellite data link protocol, we canuse the NS3 Wi-Fi module in this simulation environmentwithout affecting the obtained performance trend. We havedefined a couple of Wi-Fi interfaces (one for the receiver andanother one for the transmitter) for both Nanosatellites andGround Stations. In this way, these nodes are able toexchange bundles even though they are located hundreds ofkilometres from each others, avoiding problems related to thecarrier sense. The Satellite Network layer protocol is IP,which is fully implemented through the NS3 IP module. Forthe Satellite Transport layer there are different possibleprotocols [39] [40]. We have chosen the UDP, available inthe NS3 UDP module. UDP is simple, connectionless, andintroduces a few bytes of overhead due to its reduced headersize and a limited complexity and resource utilization. Thedrawback is that UDP offers unreliable communications: if abundle were corrupted or lost during a satellitecommunication, there would be no way to identify this lossand to retransmit the bundle. To avoid this, we haveimplemented a DTN acknowledgement mechanism within themodified Bundle Layer described in the following.
The “change” of transport protocol on all ground stationsis really implemented through the relay action of the BundleLayer. Hot spots remove TCP headers from the data receivedby the central node and encapsulate the received bundles inUDP to upload them on nanosatellites. In rural areas, coldspots do the reverse operation removing UDP headers andencapsulating bundles over TCP to forward them to ruralnodes. Above the transport layer, we have implemented aDTN module for NS3, starting from [41].
B. Bundle Protocol implementation
The implemented DTN layer assures the main functionalitiesof the bundle protocol but bypasses the following actions: LateBinding, Multicast, Priority Classes, and Security.
The modified bundle protocol header is composed asfollows:• Destination Endpoint ID (EID), 32 bit: text string which
identifies the destination DTN node;• Source Endpoint ID (EID), 32 bit: text string which
identifies the source DTN node;• Sequence Number, 32 bit: number which differentiates
each bundle created by a DTN node from all the otherones created by the same DTN node;
• Payload Size, 32 bit: size of the DTN payload in Byte;• Source Timestamp, 32 bit: time instant when the bundle
has been created;• Type, 8 bit: number which distinguishes the bundle type:
◦ 0 - data bundle: it contains information data;◦ 1 - ack bundle: it is used to have a reliable
transmission over satellite links and to implementthe custody transfer function;
7
◦ 2 - status bundle: it contains the statusinformation as specified in Section VII-A used tocorrectly implement the hot spot selection.
The number of bundles destined to specific cold spots andstored within each nanosatellite k (dSAT
k,j , ∀j ∈ CS and
∀k ∈ SAT ) and hot spot i (dHSi,j , ∀j ∈ CS and ∀i ∈ HS) are
addressed to the Central Node in the payload of statusbundles (Type=2) sent at the beginning and at the end ofeach contact between hot spots and nanosatellites.
Concerning the DTN acknowledgement mechanismoperating over UDP-based satellite portions, when a nodesends a data bundle through the satellite link, the receiversends back a DTN ack bundle to notify the successfulreception. The sender keeps a copy of sent bundles until itreceives the DTN ack for all these bundles. This action notonly adds reliability to satellite links but, in practice, is theway we use to implement the custody of a bundle sobypassing the real implementation of the custody transfermechanism.
In more detail, refering to the bundle protocol header , if adata bundle (Type=0) with a given Sequence Number arrivesat a DTN node, the bundle is acknowledged by using an ackbundle (Type=1). This ack bundle transports theacknowledgement number within the Sequence Number field.Status bundles are not acknowledged. To practicallyimplement the mechanism, each node keeps a list of itsactive transmission sockets. At a new transmission, thesender node creates and adds a new socket to the list (asocket for each bundle for design choice), sets a timeout,and, after the end of the transmission (or after the receptionof the DTN ack bundle), removes the socket from this list. Ifthe socket is still in the list when the timeout expires, itmeans that the communication is not successfully completedand the data bundle is sent again to the output buffer.
To allow each intermediate DTN node to forward bundles,we have implemented a round-robin scheduling policy. AllDTN nodes store each bundle in a different queue dependingon the destination and send the first bundle of each queue,serving the queues in circular order. In this way, it will bepossible in the future to assign a different priority to eachqueue, in order to implement a sort of QoS mechanism.From the operative viewpoint, we manually set the routingtables of all DTN nodes. To simulate traffic flows we don’tuse traffic applications defined in NS3, but directly a set ofbundles that are enqueued in the output buffer.
VIII. PERFORMANCE ANALYSIS
We define as orbit portion each part of the orbit betweentwo consecutive hot spots. Nanosatellites are consideredequally spaced assuming that the orbit is almost circular andthe nanosatellites speed is constant even though in a realscenario it is not exactly so. The simulation environmentrepresents 2-D scenarios. The first set of tests, in subsectionVIII-A, focuses on the performance of HotSel whencompared with two alternative algorithms by varying thebundle generation function and the network loadconfiguration. The number of hot spots, cold spots, and
nanosatellites is kept low to allow better focusing on thedecision mechanisms used by HotSel with respect to theother schemes. The performance of HotSel are checked byincreasing the satellite transmission rate in subsection VIII-Band the number of nanosatellites and hot spots in subsectionVIII-C. Increasing the number of these elements allowsreducing the end-to-end delay to values that may becompatible with regular web browsing. Checking thefeasibility of web browsing in this environment is the aim ofsubsection VIII-D. Subsection VIII-E analyses thenanosatellite buffer occupancy obtained through HotSel. Thetrade-off between network performance and costs is theobject of subsection VIII-F.
A. Definition of performance metrics and HotSel comparisonwith Static and Random Choices
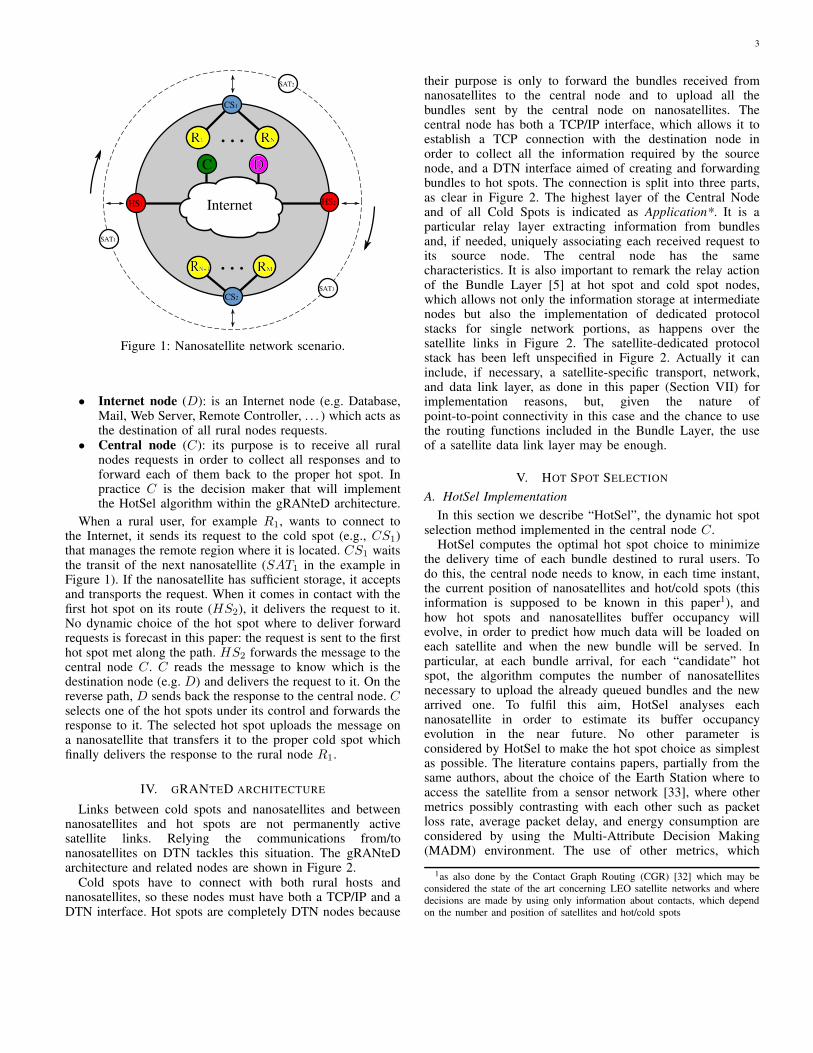
We performed a set of tests by using two different scenarios:
1) Scenario 1: composed of 4 hot spots (HS1-HS4), 4nanosatellites (SAT1-SAT4), 8 cold spots (CS1-CS8),and 2 rural nodes for each cold spot (R1 and R2 arelinked to CS1, R3 and R4 are linked to CS2, . . . ). Itstopology is shown in Figure 6.
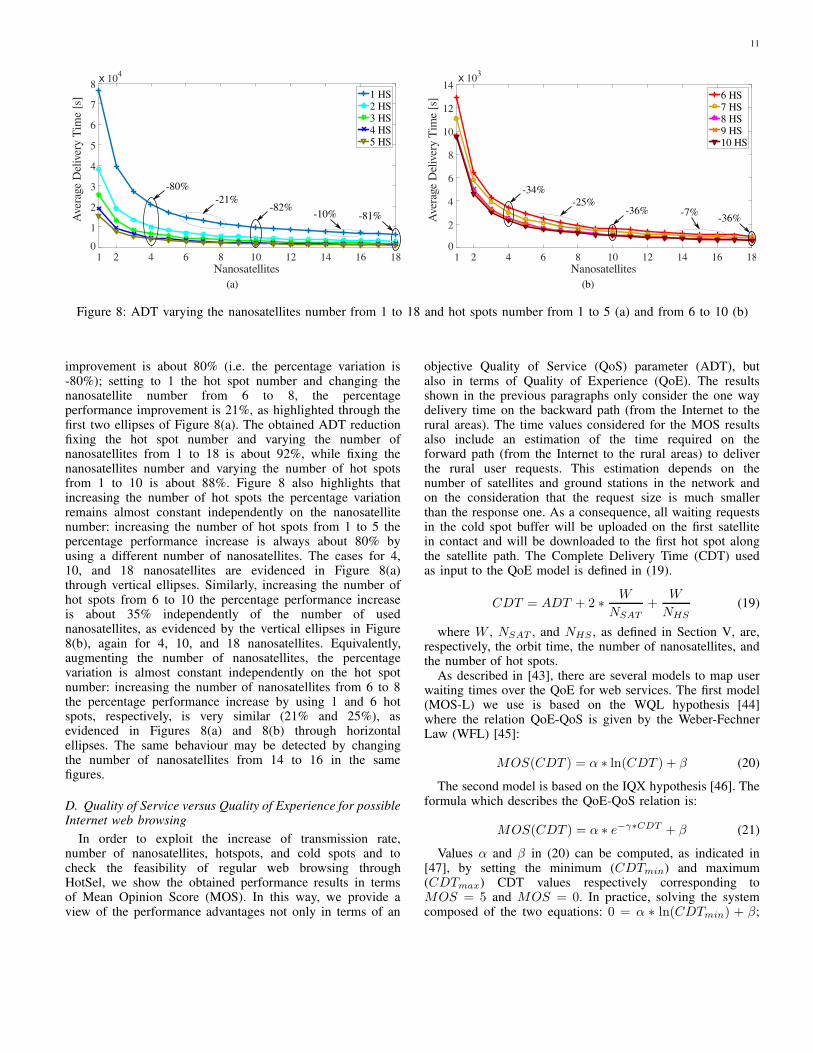
2) Scenario 2: composed of 4 hot spots (HS1-HS4), 8nanosatellites (SAT1-SAT8), 16 cold spots(CS1-CS16), and 2 rural nodes for each cold spot(R1-R32). Its topology is shown in Figure 7.
SAT3
HS2
C
HS4
HS1 HS3
SAT1
SAT4
CS1
CS2 CS3
CS4
CS7 CS6
CS8 CS5
30°R1-R2
SAT2
R3-R4
R5-R6
R7-R8
R9-R10
R11-R12R13-R14
R15-R16
Internet
Figure 6: Scenario 1
For each scenario, we have performed differentsimulations by varying the bundles generation function ofeach traffic flow and the group of destination rural nodes, inorder to test the performance in different realistic traffic loadsituations and to individuate a group of exemplary load casesthat may impact on performance. Each simulated traffic flowhas the central node as source node and a rural node asdestination node. For the sake of implementation simplicity,

8
SAT5
HS2
C
HS4
HS1 HS3
SAT1
SAT7
CS1
CS2
CS6
CS8
CS14 CS11
CS16 CS9
18°
SAT3
SAT2
SAT4
SAT6
SAT8
CS4
CS3
CS5
CS7
CS10
CS12CS13
CS15
R1-R2
R3-R4
R5-R6
R7-R8 R9-R10
R11-R12
R13-R14
R15-R16
R17-R18
R19-R20
R21-R22
R23-R24R25-R26
R27-R28
R29-R30
R31-R32
Internet
Figure 7: Scenario 2
the application layer is not implemented and the bundle layeracts directly as traffic generator. It obviously implies that therural destination nodes implement the bundle layer instead ofthe application layer. The following formalism is used todefine the rural nodes where the traffic is addressed: thenotation Rx-Ry-Rz-Rt means that the bundles are addressedto Rx, Ry , Rz , and Rt at the same time.
The numerical settings regarding the satellitecommunication and the traffic flow configurations aresummarized in Table I.
Table I: Satellite communication and traffic flow configurationparameters.
orbit shape circular
satellite altitude 200 km
satellite velocity 7 788 m/s
satellite coverage radius 500 km
orbit time (W) 5 300 s
transmission range 500 km
uplink and downlink transmission rate 230 kbps
contact duration 256 s
contact volume (Q) 7 MB
bundle size 100 kB
flow size 500 bundles
bundle generation interval 1 ÷ 500 s
We have used four different bundle generation functions. n
is the bundle index that varies from 1 to 500. Tn is the timeinstant in seconds when the n − th bundle is generated. Tn
ranges in the same time interval for the different generationfunctions to fairly compare the performance:
• Uniform:Tn = n (13)
• Fast start:
Tn =
(
500 + 9 ∗ n
510− n
)
(14)
At the beginning of the simulation each flow has a hightransmission rate which decreases rapidly in the first halfof the simulation and slowly in the second half.
• Slow start:
Tn =
(
510 ∗ n− 500
n+ 9
)
(15)
At the beginning of the simulation each flow has a lowtransmission rate which increases slowly in the first halfof the simulation and rapidly in the second half.
• On/Off:
Tn =
(⌊
n− 1
100
⌋
∗100
)
+
((
n− 1)
mod 100)
2+1 (16)
Each traffic flow generates a bundle every 0.5 s in timeintervals (in s) [1, 50.5], [101, 150.5], [201, 250.5], [301,350.5], [401, 450.5] and does not transmit any bundlesin the other time intervals, mimicking the behaviour ofdata bursts.
The parameter used to evaluate the performance is theAverage Delivery Time (ADT) defined as:
ADT =
∑Mm=1 ADTm
M(17)
where
ADTm =
∑Nm
n=1
(
TRXn − T TX
n
)
Nm
(18)
M is the number of traffic flows in the simulation, Nm isthe number of bundles of the m− th traffic flow, TRX
n is thetime instant when the n− th bundle is received, and T TX
n isthe time instant when the n− th bundle is transmitted by thesource.
For each simulation, we have compared the ADT from thecentral node to the rural destination nodes for three differentmechanisms of hot spot selection:
- HotSel.- Static choice: all bundles destined to a specific rural
area are forwarded to the last hot spot met bynanosatellites before the reference cold spot of therural area (for example, all bundles destined to R1-R2
will be forwarded to HS1 for both scenarios). Thisaction depends only on the contacts, i.e. on the numberand position of nanosatellites and ground stations. It isthe same choice made by the Contact Graph Routing(CGR) algorithm [32], widely used in satellitenetworks and in research studies as a comparison [42].

9
- Random choice: the Hot Spot choice is random for eachbundle with the same a priori probability for all ruralareas.
To better quantify the performance improvement achievableby using HotSel, we have decided to test four different networkload configurations for each scenario:
1) One portion (1P ): all traffic flow destination nodes arelocated in the same orbit portion. For Scenarios 1 and2, 1P means to use the configurations named R1-R3
and R1-R5, respectively.2) Two consecutive portions (2CP ): all traffic flow
destination nodes are located in two consecutive orbitportions. For Scenarios 1 and 2, 2CP means to use theconfigurations named R1-R3-R5-R7 andR1-R5-R9-R15, respectively.
3) Two not consecutive portions (2NCP ): all trafficflow destination nodes are located in two notconsecutive orbit portions (in our scenarios they areopposite portions). For Scenarios 1 and 2, 2NCPmeans to use the configurations namedR1-R3-R9-R11 and R1-R5-R17-R21, respectively.
4) All portions (AP ): the traffic flow destination nodesare equally distributed among all orbit portions. ForScenarios 1 and 2, AP means to use the configurationsnamed R1-R5-R9-R13 and R1-R9-R17-R25,respectively.
Tables from II to V show that, for all scenarios, allbundles generation functions, and all network loadconfigurations, HotSel outperforms both Static and RandomChoice selections.
Table II: ADT [s] with uniform bundle generation function.
1P 2CP 2NCP AP
Static Choice 4 648 4 648 4 648 1 961
Scenario 1 Random Choice 3 693 4 315 4 316 4 009
HotSel 3 421 3 800 3 413 1 961
Static Choice 2 388 2 388 2 388 894
Scenario 2 Random Choice 2 898 3 182 3 187 2 893
HotSel 1 986 2 195 1 986 894
Table III: ADT [s] with fast start bundle generation function.
1P 2CP 2NCP AP
Static Choice 4 867 4 866 4 866 2 163
Scenario 1 Random Choice 3 306 4 513 4 469 4 120
HotSel 3 093 3 674 3 092 2 163
Static Choice 2 607 2 607 2 607 1 104
Scenario 2 Random Choice 2 813 3 437 3 411 3 045
HotSel 1 999 2 289 2 004 1 104
Table IV: ADT [s] with slow start bundle generation function.
1P 2CP 2NCP AP
Static Choice 5 669 5 669 5 669 3 008
Scenario 1 Random Choice 4 172 5 328 5 312 4 999
HotSel 3 988 4 461 3 927 3 008
Static Choice 2 789 2 789 2 789 1 307
Scenario 2 Random Choice 3 027 3 612 3 604 3 294
HotSel 2 203 2 482 2 216 1 307
Table V: ADT [s] with On/Off bundle generation function.
1P 2CP 2NCP AP
Static Choice 4 673 4 673 4 673 1 970
Scenario 1 Random Choice 3 543 4 299 4 289 3 981
HotSel 3 434 3 823 3 436 1 970
Static Choice 2 413 2 413 2 413 910
Scenario 2 Random Choice 2 836 3 182 3 187 2 893
HotSel 2 024 2 220 2 024 910
The performance got by HotSel is very good for tworeasons: 1) when the “nearest” hot spot to the destinationcold spot is congestion free, HotSel chooses this hot spot; 2)if there is a congestion situation at the “nearest” hot spot tothe destination cold spot, HotSel can upload on nanosatellitesbundles belonging to all traffic flows through all hot spots, soincreasing the amount of data carried by each nanosatelliteduring each orbit. This obviously cannot be done both byStatic and by Random choice.
Tables from II to V also highlight that in simulations 1P ,2CP , and 2NCP of Scenario 1, the worst performance isprovided by Static Choice, while, for the same situations ofScenario 2, the worst result is got by Random Choice. Thereason of this behaviour is that also Random Choice can takeadvantage of the possibility to upload on nanosatellites bundlesthrough all hot spots, but the choice is not smart. On onehand, the amount of data destined to the same destination nodethat each nanosatellite can upload during each orbit is largerthan the one available by using the Static Choice, on the otherhand Random Choice does not choose the “nearest” hot spotto the destination cold spot whenever possible, so nullifyingthe larger amount of available data.
In all cases, Random Choice does not take the optimalchoice for all bundles and does not consider the presence ofcongestion situations, so it always offers worse performancethan HotSel. Static Choice provides excellent performancewhen the destination nodes are equally distributed among theorbit portions (AP ) but it is inefficient in all otherdistribution cases.
The mean overall performance increase offered by HotSelcompared with Static and Random Choice for the different

10
load configurations is shown in percentage in Table VI.
Table VI: Percentage performance increase by using HotSelcompared with Static and Random Choice.
1P 2CP 2NCP AP
Static Choice 25% 15% 25% 0%
Random Choice 17% 23% 31% 56%
A real scenario can be seen as a sequence of time intervalsof different length in which load configurations changeunpredictably. To simulate this, we have performed 50simulations where 10 traffic flows send bundles to ruralnodes. Each flow consists of 500 bundles sent one persecond. The tests have been repeated also for flowscomposed of 1 000, 1 500, and 2 000 bundles but the trend ofthe results does not change. For the sake of simplicity weshow only the 500 bundles results. Each destination ischosen randomly, changing the seed of the random variablein each simulation. Also the starting time of each flow ischosen randomly in the time interval between 0 and 1 000 s.ADTs are shown in Table VII for the two used scenarios andthe different selection schemes.
Table VII: ADT [s], destination rural nodes chosen randomly
Static Choice Random Choice HotSel
Scenario 1 12 000 8 940 7 600
Scenario 2 5 500 5 430 3 750
HotSel outperforms both Static and Random Choice. Thepercentage gain concerning the ADT provided by HotSel is:37% compared with Static Choice, and 15% compared withRandom Choice for Scenario 1; 32% compared with StaticChoice, and 30% compared with Random Choice forScenario 2. Even if these percentages are objectivelymeaningful and the improvement clear, it is important topractically evidence the advantage of using HotSel: inScenario 1 the ADTs passes from 12 000 s (3 hours and 20minutes) for the Static Choice and from 8 940 s (2 hours and29 minutes) for the Random Choice to 7 600 s (about 2hours and 6 minutes). Even if the order of magnitude of allthese numerical values (that, moreover, do not includeforward delays) are not compatible with regular Internetbrowsing, “saving” 1 hour and 24 minutes in a case and 23minutes in the second case may be meaningful if a dataexchange is on. I could get important news minutes before,or get information, for example, to repair a given tool ormonitor a parameter minutes before, so saving time and,probably, money. Similar comments may be reported forScenario 2 where the delay passes from 5 500 s for the StaticChoice and slightly less for the Random Choice to 3 750 sprovided by HotSel. Again more than 1 hour to get data isnot compatible with regular web browsing but the “half anhour gain” provided by HotSel may be very useful for many
practical applications. To get lower delay values is necessaryto increase the satellite transmission rate as well as thenumber of nanosatellites and hot spots, as shown in theremainder of the paper.
B. Increasing the satellite transmission rate
Table VIII shows the ADT values for HotSel as in TableII (uniform distribution) but by setting uplink and downlinktransmission rate to 1, 2, 5, and 10 Mbps.
Table VIII: ADT [s] with different satellite transmission rate
1P 2CP 2NCP AP
1 Mbps Scenario 1 2 302 2 302 2 302 935
Scenario 2 1 344 1 344 1 344 508
2 Mbps Scenario 1 1 241 1 241 1 241 403
Scenario 2 812 812 812 242
5 Mbps Scenario 1 705 705 705 374
Scenario 2 542 542 542 213
10 Mbps Scenario 1 696 696 696 364
Scenario 2 532 532 532 203
Looking at the values got through a transmission rate of 5and 10 Mbps in Scenario 2 suggests that the increase of thebandwidth together with the number of nanosatellites, hotspots, and cold spots could help get delay values almostcompatible with Internet web browsing.
Of course, increasing the transmission rate and keepingfixed the load, the “nearest” hot spot to the destination coldspots is always congestion free and HotSel always choosesthis hot spot. So the performance of HotSel and StaticChoice are completely overlapped. The performance of theRandom Choice ranges from about 3 200 s to 2 184 s (gotfor 10 Mbps, Scenario 2, AP).
C. Increasing the number of nanosatellites and hot spots
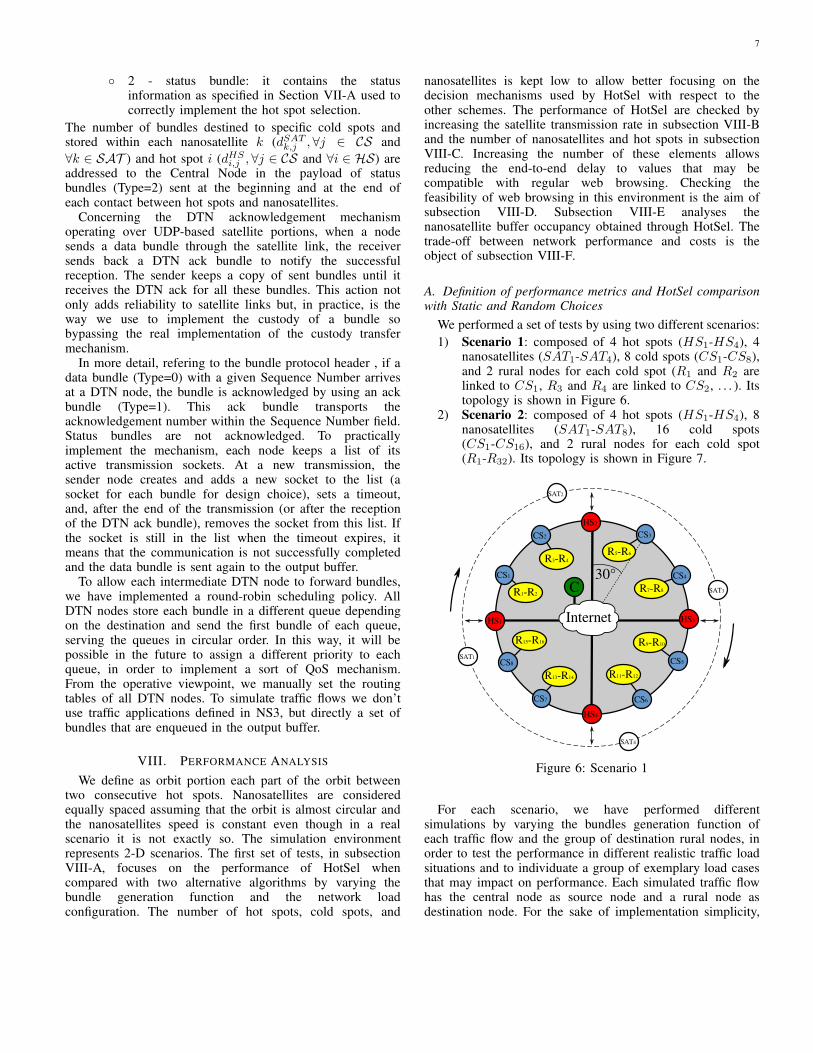
Figure 8 shows the behaviour of the delivery time byvarying the number of employed nanosatellites and hot spotsbut keeping constant the traffic load configuration andgeneration function (8 cold spots, 8 traffic flows of 1000bundles each, 8 different destination rural areas, uniformtraffic generation function).
Raising the nanosatellite and hot spot number, theperformance improves. This is true because increasing thenumber of nanosatellites2, the distance between twoconsecutive nanosatellites decreases, and increasing thenumber of hot spots, the amount of data that can beuploaded on nanosatellites during each orbit grows up. Forexample, setting to 4 the nanosatellite number and changingthe hot spot number from 1 to 5 the percentage performance
2Multiple orbital planes are not considered in this paper. Increasing thenumber of nanosatellites means having more satellites within the same orbit.
11
Nanosatellites2 4 6 8 10 12 14 16 18
Ave
rage
Del
iver
y T
ime
[s]
x 104
0
1
2
3
4
5
6
7
81 HS2 HS3 HS4 HS5 HS
-80%
-82%-81%
-21%
-10%
1
(a)
Nanosatellites2 4 6 8 10 12 14 16 18
Ave
rage
Del
iver
y T
ime
[s]
0
2
4
6
8
10
12
146 HS7 HS8 HS9 HS10 HS
x 103
-34%
-36%-36%
-25%-7%
1
(b)
Figure 8: ADT varying the nanosatellites number from 1 to 18 and hot spots number from 1 to 5 (a) and from 6 to 10 (b)
improvement is about 80% (i.e. the percentage variation is-80%); setting to 1 the hot spot number and changing thenanosatellite number from 6 to 8, the percentageperformance improvement is 21%, as highlighted through thefirst two ellipses of Figure 8(a). The obtained ADT reductionfixing the hot spot number and varying the number ofnanosatellites from 1 to 18 is about 92%, while fixing thenanosatellites number and varying the number of hot spotsfrom 1 to 10 is about 88%. Figure 8 also highlights thatincreasing the number of hot spots the percentage variationremains almost constant independently on the nanosatellitenumber: increasing the number of hot spots from 1 to 5 thepercentage performance increase is always about 80% byusing a different number of nanosatellites. The cases for 4,10, and 18 nanosatellites are evidenced in Figure 8(a)through vertical ellipses. Similarly, increasing the number ofhot spots from 6 to 10 the percentage performance increaseis about 35% independently of the number of usednanosatellites, as evidenced by the vertical ellipses in Figure8(b), again for 4, 10, and 18 nanosatellites. Equivalently,augmenting the number of nanosatellites, the percentagevariation is almost constant independently on the hot spotnumber: increasing the number of nanosatellites from 6 to 8the percentage performance increase by using 1 and 6 hotspots, respectively, is very similar (21% and 25%), asevidenced in Figures 8(a) and 8(b) through horizontalellipses. The same behaviour may be detected by changingthe number of nanosatellites from 14 to 16 in the samefigures.
D. Quality of Service versus Quality of Experience for possibleInternet web browsing
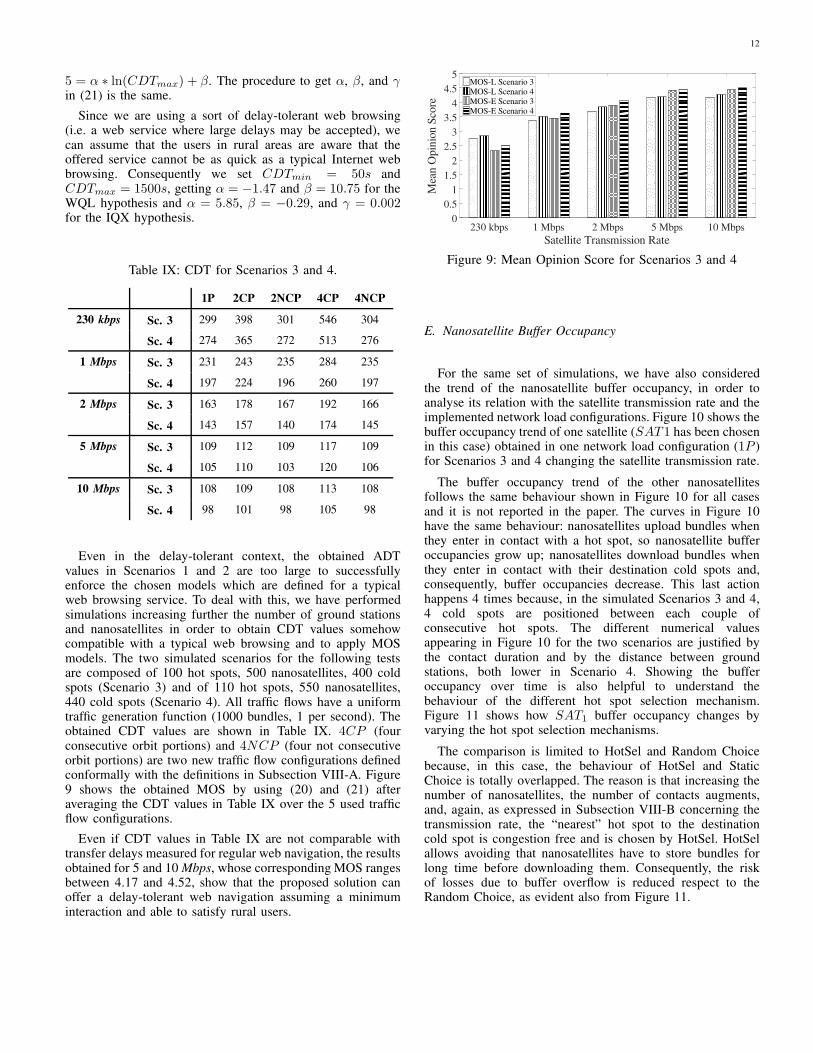
In order to exploit the increase of transmission rate,number of nanosatellites, hotspots, and cold spots and tocheck the feasibility of regular web browsing throughHotSel, we show the obtained performance results in termsof Mean Opinion Score (MOS). In this way, we provide aview of the performance advantages not only in terms of an
objective Quality of Service (QoS) parameter (ADT), butalso in terms of Quality of Experience (QoE). The resultsshown in the previous paragraphs only consider the one waydelivery time on the backward path (from the Internet to therural areas). The time values considered for the MOS resultsalso include an estimation of the time required on theforward path (from the Internet to the rural areas) to deliverthe rural user requests. This estimation depends on thenumber of satellites and ground stations in the network andon the consideration that the request size is much smallerthan the response one. As a consequence, all waiting requestsin the cold spot buffer will be uploaded on the first satellitein contact and will be downloaded to the first hot spot alongthe satellite path. The Complete Delivery Time (CDT) usedas input to the QoE model is defined in (19).
CDT = ADT + 2 ∗W
NSAT
+W
NHS
(19)
where W , NSAT , and NHS , as defined in Section V, are,respectively, the orbit time, the number of nanosatellites, andthe number of hot spots.
As described in [43], there are several models to map userwaiting times over the QoE for web services. The first model(MOS-L) we use is based on the WQL hypothesis [44]where the relation QoE-QoS is given by the Weber-FechnerLaw (WFL) [45]:
MOS(CDT ) = α ∗ ln(CDT ) + β (20)
The second model is based on the IQX hypothesis [46]. Theformula which describes the QoE-QoS relation is:
MOS(CDT ) = α ∗ e−γ∗CDT + β (21)
Values α and β in (20) can be computed, as indicated in[47], by setting the minimum (CDTmin) and maximum(CDTmax) CDT values respectively corresponding toMOS = 5 and MOS = 0. In practice, solving the systemcomposed of the two equations: 0 = α ∗ ln(CDTmin) + β;
12
5 = α ∗ ln(CDTmax) + β. The procedure to get α, β, and γin (21) is the same.
Since we are using a sort of delay-tolerant web browsing(i.e. a web service where large delays may be accepted), wecan assume that the users in rural areas are aware that theoffered service cannot be as quick as a typical Internet webbrowsing. Consequently we set CDTmin = 50s andCDTmax = 1500s, getting α = −1.47 and β = 10.75 for theWQL hypothesis and α = 5.85, β = −0.29, and γ = 0.002for the IQX hypothesis.
Table IX: CDT for Scenarios 3 and 4.
1P 2CP 2NCP 4CP 4NCP
230 kbps Sc. 3 299 398 301 546 304
Sc. 4 274 365 272 513 276
1 Mbps Sc. 3 231 243 235 284 235
Sc. 4 197 224 196 260 197
2 Mbps Sc. 3 163 178 167 192 166
Sc. 4 143 157 140 174 145
5 Mbps Sc. 3 109 112 109 117 109
Sc. 4 105 110 103 120 106
10 Mbps Sc. 3 108 109 108 113 108
Sc. 4 98 101 98 105 98
Even in the delay-tolerant context, the obtained ADTvalues in Scenarios 1 and 2 are too large to successfullyenforce the chosen models which are defined for a typicalweb browsing service. To deal with this, we have performedsimulations increasing further the number of ground stationsand nanosatellites in order to obtain CDT values somehowcompatible with a typical web browsing and to apply MOSmodels. The two simulated scenarios for the following testsare composed of 100 hot spots, 500 nanosatellites, 400 coldspots (Scenario 3) and of 110 hot spots, 550 nanosatellites,440 cold spots (Scenario 4). All traffic flows have a uniformtraffic generation function (1000 bundles, 1 per second). Theobtained CDT values are shown in Table IX. 4CP (fourconsecutive orbit portions) and 4NCP (four not consecutiveorbit portions) are two new traffic flow configurations definedconformally with the definitions in Subsection VIII-A. Figure9 shows the obtained MOS by using (20) and (21) afteraveraging the CDT values in Table IX over the 5 used trafficflow configurations.
Even if CDT values in Table IX are not comparable withtransfer delays measured for regular web navigation, the resultsobtained for 5 and 10 Mbps, whose corresponding MOS rangesbetween 4.17 and 4.52, show that the proposed solution canoffer a delay-tolerant web navigation assuming a minimuminteraction and able to satisfy rural users.
230 kbps 1 Mbps 2 Mbps 5 Mbps 10 Mbps
Satellite Transmission Rate
0
0.5
1
1.5
2
2.5
3
3.5
4
4.5
5
Mea
n O
pin
ion S
core
MOS-L Scenario 3MOS-L Scenario 4MOS-E Scenario 3MOS-E Scenario 4
Figure 9: Mean Opinion Score for Scenarios 3 and 4
E. Nanosatellite Buffer Occupancy
For the same set of simulations, we have also consideredthe trend of the nanosatellite buffer occupancy, in order toanalyse its relation with the satellite transmission rate and theimplemented network load configurations. Figure 10 shows thebuffer occupancy trend of one satellite (SAT 1 has been chosenin this case) obtained in one network load configuration (1P )for Scenarios 3 and 4 changing the satellite transmission rate.
The buffer occupancy trend of the other nanosatellitesfollows the same behaviour shown in Figure 10 for all casesand it is not reported in the paper. The curves in Figure 10have the same behaviour: nanosatellites upload bundles whenthey enter in contact with a hot spot, so nanosatellite bufferoccupancies grow up; nanosatellites download bundles whenthey enter in contact with their destination cold spots and,consequently, buffer occupancies decrease. This last actionhappens 4 times because, in the simulated Scenarios 3 and 4,4 cold spots are positioned between each couple ofconsecutive hot spots. The different numerical valuesappearing in Figure 10 for the two scenarios are justified bythe contact duration and by the distance between groundstations, both lower in Scenario 4. Showing the bufferoccupancy over time is also helpful to understand thebehaviour of the different hot spot selection mechanism.Figure 11 shows how SAT1 buffer occupancy changes byvarying the hot spot selection mechanisms.
The comparison is limited to HotSel and Random Choicebecause, in this case, the behaviour of HotSel and StaticChoice is totally overlapped. The reason is that increasing thenumber of nanosatellites, the number of contacts augments,and, again, as expressed in Subsection VIII-B concerning thetransmission rate, the “nearest” hot spot to the destinationcold spot is congestion free and is chosen by HotSel. HotSelallows avoiding that nanosatellites have to store bundles forlong time before downloading them. Consequently, the riskof losses due to buffer overflow is reduced respect to theRandom Choice, as evident also from Figure 11.

13
0 50 100 150 200 250 300Time [s]
0
200
400
600
800S
AT
1 B
uff
er O
ccup
ancy
[k
B]
Scenario 3Scenario 4
(a) 230 kbps
0 50 100 150 200 250 300Time [s]
0
500
1000
1500
2000
2500
3000
SA
T 1
Buff
er O
ccup
ancy
[k
B]
Scenario 3Scenario 4
(b) 1 Mbps
0 50 100 150 200 250 300Time [s]
0
1000
2000
3000
4000
5000
6000
SA
T 1
Buff
er O
ccup
ancy
[k
B]
Scenario 3Scenario 4
(c) 2 Mbps
0 50 100 150 200 250 300Time [s]
0
2500
5000
7500
10000
12500
15000
SA
T 1
Buff
er O
cup
ancy
[k
B]
Scenario 3Scenario 4
(d) 5 Mbps
0 50 100 150 200 250 300Time [s]
0
2500
5000
7500
10000
12500
15000
SA
T 1
Buff
er O
ccup
ancy
[k
B]
Scenario 3Scenario 4
(e) 10 Mbps
Figure 10: SAT1 buffer occupancy trend by varying satellite transmission rate for Scenarios 3 and 4
0 500 1000 1500 2000 2500
Time [s]
0
100
200
300
400
500
600
700
SA
T 1
Buff
er O
ccup
ancy
[k
B] Static Choice
Random ChoiceHotSel
Figure 11: SAT1 buffer occupancy trend by varying the hotspot selection mechanism in Scenario 3
F. Network performance versus costs
From the practical viewpoint it is important to evaluate thetrade-off between network performance and costs.
The employment and operating cost of a network with agiven number of hot spots (NHS), cold spots (NCS , as definedin Section V), and nanosatellites (NSAT ) is computed as:
C = (NHS +NCS) · CGS +NSAT · CA,SAT +⌈
NSAT
3
⌉
· CL,3SAT + COpy · Ly (22)
CGS is the estimated cost per ground station; CA,SAT is theestimated assembly cost per nanosatellite; CL,3SAT is theestimated launch cost for a group of three nanosatellites;COpy is the operating cost per year and Ly is the networklifetime. Referring to [48], these costs are: CGS = 2 000 $,CA,SAT = 100 000 $, CL,3SAT = 200 000 $, andCOpy = 1 000 000 $ with a network lifetime of 5 years. [48]considers an uplink/downlink transmission rate of 230 kbps.All user cost parameters are referred to it. Changing thetransmission rate implies changing the mentioned cost values
and the numerical results reported in the remainder of thepaper.
In this way, it is possible to compute how much money isneeded to invest in order to deploy and maintain ananosatellite-DTN network also depending on the level ofperformance provided to rural users in terms of delivery time.
We have simulated a set of scenarios with a fixed numberof rural areas and traffic flows (both set to 8), an increasingnumber of hot spots (from 1 to 10), and an increasingnumber of nanosatellites (from 1 to 18), conformally withFigure 8. Figure 12 shows the cost related to the optimalnetwork configuration necessary to keep the delivery timeunder a chosen threshold. The optimal configuration iscomputed as the minimum number of nanosatellites N∗
SAT
and hot spots N∗HS so that C in (22) is minimized:
(N∗SAT , N
∗HS) = argmin
(NSAT ,NHS)
C. (23)
Average Delivery Time [s]
x 103
2 4 6 8 10 12 14 16 18 20
Net
wor
k c
ost
[$
]
x 106
5
5.5
6
6.5
7
7.5
configurationOther configurations: (18,10); (12,3); (8,2); (5,3); (3,10);.....
configurationOther configurations: (18,10); (14,9); (9,8);.....
configurationOther configurations: (18,10); (14,6); (11,5); (6,10);.....
Best
Best
Best
N*SAT , N
* HS : (8,10)( )
: (4,8)
: (2,5)
N*SAT , N
* HS( )
N*SAT , N
* HS( )
1
Figure 12: Relationship between ADT and network cost
A practical impact: the overall cost to get a delivery time of
14
8 000 s is $5.4 million, assured by the optimal configuration(2,5), as shown in Figure 12. A delivery time of about 2 500 srequires about $5.8 million, and a delivery time of about 700s requires about $7.5 million. The cost needed to guaranteelower delivery times such as the ones obtained for Scenarios 3and (corresponding CDT values are shown in the first two linesof Table IX) 4 are of about $90 and $98 million, respectively.
IX. CONCLUSIONS
In this paper we have presented “gRANteD”: a novelNanosatellite-DTN architecture aimed at extending networkaccess to rural and remote areas ensuring a transparentcommunication among TCP/IP endpoints.
gRANteD includes “HotSel”, a hot spot selection algorithmthat minimizes the delivery time of data in a nanosatellite-DTNnetwork.
The obtained results show that, when there are congestionsituations in hot spots, HotSel reduces the bundle deliverytime in all the simulated scenarios and traffic flowconfigurations with respect to two other test mechanisms:static and random selection. The results show that more thedestination rural nodes are concentrated in adjacent areas,higher the performance improvement. It is possible to obtaindifferent levels of QoS performance depending on theemployed number of ground stations and nanosatellites andon the uplink/downlink transmission rate. In particular, usinghigher transmission rates together with a large number of hotspots, nanosatellites, and cold spots (as done in Scenarios 3and 4) allows getting Complete Delivery Time values fullycompatible with a delay-tolerant web navigation. To this aim,we have also shown the relation between the obtaineddelivery time and the Mean Opinion Score estimating theuser satisfaction. The relation between the obtainedperformances and the network cost in order to know howmuch money it is necessary to invest to build a networkguaranteeing a delivery time under a fixed and chosenthreshold is also discussed.
REFERENCES
[1] Internet usage statistics. [Online]. Available: http://www.internetworldstats.com/stats.htm
[2] Y. Kawamoto, H. Nishiyama, N. Kato, and N. Kadowaki, “A trafficdistribution technique to minimize packet delivery delay in multilayeredsatellite networks,” IEEE Transactions on Vehicular Technology, vol. 62,no. 7, pp. 3315–3324, 2013.
[3] S. Burleigh, “Nanosatellites for universal network access,” inProceedings of the 2013 ACM MobiCom workshop on Lowest cost
denominator networking for universal access. ACM, 2013, pp. 33–34.
[4] H. Heidt, J. Puig-Suari, A. Moore, S. Nakasuka, and R. J. Twiggs,“Cubesat: A new generation of picosatellite for education and industrylow-cost space experimentation,” in Proceedings of 14th Annual/USU
Conference on Small Satellites, Aug 2000.
[5] C. Caini, H. Cruickshank, S. Farrell, and M. Marchese, “Delay-anddisruption-tolerant networking (dtn): an alternative solution for futuresatellite networking applications,” Proceedings of the IEEE, vol. 99,no. 11, pp. 1980–1997, 2011.
[6] V. Cerf, S. Burleigh, A. Hooke, L. Torgerson, R. Durst, K. Scott, K. Fall,and H. Weiss, “Delay-tolerant networking architecture,” RFC4838,
April, 2007.
[7] K. L. Scott and S. Burleigh, “Bundle protocol specification,” RFC5050,
November, 2007.
[8] A. Doria, M. Uden, and D. P. Pandey, “Providing connectivity to thesaami nomadic community,” in Proceedings of the 2nd Int. Conf. on
Open Collaborative Design for Sustainable Innovation, Dec 2002.
[9] A. S. Pentland, R. Fletcher, and A. Hasson, “Daknet: Rethinkingconnectivity in developing nations,” Computer, vol. 37, no. 1, pp. 78–83, Jan. 2004.
[10] A. Seth, D. Kroeker, M. Zaharia, S. Guo, and S. Keshav, “Low-costcommunication for rural internet kiosks using mechanical backhaul,”in Proceedings of the 12th annual international conference on Mobile
computing and networking. ACM, 2006, pp. 334–345.
[11] B. Raman and K. Chebrolu, “Experiences in using wifi for rural internetin India,” Communications Magazine, IEEE, vol. 45, no. 1, pp. 104–110, 2007.
[12] P. Manzoni, C. T. Calafate, J.-C. Cano, and E. Mota, “Epidgeons:Combining drones and dtns technologies to provide connectivity inremote areas,” in Proceedings of the First Workshop on Micro Aerial
Vehicle Networks, Systems, and Applications for Civilian Use. ACM,2015, pp. 57–58.
[13] A. Galati, T. Bourchas, S. Siby, and S. Mangold, “System architecturefor delay tolerant media distribution for rural south africa,” inProceedings of the 9th ACM international workshop on Wireless
network testbeds, experimental evaluation and characterization. ACM,2014, pp. 65–72.
[14] H. Nishiyama, M. Ito, and N. Kato, “Relay-by-smartphone: realizingmultihop device-to-device communications,” IEEE Communications
Magazine, vol. 52, no. 4, pp. 56–65, 2014.
[15] A. Mori, H. Okada, K. Kobayashi, M. Katayama, and K. Mase,“Construction of a node-combined wireless network for large-scaledisasters,” in Consumer Communications and Networking Conference
(CCNC), 2015 12th Annual IEEE. IEEE, 2015, pp. 219–224.
[16] N. Uchida, N. Kawamura, and Y. Shibata, “Evaluation of cognitivewireless based delay tolerant network for disaster information systemin a rural area,” in Complex, Intelligent, and Software Intensive Systems
(CISIS), 2013 Seventh International Conference on. IEEE, 2013, pp.1–7.
[17] C.-W. Lin, S. S. Abdul, D. L. Clinciu, J. Scholl, X. Jin, H. Lu, S. S.Chen, U. Iqbal, M. J. Heineck, and Y.-C. Li, “Empowering villagedoctors and enhancing rural healthcare using cloud computing in arural area of mainland china,” Computer methods and programs in
biomedicine, vol. 113, no. 2, pp. 585–592, 2014.
[18] M. Barua, X. Liang, R. Lu, and X. S. Shen, “Rcare: Extendingsecure health care to rural area using vanets,” Mobile Networks and
Applications, vol. 19, no. 3, pp. 318–330, 2014.
[19] GAIA. Global access to the internet for all research group. [Online].Available: https://irtf.org/gaia
[20] S. Rushing, “Analyzing ”global access to the internet for all” projects,”Network Architectures and Services, 2016.
[21] Google. Project loon. [Online]. Available: http://www.google.com/loon/
[22] Facebook and partners. Internet.org. [Online]. Available: http://internet.org/
[23] RIFE. architecture for an internet for everybody project. [Online].Available: https://rife-project.eu/about/
[24] ABSOLUTE. Aerial base stations with opportunistic links forunexpected and temporary events project. [Online]. Available:http://www.absolute-project.eu/
[25] Spacex. [Online]. Available: http://www.spacex.com/
[26] Oneweb. [Online]. Available: http://www.oneweb.world/
[27] Iridium. (1998) Iridium global network. [Online]. Available: http://www.iridium.com/About/IridiumGlobalNetwork.aspx
[28] Globalstar. (1991) Globalstar network. [Online]. Available: http://eu.globalstar.com/en/index.php?cid=3300
15
[29] Orbcomm. (1991) Orbcomm networks. [Online]. Available: http://www.orbcomm.com/networks
[30] Iridium. Iridium next. [Online]. Available: https://www.iridium.com/network/iridiumnext
[31] Inmarsat. (1990) Inmarsat satellites. [Online]. Available: http://www.inmarsat.com/about-us/our-satellites
[32] S. C. Burleigh, “Contact graph routing,” 2011.
[33] I. Bisio and M. Marchese, “Satellite earth station (ses) selection methodfor satellite-based sensor networks,” IEEE Communications Letters,vol. 11, no. 12, 2007.
[34] M. Cello, M. Marchese, and F. Patrone, “Hot spot selection inrural access nanosatellite networks,” in Proceedings of the 9th ACM
MobiCom workshop on Challenged networks (CHANTS). ACM, 2014,pp. 69–72.
[35] ——, “Hotsel: A hot spot selection algorithm for internet access in ruralareas through nanosatellite networks,” in Proceedings of the Global
Communications Conference (GLOBECOM). IEEE, 2015, pp. 1–6.
[36] ——, “Satsel: A satellite selection algorithm to reduce delivery timein dtn-nanosatellite networks for internet access in rural areas,” in 8th
Advanced Satellite Multimedia Systems Conference and the 14th Signal
Processing for Space Communications Worksho (ASMS/SPSC), 2016.IEEE, 2016.
[37] ——, “Coldsel: A selection algorithm to mitigate congestion situationsover nanosatellite networks,” in Global Communications Conference
(GLOBECOM), 2016 IEEE. IEEE, 2016.
[38] K. L. Kusza and M. A. Paluszek, “Lower layer protocols forautonomous constellations,” DTIC Document, Tech. Rep., 2000.
[39] A. Houyou, R. Holzer, H. Meer, and M. Heindl, “Performance oftransport layer protocols in leo pico-satellite constellations,” University
of Passau, Passau, Germany, MIP-0502, 2005.
[40] C. Caini, R. Firrincieli, M. Marchese, T. d. Cola, M. Luglio,C. Roseti, N. Celandroni, and F. Potorti, “Transport layer protocols andarchitectures for satellite networks,” International Journal of Satellite
Communications and Networking, vol. 25, no. 1, pp. 1–26, 2007.
[41] J. Lakkakorpi. (2013) Dtn code for ns-2 and ns-3. [Online]. Available:http://www.netlab.tkk.fi/tutkimus/dtn/ns/
[42] G. Araniti, N. Bezirgiannidis, E. Birrane, I. Bisio, S. Burleigh, C. Caini,M. Feldmann, M. Marchese, J. Segui, and K. Suzuki, “Contactgraph routing in dtn space networks: overview, enhancements andperformance,” IEEE Communications Magazine, vol. 53, no. 3, pp. 38–46, 2015.
[43] S. Egger, T. Hossfeld, R. Schatz, and M. Fiedler, “Waiting times inquality of experience for web based services,” in Quality of Multimedia
Experience (QoMEX), 2012 Fourth International Workshop on. IEEE,2012, pp. 86–96.
[44] S. Egger, P. Reichl, T. Hosfeld, and R. Schatz, ““time is bandwidth”?narrowing the gap between subjective time perception and qualityof experience,” in Communications (ICC), 2012 IEEE International
Conference on. IEEE, 2012, pp. 1325–1330.
[45] P. Reichl, S. Egger, R. Schatz, and A. D’Alconzo, “The logarithmicnature of qoe and the role of the weber-fechner law in qoe assessment,”in Communications (ICC), 2010 IEEE International Conference on.IEEE, 2010, pp. 1–5.
[46] M. Fiedler, T. Hossfeld, and P. Tran-Gia, “A generic quantitativerelationship between quality of experience and quality of service,”Network, IEEE, vol. 24, no. 2, pp. 36–41, 2010.
[47] “Estimating end-to-end performance in ip networks for dataapplications,” ITU-T Rec G.1030, Nov. 2005.
[48] S. Burleigh, “Ring road: User application on a high-latency network,”2014.
Mario Marchese
Mario Marchese (S’94–M’97–SM’04) wasborn in Genoa, Italy in 1967. He got his ”Laurea”degree cum laude at the University of Genoa,Italy in 1992, and his Ph.D. (Italian ”Dottoratodi Ricerca”) degree in ”Telecommunications”at the University of Genoa in 1997.From 1999 to January 2005, he worked with theItalian Consortium of Telecommunications (CNIT),by the University of Genoa Research Unit, wherehe was Head of Research. From February 2005 to
January 2016 he was Associate Professor at the University of Genoa. SinceFebruary 2016 he has been Full Professor at the University of Genoa.He was the Chair of the IEEE Satellite and Space CommunicationsTechnical Committee from 2006 to 2008. He is Winner of the IEEEComSoc Award “2008 Satellite Communications Distinguished ServiceAward” in “recognition of significant professional standing and contributionsin the field of satellite communications technology”.He is the author of the book “Quality of Service over HeterogeneousNetworks”, John Wiley & Sons, Chichester, 2007, and author/co-author ofmore than 290 scientific works, including international magazines,international conferences and book chapters.His main research activity concerns: Networking, Quality of Service overHeterogeneous Networks, Software Defined Networking, Satellite DTN andNanosatellite Networks, Networking security.
Fabio Patrone Fabio Patrone was born inGenoa, Italy in 1988. He got his Bachelor Degreein Telecommunication Engineering and his MasterDegree in Telecommunication Engineering in 2013both at the University of Genoa. He got is Ph.D.at the Satellite Communications and NetworkingLaboratory (SCNL) of the University of Genoawith a thesis on routing and scheduling algorithmsin Satellite Delay and Disruption Tolerant Networks(DTNs). He is currently a Post-Doc research fellowat the SCNL. His main research activity concerns
Satellite Networks and DTN networks, in particular design of Routing,Scheduling, and Congestion Control algorithms for Satellite Networks.
Marco Cello Marco Cello gothis ”Laurea Magistrale” (M.Sc.) degree cum laudeand his Ph.D in 2008 and 2012, respectively bothat the University of Genoa. In 2012, 2014 and 2015worked as Post-doc research fellow at Universityof Genoa with a fellowship funded by FondazioneCarige. In 2013 he was Post-Doc research fellowat Polytechnic Institute of New York University andVisiting Research Fellow at New York UniversityAbu Dhabi. He is currently Post-Doc researchfellow at Nokia Bell Labs in Dublin, Ireland. He is
a researcher on networking with almost 8 years of experience, includingmanaging research projects funded by national industries, the EuropeanCommunity and the European Space Agency (ESA). He has strong expertisein software for simulation, Linux-based emulation of telecommunicationnetworks and Linux administration. He is a co-author of over 20 scientificworks, including international journals, conferences and patents. His mainresearch activities concern: online modelling and understanding ofcarrier-grade VM-Based Cloud Services and Software Defined Networks. Hehas also interests in Network Modelling/Teletraffic Engineering and DelayTolerant Networks.