dsn group h1 2016 results update - pt dharma … 2016 dsng presentation.pdfour plantations five-year...
TRANSCRIPT
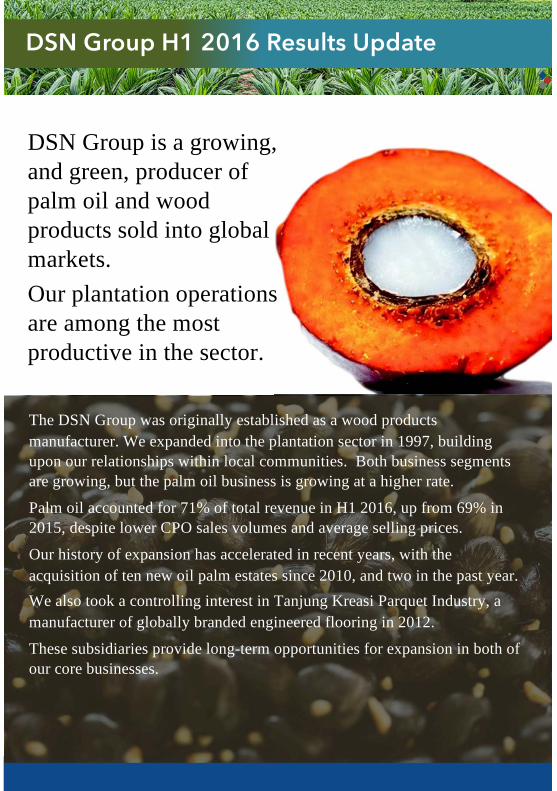
The DSN Group was originally established as a wood products manufacturer. We expanded into the plantation sector in 1997, building upon our relationships within local communities. Both business segments are growing, but the palm oil business is growing at a higher rate.
Palm oil accounted for 71% of total revenue in H1 2016, up from 69% in 2015, despite lower CPO sales volumes and average selling prices.
Our history of expansion has accelerated in recent years, with the acquisition of ten new oil palm estates since 2010, and two in the past year.We also took a controlling interest in Tanjung Kreasi Parquet Industry, a manufacturer of globally branded engineered flooring in 2012.
These subsidiaries provide long-term opportunities for expansion in both of our core businesses.
DSN Group is a growing, and green, producer of palm oil and wood products sold into global markets.Our plantation operations are among the most productive in the sector.
DSN Group H1 2016 Results Update
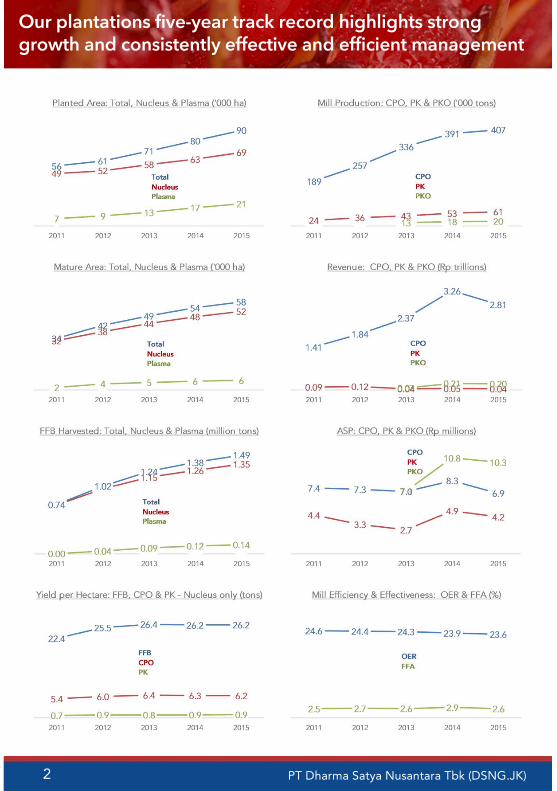
Our plantations five-year track record highlights strong growth and consistently effective and efficient management
PT Dharma Satya Nusantara Tbk (DSNG.JK)2
C. Kal
W. KalE. Kal
N. Kal
1
2
345
6
Our estates are clustered across East, West and Central Kalimantan, with acquisitions AAN & MNS in the West
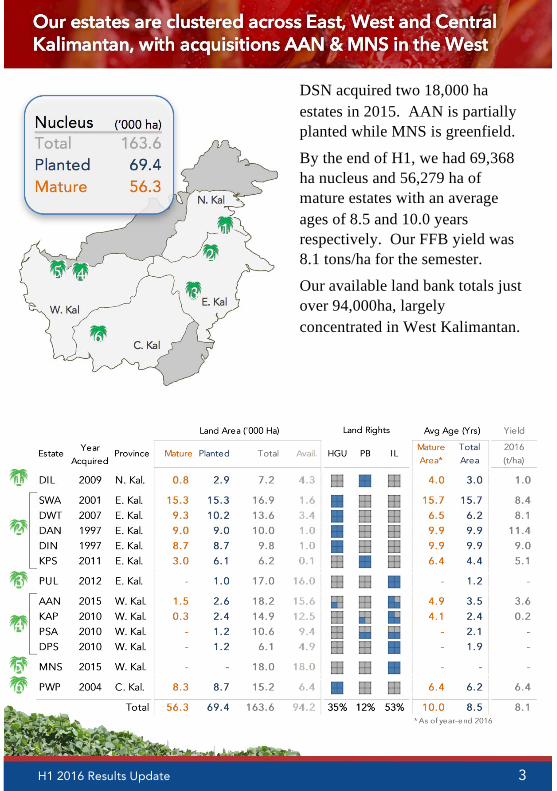
Nucleus (‘000 ha)Total 163.6Planted 69.4Mature 56.3
1
2
3
4
56
DSN acquired two 18,000 ha estates in 2015. AAN is partially planted while MNS is greenfield.
By the end of H1, we had 69,368 ha nucleus and 56,279 ha of mature estates with an average ages of 8.5 and 10.0 years respectively. Our FFB yield was 8.1 tons/ha for the semester.
Our available land bank totals just over 94,000ha, largely concentrated in West Kalimantan.
3H1 2016 Results Update
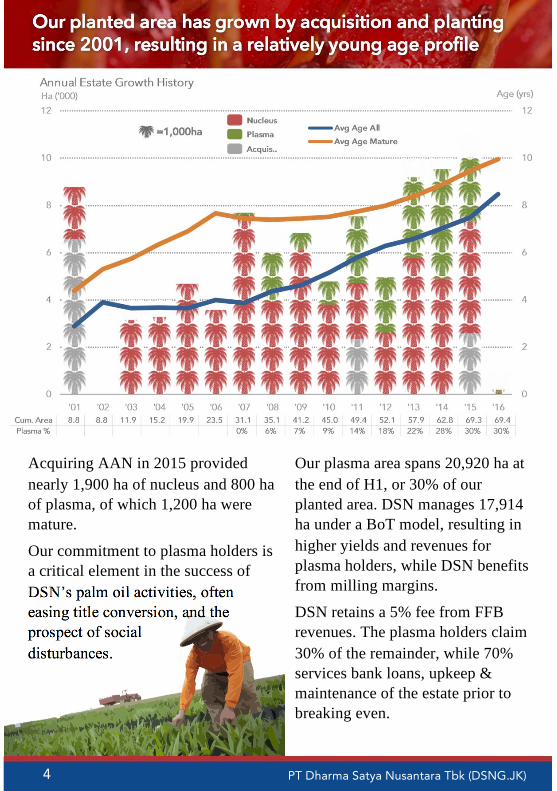
Our plasma area spans 20,920 ha at the end of H1, or 30% of our planted area. DSN manages 17,914 ha under a BoT model, resulting in higher yields and revenues for plasma holders, while DSN benefits from milling margins.
DSN retains a 5% fee from FFB revenues. The plasma holders claim 30% of the remainder, while 70% services bank loans, upkeep & maintenance of the estate prior to breaking even.
4
Acquiring AAN in 2015 provided nearly 1,900 ha of nucleus and 800 ha of plasma, of which 1,200 ha were mature.
Our commitment to plasma holders is a critical element in the success of DSN’s palm oil activities, often easing title conversion, and the prospect of social disturbances.
Our planted area has grown by acquisition and planting since 2001, resulting in a relatively young age profile
PT Dharma Satya Nusantara Tbk (DSNG.JK)
=1,000ha
H1 2016 Results Update
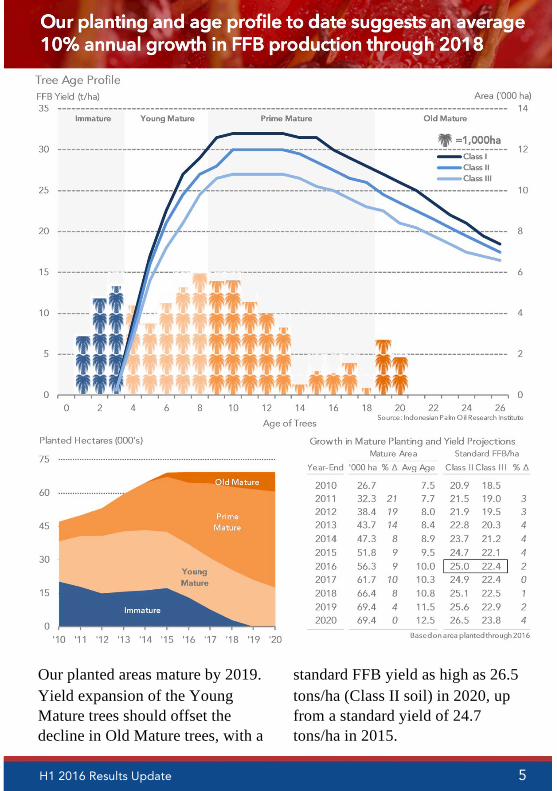
Our planting and age profile to date suggests an average 10% annual growth in FFB production through 2018
Our planted areas mature by 2019. Yield expansion of the Young Mature trees should offset the decline in Old Mature trees, with a
standard FFB yield as high as 26.5 tons/ha (Class II soil) in 2020, up from a standard yield of 24.7 tons/ha in 2015.
5
=1,000ha
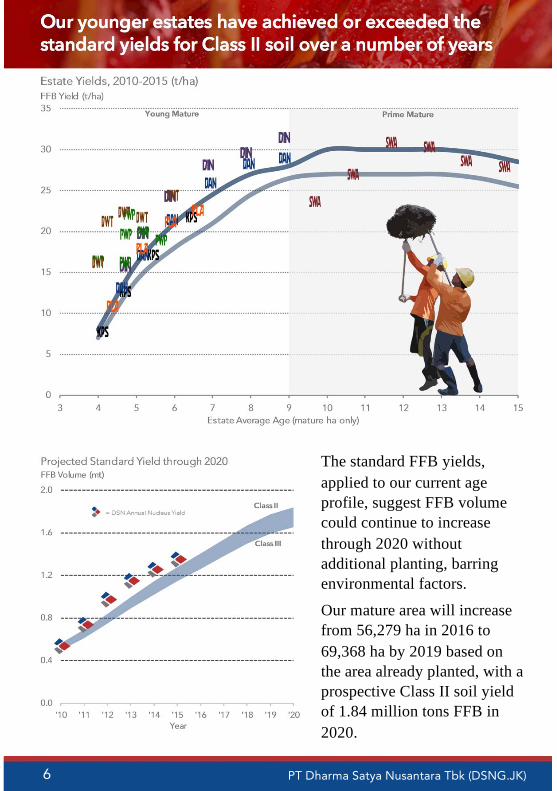
The standard FFB yields, applied to our current age profile, suggest FFB volume could continue to increase through 2020 without additional planting, barring environmental factors.
Our mature area will increase from 56,279 ha in 2016 to 69,368 ha by 2019 based on the area already planted, with a prospective Class II soil yield of 1.84 million tons FFB in 2020.
Our younger estates have achieved or exceeded the standard yields for Class II soil over a number of years
6 PT Dharma Satya Nusantara Tbk (DSNG.JK)
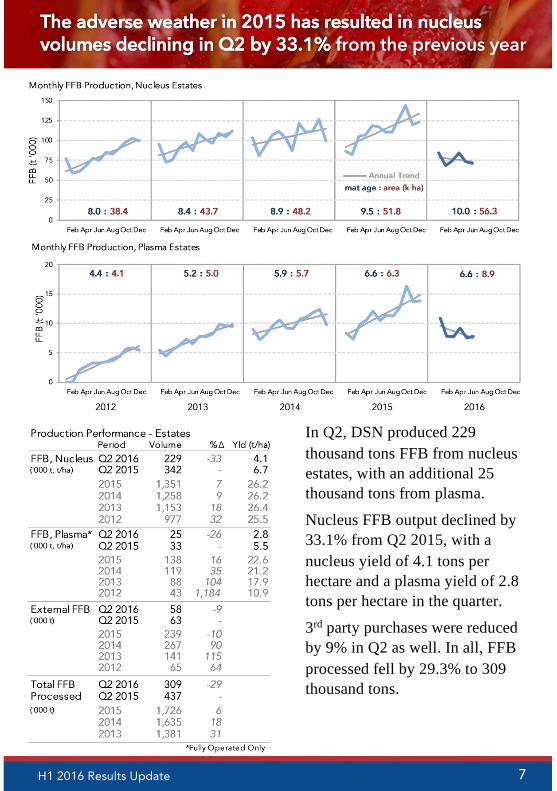
The adverse weather in 2015 has resulted in nucleus volumes declining in Q2 by 33.1% from the previous year
In Q2, DSN produced 229 thousand tons FFB from nucleus estates, with an additional 25 thousand tons from plasma.
Nucleus FFB output declined by 33.1% from Q2 2015, with a nucleus yield of 4.1 tons per hectare and a plasma yield of 2.8 tons per hectare in the quarter.
3rd party purchases were reduced by 9% in Q2 as well. In all, FFB processed fell by 29.3% to 309 thousand tons.
7H1 2016 Results Update
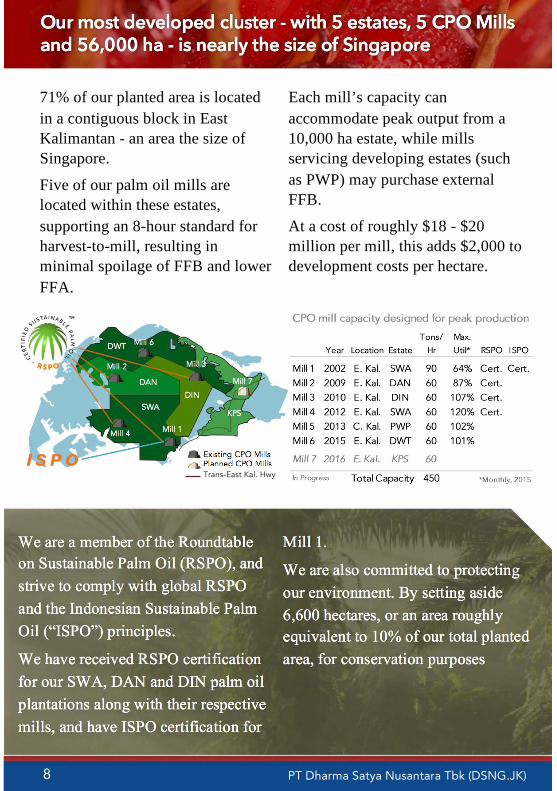
We are a member of the Roundtable on Sustainable Palm Oil (RSPO), and strive to comply with global RSPO and the Indonesian Sustainable Palm Oil (“ISPO”) principles.
We have received RSPO certification for our SWA, DAN and DIN palm oil plantations along with their respective mills, and have ISPO certification for
Mill 1.
We are also committed to protecting our environment. By setting aside 6,600 hectares, or an area roughly equivalent to 10% of our total planted area, for conservation purposes
Our most developed cluster - with 5 estates, 5 CPO Mills and 56,000 ha - is nearly the size of Singapore
71% of our planted area is located in a contiguous block in East Kalimantan - an area the size of Singapore.
Five of our palm oil mills are located within these estates, supporting an 8-hour standard for harvest-to-mill, resulting in minimal spoilage of FFB and lower FFA.
Each mill’s capacity can accommodate peak output from a 10,000 ha estate, while mills servicing developing estates (such as PWP) may purchase external FFB.
At a cost of roughly $18 - $20 million per mill, this adds $2,000 to development costs per hectare.
Mill 6
Mill 7
Mill 3
Mill 1Mill 4
Mill 2
Existing CPO MillsPlanned CPO MillsTrans-East Kal. Hwy
DWT
DINSWA
DAN
KPS
8 PT Dharma Satya Nusantara Tbk (DSNG.JK)
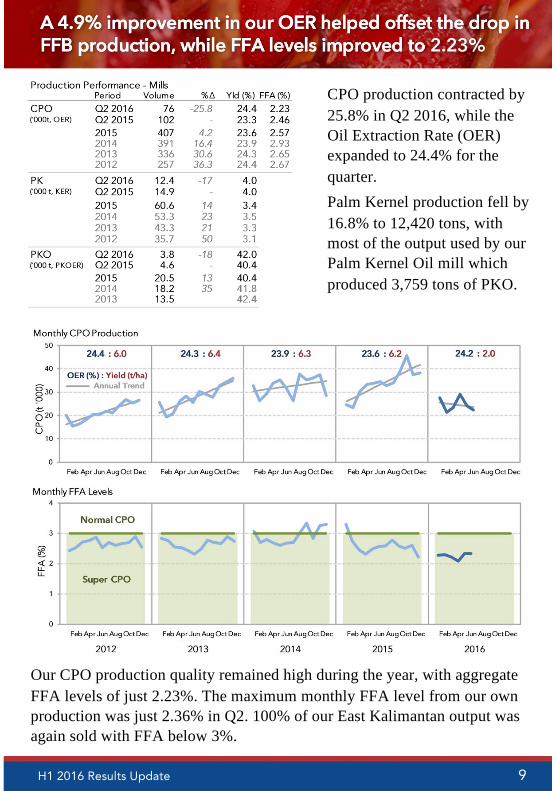
A 4.9% improvement in our OER helped offset the drop in FFB production, while FFA levels improved to 2.23%
CPO production contracted by 25.8% in Q2 2016, while the Oil Extraction Rate (OER) expanded to 24.4% for the quarter. Palm Kernel production fell by 16.8% to 12,420 tons, with most of the output used by our Palm Kernel Oil mill which produced 3,759 tons of PKO.
9
Our CPO production quality remained high during the year, with aggregate FFA levels of just 2.23%. The maximum monthly FFA level from our own production was just 2.36% in Q2. 100% of our East Kalimantan output was again sold with FFA below 3%.
H1 2016 Results Update
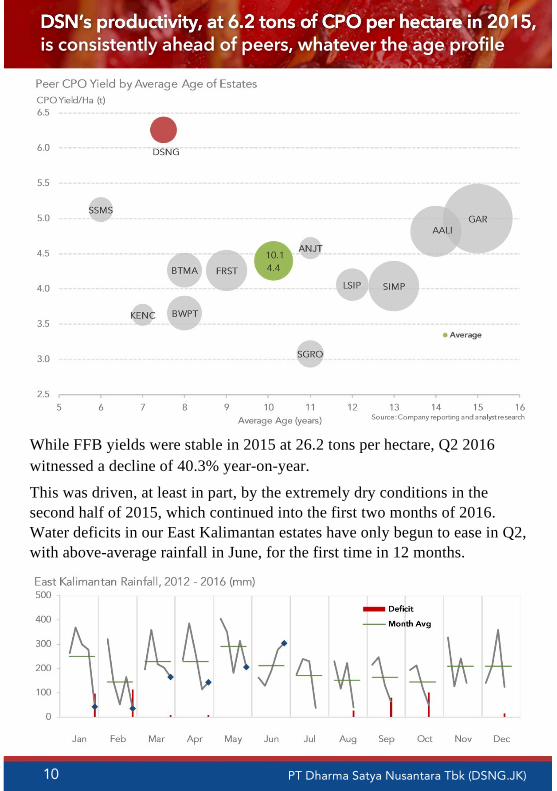
DSN’s productivity, at 6.2 tons of CPO per hectare in 2015, is consistently ahead of peers, whatever the age profile
10 PT Dharma Satya Nusantara Tbk (DSNG.JK)
While FFB yields were stable in 2015 at 26.2 tons per hectare, Q2 2016 witnessed a decline of 40.3% year-on-year.
This was driven, at least in part, by the extremely dry conditions in the second half of 2015, which continued into the first two months of 2016. Water deficits in our East Kalimantan estates have only begun to ease in Q2, with above-average rainfall in June, for the first time in 12 months.
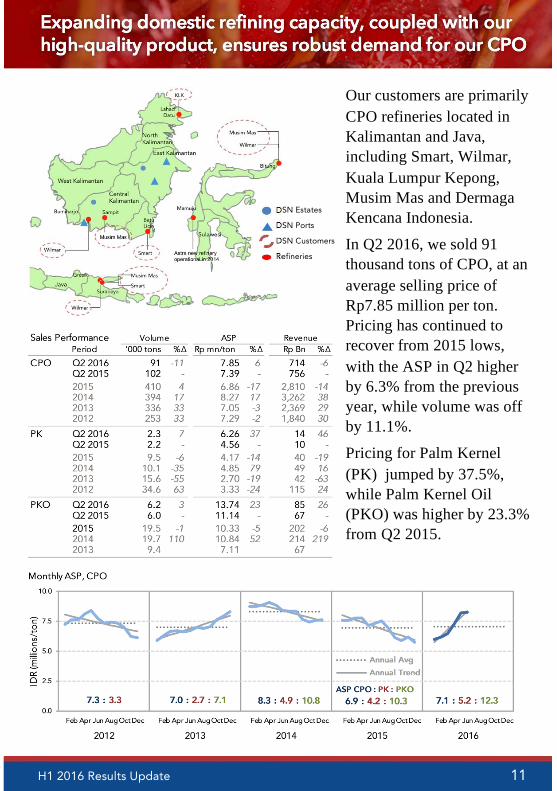
Expanding domestic refining capacity, coupled with our high-quality product, ensures robust demand for our CPO
Our customers are primarily CPO refineries located in Kalimantan and Java, including Smart, Wilmar, Kuala Lumpur Kepong, Musim Mas and DermagaKencana Indonesia.
In Q2 2016, we sold 91 thousand tons of CPO, at an average selling price of Rp7.85 million per ton. Pricing has continued to recover from 2015 lows, with the ASP in Q2 higher by 6.3% from the previous year, while volume was off by 11.1%.
Pricing for Palm Kernel (PK) jumped by 37.5%, while Palm Kernel Oil (PKO) was higher by 23.3% from Q2 2015.
Refineries
DSN Estates
DSN Customers
DSN Ports
11H1 2016 Results Update
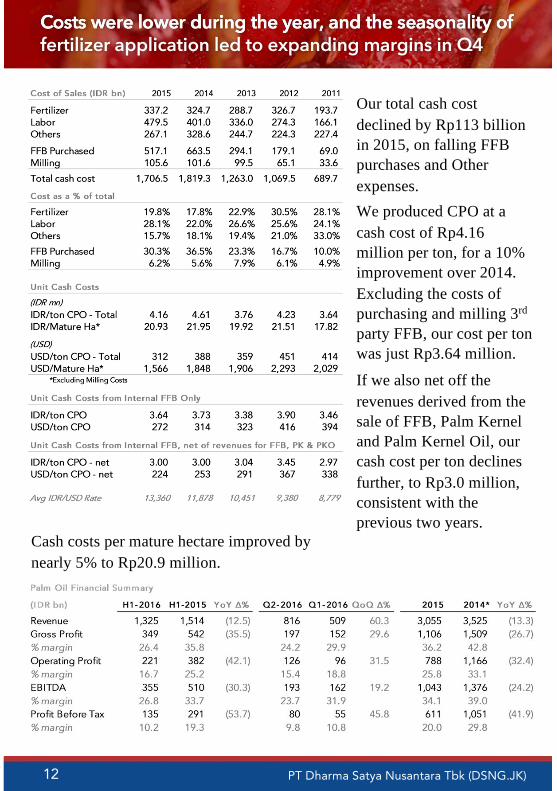
Costs were lower during the year, and the seasonality of fertilizer application led to expanding margins in Q4
12 PT Dharma Satya Nusantara Tbk (DSNG.JK)
Our total cash cost declined by Rp113 billion in 2015, on falling FFB purchases and Other expenses.We produced CPO at a cash cost of Rp4.16 million per ton, for a 10% improvement over 2014. Excluding the costs of purchasing and milling 3rd
party FFB, our cost per ton was just Rp3.64 million.
If we also net off the revenues derived from the sale of FFB, Palm Kernel and Palm Kernel Oil, our cash cost per ton declines further, to Rp3.0 million, consistent with the previous two years.
Cash costs per mature hectare improved by nearly 5% to Rp20.9 million.
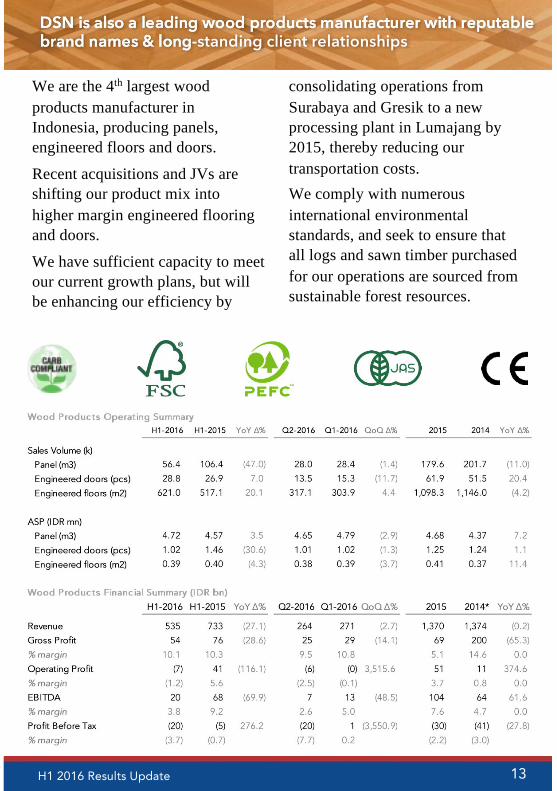
We are the 4th largest wood products manufacturer in Indonesia, producing panels, engineered floors and doors.
Recent acquisitions and JVs are shifting our product mix into higher margin engineered flooring and doors.
We have sufficient capacity to meet our current growth plans, but will be enhancing our efficiency by
consolidating operations from Surabaya and Gresik to a new processing plant in Lumajang by 2015, thereby reducing our transportation costs.We comply with numerous international environmental standards, and seek to ensure that all logs and sawn timber purchased for our operations are sourced from sustainable forest resources.
DSN is also a leading wood products manufacturer with reputable brand names & long-standing client relationships
13H1 2016 Results Update
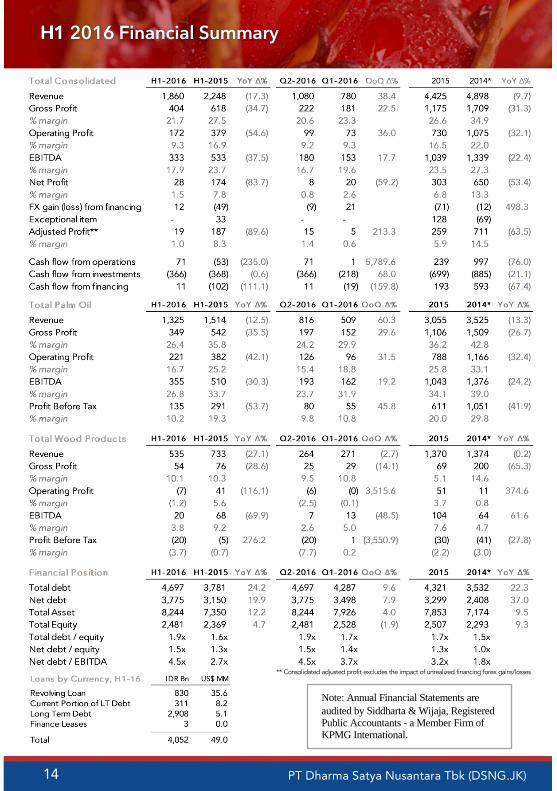
H1 2016 Financial Summary
Note: Annual Financial Statements are audited by Siddharta & Wijaja, Registered Public Accountants - a Member Firm of KPMG International.
14 PT Dharma Satya Nusantara Tbk (DSNG.JK)
** Consolidated adjusted profit excludes the impact of unrealized financing forex gains/losses
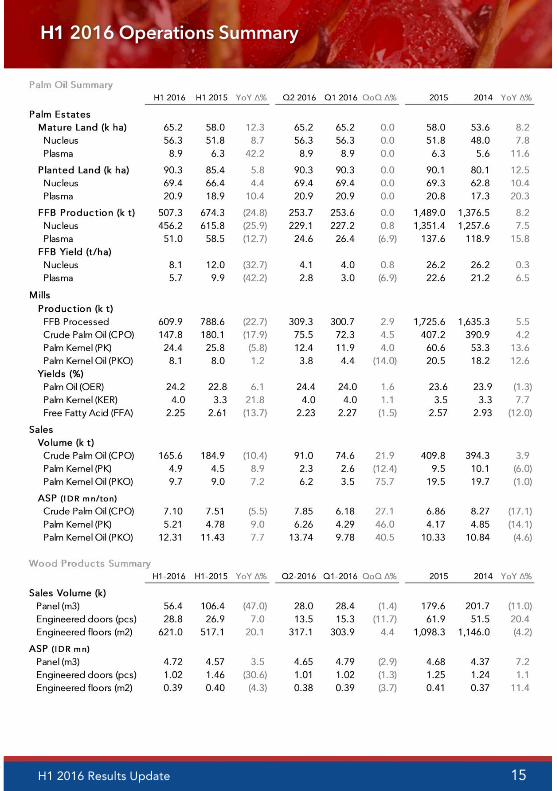
H1 2016 Operations Summary
15H1 2016 Results Update
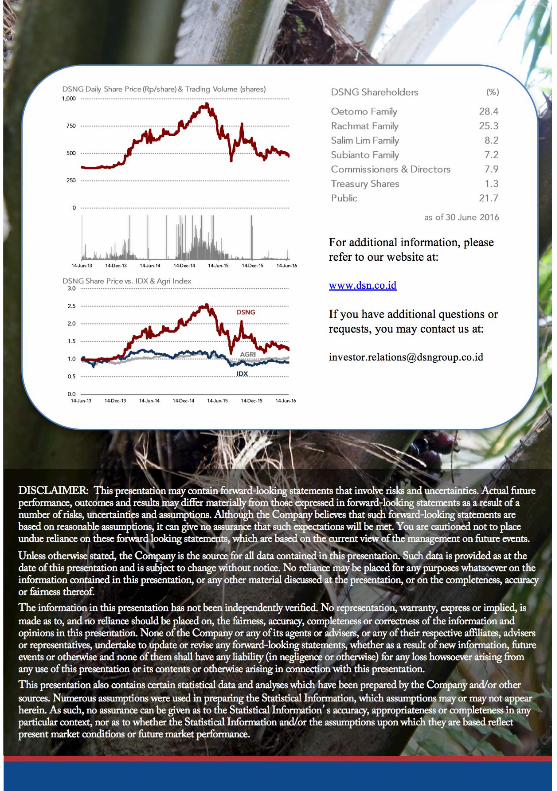
For additional information, please refer to our website at:
www.dsn.co.id
If you have additional questions or requests, you may contact us at:
DISCLAIMER: This presentation may contain forward-looking statements that involve risks and uncertainties. Actual future performance, outcomes and results may differ materially from those expressed in forward-looking statements as a result of a number of risks, uncertainties and assumptions. Although the Company believes that such forward-looking statements are based on reasonable assumptions, it can give no assurance that such expectations will be met. You are cautioned not to place undue reliance on these forward looking statements, which are based on the current view of the management on future events.
Unless otherwise stated, the Company is the source for all data contained in this presentation. Such data is provided as at the date of this presentation and is subject to change without notice. No reliance may be placed for any purposes whatsoever on the information contained in this presentation, or any other material discussed at the presentation, or on the completeness, accuracy or fairness thereof.The information in this presentation has not been independently verified. No representation, warranty, express or implied, ismade as to, and no reliance should be placed on, the fairness, accuracy, completeness or correctness of the information and opinions in this presentation. None of the Company or any of its agents or advisers, or any of their respective affiliates, advisers or representatives, undertake to update or revise any forward-looking statements, whether as a result of new information, futureevents or otherwise and none of them shall have any liability (in negligence or otherwise) for any loss howsoever arising from any use of this presentation or its contents or otherwise arising in connection with this presentation.This presentation also contains certain statistical data and analyses which have been prepared by the Company and/or other sources. Numerous assumptions were used in preparing the Statistical Information, which assumptions may or may not appear herein. As such, no assurance can be given as to the Statistical Information s accuracy, appropriateness or completeness in any particular context, nor as to whether the Statistical Information and/or the assumptions upon which they are based reflect present market conditions or future market performance.