dsl inspector: a tool to measure the quality of service of · pdf filedsl inspector: a tool to...
TRANSCRIPT

DSL Inspector: A Tool to Measure the Quality of Service of the ADSL Line
R A N I N J O U D A
Master of Science Thesis Stockholm, Sweden 2008

DSL Inspector: A Tool to Measure the Quality of Service of the ADSL Line
R A N I N J O U D A
Master’s Thesis in Computer Science (30 ECTS credits) at the School of Computer Science and Engineering Royal Institute of Technology year 2008 Supervisor at CSC was Serafim Dahl Examiner was Stefan Arnborg TRITA-CSC-E 2008:034 ISRN-KTH/CSC/E--08/034--SE ISSN-1653-5715 Royal Institute of Technology School of Computer Science and Communication KTH CSC SE-100 44 Stockholm, Sweden URL: www.csc.kth.se

DSL Inspector: A tool to measure the quality of service of theADSL line
Abstract
ADSL is a growing technology for broadband services. New flavours are developedwith higher bandwidth which generates new services. Services such as triple-play withhigher bandwidth requirements have turned out to be very dependent on the quality ofthe lines. Therefore monitoring quality of services of the lines is becoming more andmore important for providing good services to customers. Operators need an effectiveand precise tool for locating the problems on the lines so that they can suggest solutions.
In this Master of Science thesis we implement a prototype which collects data for dif-ferent parameters along an ADSL-line for Internet operators and analyses the connec-tion on the basis of these. The prototype relies to a high degree on open standards and isimplemented using stable and mature open source software.
The prototype is build according to the client-server model. The client is an online-program which enables operators to log in and submit or display their measurements.The server is a command line program which is running in the background and waits fornew measurements from the client program to be performed.

DSL Inspector: Ett verktyg för att mäta kvalitén på ADSL-linjen
Sammanfattning
ADSL är en växande teknologi för bredbandstjänster. Nya varianter är utvecklade medhögre bandbredd vilket ger möjligheter till att leverera nya tjänster. Tjänster som triple-play med högre krav på bandbredd har visat sig vara mycket beroende av kvalitén pålinjerna. Därför har övervakning av tjänsternas kvalité på linjerna blivit alltmer viktigför att förse kunderna med bra tjänster.Operatörerna behöver ett effektivt och exakt verktyg för att lokalisera de problem somfinns längs med linjerna för att de skall kunna föreslå lösningar.
I detta examensarbete implementerar vi en prototyp som samlar ihop data för olika pa-rametrar från en ADSL-linje och analyserar uppkopplingen på grundval av dessa data.Prototypen byggs till största del på öppna standarder och är implementerad genom attanvända sig av stabil och mogen gratis mjukvara.
Prototypen är byggd enligt klient-server modellen där klienten är ett webbaserat systemsom tillåter operatörerna att logga in i systemet och mata in eller visa sina mätningar.Servern är ett kommandostyrt program som körs i bakgrunden och väntar in nya mät-ningar från klientsystemet för bearbetning.

Preface
The Master Thesis is the last individual project of my education in the M.Sc. ComputerEngineering program at the Royal Institute of Technology, Stockholm.
I would like to thank both my advisors Bandula Vedage, Daniel Tjernberg and the othercolleagues of the DSL-lab at TietoEnator. I would also like to thank my advisor SerafimDahl at KTH, for the support during this Master of Science project.

Contents
1 Introduction ............................................................................................................... 11.1 Problem ............................................................................................................... 11.2 Questions ............................................................................................................ 11.3 Method ................................................................................................................ 2
1.3.1 Requirements ................................................................................................ 21.3.2 Design .......................................................................................................... 21.3.3 Implementation ............................................................................................. 21.3.4 Evaluation .................................................................................................... 3
1.4 Limitations .......................................................................................................... 31.4.1 Project limitations ......................................................................................... 31.4.2 Prototype limitations ..................................................................................... 3
2 Theory ....................................................................................................................... 42.1 DSL Fundamentals .............................................................................................. 42.2 Why DSL Technology ......................................................................................... 42.3 ADSL standards .................................................................................................. 52.4 SNMP ................................................................................................................. 5
2.4.1 The SNMP Protocol...................................................................................... 52.4.2 Managers and Agents ................................................................................... 62.4.3 The Structure of Management Information and MIBs ................................... 7
2.5 ADSL Parameters ................................................................................................ 92.5.1 PM parameters.............................................................................................. 92.5.2 TM parameters ............................................................................................. 9
3 Analysis ................................................................................................................... 113.1 Functionality and usage ..................................................................................... 11
3.1.1 Methodology .............................................................................................. 11Conclusion .......................................................................................................... 11
3.2 Configuring the new server................................................................................ 123.3 Technology platform for server and client applications ...................................... 12
3.3.1 Developing in PHP ..................................................................................... 143.3.2 MySQL Database ....................................................................................... 153.3.3 Apache HTTP server .................................................................................. 153.3.4 JpGraph ...................................................................................................... 15
4 The DSL Inspector prototype ................................................................................... 164.1 Development Environment ................................................................................ 16
4.1.1 Software used on my PC ............................................................................. 164.1.2 Software installed on the Server .................................................................. 16
4.2 Database layer overview .................................................................................... 174.3 Overview of the DSL Inspector functionality ..................................................... 184.4 Collecting and storing parameter’s data ............................................................. 18
4.4.1 Storing the TM parameter data.................................................................... 194.4.2 Storing the PM Parameter data.................................................................... 20
4.4 Extracting parameter’s data and drawing the graphs .......................................... 224.5 Summary of functionality .................................................................................. 24
5 Test and Evaluation of the DSL Inspector Prototype ................................................ 255.1 Testing the prototype ......................................................................................... 255.2 User’s view of the Prototype ............................................................................. 26

5.3 Future Development .......................................................................................... 266 Summary ................................................................................................................. 277 Bibliography ............................................................................................................ 28Appendix A (Overview of the DSL Inspector prototype) ............................................. 29
1 The web client ...................................................................................................... 292 The server program .............................................................................................. 34
Appendix B (Overview of Classes and PHP scripts) .................................................... 35Presentation Layer (PHP & XHTML) ..................................................................... 35Logic layer (PHP) ................................................................................................... 37Data Layer (PHP & SQL)........................................................................................ 39
Appendix C (A final report generated by DSL Inspector) ............................................ 40

Glossary
ADSL Asymmetrical Digital Subscriber LineCPE Customer Premises Equipment (in this case DSL modem)DSLAM Digital Subscriber Line Access MultiplexerFreeBSD An Open Source variant of the BSD operating system. BSD is a variation
of the UNIX operating system.GUI Graphical User Interface.HDSL High Bit-rate Digital Subscriber LineITU International Telecommunication Union.MDF Main Distribution Frame. A wiring arrangement which connects the tele-
phone lines coming from outside on one side and the internal lines on theother.
MIB Management information block. Part of the SNMP specificationMySQL An open source relational database management system that uses Struc-
tured Query Language (SQL).NMS Network management station, where the SNMP applications run in.OID Object Identifiers are strings of numbers organized in a hierarchical fa-
shion.PHP A scripting language used to create database interactivity and dynamic
content on the web.QoS Quality of service.SNMP Simple Network Management Protocol.xDSL Refers to the family of digital subscriber line technologies, such as ADSL,
HDSL, and RADSLVDSL Very High Bit-rate Digital Subscriber Line
1
1 Introduction
This master’s project was performed at the DSL lab at TietoEnator. The DSL labteam offers their clients a high-tech lab environment for testing, evaluation andvalidation of various DSL systems and equipments. Additionally, the team offersconsulting within the areas of management, support, documentation and evalua-tion of DSL systems.
The DSL team has had some old ADSL measuring tools before which were partlyworking. Those tools didn’t really fulfil the task of measuring different kinds ofADSL parameters. Therefore, the DSL team launched this project to build a newtool/prototype which could pave the way for developing a better and more reliableADSL measuring tool.
1.1 Problem
The project focused on building a tool with a relatively easy-to-use user interface.The main and heavy work should be done behind the scenes by some kind ofserver program. The operator’s main task is to submit the right configuration forhis measurement of the ADSL-line according to a simple manual for the tool.
Rather than using one instance of the program running on a single machine, whichwould only allow one operator at a time using the program. A web client shouldbe created. This web client will be available to everyone in the team to use any-time they want. However, the embedded security policy of the company in formof firewalls prevents any access to the web client from outside the DSL lab do-main, so a customized secure HTTP connection to the web client is not needed.
The tool should collect data of different ADSL-parameters and analyze the copperline on the basis of these. This would serve two purposes. The first one is to drawgraphical diagrams of the collected data over a period of time for the measuredADSL line. Those diagrams will show if there was any distortion on the line dur-ing the test. The second purpose is to calculate statistics from the data retrievedfrom the nodes and can be used as a network planning tool for future solutions.
Both the diagrams and the statistical data should be presented together to the op-erator in a well-formatted final report as a result of the finished measurement.
1.2 Questions
The problem formulation leads us to a few questions:

2
• Is it possible for the tool to collect data of several ADSL-parametersand/or perform several user measurements under the same period of time?
• How can we save probably huge amounts of data which are retrieved fromthe ADSL lines in an optimal way and then make the necessary calcula-tions to draw the appropriate graphs upon them later?
• Is it possible to draw time-dependent graphs and curves from the saveddata?
1.3 Method
The scope of this master’s project was to identify requirements, come up with asoftware design, create a prototype implementation and evaluate the prototype andthe work as a whole.
This divided the problem into several sub problems. The methodology choice ofthese sub problems are described below:
1.3.1 Requirements
• Initial requirements. These are mentioned in chapter 1.1
1.3.2 Design
• Integration with the existing backend. Documentation and books about theDSL techniques and SNMP library were studied in order to understand therequirements of the functionalities that would be implemented in the pro-totype. An overview of the theory is described in chapter 2.
• Evaluation of client and server technology platforms. A suitable client-server technology platform for the solution was tried to be found based onthe initial requirements, advices from my instructors and own researches.This is described in chapter 3.
• Layout and user functionalities in the web application were chosen in co-operation with the members of the DSL team. Their feedback on how dif-ferent parts of the web client should be presented helped tremendously inproducing a satisfactory solution. The layout is described more in appen-dix A.
1.3.3 Implementation
• The implementation of the client-server prototype is described in chapter4.

3
1.3.4 Evaluation
• Testing and evaluation of the prototype is described in chapter 5.
1.4 Limitations
1.4.1 Project limitations
• Open source code and libraries were used as much as possible in this pro-ject. I relied much on the discussions that were presented in the opensource communities for choosing PHP as the program language andMySQL as the database management system in the architecture of the pro-totype, so it was not necessary to investigate many alternatives.
• In order not to disturb the test environment for the DSL team, we decidedto configure a new server machine to build the prototype on. The new ma-chine had less processor power and less memory space than the main testserver. The low performance of the new machine might have had a bad ef-fect on the behaviour of the prototype in real-time. However, this issuewas not investigated further.
1.4.2 Prototype limitations
• The prototype has not been tested in very long continuous operation. Thelongest time for a measurement was one day.
• Only one DSLAM manufacture was tested in the configurations of newmeasurements. The manufacturer of the DSLAM is Ericsson. Lack of timeprevented testing communication with DSLAMs from other manufacturerssuch as Nokia and Alcatel.

4
2 Theory
2.1 DSL Fundamentals
Digital subscriber line (DSL) technology provides transport of high-bit-rate digitalinformation over telephone subscriber lines. Telephone lines, whose heritagedates back to Alexander Graham Bell’s invention of the telephone in 1875, cannow transport data at millions of bits per second. This is accomplished via sophis-ticated digital transmission technique, which compensates for the many transmis-sion impairments common to telephone lines.DSL technology has added a new twist to the utility of telephone lines. Telephonelines, which were constructed to carry a single voice signal with a 3.4 kHz band-width channel, can now convey nearly 100 digitally compressed voice signals, ora video signal with quality similar to broadcast television. High-speed digitaltransmission via telephone lines requires advanced signal processing to overcometransmission impairments due to signal attenuation, crosstalk noise from the sig-nals present on other wires in the same cable, signal reflections, radio-frequencynoise, and impulse noise.The twisted-wire-pair infrastructure connects to practically every home and work-place in the world, but DSL has its limitations. Approximately 15% of telephonelines in the world will require upgrade activity to permit high-speed DSL opera-tion [1]. There are many types of digital subscriber line technologies, according tothe global ITU standards there are ADSL, ADSL2, ADSL2+, HDSL, SHDSL,VDSL and VDSL2+ etc. The term xDSL has also been used by industry to refer toall types of DSL technologies.
2.2 Why DSL Technology
The benefit of using xDSL technology is that it can be deployed over existingtwisted pairs for the telephone lines. Unlike most of the new technologies whichrequire considerable time even before feasibility trials can be done.For example, a wireless satellite system would require designing, building, anddeploying the satellites before a trial could begin. DSL technology trials, on theother hand, can be much simpler due to the installed base of copper along withexisting switching centers.By using the existing infrastructure, the DSL technology can be deployed to manylocations that need to run their applications. Even if those applications demandsaccess to high speed-net. [2]

5
2.3 ADSL standards
Table 2.1, shows some of the ADSL standards which are covered by the ITU-T[3].
Standard Name Common name Downstreamrate
Upstreamrate
ANSI T1.413-1998Issue 2
ADSL 8 Mbit/s 1.0 Mbit/s
ITU G.992.1 Annex A ADSL 8 Mbit/s 1.0 Mbit/sITU G.992.2 Annex A ADSL Lite
(G.Lite)1.5 Mbit/s 0.5 Mbit/s
ITU G.992.3 AnnexA/4
ADSL2 12 Mbit/s 1.0 Mbit/s
ITU G.992.3/4 Annex J ADSL2 12 Mbit/s 3.5 Mbit/sITU G.992.3/4 AnnexL
RE-ADSL2 5 Mbit/s 0.8 Mbit/s
ITU G.992.5 ADSL2+ 24 Mbit/s 1.0 Mbit/sITU G.992.5 Annex A RE-ADSL2+ 26 Mbit/s 1.0 Mbit/sITU G.992.5 Annex M ADSL2+ 23.5 Mbit/s 3.5 Mbit/s
Table 2.1 some of the ADSL standards used at the market today
2.4 SNMP
2.4.1 The SNMP Protocol
SNMP is an abbreviation for Simple Network Management Protocol. It is used tomanage complex networks of routers, switches and servers and make sure thatthey perform in an optimal way. The protocol was introduced first in 1988 to meetthe growing need for a standard for managing Internet Protocol (IP) devices.SNMP provides its users with a “simple” set of operations that allows these de-vices to be managed remotely. Operators and administrators have the ability tochange the state of their SNMP-based devices. They can shut down an interfaceon some router or they can check the speed of the Ethernet interface. SNMP canbe used to manage a wide variety of systems such as UNIX and Windows. [4]

6
2.4.2 Managers and Agents
A manager is a server running some kind of software system that can handlemanagement tasks for a network. Managers are often referred to as Network man-agement stations (NMS).An NMS is responsible for polling and receiving traps from agents. A poll, is theact of querying an agent (router, switch, Unix server, etc.) for some piece of in-formation. A trap is a way for the agents to tell the NMS that something has hap-pened. In turn, the NMS can take some action, perhaps paging the user that some-thing has happened. The agent is a piece of software that runs on the networkdevices that you manage. It can be a separate program (a daemon, in UNIX lan-guage), or it can be incorporate into the operating system (for example, Cisco’sIOS on a router) [5]. Figure 2.1 shows how the SNMP protocol works.
Figure 2.1, The SNMP protocol [5]
For security reasons, the SNMP agent validates each request from an SNMP man-ager before responding to the request, by verifying that the manager belongs to anSNMP community with access privileges to the agent.
An SNMP community is a logical relationship between an SNMP agent and oneor more SNMP managers. The community has a name, and all members of acommunity have the same access privileges: either read-only (members can viewconfiguration and performance information) or read-write (members can viewconfiguration and performance information, and also change the configuration).
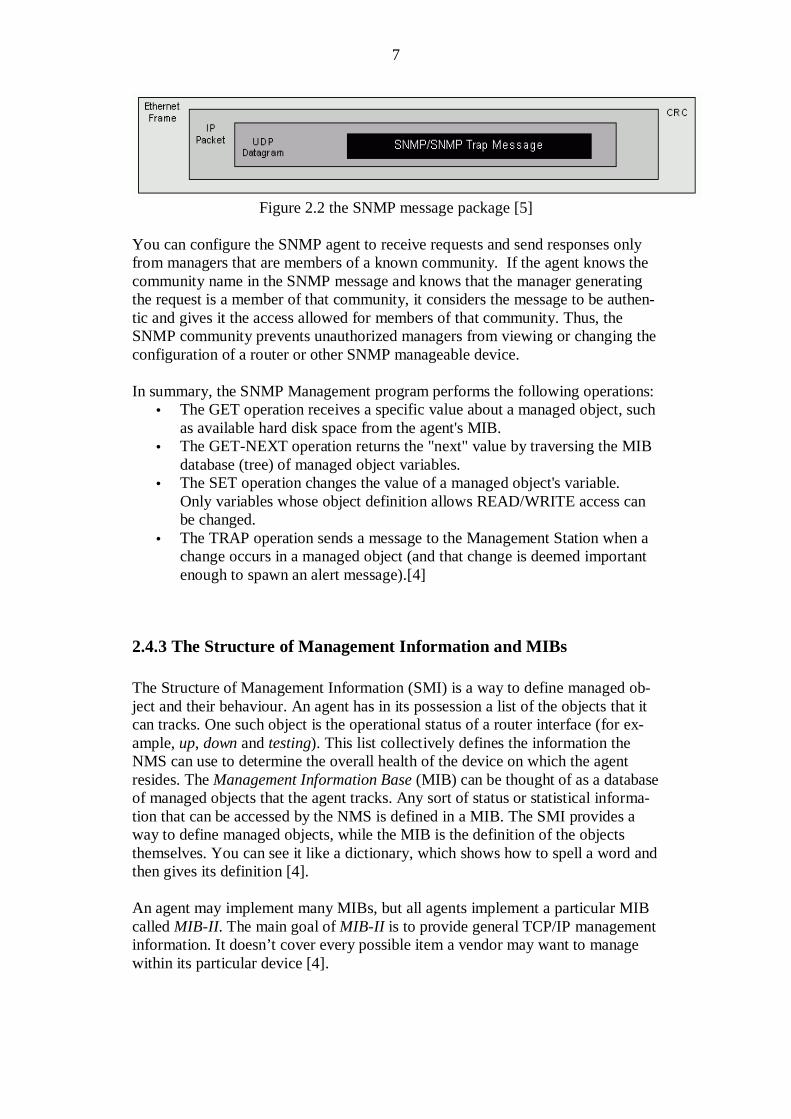
All SNMP message exchanges consist of a community name and a data field,which contains the SNMP operation and its associated operands. It is embeddedwithin a UDP Datagram, inside an IP Packet within an Ethernet frame. Figure 2.2below shows the SNMP message package.
7
Figure 2.2 the SNMP message package [5]
You can configure the SNMP agent to receive requests and send responses onlyfrom managers that are members of a known community. If the agent knows thecommunity name in the SNMP message and knows that the manager generatingthe request is a member of that community, it considers the message to be authen-tic and gives it the access allowed for members of that community. Thus, theSNMP community prevents unauthorized managers from viewing or changing theconfiguration of a router or other SNMP manageable device.
In summary, the SNMP Management program performs the following operations:• The GET operation receives a specific value about a managed object, such
as available hard disk space from the agent's MIB.• The GET-NEXT operation returns the "next" value by traversing the MIB
database (tree) of managed object variables.• The SET operation changes the value of a managed object's variable.
Only variables whose object definition allows READ/WRITE access canbe changed.
• The TRAP operation sends a message to the Management Station when achange occurs in a managed object (and that change is deemed importantenough to spawn an alert message).[4]
2.4.3 The Structure of Management Information and MIBs
The Structure of Management Information (SMI) is a way to define managed ob-ject and their behaviour. An agent has in its possession a list of the objects that itcan tracks. One such object is the operational status of a router interface (for ex-ample, up, down and testing). This list collectively defines the information theNMS can use to determine the overall health of the device on which the agentresides. The Management Information Base (MIB) can be thought of as a databaseof managed objects that the agent tracks. Any sort of status or statistical informa-tion that can be accessed by the NMS is defined in a MIB. The SMI provides away to define managed objects, while the MIB is the definition of the objectsthemselves. You can see it like a dictionary, which shows how to spell a word andthen gives its definition [4].
An agent may implement many MIBs, but all agents implement a particular MIBcalled MIB-II. The main goal of MIB-II is to provide general TCP/IP managementinformation. It doesn’t cover every possible item a vendor may want to managewithin its particular device [4].

8
MIB object identifiers (OID) are along with some instructions often issued bynetwork manager client to an SNMP agent to either get the value for the identifier,or set the identifier to a new value.
The OID naming scheme is governed by the Internet Engineering Task Force(IETF). The IETF grants authority for parts of the name space to individual or-ganizations such as Microsoft, Novell or Cisco. For example, Microsoft has theauthority to assign the OIDs that can be derived by branching downward from thenode in the MIB name tree that starts with 1.3.6.1.4.1.311. Novell's OIDs branchdown from 1.3.6.1.4.1.23. And Cisco's OIDs branch down from 1.3.6.1.4.1.9.You can see this structure in the diagram at figure 2.3 below.
Figure 2.3, an OID structure tree [5]
SNMP uses the OID to identify objects on each network element (i.e.router/computer) that can be managed using SNMP. For example, in order to getinformation about the free disk space on a Windows NT Server, the NetworkManagement Station makes a request to the network element using the fully quali-fied OID that represents the variable containing the number representing the freedisk space. In Microsoft's world, that would be .1.3.6.1.4.1.311.1.1.3.1.1.5.1.4.0or something very similar, depending how the MIB for that object was created.

9
2.5 ADSL Parameters
The state of the ADSL line can be measured with different parameters. Those pa-rameters are divided in two categories, PM and TM parameters.
2.5.1 PM parameters
PM stands for Performance Management. It refers to a set of parameters whichare measured by the ADSL operator to scan the line after flaws. In this documentwe refer to some of those parameters.
• ATM, Asynchronous Transfer Mode: this is a count of all valid non-idleATM cells successfully received to the UTOPIA bus during the currentperiod.
• ES, Errored Seconds: Count of Errored Seconds during the current period.
• BL, Bit Loading: A bit allocation table consisting of an octet string of size256 byte. From 0-255. It comes with ADSL1.
• EBL, Extended Bit loading: A bit allocation table consisting of an octetstring of size 256 byte. From 256-511. It comes with ADSL2.
• CV, Code violation: Count of all blocks received with uncorrectable errorson this channel during the current period.
2.5.2 TM parameters
TM stands for Transmission management. As for PM this term refers to a set ofparameters that show how the transmission is done along the ADSL line.
• Actual bit rate: Indicates the actual transmit rate on the channel that car-ries it. It is measured in bps.
• Attainable bit rate: Indicates the maximum currently attainable data rateby the ATU (ADSL Transceiver Unit). This value will be equal or greater tothe current line rate. It is measured in bps.
• Attenuation: The value returned is the measured difference in the totalpower transmitted by the peer ATU and the total power received by thisATU. Attenuation is measured in dB.
• Noise Margin: An indirect measurement of the noise level. Mostly thisparameter is used only in configuration purpose.

10
• Downshift: Configured Signal/Noise Margin for rate downshift. If thenoise margin falls below this level, the modem should attempt to decreaseit’s transmit rate.
• Operation Mode: The actual transmission mode of the ATU-C, for exam-ple ADSL1 (G.992.1 A), ADSL2 (G.992.3 A) and ADSL2+ (G.992.5).
• Current One Day Elapsed: Number of seconds that have elapsed sincethe beginning of the current 1-day interval.
• Init Attempts: count of the line initialization attempts since agent reset,includes both successful and failed attempts.
• Operational Status: The current operational state of the interface. Ex. up,down and testing. It returns an integer.
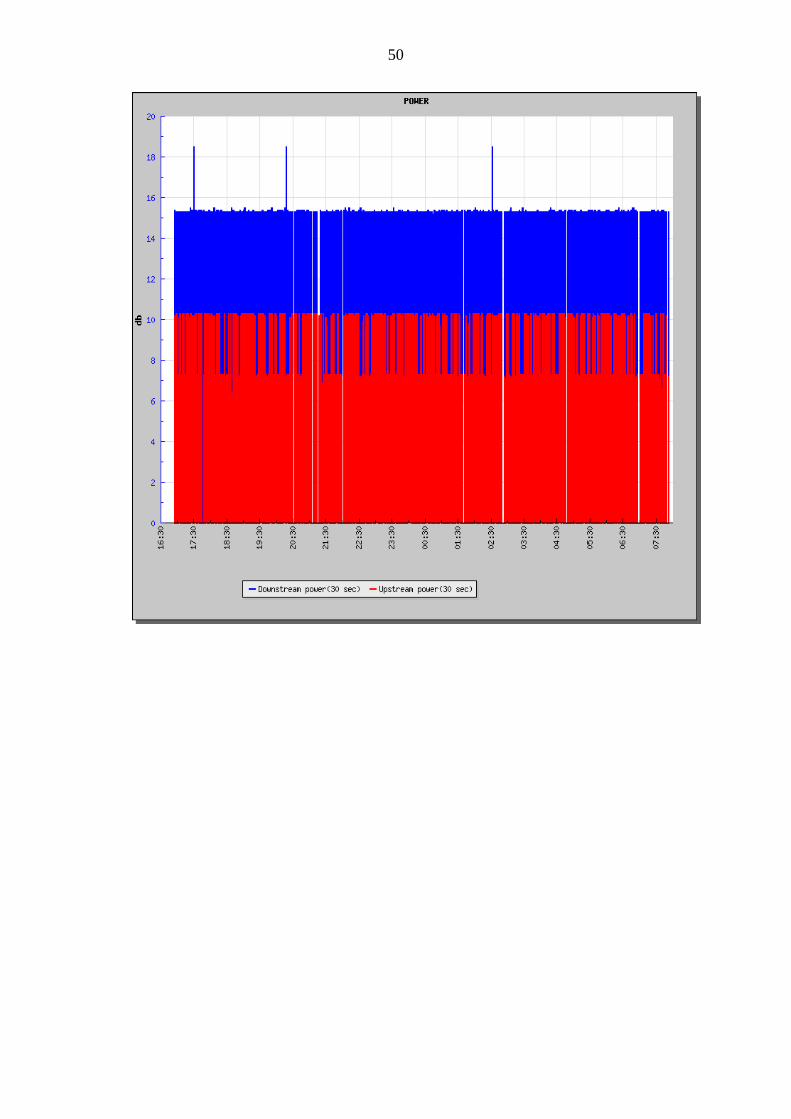
• Power: measured total output power transmitted by this ATU. In tenth dB.

11
3 Analysis
The problem of building the intended prototype was divided into several sub prob-lems:
• Functionality and usage.• Integrating a new server in the DSL lab environment.• Evaluation of the best suited technology platform for both of the client and
server applications.
3.1 Functionality and usage
The DSL team had only a general picture of which functionality that would beused in the prototype. But three persons from the team were particularly involvedin the process to determine which requirements the functionality should fulfil. Theaim of these requirements was to make it easier to understand what to do in thework and how to do it.
3.1.1 MethodologyThree persons were the requirement claimants of the prototype:
Bandula Vedage, DSL team, TietoEnator.Thomas Wallin, project leader, TietoEnator.Daniel Tjernberg, DSL team, TietoEnator.
A meeting which included me and my advisor from school and two persons fromabove (Bandula and Daniel) was carried out at the very beginning of the work todiscuss different issues of the prototype and get a clear picture of the job. BothBandula and Daniel were assigned to be my mentors during this project.
ConclusionThe main conclusions drawn from the meeting was:
• The target group is the members of the DSL team at the company.• First priority functions are the diagrams drawn out of the measured data.
Those diagrams should show clearly if found the changes in value ofADSL parameters in relation to time.
• The presentation layout of the prototype is less significant than the func-tionality. The main focus is to develop a well-functioning prototypewhich is also easy-to-use.

12
• The presentation layer of the prototype should be a web-based systemwhich simplifies the access to it by all members of the DSL team.
• Documentation of how to use the tool by the DSL team is a necessary is-sue. As well as a final report which describes the whole work.
• The work with the prototype is to be carried out in place at the companyin an open-plan office where the whole DSL team is sitting together.
• Questions arising about any specific functions will be answered by thementors who were identified earlier during the whole period of the thesiswork.
3.2 Configuring the new server
In order to not disturb the main test-server for the DSL team, we decided to con-figure a new server. An existing unused Computer machine in the lab hall waschosen to be configured to run the prototype on. Since the main test server wasrunning on Linux operating system, I decided to install a similar UNIX-like sys-tem on the new one as well, just to assure compatibility with main server.
In the open source world there are several distributions of UNIX-like operatingsystems to choose among:
• Linux distributions such as, CentOS, Debian, Fedora, etc.• UNIX’s open source distributions such as, GNU, FreeBSD, OpenSolaris,
etc.
After some research on the web and recommendations from the system adminis-trator of the DSL lab, I decided to install FreeBSD on the new server. Beside thefact that FreeBSD was free, the official home site promised that it would providerobustness in network solutions as well as it used memory efficiently to maintaingood response times for thousands of simultaneous user processes[7]. Thissounded as a good choice considering that the prototype was supposed to handlehuge amounts of data and ran multiple user requests at the same time.FreeBSD is also shipped with development tools for many program languagessuch as PHP and Java. Many different third-party applications such as Net-SNMPand Apache web-server are included as well in a ready-to-install format.
After installing the operating system, the server was physically and virtually con-nected to the intranet of the DSL lab to get access to all needed DSLAMs andADSL modems.
3.3 Technology platform for server and client applications
According to the previous discussions in this document, I decided to build theprototype according to the client-server model. This model can be developed withseveral technology platforms. A more precise idea was to develop the client as a

13
web based system and the server part as a program written in some programminglanguage and run on the server machine. My background experiences and skills inprogramming led me to consider developing the prototype in one of the followingplatforms:
• Microsoft technology, using ASP.Net for developing the web layer andC# for logic layer.
• Sun Microsystems, using Java Server Pages for web client and Java forthe logic layer.
• PHP, which can be used both in producing web pages and in stand-alone applications as the server program and logic layer.
Unlike PHP and Java, .Net is a platform dependent technology. It runs only onWindows operating system. This will limit the compatibility with the main testserver that we initially were looking for when we installed FreeBSD on the newserver. Besides, the SNMP library is not natively supported by .Net’s framework2.0. Although there are third party solutions which import some .dll files andpackages to solve this issue, it felt unsafe to use. By means of this, the first optionto use .Net was discarded.
The choice between Java and PHP was however a bit harder. Principally, the webdevelopers are split up in two camps where each camp promotes one technologybefore the other. By some further researches on the web, I found some interestingfacts which I personally agree with about each of the two technologies. Those aredescribed in the following table.
Function / Feature JSP PHPProgramming Approach Completely object
orientedAdvantage: Clean codeDisadvantage: Too de-scriptive
Scripting with objectoriented supportAdvantage: Functionaland quick coding, youcan use OOP practices atyour convenienceDisadvantage: May getclumsy
String and data manipula-tion
Rich library, too muchdescriptive and objectoriented code
Rich functionality. Func-tional and easy coding.
Web Oriented features1- Includes2- Mails3- File Uploads4- Form Handling5- Sessions
Almost everything isbuilt in or supported bylibraries. Complicatedand too much of code.
Inbuilt functionality.Easy to use functions,written for the specifictasks
Database Access features Standard JDBC structure/Use EJB/ Struts frame-work built over JDBC.
Dedicated inbuilt libra-ries for most of the com-monly used databases.

14
Descriptive and too muchoverhead or boiler platecode involved. Uses thesame API for all databas-es using JDBC drivers
Very tight integrationwith MySQL and Post-GRESQL. Very minimalboiler plate code re-quired. The libraries andresults are straight for-ward and easy to use.
Extensibility Java Classes and Libra-ries. Run in sandbox andhard JNI approachneeded to integrate withserver programs.
PHP/C/Any thing execut-able by the underlyingOS platform. Can veryeasily interact with pro-grams on the server. Verygood support for nativecode.
Dynamic Graphics/PDFand bells and whistles
Almost everything has areadymade library
Supported internally orthrough libraries.
Table 3.1, a comparison between JSP and PHP [9]
As a conclusion, JSP and Java seemed to be more complicated and time consum-ing to develop the prototype with than PHP. Besides, Java is more commercial-ized than PHP which might result in difficulties to find open-source code compo-nents to use in the prototype. Additionally, using JSP and Java may need a heavierdevelopment infrastructure in form of IDE and application server which will re-sult in more unnecessary overhead in contrary to PHP which is far more easy touse.
For those reasons, I decided to choose PHP as the programming language to de-velop the prototype in.
Once choosing the PHP as a programming language, it felt natural to chooseMySQL as a database management system and Apache as a web server. The easyand yet powerful combination of all the three products makes PHP very popularamong other web development languages on the internet.
In order to cope with the task of drawing different diagrams of the stored data inPHP there is a graph-plotting library which is entirely written in PHP and it is freeto use.
In the next subsections I will say a few words about each of the four technologieschosen to build the prototype with.
3.3.1 Developing in PHPPHP is a server-side, cross-platform, HTML embedded scripting language thatlets the developer create dynamic web pages. PHP also provides a command line

15
interface SAPI for developing shell and desktop applications, daemons, log pars-ing, or other system administration tasks that have traditionally been the domainof Perl, Python, awk, or shell scripting[8].
3.3.2 MySQL Database
MySQL is a relational database management system. Relational means that thedata is stored in separate tables rather than in one big storeroom. This adds speedand flexibility to the database. The tables are linked by defined relations making itpossible to combine data from several tables on request. Beside that MySQL isfast, reliable and easy to both use and call within PHP, it is an open source soft-ware. It uses a GPL (GNU General Public License).
3.3.3 Apache HTTP server
One of the prerequisites to handle web pages is that we have a Web server for ourweb client to reside on. A Web Server is a computer on the World Wide Web(connected to the Internet Backbone) that stores HTML documents that can beretrieved via a Web browser [6]. Apache web server is the most popular webserver used. It is free and supported by many operating systems including theFreeBSD which is used here. The installation files follow with the FreeBSD ver-sion are in ready-to-install format.
3.3.4 JpGraph
JpGraph is a 2D graph plotting library for PHP. JpGraph makes it easy to drawboth "quick and dirty" graphs with a minimum of code and quite complex graphswhich require a very fine grain of control. The library produces web-friendly im-ages which mostly are 2 kilobytes and no bigger than 3-4 kb [5]. The library iswritten in PHP. When you want to invoke a function you just provide it with thedata you want to display.

16
4 The DSL Inspector prototype
See appendix A for an overview of the DSL Inspector prototype.
4.1 Development Environment
4.1.1 Software used on my PC
Windows XP, operating systemUltraEdit, code editorSecure Shell client, SSHInternet settings
All code development in PHP was done on my Windows provided computer. ThePHP files are transferred over the internet to the server-machine with the SSHclient. The server was now seen as a part of the main test-server of the DSL lab, towhich only authorized persons could connect over a secure line. During the entireperiod of the prototype-development all new components and features developedand modified were run and debugged at the server machine.
4.1.2 Software installed on the Server
The software installed on the server to run the prototype is:
• FreeBSD 5.4, operative system• Apache 2.0, web server• PHP 4.4 installed with PCNTL enabled• GD 2.0, graphic library for showing colored diagram• UCD-SNMP 4.2.6• MySQL database management system 4.0

17
4.2 Database layer overview
The database layer used in the prototype consists of 12 tables. (See figure 4.1)
• Active_users: lists which registered users that are logged in the web-client.
• Active_guests: lists the IP number of all users who are displaying theweb-client but not logged in.
• Banned_users: lists all banned users.• Calc_values: saves statistics data about each finished measurement.• Graph: saves a path to each generated picture-diagram.• Mdf: info about which switch-, under switch- and port number that is as-
sociated with the measurements.• Measurement: contains data needed about each submitted measurement.• Param_package: Contains customized parameter-packages for quick
choice through the web-client.• Performance_info: Contains statistics data from finished measurements• Result: Contains the parameter-data retrieved from the ADSL-line with
SNMP.• Time_info: start-, stop- and unavailable-time for the processed measure-
ments.• Users: Contains user specific information such as, username, password
and e-mail address.

18
Figure 4.1 the database tables
4.3 Overview of the DSL Inspector functionality
In the next two subchapters we explain how the prototype deals with the main andmost difficult task of the job. As, to collect, store and finally presents the datagathered for the ADSL parameters. The solution presented here is probably oneway of many different to solve this problem with.
4.4 Collecting and storing parameter’s data
The data for the different parameters is all stored as strings in one database tablewith their interval-values that were set by the ADSL operator in the web form asshown in Appendix A, (See figures 4 and 5)An interval-value is an integer value that tells us how often the data for a certainparameter should be collected from the line. This value is measured in seconds.However, not all parameter’s interval-values can be set from within the web form.Some parameters should always be included in all measurements. Those parame-ters are therefore not visible in the web form and hence, are hard coded to 10 sec-onds each. Noise Margin and Operational Status are an example of such parame-ters. A value of 300 seconds is assigned to the parameter ATM.

19
The PHP language provides a method to get the SNMP value for each specifiedDSL parameter easily with one line of code:
@snmpget("ip_address","public","oid_value");
The IP-address here may refer to any modem’s, router’s or device’s IP-address onthe internet to which the operator is willing to test the ADSL connection. Also,this address is specified in the web form by the operator. The OID is a string ofdigits which is unique for every single DSL parameter. Those OIDs were broughtby my instructors at the company as lists and thereby were put hard coded in theprogram. Prior tests of the SNMP get function showed that the answer time for theresult values were quite fast. In fact, this did allow collecting data for multipleparameters at the same second.
If the IP address is unreachable or it’s wrong for some reasons this method willreturn an empty string. In order to avoid saving empty strings in the database acontrol mechanism is build at the top of the collecting module to check whetherthe IP-address is reachable for measurement. If not the user/operator is warnedthrough the web client and the collecting process is terminated.
The mechanism of collecting and saving the values of the parameters differs infunctionality from TM to PM parameters. The differences are explained in thenext two subsections.
4.4.1 Storing the TM parameter data
The data retrieved for the TM parameters from the ADSL line is stored as stringsalong with other information about the measurement in the result table which isshown in figure 4.1. To illustrate how the storing process is carried out, we take asimple example.
Let’s assume that the operator wishes to measure the parameter “bit rate” every 10seconds during a period of one hour. Then he/she enters the value 10 at the webclient in the interval-time field in front of the parameter’s name. Additionally, theoperator has to enter the value 60 in the duration time field. Once the operatorsubmits his/her measurement, the information about this measurement is stored inthe measurement table as a row of strings. The measurement is automatically as-signed a unique id and the status of the job is set to “waiting”. When the serverprogram starts the storing process, the measurement is extracted from the meas-urements table and processed as well as it updates the status of the job to “proc-essing”. In this case the storing process calls the snmpget method every 10 sec-onds during 60 minutes. The result data retrieved from the call is stored in theresult table together with other useful information for the measurement.

20
4.4.2 Storing the PM Parameter data
The PM parameters are handled in quite a different way. The data retrieved fromthe SNMP call is accumulative according to a 24-hours or 12-hours interval pe-riod (depending on internal settings of the DSLAM). It means that the value of therecent SNMP call is always greater than or equal to the value of the previous oneaccording to the current interval-period. Once a time period ends and a new onebegins the parameter’s value resets and a new counting begins.
For this reason we store only the difference-value (delta) between one parameter’svalue and it’s previous one, starting always from the second value in the interval-period. If there wasn’t any distortion along the line, then an even curve/line willshow at the final result-charts because the differences were almost equal. Other-wise the curve would attend to peak at the distortion time.If the DSLAM’s interval-period switches and the counting resets during an ongo-ing measurement, then we get a negative value resulting in a big peak pointingdownward at the result-curve. This negative value is the result of the new period’sfirst value which is 0 minus the last value of the previous period which had to be avery big integer. In order to eliminate negative values when the interval switches, we measure anextra value a short time before the interval-switch. The result from the extrameasurement will be added to the result of the first measurement of the new inter-val-period. In this case we get a relatively accurate result for the parameter’s valueover the switch period. This short time is limited to a few seconds before the pe-riod switches and thus, its value can be ignored. (See figure 4.2 below)
Figure 4.2 illustration of the algorithm used for PM
snmp=20, buffer=10snmp=10, buffer=0 snmp=35, buffer=20 snmp=10, buffer=15
IntervallChange
dbvalue=35-20=15
dbvalue=20-10= 10
extra snmpvalue
last snmpvalue
first snmpvalue
first snmpvalue
< 10 sec
dbvalue=10+15=25
snmp=25, buffer=10
second snmpvalue
dbvalue=25-10=15
24 hours

21
Now, let’s take a look at how this problem is solved in PHP:
$intervallChanged = false;
if(($paramInt + $dslamTimeValue) > $timeperiod){
$intervallChanged = true; //indicates thatan intervalswitch is go-ing on
$counter = 1; //indicates thatit is one stepbefore intervalswitch
}
$dbValue = periodAdaption($snmpvalue, $buffer,$intervallChanged,$extra_ InterValue,$last_InterValue,$counter);
Above, the $dslamTimeValue is the DSLAM’s own timer. It goes from 0 to aconfigured time- period. Then it restarts. $paramInt is a variable which stores avalue of how often an ADSL-parameter is measured. The $timeperiod variablestores an integer representing the amount of seconds in the configured interval-period (i.e. 24*60*60).
Function periodAdaption($snmpvalue , $buffer, $intervallChanged,$extra_ InterValue, $last_InterValue, $counter)
{ if(intervallChanged == true){
if(counter == 0){ // measure the extra paramer’s value before theswitch extraInterValue = extraValue - lastValue;
dbvalue = snmpvalue + extraInterValue;buffer = snmpvalue; // update the bufferintervallChanged = false;return dbvalue;
}else{ // last value before interval changelastValue = snmpvalue;dbvalue = snmpvalue - buffer;buffer = snmpvalue; // update the buffercounter = 0;return dbvalue;
} }else{ // all values between
dbvalue = snmpvalue - buffer;buffer = snmpvalue; // update the bufferreturn dbvalue;
}

22
4.4 Extracting parameter’s data and drawing the graphs
When the server program finishes the process of collecting data for all ADSL pa-rameters specified according to the scheduled time, it starts another process whichin turn interprets the data collected and makes the desired final report. The call ismade by creating a new object of the DBInterpreter class. The id of the actual jobis sent as a parameter to the constructor of the DBInterpreter. In turn the construc-tor will start processing several methods. The PHP code for the constructor is:
function DBInterpreter($measure_id){
$this->id = $measure_id;$this->extractDBData($measure_id);$this->setUnavailableTime($measure_id);$this->setPerformanceInfo($measure_id);$this->setCalcValues($measure_id);
$this-> makeChart();}
The extractDBData() method extracts all saved data that is associated with thespecified $measure_id from the database and load multiple arrays with them inthe memory.Those data arrays will be used later by the JpGraph library to generate diagrampictures by a built in method called makeChart(). The arrays are used by twoother methods, setPerformanceInfo() and setCalcValues(). The setPerfor-manceInfo() method sums up the values for the three parameters CodeViolations,ErrorSeconds and Syncs. The sum is written down then in the database in the per-formance_info table to be shown later as statistics in the final report. See Appen-dix C.
The setCalcValues() method calculates the minimum, maximum, mean and stan-dard deviation of the values for the parameters attainable bit rate, actual bit rate,noise margin and attenuation. The result values are saved into database also to bepart of the statistics shown in the report later. See Appendix C.
It is important for the ADSL operator to know whether the measurement along theline was available during the time without interrupts. The unavailability couldhave many reasons. Some of them might be that the DSLAM were synchronizing,ADSL modems were restarting etc. Therefore, the time when the measurement isnot available along the ADSL line is met by a special parameter called opera-tional status. A 0 or 2 indicates that the measurement were not available for 10seconds. The total time of unavailability is summed up and showed later in thereport. See Appendix C.
At the end of the DBInterpreter class the makeChart() method is called to draw allthe diagrams that are needed. As I mentioned before the makeChart() usesJpGraph which is a class library written in PHP to draw the graphs. This is donein steps as follows:

23
We define a graph as a new instance of the Graph class:
$graph = new Graph(800,680,"auto",0,false);
The next thing is to define a curve to include in that instance of the graph. This isdone by creating a new instance of the LinePlot class which takes two arrays ofvalues as parameters. The first array will be plotted along the Y-axis while thesecond plotted along the X-axis. Earlier, at the storing process we saved all dataretrieved from the snmpget method with a time-stamp in the database. By doingso, we benefit the time-stamp array to send it to the LinePlot as the second pa-rameter.
$lineplot = new LinePlot($ydata, $timeArray);
Here, we can create several LinePlot instances as shown above to add to the graphwhich will result in a multi curve graph.
$graph->Add($lineplot);
The graph class generates a “.png” picture out of the fed information. In order todo so, a call to the built-in Stroke method with a path as a parameter:
$graph->Stroke(“path”);
By using the Stroke method the graph pictures can now be saved on disk. Assum-ing that we specified a proper path to those pictures the program can find themeasily later.
The path is consisting of two parts:• Directory, where the pictures are stored on disk.• FileName, which consists of measurement-id, title and file extension.
The measurement-id is unique which allows the program to extract and presentthe right pictures when the user requests displaying the final report. The title couldbe a name associated with the parameters that the diagram represents (e.g.“downStreamBitrate”). (See the final report in appendix C)

24
4.5 Summary of functionality
When the server-program finishes collecting and saving the data for the requestedADSL parameters, the program automatically calls the next process which is theextracting and drawing graph one. The latter will in turn use the open-source PHPlibrary JpGraph to draw the appropriate diagrams out of the extracted data. Addi-tionally, the process saves a string path for each produced diagram-picture alongwith the id of the processed measurement in a database table. Further calculationsof different data for statistical purpose are also made in this process. The statisti-cal data are saved in a separate table called Performance_info. Once this processfinishes, it changes the status for the measurement to “done”. And an automatic e-mail is send noticing the operator that his measurement is now finished. When theoperator decided to review the finished report, he can log in to the web-client andclick on the specified link to show the report. A PHP script will compose all thedata saved in the different database along with the diagram-pictures in a HTMLpage.
The total time of both processes are measured as well and presented in the finalreport along with all other statistical data and diagram-pictures.

25
5 Test and Evaluation of the DSL Inspector Prototype
Several tests of the prototype were done continuously during the implementationphase. Although those tests were made under short periods of time i.e. 5-10 min-utes. Long-term tests had to be done at the final phase of the project to see howthe prototype functioned in real life.
5.1 Testing the prototype
Testing the prototype showed that both the web-client and server-program func-tioned well and according to the expectations. Users visited the web-client for firsttime could register themselves in order to get access to the system and start usingit. Once they were logged in they could easily configure their measurements ac-cording to the rules discussed before in this document. Once the measurementswere submitted the server started immediately to process them fine. The servercould process up to 10 measurements simultaneously.
The layout of the web-client was understandable to everybody in the DSL team.
The e-mail mechanism of the system worked excellently. The users whose meas-urements succeeded received an announcement via e-mail reminding them to login the system and review the result report.
In order to test the prototype during extreme circumstances, four long-time meas-urements were made in the prototype. Those measurements lasted one hour, fif-teen hours, one day and five days respectively.In each of the four tests all ADSL parameters were selected to be measured. Avery short interval value was chosen (e.g. 20 seconds). Additionally, in order tobetter see the changes in parameter-values in the result curves during the meas-urement time, a simulator was connected to the DSLAM to generate distortionalong the tested ADSL line.
The result from three of the four measurements was successful. The prototypemanaged to collect all the data requested for all parameters chosen. All diagramsincluded in the final report seemed to be very realistic as well as the statistic datawas accurate. The only measurement that failed was the five day test. By studyingthe log file in the operating system at the server machine, it appeared that an errorhad occurred at the process which was running the server-program approximatelytwo days after the process started. My wild assumption is that the error occurreddue to a memory leak in the implementation of the server program forcing theoperating system to shut down the process. However, any further investigation onthis issue wasn’t done as the one day test was considered long enough for a proto-type.

26
In conclusion the prototype worked as expected and produced a report which gavea good and realistic picture of the condition of the tested ADSL line.
5.2 User’s view of the Prototype
The prototype DSL Inspector was demonstrated to the whole DSL team at Tie-toEnator. The response from them was very good. They thought that it lookedvery promising and were quite impressed of how fast it functioned. The layout ofthe web-client was appreciated as well.
5.3 Future Development
The prototype contains the most essential subset of functionalities in the desiredtool. However for the tool to be more powerful and more useful for the membersof the DSL team, more enhancements and development should be implemented.The PHP programming language is considered to be quite easy to learn. It is alsoone of the most widespread languages to develop web applications in. This makesthe task of adding new functionalities to the tool a simple issue.
One of the important improvements to introduce in the next edition of the tool isto be able to make measurements which are compatible with all (or at least mostof) the famous DSLAM manufactures on the market. This will increase the tool’sflexibility in measuring the customer’s ADSL connection irrespective of whichtype of DSLAM is used. Today’s prototype is only compatible with EricssonDSLAMs.
Another possible, but yet necessary enhancement is to implement an extension inthe web-client which enables the user of the tool to add new OIDs/parameters aswell as editing the existing ones. However, this extension should only be a privi-lege to authorized users such as the moderates of the tool. In fact this authoriza-tion mechanism is already supported by the database layer in the existing proto-type. A developer can easily utilize this functionality in best manner by combin-ing XHTML and PHP code to implement it.The authorization mechanism can also be benefited from by showing/hiding partsof the presentation layer for different users. An example is the customization ofthe parameter’s packages. A user should only be able to select customized meas-urements which were saved under his account with his choice of parameters andinterval values.
Finally, in order to provide more stability and reliability to the tool. More timeand resources should be assigned to investigate and eliminate the reasons behindthe error which was causing the prototype to crash when running for longer peri-ods of time. Analyzing the way the operating system divides its resources betweenthe processes under the time the tool is running might solve the problem.
27
6 Summary
The goal of the master’s project was to implement a tool to measure the quality ofservice of the ADSL connections for customers of the DSL team at Tietoenator.By collecting MIB-data from the ADSL line and saving those data in a database.The tool should then result in a final report consisting of both statistics and dia-gram-pictures from the data collected.
In order to realize this goal a prototype was build as a client-server model basedon the three tier architecture. The presentation layer was build as a web client de-veloped in PHP and XHTML. This web client contained different forms to submituser’s configurations. PHP was also used in the logic layer to perform the meas-urements that were submitted by the users in the web-client. The data layer con-sisted of multiple tables to save the MIB-data and support the functionality of theprototype. Additionally, the data layer worked as the only communication linkbetween the client and server programs. MySQL was used as the database man-agement system in the data layer.
The SNMP library which is supported by PHP simplified the task of retrievinghuge amount of MIB-data from the tested ADSL line without any remarkable la-tency.The prototype succeeded to produce a report which composes both statistic dataand nice colored time-independent diagrams of the collected MIB-data.
A demonstration of the prototype was carried out at the company for the membersof the DSL team. The reaction from the demonstration was that the prototypefunctioned very well and was really promising. They were interested in using it inthe future to run their tests.
28
Bibliography
[1] Thomas Starr, John M. Cioffi, Peter J. Silverman, 1998, Understanding Digi-tal Subscriber Line Technology, communication engineering and emerging tech-nologies, United States of America.
[2] Denins Rauschmayer, 1998, ADSL/VDSL Principles: A practical and PreciseStudy of Asymmetric Digital Subscriber Lines and Very High Speed Digital Sub-scriber Lines, Macmillan Technology Series, United States of America.
[3] ITU-T Telecommunication standardization sector of ITU, Physical layer man-agement for digital subscriber line (DSL) transceivers G997.1, 2005, pdf docu-ment.
[4] Douglas R. Mauro & Kevin J. Schmidt, 2005, Essential SNMP.
[5] WTCS.ORG, 2005-12-15, what is SNMP? http://www.wtcs.org/snmp4tpc/snmp.htm
[6] Aditus Consulting, 2005-12-20, what is JpGraph? http://www.aditus.nu/jpgraph
[7] The FreeBSD Project, 2005-12-20, About FreeBSD http://www.freebsd.org/about.html
[8] Wikipedia, 2008-03-09, PHP http://en.wikipedia.org/wiki/Php
[9] My Tech Ratings, 2007-06-25, PHP vs. JSP http://mytechrantings.blogspot.com/2007/06/php-vs-jsp.html

29
Appendix A (Overview of the DSL Inspector prototype)
1 The web client
The web client in DSL Inspector is provided with an authentication mechanism inform of accounts that are password secured. This is a quite common way in webapplications to keep the unauthorized persons out of the system. The login page isshown in Figure 1 below.
Figure 1, the login web page to DSL inspector
A user visiting the web page for the first time has to sign up in order to be regis-tered and get access to the site. This is usually done by clicking on the link “Sign-Up” and then filling in all information needed to complete the registration. Theuser has to choose an alphanumeric username otherwise an error message isshown in red prompting the user that the password is not alphanumeric. The checkis made by a function in PHP which uses a string of regular expression to matchthe username with. If the registration succeeds the system sends an automatic“welcome” e-mail to the new subscriber providing his username and his pass-word.The user information is also saved in the database in the table called “user”. Thepassword is saved in an encrypted form.
30
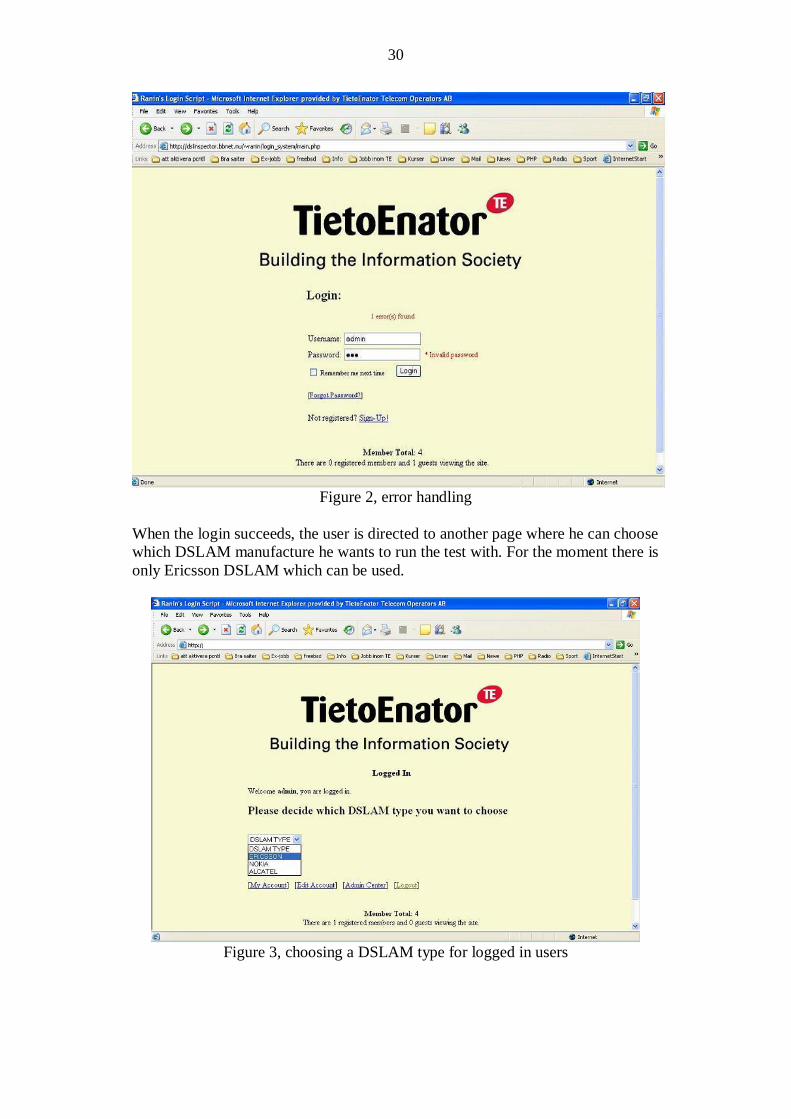
Figure 2, error handling
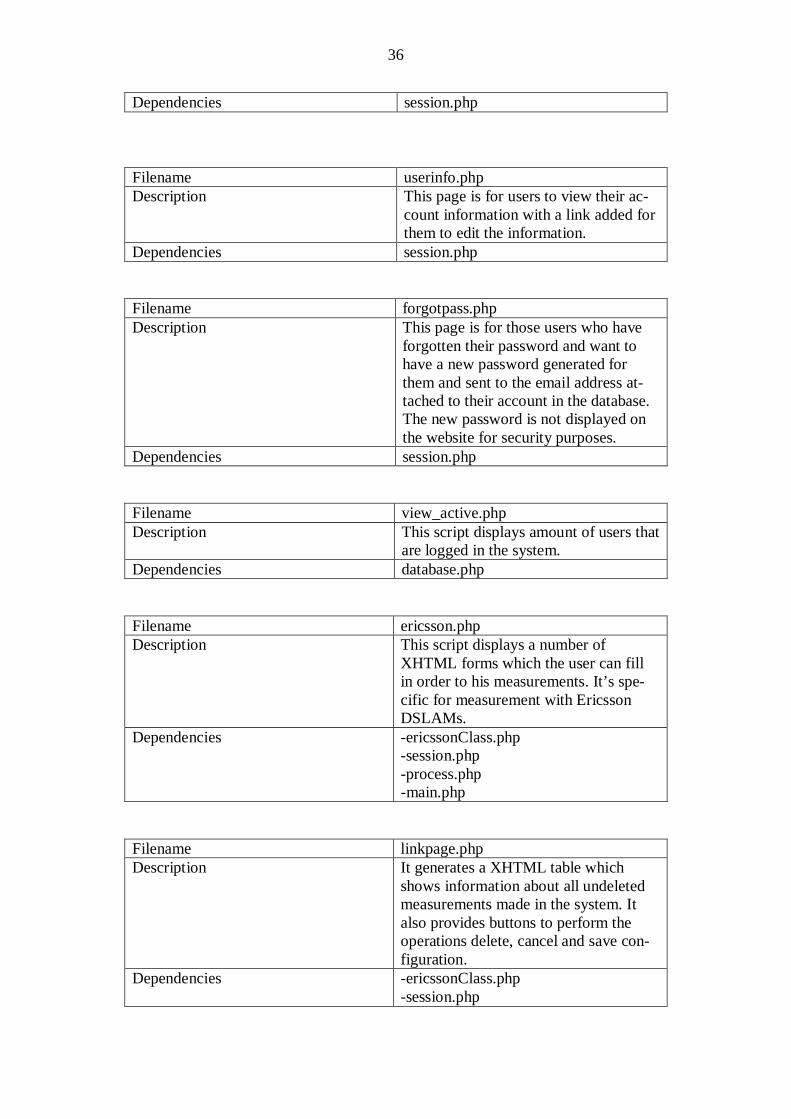
When the login succeeds, the user is directed to another page where he can choosewhich DSLAM manufacture he wants to run the test with. For the moment there isonly Ericsson DSLAM which can be used.
Figure 3, choosing a DSLAM type for logged in users

31
Once the user chooses the DSLAM manufacture from the drop down list, he willbe directed to the measurement page to specify which ADSL parameters will beused to run the measurement with.
The measurement page consists of a number of fields. Those fields are:
• IP Address: the user specifies the IP address of the remote host.• MDF: is a DSLAM specific configuration and consists of three drop down
lists. Switch number, under- switch number (usually not used) and the portnumber of the switch.
• Package: is used to choose an earlier made measurement configuration iffound. In this way the users don’t have to mark the parameters to useevery time they want to run a test.
The second part of the measurement page consists of two columns:• Param-name: the user chooses which parameters he wants to include in
the measurement by clicking in the square in front of them.• Interval time in seconds: the user writes in the number of seconds which
represents how often the parameter’s value will be collected through theSNMP get functions.
Down on the measurement page you find the following:• Comment: an optional text field.• Duration time: the user states here how long time the measurement
will be run in minutes.• Measurement links: links to earlier measurements submitted by all
users. Those links show summarized information such as date, time,username, DSLAM type and status of the measurements.
Figure 4, the measurement page

32
Figure 5, the measurement page
If the user wants to get more detailed overview over all the measurementsmade and how often the parameters are run for respective measurement.He has to click on any of the measurement links down at the measure-ment page (see figure 5). The user will be directed to the Link-pagewhere he can see more details about each measurement.

33
Figure 6, the Link-page
The link-page in (figure 6) consists of a table showing all the measure-ments that were submitted by the users of DSL Inspector. Down on thesame page there are three buttons and a drop list including all measure-ments ids that are listed on the table above.
The user can cancel and delete any ongoing job in case of a regret regard-ing any of the made measurements. However, there is a restriction herethat the user can only cancel a job which was submitted by him. Only, theadmin of the page has authority to cancel and delete measurements sub-mitted by any other user.
The link-page is automatically updated every 20 seconds. The update isimportant to provide the user with the current status of the jobs.The status of the jobs is divided in the three categories waiting, process-ing and done depending on which state the job is at that moment. Everyjob is assigned a unique ID-number in the database. Once the server pro-gram has finished processing the job the ID-number in front of the jobwill change to a link. When the user clicks on the link a PHP script isexecuted in the background and a report consisting of both statistics anddiagrams is presented to the user. The report is shown in appendix b.
The Save configuration button at the bottom of the link-page enables theuser to save any configuration that might be considered useful in the fu-

34
ture. The saved configuration will show up at the package drop down listthe next time the user visits the measurement page.
2 The server program
The server program is build of some classes and scripts which are all written inPHP. Those work together in the background at the server computer to process thecustomized measurements that were submitted earlier by the user in the web clientprogram.
In order to run the server program, a call to a script called daemon.php is madefrom the command line on the server computer. The operator of DSL Inspectorstarts this script by first telneting from his PC to the server computer with a SSHprogram and then writing a command in the commando shell to start the serverprogram.
Once the Daemon script is started it will be run all the time. It has a connection tothe same database of the client program. When new measurements are inserted inthe database by the client program, they will be marked with the waiting flag.Later they will be snatched up by the Daemon script and processed. The Daemonscript uses a technique called “Forking” which is used by all UNIX operating sys-tems. Forking means that a process can create a copy of itself, which then acts as a“child” of the original process, now called the “parent”. All processes are then runsimultaneously to perform different jobs and/or programs.By using this forking technique the Daemon script can assign each new job to anew process to work on until it finishes.

35
Appendix B (Overview of Classes and PHP scripts)
Overview of The classes and PHP scripts which are used in the DSL Inspectorprototype.
Presentation Layer (PHP & XHTML)
Filename main.phpDescription The log-in page which
-Provides authentication mechanism inform of username and password-Prints XHTML code.
Dependencies session.php
Filename admin.phpDescription Is displayed only to users with adminis-
trator status. It provides a web interfaceto perform tasks such as:-displaying information about all usersregistered in the system.-Changing status for different users.-Deleting users.-Banning users.
Dependencies session.phpFilename form.phpDescription A Class used to displays error messages
in case a user filled in wrong informa-tion in submitted forms.
Dependencies none
Filename register.phpDescription Displays the registration form if the
user needs to sign-up, or lets the userknow if he’s already logged in.
Dependencies session.php
:Filename useredit.phpDescription This script is for users to edit their ac-
count information such as their pass-word, email address, etc. Their user-name cannot be edited. When changingtheir password, they must first confirmtheir current password.
36
Dependencies session.php
Filename userinfo.phpDescription This page is for users to view their ac-
count information with a link added forthem to edit the information.
Dependencies session.php
Filename forgotpass.phpDescription This page is for those users who have
forgotten their password and want tohave a new password generated forthem and sent to the email address at-tached to their account in the database.The new password is not displayed onthe website for security purposes.
Dependencies session.php
Filename view_active.phpDescription This script displays amount of users that
are logged in the system.Dependencies database.php
Filename ericsson.phpDescription This script displays a number of
XHTML forms which the user can fillin order to his measurements. It’s spe-cific for measurement with EricssonDSLAMs.
Dependencies -ericssonClass.php-session.php-process.php-main.php
Filename linkpage.phpDescription It generates a XHTML table which
shows information about all undeletedmeasurements made in the system. Italso provides buttons to perform theoperations delete, cancel and save con-figuration.
Dependencies -ericssonClass.php-session.php

37
-process.php
Filename displayRapport.phpDescription A script in PHP and XHTML which
displays the final report with statisticsand diagram-pictures.
Dependencies -ericssonClass.php-Duration.php-database.php
Logic layer (PHP)
Filename adminprocess.phpDescription A class to simplify the task of process-
ing admin submitted forms from theadmin center.
Dependencies -session.php-main.php
Filename session.phpDescription A Class to simplify the task of keeping
track of logged in users and guests.Dependencies -database.php
Filename process.phpDescription A class to simplify the task of process-
ing submitted user forms, redirecting theuser to the correct pages if errors arefound, or if form is successful. Alsohandles the logout procedure.
Dependencies -session.php-ericssonClass.php-resultConstructor.php-DBInterpreter.php-measurement.php
Filename measurement.phpDescription A class which contains all information
about the submitted measurements bythe user.
Dependencies none

38
Filename constants.phpDescription A script which groups all constants
used through the system such as sessionconstants, database constants, etc.
Dependencies none
Filename mailer.phpDescription A class which is used to send e-mail to
users.Dependencies none
Filename ericssonClass.phpDescription A class which has specific information
about the Ericsson DSLAMs. It containsalso all the OIDs of the ADSL parame-ters.
Dependencies -session.php-Duration.php
Filename Duration.phpDescription A class for making time periods read-
able. It converts an integer number ofseconds into a readable string. 121 sec-onds is converted into “2 minutes, 1second”
Dependencies none
Filename ResultConstructor.phpDescription A class which collects MIB-information
with the SNMP library from the ADSL-line. It saves the information in the data-base. It does some other calculation tothe values collected as well.
Dependencies -ericssonClass.php-DBInterpreter.php
Filename DBInterpreter.phpDescription A Class which extracts the MIB-data
from the database and makes some cal-culations and then prepares the finalreport with charts.
Dependencies -ResultConstructor.php-jpgraph.php

39
-jpgraph_line.php-jpgraph_date.php-Duration.php
Filename daemon.phpDescription A script which acts as a server program
and runs as a background process at theserver machine. It awaits any new sub-mitted measurements by the users. Onceit finds any it extracts information aboutit and starts a child-process to performthe job.
Dependencies ResultConstructor.php
Filename jpgraph.phpDescription A script included in jpgraph library
used to draw diagram-pictures with.Dependencies jp-config.inc
Filename jpgraph_date.phpDescription Classes to handle Date scaling with.Dependencies none
Filename jpgraph_line.phpDescription A class to do the line plotting.Dependencies Jpgraph_plotmark.inc
Filename jpgraph_gradient.phpDescription Creates a color gradientDependencies none
Data Layer (PHP & SQL)
Filename database.phpDescription A class which helps accessing informa-
tion from the system’s database.Dependencies constants.php

40
Appendix C (A final report generated by DSL Inspector)
Performance monitoring report started by operator veba00 with IP:192.168.9.2 onport EDA port:15006
Duration: 15 hStart time: 2005-12-06 16:53Stop time: 2005-12-07 07:53Show time: 4 h, 54 min, 50 secUnavailable time: 10 h, 5 min, 10 sec
Port configuration information:DSL mode: ADSL2+Configured NM(DS/US):Target NM: 8/8Max NM: 12/12Min NM: 0/0Min Downshift: 0s/0s
Configured bitrates:Max/Min Bitrate(DS): 26144/32Max/Min Bitrate(US): 1056/32
Performance information:CV DS: 86568CV US: 65ES DS: 17229ES US: 19Init attempts: 1517
Statistics for parameters:
Variable Min Max Mean Stdev
actual_brDS 0 16256 4988 4988actual_brUS 0 1055 337 337
attain_brDS 0 17140 5283 5283attain_brUS 0 1255 376 376
attenuation_DS 0 16 4 4attenuation_US 0 24 6 6
noise_margin_DS -9 12 3 3noise_margin_US 0 10 2 2

41

42

43

44
45

46

47
48

49
50

TRITA-CSC-E 2008:034 ISRN-KTH/CSC/E--08/034--SE
ISSN-1653-5715
www.kth.se