dsd-int 2015 - fews-risk a step towards risk-based flood forecasting - daniel bachmann
TRANSCRIPT

28. October 2015
FEWS-RISK: A STEP TOWARDS RISK-
BASED FLOOD FORECASTING
D. Bachmann
D. Eilander, A. de Leeuw, K. de Bruijn, F. Diermanse, A. Weerts, J.
Beckers, P. Gijsbers, M. Ponziani (Deltares, NL)
L. Boelee, C. Hazlewood, E. Brown (HR Wallingford, UK)
FEWS-User Days 2015, Deltares Delft

28. October 2015 Daniel Bachmann

28. October 2015
Common practice in operational flood forecast
Hydrology (catchment)
Hydrodynamic (river)
Meteorology (catchments)
Forecasted
process chain System river
t
h
Precipitation,
temperature,
wind etc.
Discharge
Water level
Water level
time series
Daniel Bachmann

28. October 2015
How to make a decision based on water levels?
Daniel Bachmann
• How will my flood defence line
perform?
• What will be the impacts of
flooding? Crisis
manager
System river
t
h
Water level
time series

28. October 2015
Extension by workflow 1
Hydrology (catchment)
Hydrodynamic (river)
Meteorology (catchments)
Forecasted
process chain
System river and flood
defence line
t
h
Water level
Failure
analysis (flood defence line)
In advance
Fragility
curve
Reliability
transformation
pf = 100%
Failure
probability
time series
Daniel Bachmann

28. October 2015
The concept of Fragility curves (FRC)
Summary of the performance or failure probability of a
structure depending to the load (e.g. water level [m])
Daniel Bachmann

28. October 2015
Determination of Fragility curves (FRC)
Daniel Bachmann
INPUT: Geometry, zonation, sub soil, soil
parameter etc.
28. October 2015
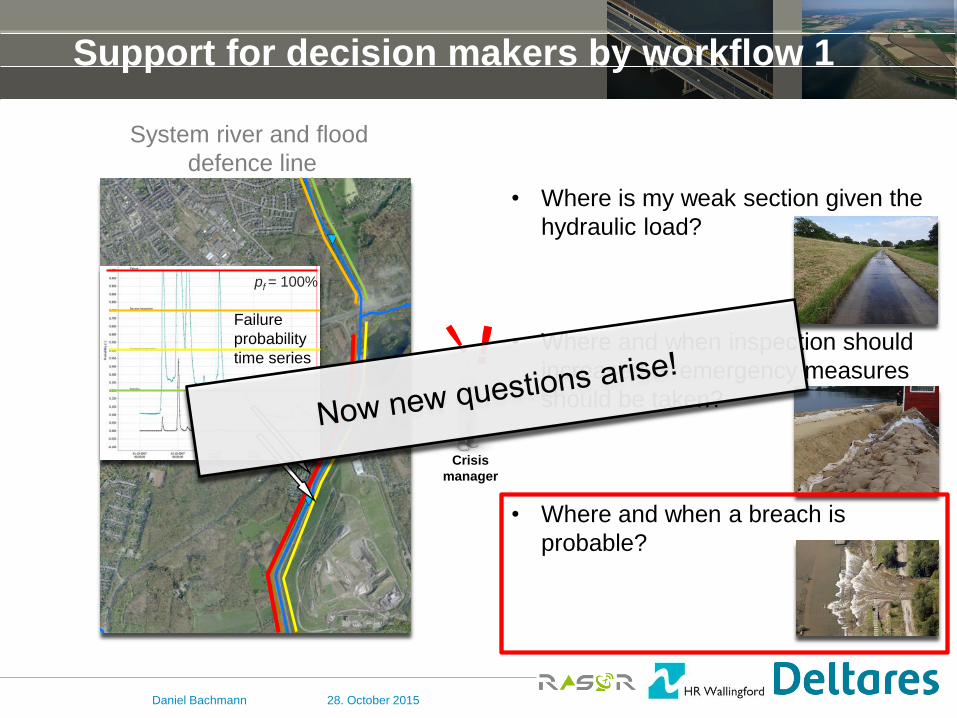
Support for decision makers by workflow 1
• Where is my weak section given the
hydraulic load?
• Where and when inspection should
increased or emergency measures
should be taken?
• Where and when a breach is
probable?
System river and flood
defence line
t
h
pf = 100%
Failure
probability
time series
Daniel Bachmann
Crisis
manager

28. October 2015
What happens if a breach occurs?
• How fast, how much and where the
water will flow?
• How relevant is the protection task
of this section?
• When and which emergency
measures should be triggered?
System river, flood
defense line, hinterland
Crisis
manager
Daniel Bachmann

28. October 2015
National Information system Floodmapping
Daniel Bachmann
Predicted hazard: Waterdepth after dike
failure for pre-calculated scenarios

28. October 2015
What happens if a breach occurs?
• How fast, how much and where the
water will flow?
• How relevant is the protection task
of this section?
• When and which emergency
measures should be triggered?
System river, flood
defense line, hinterland
Crisis
manager
Daniel Bachmann

28. October 2015
Extension by workflow 2
Breaching (flood defence line)
Impacts (protected area)
Police
Transformer
School
System river, flood
defence line, protected area
Hydrodynamic (river)
Hydrodynamic (protected area)
Forecasted
process chain
Water level
Discharge
Impacts to
people, critical
infrastructure
etc.
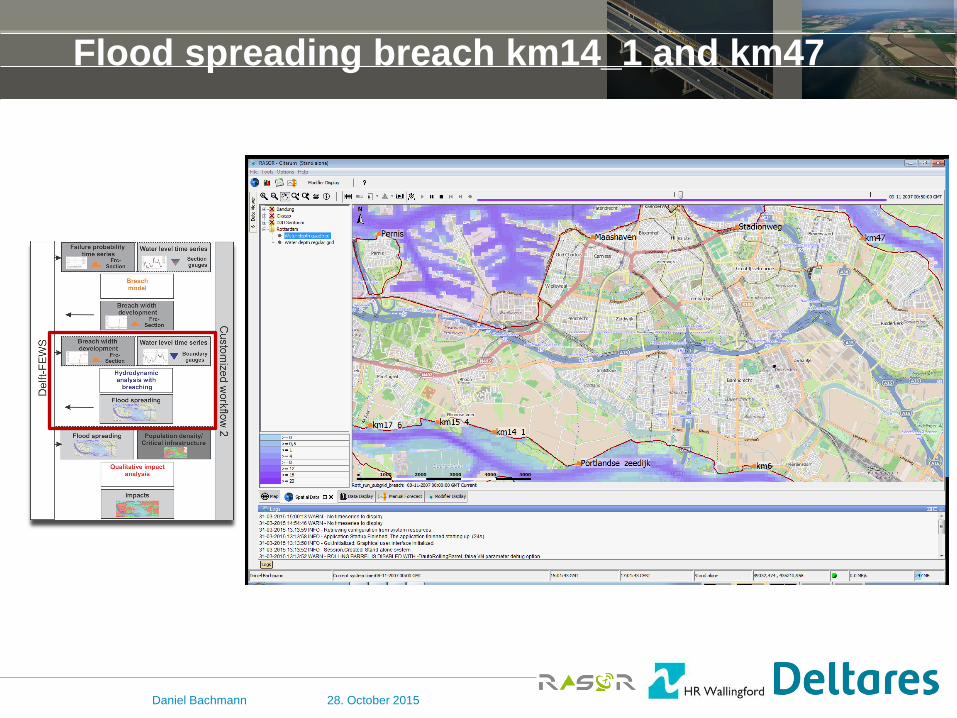
Flood spreading,
hydraulic values
Hospitall
Hydrology (catchment)
Daniel Bachmann

28. October 2015
Crisis
manager
Police
Transformer
School
System river, flood
defence line, protected area
Impacts to
people, critical
infrastructure
etc.
Flood spreading,
hydraulic values
Hospitall
Support for decision makers by workflow 2
Daniel Bachmann
• How fast, how much and where the
water will flow?
• How relevant is the protection task
of this section?
• When and which emergency
measures should be triggered?

28. October 2015 Daniel Bachmann

28. October 2015
The Rotterdam area and dike rings
• Western part of the Netherlands at the delta of Rhine
and Maas rivers to the North Sea
• Highly populated area (ca. 1.3 million people)
• High flood protection standards
Daniel Bachmann
Delft

28. October 2015
Reliability analysis
• 15 dike sections (14 in Ijsselmonde and 1 in Pernis)
• Pre-calculated fragility curves available
Daniel Bachmann

28. October 2015
Examples fragility curves
• Available fragility curves: km14_1, km47, Pernis
• Manipulated fragility curves: km14_1, km47 (demonstration
purpose); 50 % weaker as determined
Daniel Bachmann

28. October 2015
Hydrodynamic model: Discretization
• Tool: Subgrid software (part of 3di-package)
• 500 km² model domain with ca. 40 000 quad tree
elements (computational elements)
• Quad tree resolution: 100x100 m (min)/400x400 m (max)
• Subgrid resolution: 25x25 m (Lidar-data)
Daniel Bachmann

28. October 2015
Hydrodynamic model: Boundary condition
• 3 Dirichelet-boundary (water level time series 50 h model-time)
• Assumptions (demonstration purpose): • Based on flood event November 2007 (could be also forecasted
data);
• Maeslant-Barrier is not closing
• 25% increase of water levels
Daniel Bachmann
28. October 2015
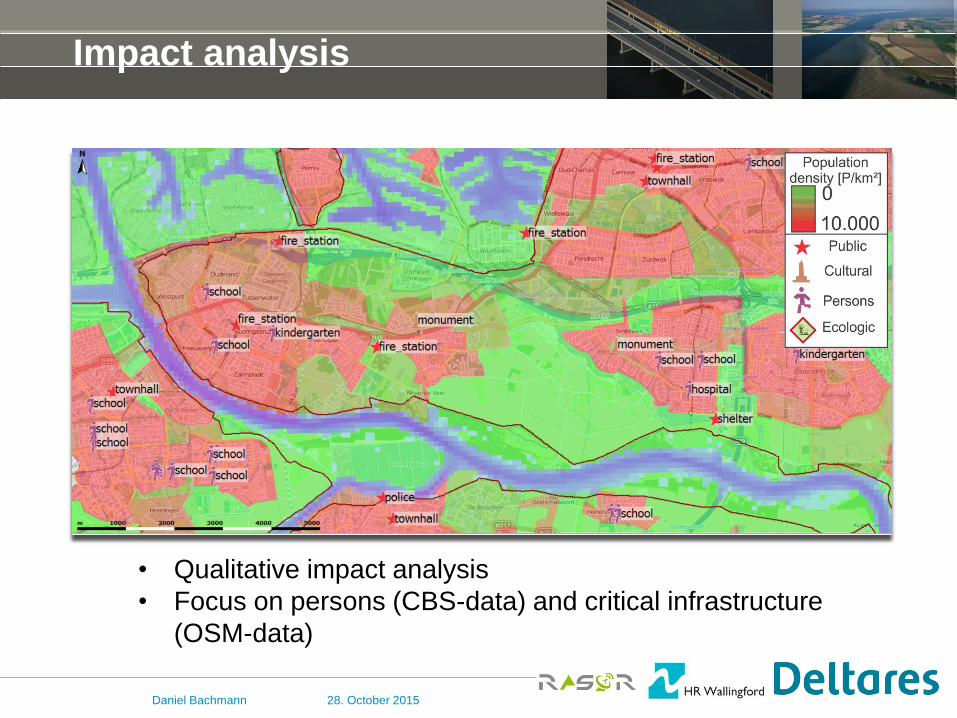
Impact analysis
• Qualitative impact analysis
• Focus on persons (CBS-data) and critical infrastructure
(OSM-data)
Daniel Bachmann

28. October 2015 Daniel Bachmann
28. October 2015
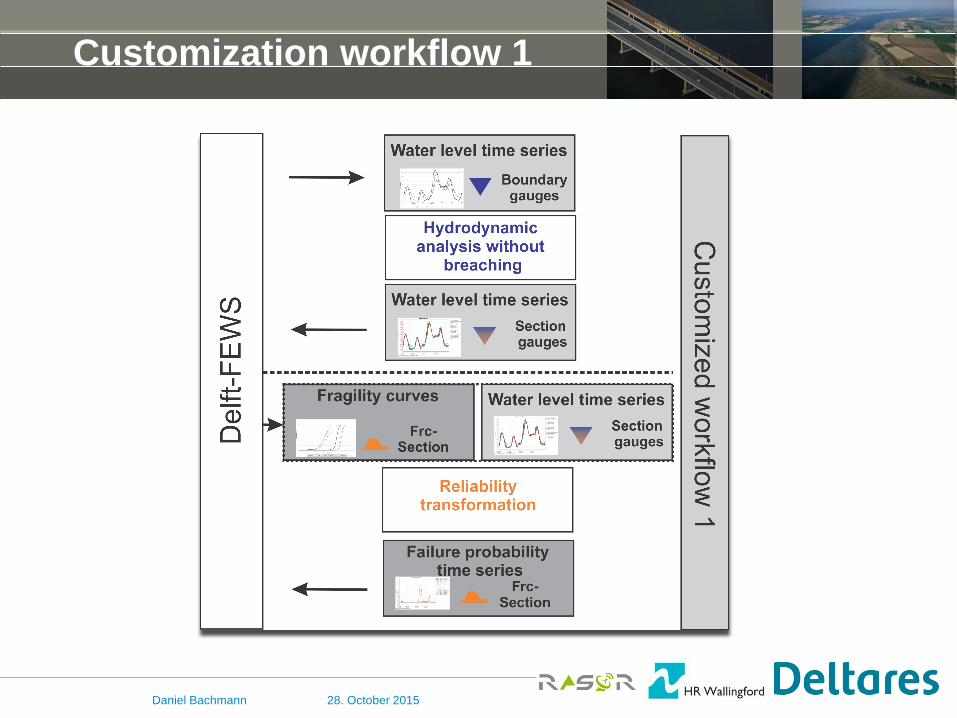
Customization workflow 1
Daniel Bachmann

28. October 2015
Hydrodynamic analysis without breaching
Daniel Bachmann
Computational time: ca. 45 min (Intel Core i5-
3230M CPU 2.60 GHz)
28. October 2015
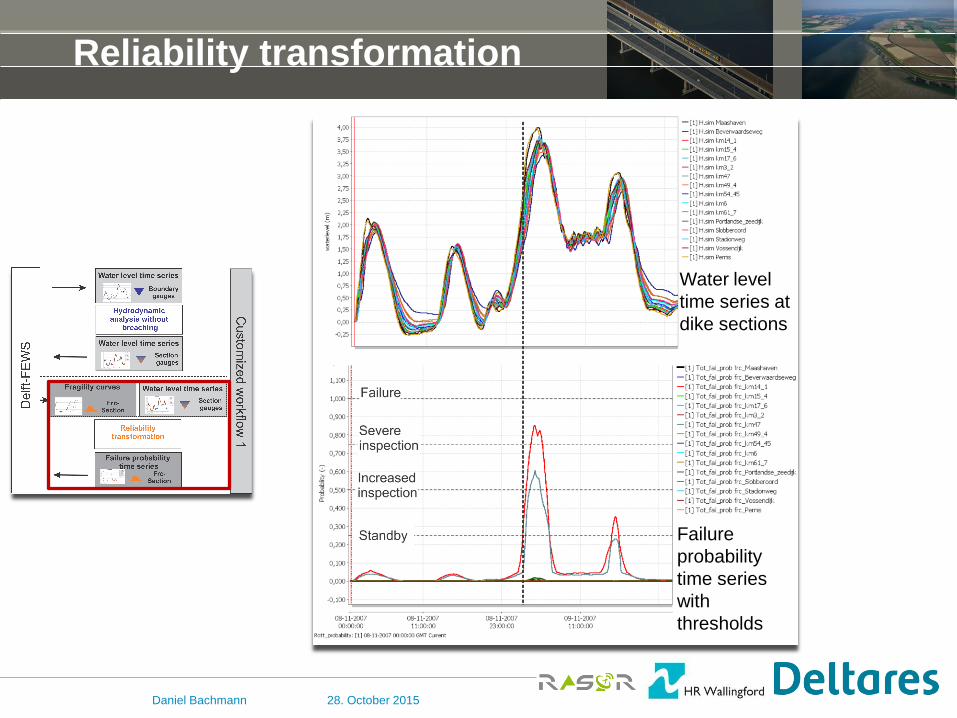
Reliability transformation
Daniel Bachmann
Failure
probability
time series
with
thresholds
Water level
time series at
dike sections

28. October 2015
Spatial distribution of dike performance
Daniel Bachmann

28. October 2015
Support for decision makers by workflow 1
• Where is my weak section given the
hydraulic load?
• Where and when inspection should
increased or emergency measures
should be taken?
• Where and when a breach is
probable?
Daniel Bachmann

28. October 2015 Daniel Bachmann

28. October 2015
Customization workflow 2
Daniel Bachmann

28. October 2015
Breach development
Daniel Bachmann
Starting
breach
development
by defined
failure
probability
(here 50 %)
Water level
time series at
dike sections
28. October 2015
Flood spreading breach km14_1 and km47
Daniel Bachmann

28. October 2015
Qualitative Impact analysis: What happens when?
Daniel Bachmann

28. October 2015
Qualitative Impact analysis and evacuation
Daniel Bachmann

28. October 2015
• How fast, how much and where the
water will flow?
• How relevant is the protection task
of this section?
• When and which emergency
measures should be triggered?
Crisis
manager
Support for decision makers by workflow 2
Daniel Bachmann

• Extend current operational flood forecast systems with
approaches of strategic flood risk analysis • Probability of failure
• Impact analysis
• Provide transformed and compact model-base
forecasted information to support decision makers • Weak spots in the flood defense line (Workflow 1)
• Impacts of flooding (Workflow 2)
• Supports the development and adaptation of emergency
measures in real-time
28. October 2015
Summary
Daniel Bachmann
28. October 2015
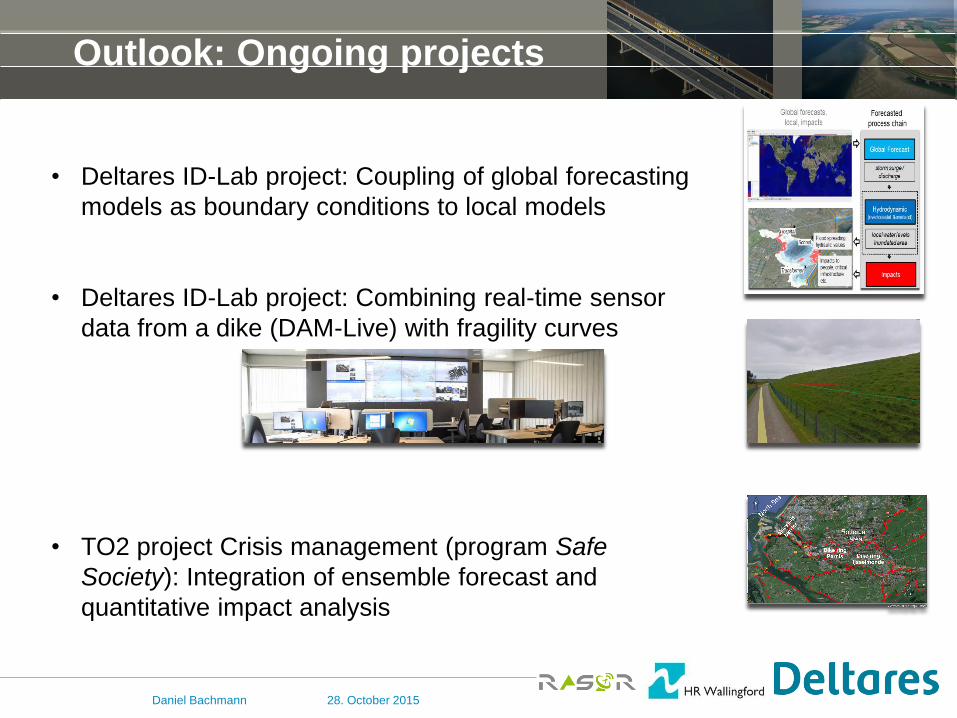
Outlook: Ongoing projects
Daniel Bachmann
• Deltares ID-Lab project: Coupling of global forecasting
models as boundary conditions to local models
• Deltares ID-Lab project: Combining real-time sensor
data from a dike (DAM-Live) with fragility curves
• TO2 project Crisis management (program Safe
Society): Integration of ensemble forecast and
quantitative impact analysis

28. October 2015
Outlook: Coupling to global models
Daniel Bachmann
Impacts
Police
Transformer
School
Global forecasts
Hydrodynamic (river/coastal &overland)
Forecasted
process chain
local water levels
Inundated area
Impacts to
people, critical
infrastructure
etc.
Flood spreading,
hydraulic values
Hospitall
Global Forecast
storm surge /
discharge
Local impact forecast

28. October 2015
Outlook: Combining with sensor data
Daniel Bachmann
Real time dike data,
e.g. seepage line
Precalculated
fragility curve

28. October 2015
Outlook: Including ensemble forecast
Daniel Bachmann
Precalculated
fragility curve
Ensemble forecast for
water level- time series
Ensemble forecast for failure
probability- time series
Ensemble forecast
for breach width-
time series

28. October 2015
Outlook: Including quantitative impact analysis
Daniel Bachmann
Ensemble forecast for flooding

28. October 2015 Daniel Bachmann
More information at the next FEWS-user
days 2016!

28. October 2015
FEWS-RISK: A STEP TOWARDS RISK-
BASED FLOOD FORECASTING
D. Bachmann
D. Eilander, A. de Leeuw, K. de Bruijn, F. Diermanse, A. Weerts, J.
Beckers, P. Gijsbers (Deltares, NL)
L. Boelee, C. Hazlewood, E. Brown (HR Wallingford, UK)
FEWS-User Days 2015, Deltares Delft