dropping out of high school and the place of career and technical
TRANSCRIPT

Dropping Out ofHigh School and
the Place ofCareer and
TechnicalEducation:
A Survival Analysis ofSurviving High School

This report is based on research conducted by the National Research Center for Career and Technical EducationUniversity of Minnesota
Distribution of this report is by theNational Dissemination Center for Career and Technical EducationThe Ohio State University
This report and related information are available at www.nccte.com.Additional printed, bound copies of the report are available from:
National Dissemination Center for Career and Technical EducationProduct Sales Office
The Ohio State University1900 Kenny Road
Columbus, Ohio 43210-1090800-678-6011 ext. 24277
Fax: 614-688-3258
Dropping Out of High School and the Place of Career and Technical Education
National Research Center for Career and Technical Education i
DROPPING OUT OF HIGH SCHOOL AND THE PLACE OF CAREER ANDTECHNICAL EDUCATION:
A SURVIVAL ANALYSIS OF SURVIVING HIGH SCHOOL
Stephen PlankStefanie DeLucaAngela Estacion
Johns Hopkins University
National Research Center forCareer and Technical Education
University of Minnesota
October 2005

Dropping Out of High School and the Place of Career and Technical Education
ii National Research Center for Career and Technical EducationN
FUNDING INFORMATION
Project Title: National Dissemination Center forCareer and Technical Education
National Research Center forCareer and Technical Education
Grant Number: V051A990004 VO51A990006
Grantees: The Ohio State UniversityNational Dissemination Center for Career and Technical Education1900 Kenny RoadColumbus, OH 43210
University of MinnesotaNational Research Center for Career and Technical Education1954 Buford AvenueSt. Paul, MN 55108
Directors: Floyd L. McKinney James R. Stone, III
Percentage of Total Grant Financedby Federal Money:
100% 100%
Dollar Amount of Federal Fundsfor Grant:
$1,100,000 $2,237,615
Act Under Which Carl D. Perkins Vocational and Applied Technology Education Amendments of 1998Funds Administered: Pub. L. No. 105-332
Source of Grant: Office of Vocational and Adult EducationU. S. Department of EducationWashington, DC 20202
Disclaimer: The work reported herein was supported under the National Dissemination Center forCareer and Technical Education, PR/Award (No. VO51A990004) and/or under theNational Research Center for Career and Technical Education, PR/Award (No.VO51A990006), as administered by the Office of Vocational and Adult Education,U.S. Department of Education.
However, the contents do not necessarily represent the positions or policies of theOffice of Vocational and Adult Education or the U.S. Department of Education, andyou should not assume endorsement by the federal government.
Discrimination: Title VI of the Civil Rights Act of 1964 states: “No person in the United Statesshall, on the ground of race, color, or national origin, be excluded fromparticipation in, be denied the benefits of, or be subjected to discrimination underany program or activity receiving Federal financial assistance.” Title IX of theEducation Amendment of 1972 states: “No person in the United States shall, on thebasis of sex, be excluded from participation in, be denied the benefits of, or besubjected to discrimination under any education program or activity receivingFederal financial assistance.” Therefore, this National Dissemination Center forCareer and Technical Education and the National Research Center for Career andTechnical Education project, like every program or activity receiving financialassistance from the U.S. Department of Education, must be operated in compliancewith these laws

Dropping Out of High School and the Place of Career and Technical Education
National Research Center for Career and Technical Education iii
ACKNOWLEDGEMENTS
An earlier version of this paper was presented at the 2004 annual meeting of the AmericanSociological Association in San Francisco, CA. We thank James Stone III, James Rosenbaum,Russell Rumberger, Charles Bidwell, and Doris Entwisle for comments and suggestions. SarahBarnard provided research assistance. Direct correspondence to any of the authors [email protected], [email protected], or [email protected].

Dropping Out of High School and the Place of Career and Technical Education
iv National Research Center for Career and Technical EducationN
Dropping Out of High School and the Place of Career and Technical Education
National Research Center for Career and Technical Education v
TABLE OF CONTENTS
Acknowledgements ......................................................................................................................... iii
Abstract...........................................................................................................................................vii
Dropping Out of High School and the Place of Career and Technical Education:
A Survival Analysis of Surviving High School........................................................................... 1
Career and Technical Education ................................................................................................. 1
Research on Dropping Out ........................................................................................................ 3
CTE and Possible Links to Dropping Out ................................................................................. 4
Data Source................................................................................................................................ 9
Modeling Strategy.................................................................................................................... 10
Variables .................................................................................................................................. 11
Results ..................................................................................................................................... 13
Discussion and Conclusions.................................................................................................... 25
Appendix A. Unweighted Descriptive Statistics for NLSY97 Sample MembersBorn in 1980 and for Transcript Subsample ............................................................................ 29
Appendix B. Use and Preparation of NLSY97 High School Transcript Data ................................ 31
References...................................................................................................................................... 33
List of Figures
Figure 1. Hypothesis of positive linear association .......................................................................... 6
Figure 2. Hypothesis of negative linear association.......................................................................... 7
Figure 3. Hypothesis of no association............................................................................................ 7
Figure 4. Hypothesis of curvilinear association................................................................................ 8
Figure 5. Distribution of age (in months) at time of NLSY97 R1 Interview (N = 1,628)................ 13
Figure 6. Distribution of age (in months) upon initial entry into ninth grade (N = 1,628).............. 14
Figure 7. Distribution of age (in months) at time of dropout spell (first spell after entryinto ninth grade) for those who did have such a spell (n = 379)............................................... 15
Figure 8. Distribution of month at which dropout occurred (relative to initial entry intoninth grade) for those who did drop out (n = 379)................................................................... 16
Figure 9. Estimated effects of coursetaking ratio on log-hazard of dropping out for twosubsamples defined by age at initial ninth-grade entry ............................................................. 24
Dropping Out of High School and the Place of Career and Technical Education
vi National Research Center for Career and Technical EducationN
List of Tables
Table 1. Percentage With Dropout Event by R3, High School Diploma by R5, and AnyHigh School Credential by R5: Weighted Data for NLSY97 Sample Members Bornin 1980 (N = 1,628).................................................................................................................. 17
Table 2. Percentage of Dropouts and Non-Dropouts Attaining High School Diploma orAny Credential by R5: Weighted Data for NLSY97 Sample Members Born in 1980(N = 1,628)............................................................................................................................... 18
Table 3. Effects on Hazard Ratio (Based on Cox Nonproportional Hazards Model ofDropping Out) for NLSY97 Sample Members Born in 1980 With Available TranscriptData (n = 846).......................................................................................................................... 20
Table 4. Effects on Hazard Ratio (Based on Cox Nonproportional Hazards Model ofDropping Out) for Two Subsamples Defined by Age at Initial Ninth-Grade Entry(n = 846).................................................................................................................................. 23

Dropping Out of High School and the Place of Career and Technical Education
National Research Center for Career and Technical Education vii
ABSTRACT
Data from the National Longitudinal Survey of Youth 1997 are used to examine the associationbetween the CTE-to-academic-coursetaking ratio and the likelihood of dropping out. Descriptivestatistics are presented for 1,628 individuals born in 1980. Transcript and survey data are then usedin estimating nonproportional hazards models with time-varying covariates for a subsample of 846youth. The research found a highly significant curvilinear effect of the coursetaking ratio on thelikelihood of dropping out for youth who were less than 15 years old upon entering 9th grade. Forthem, a CTE:academic course ratio of 1:2 was beneficial. For youth who were 15 or older uponhigh school entry, factors other than coursetaking predicted their high rates of dropping out.

Dropping Out of High School and the Place of Career and Technical Education
viii National Research Center for Career and Technical EducationN
Dropping Out of High School and the Place of Career and Technical Education
National Research Center for Career and Technical Education 1
DROPPING OUT OF HIGH SCHOOL AND THE PLACE OF CAREER ANDTECHNICAL EDUCATION:
A SURVIVAL ANALYSIS OF SURVIVING HIGH SCHOOL
The high school curriculum can be viewed as a socially structured set of opportunities andconstraints. An individual course may represent an opportunity for inspired learning, establishing orstrengthening social contacts, boredom, discouragement, or many other outcomes. Beyond anindividual class, the combination of all courses taken throughout an entire high school career define,to a considerable degree, a student’s place within a fuller landscape of opportunities—andconstraints.
In order to gain some understanding of students’ curricular experiences, we focus on thebalance struck between career and technical education (CTE) and core academic courses. Using theNational Longitudinal Survey of Youth 1997, we find students combining CTE and academiccourses in many ratios and qualitative patterns. As such, we do not limit ourselves to notions of apurely academic (or college prep) curriculum, as contrasted with a strictly CTE (or vocational)curriculum. Rather, we examine curricular exposure and outcomes for students at many pointsalong a continuum of CTE and academic coursetaking.
Our primary aim is to examine dropping out of high school and any association it might havewith CTE coursetaking. Guided by prior research, we view dropping out as being, most often, aculminating event in a process of disengagement from education (Alexander, Entwisle, & Kabbani,2001; Finn, 1989). To acknowledge that dropping out is a process, it is important to account for theexperiences, achievements, and traits an individual brings to the first day of high school. In turn, it isimportant to examine high school experiences, including curricular exposure and achievement, asthey unfold over time.
Guided by these priorities, we present hazards (or survival, or event history) models of highschool dropout events. Hazards models come from a family of statistical models that are useful fordescribing the timing of life course events and for building statistical models of the risk of anevent’s occurrence over time (Willett & Singer, 1991). By examining individuals’ coursetakingpatterns along with other relevant factors, we hope to gain insight into processes of engagement anddisengagement from formal schooling. We aspire to add to the body of knowledge about the pushand pull factors existing in and around high schools. We make a case for understanding curricularofferings and experiences as being parts of socially patterned and institutionalized structuresleading to engagement for some adolescents and disengagement for others.
Career and Technical Education
Career and technical education has evolved from what has traditionally been called vocationaleducation. Whether this evolution has been dramatic or relatively minor is open to debate (DeLuca,Plank, & Estacion, 2005; Stone, 2000). Historically most vocational education programs weredesigned to prepare students for work and help them enter the workforce shortly after high school.During the past 10 or 15 years, there have been efforts to enhance and modify vocational educationprograms so that they not only prepare students for jobs but also increase educational attainment—both by raising students’ probability of completing high school and by increasing the number ofstudents entering and completing postsecondary programs.
Recent federal legislation, as well as the professional association dedicated to CTE, present avision of CTE that involves not only the development of practical skills needed in the workplace, butalso an integration of CTE and academic subjects, an erasure of the stigma often attached to

Dropping Out of High School and the Place of Career and Technical Education
2 National Research Center for Career and Technical EducationN
vocational education, and pathways to both postsecondary education and employment (Castellano,Stringfield, & Stone, 2003; Lynch, 2000). Stone (2000) describes an ideal for CTE by whichstudents are prepared for the contemporary workplace through three nonexclusive approaches: (a)education that uses work as a context for developing broader general skills, (b) education that useswork as a context for developing more widely recognized skills required for long-term occupationaland career success, and (c) education that uses work as a context for developing occupationallyspecific skills. These three approaches can be referred to as education through work, educationabout work, and education for work.
Formal high school courses typically categorized as career and technical education include (1)family and consumer sciences, (2) general labor market preparation, and (3) various courses in 10specific labor market preparation (SLMP) areas (National Center for Education Statistics, 1999).Family and consumer sciences courses would include (among many) the following specific titles:(a) home economics, (b) child development, (c) foods and nutrition, and (d) family relations.General labor market preparation courses would include the following titles: (a) basic keyboarding,(b) exploratory industrial arts, (c) college and career planning, and (d) introduction to technology.
The 10 SLMP areas are
• agriculture and renewable resources
• business
• marketing and distribution
• health care
• public and protective services
• trade and industry
• technology and communications
• personal and other services
• food service and hospitality
• child care and education
SLMP courses are a combination of classroom-based learning experiences, cooperativeeducation, and other workplace learning.
While not every United States high school offers courses across the full range of CTE, mostschools offer some CTE courses (National Center for Educational Statistics, 2001). Furthermore,the great majority of high school students take some CTE. In recent years, between 90 and 96% ofUnited States high school graduates have taken at least one CTE course during high school(DeLuca, Plank, & Estacion, 2005; Levesque, Lauen, Teitelbaum, Alt, & Liebrera, 2000). Theaverage number of Carnegie units earned in CTE among graduates in the year 2000 was 3.8(National Center for Educational Statistics, 2004).

Dropping Out of High School and the Place of Career and Technical Education
National Research Center for Career and Technical Education 3
CTE is not without its critics, and its place within the American high school is not especiallysecure. Recent federal budget debates, taking place at a time when increased emphasis is beingplaced on testing and core academic areas, have questioned the effectiveness and merit of CTE(Cavanagh, 2005). Proponents, however, view CTE as an important part of the high schoolenvironment and a valuable source of attachment, motivation, and learning for some students (Arum,1998, 2003; Castellano, Stringfield, & Stone, 2003). Before discussing potential links between CTEand the likelihood of dropout events, we first turn to a more general summary of research andissues that surround dropping out of high school.
Research on Dropping Out
The phenomenon of students dropping out of high school is a matter of great concern and hasreceived considerable research attention (e.g., Fine, 1991; Finn, 1989; Orfield, 2004). The reasonsfor dropping out involve a web of sociological, psychological, economic, and institutional factors.The consequences of dropping out are dramatic and costly—both for individuals and for society.
Rumberger (2001) reports that, despite a long-term upward trend in high school completion inthe United States, approximately 5% of all high school students drop out of school in any givenyear.1 Furthermore, a substantially higher proportion of students leave school for a significant spanof time sometime during the educational career before receiving a high school credential. Klermanand Karoly (1994) estimated that 37% of a national sample of young men who were 14 to 21 yearsof age in 1979 quit high school for at least a 3-month period sometime before high schoolcompletion. Rumberger and Lamb (1998) reported that 21% of students from the NELS:88 cohortdropped out of school at some point after eighth grade but before high school completion. In bothstudies, many of those with spells of dropping out ultimately returned to complete a high schoolcredential. Often, however, they earned a GED rather than a traditional diploma. And, as pastresearch has shown and the present analysis reiterates, any time away from high school increasesthe risk of never completing that level of schooling.
The consequences or negative outcomes associated with dropping out of high school include ahigher rate of unemployment, a greater likelihood of living below the poverty line and relying onpublic assistance, more frequent and severe health problems, and increased criminal activity(Educational Testing Service, 1995; McDill, Natriello, & Pallas, 1986; Mishel & Bernstein, 1994;National Research Council, 1993; Rumberger, 1987; U.S. Department of Education, 1999). As theeconomy of the United States demands a higher skilled labor force year by year, individuals withouta high school credential will find it increasingly difficult to thrive or survive economically. Further,failure to complete high school virtually precludes attendance at institutions of higher learning, sothat avenue toward higher social and economic status and mobility is blocked for the high schooldropout.
Research into the causes of dropping out, as well as the search for practical solutions to reducethe dropout rate, have focused on both individual and institutional factors. Further, they havefocused on both push and pull factors. Finn (1989) offered two social–psychological perspectives.
1 This number (“approximately 5%”) follows from the event dropout rate calculation employed by the NationalCenter for Education Statistics as described in Kaufman, Kwon, Klein, and Chapman (1999). See also Kaufman, Alt,and Chapman (2004). The event dropout rate for a given year is the proportion of youth ages 15–24 who wereenrolled in high school in one October but who had left high school without successfully completing a high schoolprogram (whether traditional diploma, GED, or other credential) by the next October. For discussions of alternativeways to calculate dropout rates and/or high school completion rates, see Swanson and Chaplin (2003), Balfanz andLegters (2004), and Miao and Haney (2004).

Dropping Out of High School and the Place of Career and Technical Education
4 National Research Center for Career and Technical EducationN
Following a frustration–self-esteem model, Finn posited that a record of poor performance wouldcause students to question their competence and weaken their attachment to school; at the extreme,this process can lead to the ultimate disengagement—dropping out. Under a participation–identification model, it is posited that positive experiences encourage a sense of belonging and thusstrengthen attachment to school. Alexander, et al. (2001) have noted that these two parallel modelsor images ultimately imply the same conclusion, at least at a certain level of abstraction. They write,“Affective detachment from school is the immediate impetus to dropout, but whether children’sschool attachment is strong or weak develops over time as a result of their cumulative experiencethere: Are they fitting in comfortably and realizing success or are they struggling and not measuringup academically?” (p. 763).
Rumberger (2004) finds it useful to draw upon both individual and institutional perspectives tounderstand decisions to quit school. The individual perspective focuses on a students’ values,attitudes, and behaviors, and considers dropping out of school to be the final stage in a dynamic andcumulative process of disengagement from school—both academic and social disengagement (seealso Newmann, Wehlage, & Lamborn, 1992; Wehlage, Rutter, Smith, Lesko, & Fernandez, 1989).Rumberger’s institutional perspective situates individual attitudes and behaviors within the broadersettings or contexts in which students live—most notably families, schools, and communities.
CTE and Possible Links to Dropping Out
If participation in career and technical education has some relationship to dropping out of highschool, we need to understand the nature of this relationship better. Research in this area can haveimplications for our conceptual understanding of what helps students find attachment to highschool. Additionally, research in this area could have policy or practical implications for secondaryeducation, as decisions are made about where dollars should be invested and how curriculumshould be organized.
Is CTE part of a persistent pattern of tracking and stratification within American high schools,whereby some students are inspired to develop increasingly strong attachments to schooling and toprepare themselves for postsecondary educational endeavors, while other students are graduallydiscouraged or disengaged from formal schooling? Or is there a model of CTE in the Americanhigh school that is markedly different from what vocational education might have been (or, at least,might have been perceived to have been) in past decades? Are some schools integrating coreacademic curricula with CTE in ways that motivate and inspire students? Can CTE be a source ofgreater attachment to school, higher rates of high school completion, and successful transitions topostsecondary education and/or satisfying careers?
The question of whether vocational, or career and technical, education can help prevent studentsfrom dropping out of high school has been posed by researchers periodically for several decades(e.g., Agodini & Deke, in press; Bishop, 1988; Catterall & Stern, 1986; Coombs & Cooley, 1968;Grasso & Shea, 1979; Mertens, Seitz, & Cox, 1982; Perlmutter, 1982; Pittman, 1991; Rasinski &Pedlow, 1998; Weber, 1988). Despite fairly frequent attempts to address the issue, a clear andconsistent answer still has not emerged. Kulik (1998) provides a useful review of most of therelevant studies from the late 1960s until the early 1990s. After considering simple descriptivestudies and also studies with experimental designs and/or statistical controls, he concluded thatparticipation in vocational programs increased the likelihood that non-college-bound youth wouldcomplete high school. Specifically, he estimated that participation (as a dichotomous, yes–noproposition) decreased the dropout rate of such youngsters by about 6%. One important pointmade by Kulik is that the conclusions we draw about dropout likelihoods for vocational studentsdepend greatly on how we identify these students. The various studies reviewed used a combinationof student self-categorizations of curricular placement (as stated either early or late in high school)

Dropping Out of High School and the Place of Career and Technical Education
National Research Center for Career and Technical Education 5
and official transcript records of coursetaking. Kulik concluded that transcript records of students’courses provide the best indicator of their contact with vocational education.
Despite Kulik’s (1998) overall conclusion of a positive direct effect of vocational education onhigh school completion, some studies find no such effects (e.g., Agodini & Deke, in press; Pittman,1991). There is a clear need for rigorous analyses of data that are rich in detail about the occurrenceand timing of dropout events, as well as students’ locations within the high school curriculum.There is also a need for clear thinking about why we might expect certain forms or admixtures ofcareer and technical education (or vocational education) to reduce likelihoods of dropping out. Arecent study by Bishop and Mane (2004) provides a succinct statement of one line of reasoning.Bishop and Mane quote a 2003 report of the Advisory Committee for the National Assessment ofVocational Education as follows:
Career and technical education empowers students by providing a range of learningopportunities that serve different learning styles. CTE relies on a powerful mode ofteaching and learning that cognitive scientists call “contextual” or “situated” learning,both in classrooms and in workplaces. For many students, applying academic and technicalskills to real-world activities, using computers and other tools, and being able to see howtheir learning is related to the world of work make CTE classes more interesting andmotivating, and more educationally powerful than standard academic classes. A careerfocus often gives students a sense of direction and motivates them to achieve and to stay inschool. Practically inclined students can be hooked on academic learning through CTEstudy. . . . Just having the option of being able to concentrate in CTE in high school resultsin more young people staying in school because more individually relevant choices areavailable to them. (Advisory Committee for the National Assessment of VocationalEducation, 2003, p. 2)
It would seem that the advisory committee’s statement is an article of faith or belief as much asit is a summary of established knowledge based upon rigorous research. In any case, however, it isan accurate representation of an argument offered by many CTE advocates. When educators orcommentators argue for the importance of CTE in the high school curriculum, they generally offersome combination of the following reasons for why CTE classes can reduce dropout rates: (a)students may find CTE classes more interesting than academic classes; (b) some students may bemore likely to see the value of CTE classes than of academic classes in preparing them for careersof interest; (c) CTE classes can clarify the value of academic classes by specifying the skills neededto succeed in careers of interest, and thereby lead students to see a greater value associated withstaying in school; and (d) CTE classes may encourage some students to define career goals, andthereby keep them more engaged in school.2
Four Competing Possibilities
For any academic term (i.e., semester, quarter, year), or for a high school career cumulatively, astudent’s ratio of CTE credits to core academic credits can be computed (assuming the number ofacademic credits is not zero).3 Past research has found this coursetaking ratio to be a significantpredictor of high school dropout rates, and also a convenient way to summarize a student’s location
2 We thank an anonymous reviewer for helping us articulate these four arguments.3 Throughout this report, CTE courses and core academic courses are defined in the calculation of the curricular ratioas follows: CTE includes all courses in family and consumer sciences, general labor market preparation, and thespecific labor market preparation (SLMP) areas; core academics include all courses in mathematics, science, Englishor language arts (though not foreign language), and social studies (including history).

Dropping Out of High School and the Place of Career and Technical Education
6 National Research Center for Career and Technical EducationN
within the high school curriculum in an era in which rigid track definitions (e.g., college-prep,purely vocational) do not always apply (Plank, 2001).
Figures 1 through 4 illustrate four competing hypotheses about the relationship between theCTE-to-academic-coursetaking ratio and the likelihood of dropping out.4 Each of these figures isintended to display a possible relationship between the coursetaking ratio and the likelihood ofdropping out once other relevant factors (i.e., prior test scores, high school grade point average,gender, race, socioeconomic status) have been controlled.
Figure 1 shows a positive linear relationship consistent with the assertion that higher levels ofCTE are harmful. Critics of the vocational track in United States high schools might subscribe tothis expectation, claiming that increased levels of CTE (or vocational) coursetaking represent astudent being pushed toward the periphery of the high school’s core mission and receivinguninspiring instruction and learning opportunities that raise the likelihood of that student decidingto leave school.
0.0 0.2 0.4 0.6 0.8 1.0 1.2
CTE-to-Academic-Coursetaking Ratio
Lik
elih
ood
of D
ropo
ut
Figure 1. Hypothesis of positive linear association.
Figure 2 shows a negative linear relationship consistent with the expectation that higher levels ofCTE are beneficial. This hypothesis is plausible if we imagine that some students attend highschools with few CTE offerings while other students attend high schools with considerably greaterCTE offerings, and that in both types of high schools there are some students who would find CTEcourses to be motivating and a source of attachment to school. Following the logic of the AdvisoryCommittee for the National Assessment of Vocational Education (quoted earlier), the hypothesis isthat just having the option of being able to concentrate in CTE in high school results in more youngpeople staying in school because more individually relevant choices are available to them.
4 The vertical axis in each figure is labeled likelihood of dropping out, but in practice this axis would measure log-odds or log-hazards.

Dropping Out of High School and the Place of Career and Technical Education
National Research Center for Career and Technical Education 7
0.0 0.2 0.4 0.6 0.8 1.0 1.2
CTE-to-Academic-Coursetaking Ratio
Lik
elih
ood
of D
ropo
ut
Figure 2. Hypothesis of negative linear association.
Figure 3 represents a hypothesis of no effect. This hypothesis is consistent with the idea that thesubstance of coursetaking itself has no independent effect on dropout likelihood. That is, it mightbe the case that the CTE-to-academic ratio has no significant independent effect on dropoutlikelihood once other relevant factors have been controlled.
0.0 0.2 0.4 0.6 0.8 1.0 1.2
CTE-to-Academic-Coursetaking Ratio
Lik
elih
ood
of D
ropo
ut
Figure 3. Hypothesis of no association.

Dropping Out of High School and the Place of Career and Technical Education
8 National Research Center for Career and Technical EducationN
Finally, Figure 4 depicts a curvilinear relationship by which the likelihood of dropping out initiallydecreases as the CTE-to-academic ratio increases, but only until some point of inflection. Beyondthis point of inflection, the likelihood of dropping out increases as the CTE-to-academic ratioincreases. Plank (2001), using a logistic regression framework, found a pattern similar to Figure 4.In that article, he reported a highly significant and intriguing nonlinear association between the ratioof CTE-to-academic courses taken during the high school career and the risk of dropping out.Specifically, a ratio of approximately three CTE courses for every four core academic courses(defined as math, English, science, social studies, and history) was associated with the lowest oddsof dropping out of high school. Ratios either higher or lower than 3-to-4 were associated with anincreased risk of dropping out. The association was especially salient for individuals whose pre-high-school test scores and high school grades were low (and who, thereby, had relatively highbaseline risks of dropping out independent of any coursetaking effects). Plank speculated—butcould not conclude definitively—that the high school experiences of students exposed to thismiddle-range mix of CTE and core academic courses were more satisfying, inspiring, andconducive to a strong attachment to school than were the experiences of other students.
0.0 0.2 0.4 0.6 0.8 1.0 1.2
CTE-to-Academic-Coursetaking Ratio
Like
lihoo
d of
Dro
pout
Figure 4. Hypothesis of curvilinear association.
While this earlier finding is intriguing, there are certain methodological shortcomings that needto be addressed. The models in Plank’s (2001) study were standard logit models, as have beenmost models of dropping out of high school presented in journals in the past several decades(Willett & Singer, 1991). When studying effects of coursetaking (and many other variables ofinterest), there is a potential problem of reverse-causality. It is a fact that students tend to take moreCTE courses in the last 2 years of high school than in the first 2 years (Levesque et al., 2000). Theobserved association might have been driven by the fact that only those who persisted to the finalyears of high school (i.e., did not drop out) were appropriately situated to attain a relatively high (or,at least, middle-range) CTE-to-academic ratio. If this account reflects reality, it is not the middle-range curricular ratio that prevents dropping out; rather, it is the absence of dropping out that allowssome students to attain the middle-range curricular ratio.
A well-specified hazards model with time-varying covariates reflecting the curricular mixexperienced up to a given month (or semester) can help to disentangle these questions about causalordering. More generally, a hazards model can offer insights into the unfolding process ofengagement or disengagement, of attachment or detachment, of decreasing or increasing risk ofdropping out over time. In the present report, we determine whether the earlier finding of an

Dropping Out of High School and the Place of Career and Technical Education
National Research Center for Career and Technical Education 9
association between curricular mix and the likelihood of dropping out stands up to more rigorousand appropriate analytic methods. More generally, we want to continue the line of inquiry involvingthe relationship between CTE (as one part of students’ broader high school experiences) anddropping out.
Data Source
Our data come from the National Longitudinal Survey of Youth (NLSY97). NLSY97,sponsored by the Bureau of Labor Statistics (U.S. Department of Labor), tracks a nationallyrepresentative sample of 8,984 youths living in the United States who were 12 to 16 years old as ofDecember 31, 1996. There are currently seven rounds of NLSY97 data available.5 The studycollects detailed information about youth labor market, educational, and developmental experiences.
It also provides contextual information through parent interviews and transcript data gathered as theyouths leave high school.
We focus on a subsample of the oldest NLSY97 participants—those born in 1980. Althoughseven rounds of data are currently available, we limit our attention to whether an individual hadexperienced a spell of dropping out between the time of initial entry into ninth grade and the time ofthe NLSY97 Round 3 (R3) interview. Therefore, information collected as a part of the R1, R2, andR3 interviews, and reports of events that occurred in the periods leading up to these interviews, arecentral to our analyses. The R1 interview is generally known as the 1997 interview, R2 as 1998, andR3 as 1999, although we give more precise detail on survey dates in the coming paragraphs. Weuse student interview data from three rounds, parent data from R1, and high school transcript dataon course titles, credits, grades, and the dates of academic terms. We also use information fromRounds 4 and 5 (Years 2000 and 2001, respectively) to establish dates of high school diplomareceipt or GED receipt, which sometimes occurred after the time of the R3 interview.
The R1 interviews were conducted during a rather wide window (actually two windows) of datacollection. These interviews were conducted between February 1997 and October 1997 for mostindividuals, and between March 1998 and May 1998 for a smaller set. Thus, as reflected in Figure5, an individual born in 1980 could have been anywhere between 16-years-and-2-months (194months) and 18-years-and-3-months (219 months) of age at the time of the R1 interview.
The R2 interviews were conducted between October 1998 and April 1999, encountering themembers of the 1980 birth cohort when they were between ages 17-years-and-10-months and 19-years-and-4-months. The R3 interviews were conducted between October 1999 and April 2000,when the cohort members were between 18-years-and-10-months and 20-years-and-3-months.These dates and ages are important to keep in mind as we construct our dropout indicator.Ultimately, we analyze whether an individual had a dropout spell (defined as 30 days or more awayfrom school for a reason other than vacation) between the time of initial entry into high school andthe time of the R3 interview (or high school graduation, whichever came first).6 With this goal inmind, we note that following the 1980 cohort members until they were between 18.83 years and20.25 years allows for a quite comprehensive analysis of high school careers, dropping out, anddegree completion without severe problems of censoring.
5 The present analyses primarily use data from Rounds 1 through 3, and extend to Round 5 only for a few aspects ofvariable construction or back-filling of information missing in earlier rounds.

Dropping Out of High School and the Place of Career and Technical Education
10 National Research Center for Career and Technical EducationN
Modeling Strategy
After some initial descriptive statistics, we present estimates from Cox regression models—themost commonly used variant of hazards models (Allison, 1995). We aspire to develop a well-specified hazards model of the process of dropping out to improve upon standard logit models.Numerous authors have noted that dropping out is best conceptualized as a process rather than anevent (Alexander et al., 2001; Finn, 1989). Nuanced issues of the influence of early experiences onlater decisions or behaviors, the time-varying nature of key predictors, the nonconstant level of riskthat individuals may experience over time, and varying lengths of exposure to risk among thevarious subjects in a study are addressed by hazards models in ways that a standard logit modelwith one record (or observation) per study subject simply cannot address (Allison; Willett &Singer, 1991).
The final models presented within this report are nonproportional hazards with time-varyingcovariates.7 The models were estimated using SAS PROC PHREG, and specifying the “exact”method for dealing with tied event times—i.e., instances in which two or more individuals droppedout of high school after the same number of months had elapsed from their initial entry into ninthgrade (Allison, 1995, chap. 5). The general model can be written as
hi(t) = λ0(t)exp{ββββΧΧΧΧ i + ββββΧΧΧΧ i(t)}.
This equation indicates that the hazard for individual i dropping out of school at time t, giventhat he or she has not dropped out before time t, is the product of two factors: (a) a baseline hazardfunction λ0(t) that is left unspecified, except that it cannot be negative, and (b) a linear function of aset of fixed and time-varying covariates, which is then exponentiated.
For our analyses, the period of observation (the observed risk period) begins with the 1st monthin which an individual begins ninth grade. The “event” of interest is a dropout event. Therefore, theobservation period ends when an individual experiences this event for the first time, but can also endwith (a) the receipt of a high school diploma, or (b) right-censoring via the occurrence of the R3interview.8 Our unit of analysis is the person-month, with varying start months, lengths of riskperiod, and method of leaving the risk set.
6 For individuals who did not participate in the R3 interview (i.e., participated only in the R1 and possibly R2interviews), the observed risk period will be censored by a dropout event, high school graduation, or the lastavailable interview—whichever occurred first.7 For our models, it is the presence of time-dependent covariates that makes them nonproportional hazards models(Allison, 1995). Proportional hazards models are characterized by the ratio of any two individuals’ hazards beingconstant over time. Thus, if one would graph the log hazards for any two individuals against time, the hazardfunctions would be strictly parallel. In contrast, in our nonproportional models, the time-dependent covariates changeat different rates for different individuals, so the ratios of their hazards do not (cannot) remain constant. We do notinclude interactions of nonvarying covariates with time in our models, which is another situation in whichnonproportional models are being estimated by others. We did investigate such interactions with time, but they werenot generally significant.8 Or the R1 or R2 interview, if later interviews were not completed.

Dropping Out of High School and the Place of Career and Technical Education
National Research Center for Career and Technical Education 11
Variables
The dependent variable indicates the event of being away from school for 30 days or more for areason other than a vacation at some time after the initial enrollment in ninth grade. Informationabout a spell away from school—and the reason for such a spell—came from youth and parentreports.9,10
Independent variables in the hazards models treated as not varying with time include thefollowing:
• an indicator of female, with male as the excluded reference category
• indicators of Black, Hispanic, Asian, and “other race/ethnicity,” with White as the excludedreference category
• the highest grade completed by a residential parent
• the natural log (n/) of household income
• indicators of family structure for living with biological mother only, for living withbiological father only, for living with one biological parent and one step parent, and for“other” household arrangement, with living with both biological parents as the excludedreference category
• an indicator of living in an urban area, with non-urban areas as the excluded referencecategory
• the age (in months) at initial enrollment in ninth grade
• the Mathematics Knowledge subscore from the computer-adaptive form of the ArmedServices Vocational Aptitude Battery (CAT–ASVAB)
Independent variables treated as time-varying, and measured for each month an individual wasin the risk set for dropping out, include the following:
• the grade point average achieved during the most recently completed academic term
• the ratio of CTE credits to academic credits earned during the most recently completed term
• the square of the CTE-to-academic ratio for the most recently completed term
9 Details of the programming and decision rules used in variable construction are available upon request from theauthors.10 For the great majority of identified dropout events, information provided by the youth could be used and a precisemonth of the event was known. When information provided by a parent had to be used (which was true for some ofthe events identified as occurring before the R1 interview), only the grade within which the event occurred wasknown. In these situations, to allow for analyses that maintained the person-month as the basic unit of analysis, arandom draw was conducted to impute in which month within the school year indicated by the parent the eventoccurred. We believe that this imputation technique does not impose any serious problems upon our analyses orconclusions.

Dropping Out of High School and the Place of Career and Technical Education
12 National Research Center for Career and Technical EducationN
In addition to the time-varying covariates that describe grade point average and coursetakingratio in the most recently completed term, we also examined models that included grade pointaverage and coursetaking covariates that were cumulative for high school up to the present time, t.We investigated both versions of the variables in order to contrast images of dropping out as a verylong-term and cumulative process with images of adolescents having relatively short social andpsychological memories (as reacting to the here-and-now instead of to the longer-term past). Wewere somewhat surprised to find that the variables capturing grade point average and coursetakingin the most recently completed term were consistently stronger predictors of dropping out. We donot interpret this finding as negating previous discussions of dropping out as a long-term,unfolding process, but we do note that in some ways our sample members’ behaviors seem to bemost tightly linked to their experiences in the very recent past. In the interest of space, we willpresent the rest of our rationales for including the various independent variables within the resultssection.
Missing data were treated via multiple imputation, using SAS procedures MI and MIANALYZE(Little & Rubin, 1987; Rubin, 1987; Schafer, 1997). The Markov Chain Monte Carlo (MCMC)method was used, and 20 imputations were generated. Inspection of diagnostic statistics suggestedthat the relative efficiency of estimates was markedly better with 20 imputations than with five orten, but that any additional improvements were minimal if more than 20 imputations were used.
For initial descriptive analyses, we use 1,628 cases. These 1,628 represent all NLSY97 samplemembers born in 1980, except for 63 who were removed from analyses for valid reasons (e.g., hadnever enrolled in the ninth grade or above by the time of the R1 interview). For the hazards models,we are constrained to those cases for which transcript data are available.11 With this constraint, weare left with 846 individuals born in 1980. Descriptive statistics for the sample of 1,628 and for thetranscript subsample are presented in Appendix A. Appendix A is based on unweighted data.Sampling weights are applied in Tables 1 and 2, as discussed below, because for those descriptivetables we are interested in being able to make statements that should generalize to a nationalpopulation. Unfortunately, when we get to estimation of hazards models, sampling weights cannotbe used. First, the sampling weights provided with NLSY97 data are probably not appropriate forthe subsample of 846 cases. Second, PROC PHREG in SAS does not support sampling weights.As presented in this report, we view the unweighted sample analyzed via hazards models as adiverse group comprising individuals from across the United States, but not as a sample thatdirectly reflects the demographic or social composition of United States youth born in 1980.
The transcript subsample (see Appendix A) has a lower proportion of dropouts than does thefuller sample. The most direct reason for this difference is that dropouts, by definition, haveinterrupted or irregular high school careers. To collect transcripts for dropouts—even justinformation for the academic terms before a first dropout spell, let alone information from after anysubsequent return to school—is difficult. Appendix A also shows that the transcript subsample, ascompared with the fuller sample, has somewhat higher proportions of White students, females, andhouseholds with two biological parents. And it has slightly higher family incomes, levels of parentaleducation, and ASVAB scores.
11 See Appendix B for a discussion of transcript data availability, and our data-preparation steps.

Dropping Out of High School and the Place of Career and Technical Education
National Research Center for Career and Technical Education 13
Results
Descriptive Graphs and Statistics
Table 1 shows that 20.8% of the individuals in our full 1980 sample had at least one dropoutspell sometime before the R3 interview. Before discussing Table 1 (and the other tables) in detail,we first offer Figures 5 through 8 to orient the reader to the data set and the timing of dropoutevents for those who experienced a dropout spell. Figure 5 shows the distribution of therespondents’ ages in months at the time of the R1 interview. They range from 16-years-and-2-months (194 months) to 18-years-and-3-months (219 months). The mode and median are both 16-years-and-10-months (202 months). Thus, while few of these respondents had graduated from highschool by the time of the R1 interview, most had experienced multiple semesters of high school andin many cases were old enough to consider legally leaving school if that was their desire. Althoughwe have not included them here, one could also imagine histograms of respondents’ ages at thetimes of the R2 and R3 interviews. For the R3 interview, these ages range from 18-years-and-10-months (226 months) to 20-years-and-3-months (243 months).
0
0.05
0.1
0.15
0.2
0.25
149 152 155 158 161 164 167 170 173 176 179 182 185 188 191 194 197 200 203 206 209 212 215 218 221
Age in Months
Prop
ortio
n of
Sam
ple
Figure 5. Distribution of age (in months) at time of NLSY97 interview (N = 1,628).
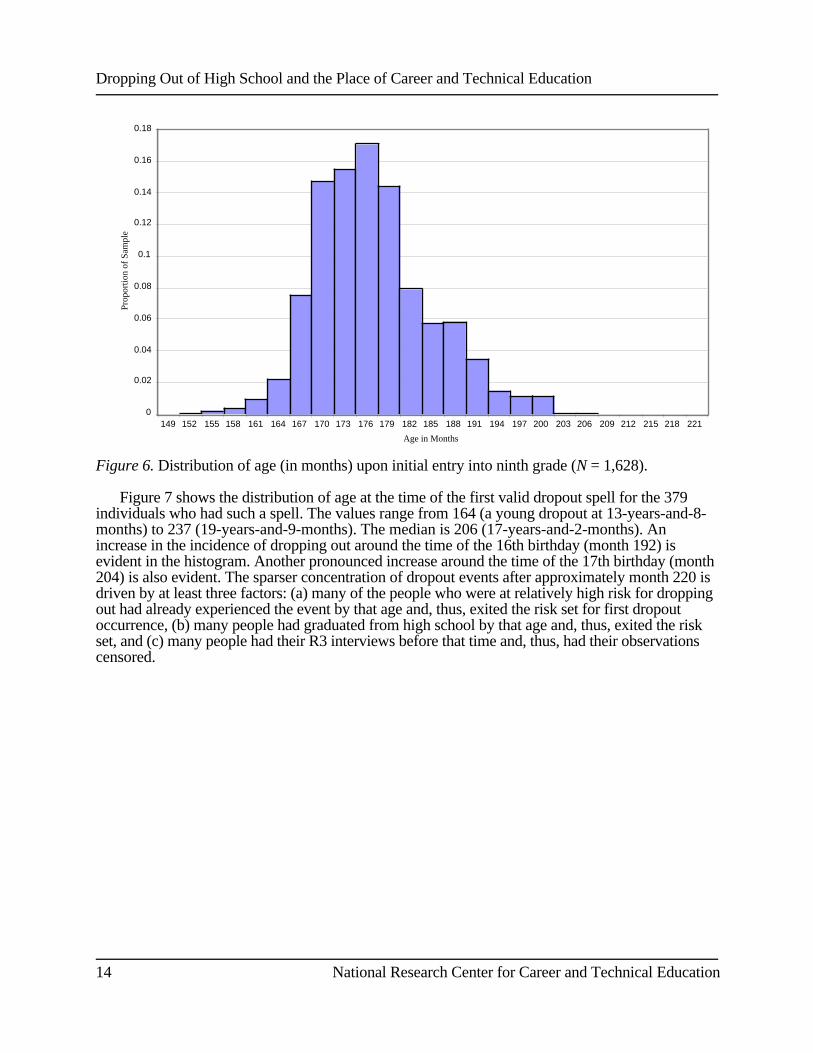
Figure 6 shows the distribution of the respondents’ ages at the time of their initial entries intoninth grade. These values range from 12-years-and-9-months (153 months—a very young ninthgrader) to 17-years-and-3-months (207 months). The median is 14-years-and-8-months (176months). One way to think about the observed risk period for a typical respondent is to think aboutsomeone who began ninth grade in month 176 of his or her life and had his or her R3 interview inmonth 228 of his or her life. Assuming he or she had neither dropped out nor graduated by month228, the observed risk period would have been 53 months (228-175). During each of these 53months, this hypothetical student had some non-negative risk of dropping out, but did not actuallydrop out. If, on the other hand, he or she had dropped out in month 190, or graduated in month 221,the risk period would have been truncated accordingly.
Dropping Out of High School and the Place of Career and Technical Education
14 National Research Center for Career and Technical EducationN
0
0.02
0.04
0.06
0.08
0.1
0.12
0.14
0.16
0.18
149 152 155 158 161 164 167 170 173 176 179 182 185 188 191 194 197 200 203 206 209 212 215 218 221
Age in Months
Prop
ortio
n of
Sam
ple
Figure 6. Distribution of age (in months) upon initial entry into ninth grade (N = 1,628).
Figure 7 shows the distribution of age at the time of the first valid dropout spell for the 379individuals who had such a spell. The values range from 164 (a young dropout at 13-years-and-8-months) to 237 (19-years-and-9-months). The median is 206 (17-years-and-2-months). Anincrease in the incidence of dropping out around the time of the 16th birthday (month 192) isevident in the histogram. Another pronounced increase around the time of the 17th birthday (month204) is also evident. The sparser concentration of dropout events after approximately month 220 isdriven by at least three factors: (a) many of the people who were at relatively high risk for droppingout had already experienced the event by that age and, thus, exited the risk set for first dropoutoccurrence, (b) many people had graduated from high school by that age and, thus, exited the riskset, and (c) many people had their R3 interviews before that time and, thus, had their observationscensored.

Dropping Out of High School and the Place of Career and Technical Education
National Research Center for Career and Technical Education 15
0
0.02
0.04
0.06
0.08
0.1
0.12
149 152 155 158 161 164 167 170 173 176 179 182 185 188 191 194 197 200 203 206 209 212 215 218 221 224 227 230 233 236 239
Age in Months
Prop
ortio
n of
Dro
pout
s
Figure 7. Distribution of age (in months) at time of dropout spell (first spell after entry into ninthgrade) for those who did have such a spell (n = 379).
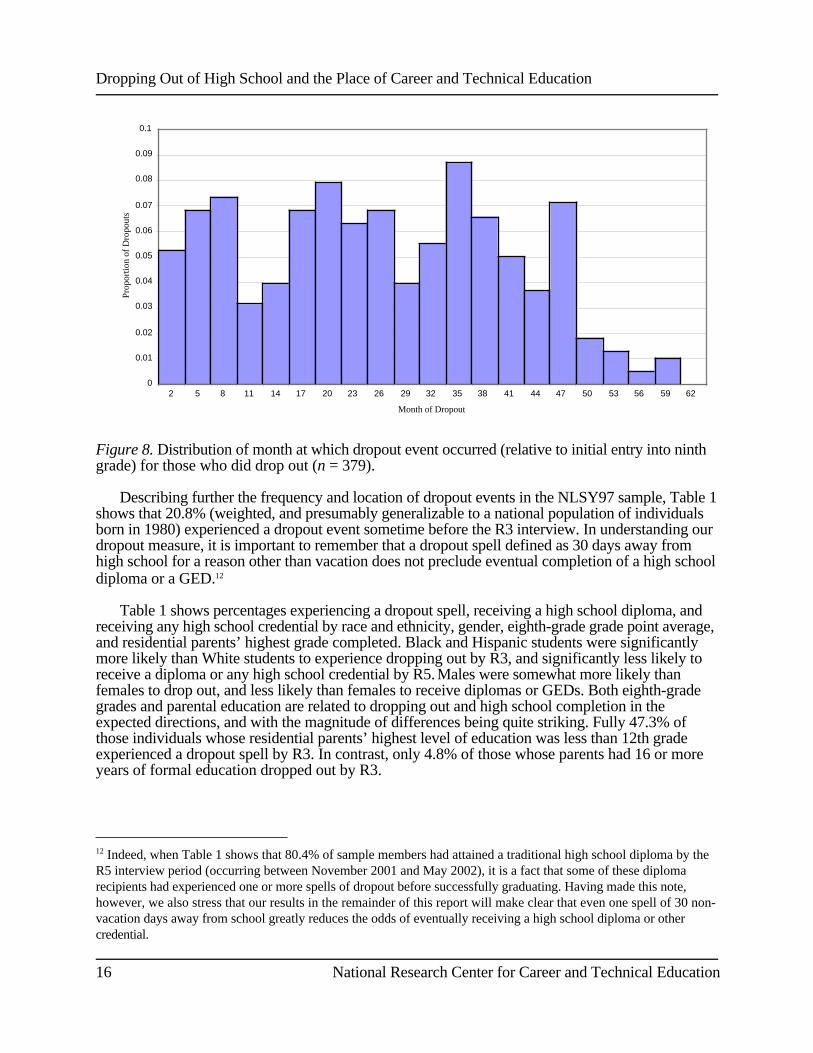
Finally, Figure 8 translates age at dropout event into months after initial entry into ninth grade.This figure illustrates the fact that there were plenty of early dropout spells and plenty of laterdropout spells (first spells of dropping out) among the members of this sample. The difficulties ofninth grade transition experienced by many high school students are represented among theindividuals who dropped out during the first 9-to-12 months after initial entry into ninth grade.(Even some of those who dropped out 12-to-21 months after initial entry into high school were stillstruggling to successfully complete ninth grade.) Additionally, though, Figure 8 shows that plentyof students have a first dropout spell after 30, or 40, or even 48 months (4 full years) of high schoolexperience. Thus, the problem of dropping out of high school is not concentrated exclusively in theearly years of high school or in the months just before one’s classmates would be scheduled tograduate.
Dropping Out of High School and the Place of Career and Technical Education
16 National Research Center for Career and Technical EducationN
0
0.01
0.02
0.03
0.04
0.05
0.06
0.07
0.08
0.09
0.1
2 5 8 11 14 17 20 23 26 29 32 35 38 41 44 47 50 53 56 59 62
Month of Dropout
Prop
ortio
n of
Dro
pout
s
Figure 8. Distribution of month at which dropout event occurred (relative to initial entry into ninthgrade) for those who did drop out (n = 379).
Describing further the frequency and location of dropout events in the NLSY97 sample, Table 1shows that 20.8% (weighted, and presumably generalizable to a national population of individualsborn in 1980) experienced a dropout event sometime before the R3 interview. In understanding ourdropout measure, it is important to remember that a dropout spell defined as 30 days away fromhigh school for a reason other than vacation does not preclude eventual completion of a high schooldiploma or a GED.12
Table 1 shows percentages experiencing a dropout spell, receiving a high school diploma, andreceiving any high school credential by race and ethnicity, gender, eighth-grade grade point average,and residential parents’ highest grade completed. Black and Hispanic students were significantlymore likely than White students to experience dropping out by R3, and significantly less likely toreceive a diploma or any high school credential by R5. Males were somewhat more likely thanfemales to drop out, and less likely than females to receive diplomas or GEDs. Both eighth-gradegrades and parental education are related to dropping out and high school completion in theexpected directions, and with the magnitude of differences being quite striking. Fully 47.3% ofthose individuals whose residential parents’ highest level of education was less than 12th gradeexperienced a dropout spell by R3. In contrast, only 4.8% of those whose parents had 16 or moreyears of formal education dropped out by R3.
12 Indeed, when Table 1 shows that 80.4% of sample members had attained a traditional high school diploma by theR5 interview period (occurring between November 2001 and May 2002), it is a fact that some of these diplomarecipients had experienced one or more spells of dropout before successfully graduating. Having made this note,however, we also stress that our results in the remainder of this report will make clear that even one spell of 30 non-vacation days away from school greatly reduces the odds of eventually receiving a high school diploma or othercredential.

Dropping Out of High School and the Place of Career and Technical Education
National Research Center for Career and Technical Education 17
Table 1Percentage With Dropout Event by R3, High School Diploma by R5, and Any High SchoolCredential by R5: Weighted Data for NLSY97 Sample Members Born in 1980 (N = 1,628)
%Dropout event
by R3 interview
%H.S. diploma
by R5 interview
%
Any H.S. credentialby R5 interview
Total Sample 20.8 80.4 84.4
Race/Ethnicity
Black 27.1 70.2 75.9
Hispanic 28.8 72.1 75.8
White 18.1 83.8 87.5
Gender
Male 22.7 76.0 80.9
Female 18.7 85.2 88.0
Eighth-Grade GPA
0.0 to 1.0 59.7 34.3 46.7
> 1.0 to 2.0 37.3 69.3 76.9
> 2.0 to 3.0 22.8 77.2 81.2
> 3.0 to 4.0 7.4 93.2 94.4
Parents’ Highest Grade Completed
≤ 11 47.3 57.5 65.8
12 23.2 79.7 83.7
13–15 17.3 83.3 86.6
≥ 16 4.8 93.0 94.9

Dropping Out of High School and the Place of Career and Technical Education
18 National Research Center for Career and Technical EducationN
Table 2 confirms that dropping out as we have defined it truly is an indicator of risk or seriousdetachment. Those with a dropout event by R3 had only a 27.8% chance of earning a traditionaldiploma by R5. In contrast, those without a dropout event by R3 had a 94.2% chance of earning atraditional diploma by R5. Note that many of those individuals with dropout spells would ultimatelyattain GEDs (as revealed by the difference between 27.8% and 45.9% in the second row of Table 2data). For Black and Hispanic individuals with dropout spells, the probability of eventually earninga high school diploma is lower than the corresponding probability for White individuals withdropout spells. These probabilities are 0.226, 0.265, and 0.291 for Black, Hispanic, and Whitesample members, respectively.
Table 2Percentage of Dropouts and Non-Dropouts Attaining High School Diploma or Any Credential byR5: Weighted Data for NLSY97 Sample Members Born in 1980 (N = 1,628)
%H.S. diploma
by R5 interview
%Any H.S. credential
by R5 interview
Total
Dropout event by R3?
No 94.2 94.4
Yes 27.8 45.9
Black
Dropout event by R3?
No 87.9 88.2
Yes 22.6 42.9
Hispanic
Dropout event by R3?
No 90.5 91.2
Yes 26.5 37.6
White
Dropout event by R3?
No 95.9 96.1
Yes 29.1 48.7

Dropping Out of High School and the Place of Career and Technical Education
National Research Center for Career and Technical Education 19
Table 2 also gives some indication that Hispanics with dropout spells in their pasts are lesslikely to use the GED as a route to high school completion than are Blacks or Whites with dropoutspells in their pasts. This assertion is based on the proportion of Hispanic dropouts eventuallyearning “any high school credential” being lower than the corresponding numbers for Black andWhite dropouts, coupled with the smaller difference between the proportion earning diplomas andthe proportion earning “any credential” for Hispanic dropouts, as opposed to Black and Whitedropouts.
Hazards Models
Having examined some univariate and bivariate descriptive graphs and statistics, we now turn tothe estimated hazards models of dropping out. Table 3 displays exponentiated coefficients—that is,multiplicative effects on the hazard ratio—from a series of five models. Model A includes theascriptive traits of sex and race/ethnicity. Here only the coefficient for Hispanic students isstatistically significant, showing an elevated risk of dropping out relative to non-Hispanic Whites.
Model B adds household characteristics and an indicator of urban location. As expected, higherparental education is associated with a reduced risk of dropping out. Living with one’s biologicalmother only, or one’s biological father only, or a biological parent and a stepparent are allassociated with a greater risk of dropping out, relative to living with both biological parents. Whilethese estimates for household composition are significant in this preliminary model, we note thatthey will lose their significance as various intervening variables are introduced in Models C and E.Finally, living in an urban area is associated with a greater risk of dropping out.
In Model B, Hispanics no longer show an elevated risk of dropping out now that parentaleducation and other factors have been controlled. Also, the lack of significance for the natural log ofhousehold income is interesting, especially when coupled with the significance of parentaleducation. The estimates seem to suggest that human capital and parents’ familiarity and comfortwith navigating the educational system are more salient in understanding high school persistencethan is financial capital.
Model C adds a standardized test score (ASVAB—Mathematics Knowledge) and therespondent’s age at initial ninth-grade enrollment. We interpret the ASVAB score as an indicator ofacademic achievement or performance. Higher ASVAB scores are associated with significantlylower risk of dropping out, as expected. Age at ninth-grade entry is determined by multiple factors(i.e., a student’s history of failure or retention, state policies about kindergarten entry, parentaldecisions). According to Model C, adding a full year (12 months) to one’s high school entry ageincreases the hazard of dropping out by more than 3 times.13 Consistently, as we examined variousmodel specifications, age at ninth-grade entry was positively and highly significantly associatedwith the risk of dropping out. Further, as we discuss in the coming paragraphs, the inclusion of thisvariable proves to be an important control as we isolate the plausible effects of other variables. Thedifficulties experienced by students who are old-for-grade become apparent in our analyses.
Model D is an attempt to replicate the set of predictors used in Plank’s (2001) research. Here,the time-varying covariates measuring grade point average and coursetaking ratio are introduced forthe first time among the five models. It is informative to compare Model D with the findings fromthe earlier Plank research, keeping in mind that with Model D we utilize more recent data (NLSY97instead of NELS:88) and change statistical models (using a hazards model with time-varying
13 The coefficient in the linear model of log-hazards is 0.0999. Multiplying by 12 (months) and exponentiating tocalculate the effect on the hazard ratio yields the following: exp(12*0.0999) = 3.32.

Dropping Out of High School and the Place of Career and Technical Education
20 National Research Center for Career and Technical EducationN
covariates instead of a standard logistic regression), but have otherwise included the same set ofindependent variables (as nearly as the two different data sets will allow).
Table 3 Effects on Hazard Ratio (Based on Cox Nonproportional Hazards Model of Dropping Out) forNLSY97 Sample Members Born in 1980 With Available Transcript Data (n = 846)
Model
Predictor
A
Gender andrace only
B
Adding HHcharac-
teristics andurban
location
C
AddingASVAB andage at ninth-grade entry
D
Replicationof Plank(2001)
specification
E
Finalmodel
Female 0.78 0.73* 0.72* 0.90 0.85
Black 1.45 0.95 0.59** 0.62** 0.53**
Hispanic 1.76** 0.86 0.88 0.83 0.88
Asian 0.46 0.40 0.52 0.84 0.66
Other race/ethnicity (non-White) 0.74 0.64 0.75 0.56 0.77
Parents’ highest grade completed 0.83**** 0.89*** 0.89*** 0.89***
ln(household income) 0.95 0.98 0.99 1.00
Biological mother only 1.67** 1.55* 1.39
Biological father only 2.57** 1.38 1.27
One biological parent/One stepparent 2.19*** 1.61* 1.53
Other household arrangement 1.66 1.08 1.12
Urban residence 1.78** 1.97*** 1.93**
ASVAB—Math Knowledge 0.54**** 0.50**** 0.65***
GPA (most recent term) 0.53**** 0.56****
CTE:Academic ratio (most recent term) 0.17** 0.27
CTE:Academic ratio2 (most recent term) 5.60** 4.13*
Age (months) at ninth-grade enrollment 1.11**** 1.11****
Reduction in -2 log likelihood
from model without covariates 10.11 60.42 168.12 138.85 193.34
df 5 12 14 11 17
p 0.0723 < 0.0001 < 0.0001 < 0.0001 < 0.0001
Note. ln = natural log.*p < .10. **p < .05. ***p < .01. ****p < .001.

Dropping Out of High School and the Place of Career and Technical Education
National Research Center for Career and Technical Education 21
Plank’s (2001) research had shown, in terms of effects on the log-odds of dropping out, anegative and highly significant coefficient of -4.57 for the first-order coursetaking ratio term; it hadshown a positive and highly significant coefficient of 2.97 for the squared term. Together, these twoterms generated the U-shaped function described earlier—and a point of inflection where the ratioequaled 0.77. In the present NLSY97 research, we can translate Table 3’s effects on hazard ratiosback into effects on log-hazards to get the following: The first-order coursetaking ratio term has anestimated coefficient of -1.77.14 The squared term has an estimated coefficient of 1.72.15 Again,these two terms generate a U-shaped function. However, the magnitude of each coefficient is lessthan it had been in the NELS:88 research.
When considering the specification of Model D, we thus find the same general U-shapedpattern that had been reported by Plank (2001), albeit of less pronounced magnitude (lessconcavity) and with a point of inflection at a slightly lower value (0.51 instead of 0.77). Further dataexploration, including examination of an NLSY97 logistic regression (available upon request)suggests to us that the greatest part of the difference between the NELS:88 findings and the resultsof Model D has to do with changing data sets (as opposed to changing statistical methods).However, it is unclear whether we are detecting historical changes and altered educational processesthat occurred across 5 or 6 years, or whether we are simply detecting differences in the methods orprecision used to measure various variables in the two studies. Another relatively small part of thedifference between the NELS:88 findings and the results of Model D has to do with changingmethods (to the more appropriate, more defensible hazards models). The change in methods seemsto imply some changes in the strength of estimated effects, thus giving some credence to worriesabout reverse-causality in the logistic regression results, but—in the balance—this does not seem tobe a large source of differing results.
Before we give too much attention to the results of Table 3’s Model D, however, let us examineModel E and the importance of keeping age at high school entry in the predictive model. Model Ereintroduces household composition variables, urbanicity, and age at high school entry aspredictors. Model E fits the data significantly better than Model D (difference in -2 log likelihoodof 54.49 with 6 degrees of freedom). What, then, are the substantive similarities and differencesbetween Models D and E?
Both models show Black students having a lower risk of dropping out than do Whitestudents—a finding that emerges once socioeconomic status and (especially) standardized testperformance are controlled. Both models show higher parental education associated with a reducedrisk of dropping out. Both models show higher ASVAB scores, and a higher grade point average inthe most recently completed academic term, associated with a reduced risk of dropping out. ModelE shows (a) urban residence and (b) each additional month of age at high school entry associatedwith elevated risks of dropping out, thus highlighting significant risk factors not represented (notmodeled) in Model D.
The most noteworthy differences between the two models are in the estimates for the CTE-to-academic-coursetaking ratio. Both Models D and E suggest a U-shaped function, as evidenced bythe first-order term’s estimated effect of the hazard ratio being less than 1.0 in both models, whilethe squared term’s estimated effect is greater than 1.0 in both models. In Model E, however, thefirst-order term’s coefficient is not significant even at a 0.10 level, and the squared term’scoefficient is only marginally significant (p < 0.10). Data exploration makes clear that the
14 -1.77 = ln(0.17).
15 1.72 = ln(5.60).

Dropping Out of High School and the Place of Career and Technical Education
22 National Research Center for Career and Technical EducationN
differences in the estimates for the coursetaking ratio, between Models D and E, are driven by theexclusion or inclusion of age at high school enrollment—a contingency that will be discussed atlength below.
Given these weak results for the coursetaking terms, one must ask whether Model E presentsany real evidence of a U-shaped function (consistent with Figure 4). The proper answer to thisquestion seems to be, “yes, but only very weak evidence.” That is, Model E was compared with amodel specification with neither a first-order term nor a squared term. This alternative specificationis consistent with Figure 3 and a hypothesis of “no effect of coursetaking.” Model E wasmarginally better than this alternative specification (difference in -2LL of 5.86 with 2 degrees offreedom, p = 0.0586).
Also, Model E was compared with a specification with a first-order term but no squared term.This alternative specification is consistent with Figures 1 and 2, and hypotheses of linear effects ofcoursetaking. Again, Model E was marginally better than the alternative specification (difference in-2LL of 3.81 with 1 degree of freedom, p = 0.0509).
Thus, we can tentatively declare Model E our best model for the sample of 846 cases. We cite afairly mild U-shaped pattern for the effect of the CTE-to-academic ratio on the risk of dropping out,with a point of inflection around 0.46 (where roughly one CTE credit is earned for every two coreacademic credits).
High School Entry Age as Contingency
If we had ended our analyses with the results in Table 3, we would have declared Model E to beour best model. We would have been able to say that a curvilinear specification of the associationbetween the coursetaking ratio and the risk of dropping out (consistent with Figure 4) wasmarginally better than specifications of no effect or strictly linear effects of coursetaking(corresponding to Figures 1, 2, and 3). Substantively and statistically, however, the nature andmagnitude of Model E’s curvilinear effect is not dramatic in Table 3, and no strong effect ofcoursetaking on dropping out could have been inferred.
If the empirical evidence had suggested just that fairly simple and modest conclusion, thatwould have been the end of the story. It would have been our responsibility to report the findings,interpret them, and reconcile them with previous findings and predictions. However, the changingestimates across Table 3’s Models C, D, and E suggested to us that a more complex story involvingdropping out, coursetaking, and age at high school entry existed and needed to be explored.
What exactly did it mean that age at ninth-grade enrollment was so highly significant (andstable) in Models C and E? And why were both the first-order and squared terms for coursetakingratio significant in ways consistent with Figure 4 in Model D (when enrollment age was notcontrolled), but only marginally significant (as a set, according to an omnibus test) in Model E(when enrollment age was controlled)? In the course of investigating these questions, we confirmedthat students who were older upon high school entry dropped out at higher rates. Models C and Ereflect this fact, as did additional exploratory analyses (not shown). Additionally, older students aremore heavily concentrated than younger students at the medium- and high-levels of the CTE-to-academic ratio (analyses available from the authors).
Clearly, this is not a case of entry age being a mediating variable that explains away, or accountsfor, the relationship between coursetaking and dropping out. That is, a particular high schoolcoursetaking mix does not determine one’s age at high school entry and subsequently, via thismechanism, elevate or reduce the risk of dropping out. To some extent, age at high school entry
Dropping Out of High School and the Place of Career and Technical Education
National Research Center for Career and Technical Education 23
may cause (or play a determining role in) high school coursetaking. And age at high school entry isclearly associated with the risk of dropping out. Whether we should say that being older than mostof one’s classmates upon high school entry is (a) a cause of dropping out or (b) a proxy forvarious challenges and risk factors is a subtle but important question.
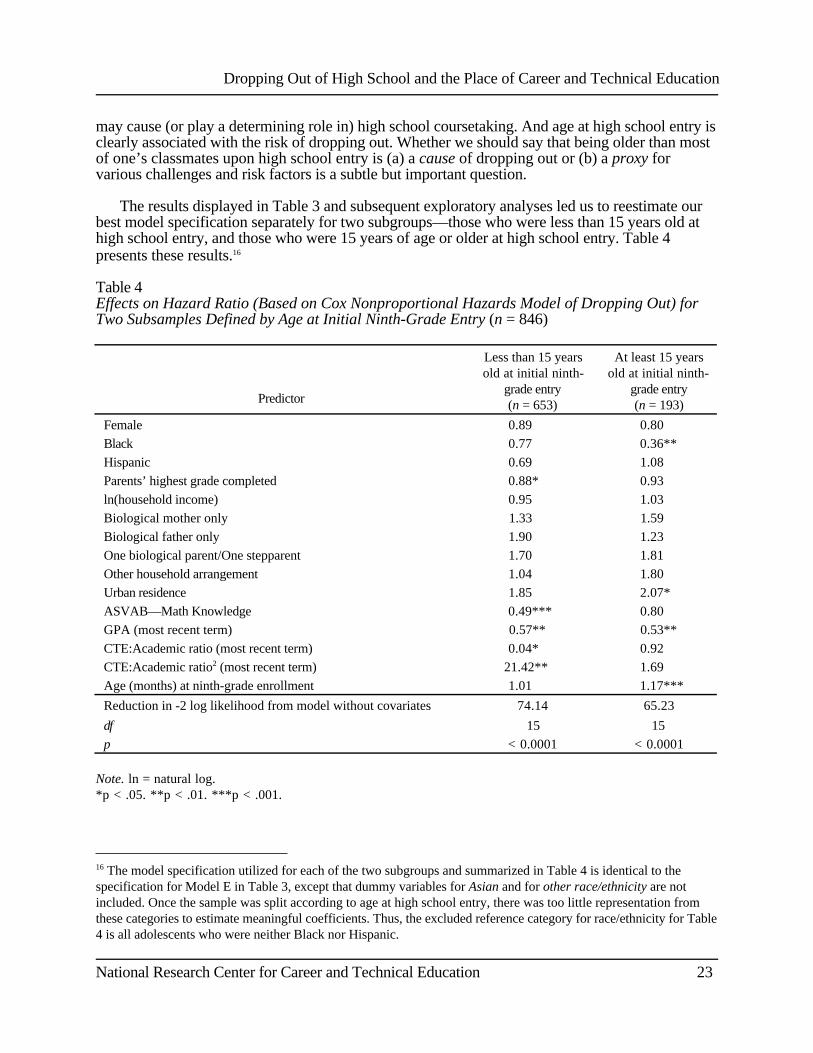
The results displayed in Table 3 and subsequent exploratory analyses led us to reestimate ourbest model specification separately for two subgroups—those who were less than 15 years old athigh school entry, and those who were 15 years of age or older at high school entry. Table 4presents these results.16
Table 4Effects on Hazard Ratio (Based on Cox Nonproportional Hazards Model of Dropping Out) forTwo Subsamples Defined by Age at Initial Ninth-Grade Entry (n = 846)
Predictor
Less than 15 yearsold at initial ninth-
grade entry(n = 653)
At least 15 yearsold at initial ninth-
grade entry(n = 193)
Female 0.89 0.80
Black 0.77 0.36**
Hispanic 0.69 1.08
Parents’ highest grade completed 0.88* 0.93
ln(household income) 0.95 1.03
Biological mother only 1.33 1.59
Biological father only 1.90 1.23
One biological parent/One stepparent 1.70 1.81
Other household arrangement 1.04 1.80
Urban residence 1.85 2.07*
ASVAB—Math Knowledge 0.49*** 0.80
GPA (most recent term) 0.57** 0.53**
CTE:Academic ratio (most recent term) 0.04* 0.92
CTE:Academic ratio2 (most recent term) 21.42** 1.69
Age (months) at ninth-grade enrollment 1.01 1.17***
Reduction in -2 log likelihood from model without covariates 74.14 65.23
df 15 15
p < 0.0001 < 0.0001
Note. ln = natural log.*p < .05. **p < .01. ***p < .001.
16 The model specification utilized for each of the two subgroups and summarized in Table 4 is identical to thespecification for Model E in Table 3, except that dummy variables for Asian and for other race/ethnicity are notincluded. Once the sample was split according to age at high school entry, there was too little representation fromthese categories to estimate meaningful coefficients. Thus, the excluded reference category for race/ethnicity for Table4 is all adolescents who were neither Black nor Hispanic.
Dropping Out of High School and the Place of Career and Technical Education
24 National Research Center for Career and Technical EducationN
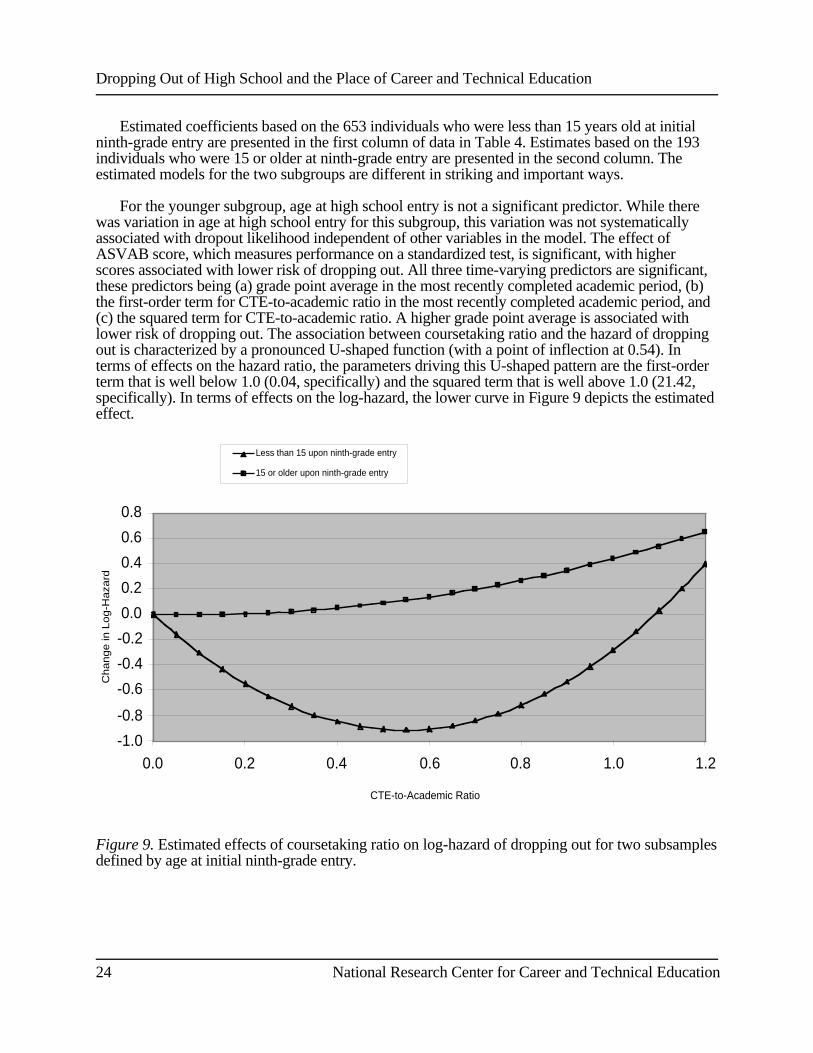
Estimated coefficients based on the 653 individuals who were less than 15 years old at initialninth-grade entry are presented in the first column of data in Table 4. Estimates based on the 193individuals who were 15 or older at ninth-grade entry are presented in the second column. Theestimated models for the two subgroups are different in striking and important ways.
For the younger subgroup, age at high school entry is not a significant predictor. While therewas variation in age at high school entry for this subgroup, this variation was not systematicallyassociated with dropout likelihood independent of other variables in the model. The effect ofASVAB score, which measures performance on a standardized test, is significant, with higherscores associated with lower risk of dropping out. All three time-varying predictors are significant,these predictors being (a) grade point average in the most recently completed academic period, (b)the first-order term for CTE-to-academic ratio in the most recently completed academic period, and(c) the squared term for CTE-to-academic ratio. A higher grade point average is associated withlower risk of dropping out. The association between coursetaking ratio and the hazard of droppingout is characterized by a pronounced U-shaped function (with a point of inflection at 0.54). Interms of effects on the hazard ratio, the parameters driving this U-shaped pattern are the first-orderterm that is well below 1.0 (0.04, specifically) and the squared term that is well above 1.0 (21.42,specifically). In terms of effects on the log-hazard, the lower curve in Figure 9 depicts the estimatedeffect.
-1.0
-0.8
-0.6
-0.4
-0.2
0.0
0.2
0.4
0.6
0.8
0.0 0.2 0.4 0.6 0.8 1.0 1.2
CTE-to-Academic Ratio
Ch
an
ge
in L
og
-Ha
zard
Less than 15 upon ninth-grade entry
15 or older upon ninth-grade entry
Figure 9. Estimated effects of coursetaking ratio on log-hazard of dropping out for two subsamplesdefined by age at initial ninth-grade entry.

Dropping Out of High School and the Place of Career and Technical Education
National Research Center for Career and Technical Education 25
For the older subgroup (those who were 15 or older at ninth-grade entry), ASVAB score is nota significant predictor of dropping out. Neither are the first-order or squared terms for coursetakingratio. The effect of the coursetaking ratio on the log-hazard of dropping out for the older subgroupis depicted in Figure 9’s upper curve. For the older students, grade point average in the most recentterm is once again significant. And age at ninth-grade entry is highly significant (with eachadditional month of age bringing an increased risk of dropping out).
As we compare and contrast the estimated models for the two subgroups, we reach this generalconclusion: For those who are older than is normal upon high school entry, this single factor of ageis a strong correlate of dropping out that swamps or obfuscates most other effects. It is not just thatthe older students as a group drop out at relatively high rates, but also that each additional month ofage at high school entry brings an increased risk of dropping out among those who are 15 or olderas they enter ninth grade. The fact that ASVAB scores are not a significant predictor of droppingout for the older subsample suggests that weaknesses in academic performance or potential may notbe the primary factor leading older students to disengage from school. If academic factors are notthe predominant force leading to dropping out among older students, other likely causes includevarious aspects of the social realm and social stigma. We turn to consideration of these themes inour concluding section.
Discussion and Conclusions
The analyses have led us to conclude that age at the time of initial high school enrollment is animportant factor. This story about age is highly relevant to our understanding of the associationbetween coursetaking mix and dropping out. We see students who are older than normal upon highschool entry dropping out at higher rates than do students who are normal or even young for grade.We see evidence of a pronounced curvilinear effect of the coursetaking ratio on dropout likelihoodfor the younger subgroup, but no significant effect of coursetaking on dropping out for the oldersubgroup.
If we borrow language from dosage research, we might say the following: For students who areof a normal age, or even younger than normal, at the time of high school entry, it appears that someCTE combined with core academic coursetaking is good medicine, but only up to a point. Toomuch exposure to CTE (concentrating on CTE to the exclusion of adequate academic coursetaking,and moving above the estimated point of inflection) implies increased risk of dropping out. Forstudents who are older than normal upon high school entry, the received dosages of CTE andacademic coursetaking do not seem to have detectable effects on dropout likelihood. It seems likelythat the constellation of risk factors or challenges encountered by these older students makes themnot receptive to any potential effects of coursetaking variation. At the peril of pushing an analogytoo far, one can think of one set of patients who are generally healthy, and thus responsive to dosesof preventative medicine; one can think of another set of patients whose immune systems areweakened to the point that they are unresponsive to that same medicine.
Let us abandon the dosage language and accompanying metaphors, but consider further whatwe have—and have not—learned about coursetaking, age, and dropout risk. One thing we have notestablished definitively is a causal relationship between coursetaking and dropping out. Theempirical evidence for the younger subgroup is consistent with the claim that a middle-range mix ofCTE and academic courses causes a reduced risk of dropping out once other factors in our modelshave been controlled. The use of time-varying covariates for grade point average and coursetakingmix are of some help in bolstering causal inferences. That is, our research design has kept temporalordering very clear and conceptually sound.

Dropping Out of High School and the Place of Career and Technical Education
26 National Research Center for Career and Technical EducationN
There are, however, unaddressed issues of selection when it comes to curricular experiences.We are in no position to say that if a student with a given grade point average, race, gender,socioeconomic background, and other modeled traits were suddenly transported from a CTE-to-academic ratio of 0.0 to a ratio of 0.4 that his or her risk of dropping out would suddenly drop tothe levels suggested by our estimated models. The members of our sample found their individualadmixtures of CTE and academic courses through some combination of individual choice, parentalor educator guidance, and constraints imposed by their high schools’ menus of course offerings.Certainly, the members of our sample were not randomly assigned to their observed levels on thecoursetaking ratio independent variable.
Because of these facts, we must be cautious in making any causal inferences. We are simplyreporting results of a correlational study (with sophisticated event history methods that do captureelements of time-ordering and nonconstant risk) that are consistent with hypotheses aboutcurvilinear effects of coursetaking on dropout risk.
We began this report by stating that a thorough conceptualization of the high school dropoutphenomenon would incorporate an understanding of students’ backgrounds and early educationalexperiences and also their unfolding experiences during high school. We have attempted to be trueto this charge. Some of our independent variables capture aspects of family, or ascriptive status, orearly achievement outcomes. In the realm of early achievement outcomes, ASVAB score is a proxyfor academic competence or performance, and is partly the product of pre-high-school educationalexperiences. Additionally, the initial value assigned to the time-varying grade point average variableis based on a student’s self-reported grades in eighth grade. As such, this level of pre-high-schoolaccomplishment—be it low or high—is carried through the door on the first day of high school as arisk or resilience factor as we have constructed our models. Finally, age at high school entry is aresult of student performance, school policies, and family decisions established before the highschool career commences. Thus, we have incorporated into our models and explanationsdescriptions of what the student brings as burdensome baggage or assets on the first day of highschool.
Additionally, though, we have modeled accomplishments and exposures that occur during thehigh school career. In our models, a student’s risk of dropping out in any given month is partly afunction of the grades he or she received the last time a report card was distributed. Our assumptionis that a student receives signals—sometimes deeply felt—about how he or she is faring regardingthe official agenda and institutionally valued performance aspects of the school. Also, a student’srisk of dropping out is modeled as a function of the coursetaking mix experienced during the mostrecently completed academic term. If it is true that some students need the contextual and situatedlearning offered by career and technical education (when it is operating at its best) to find relevanceand attachment in their schooling, then our models capture the fact that some students received thisexposure, while others did not. For students who were of a normal or young age at the time of highschool entry, coursetaking ratios did seem to affect school-leaving decisions.
Specifically, for students who were of a normal or young age upon high school entry, a CTE-to-academic credit ratio of approximately 1-to-2 was estimated to minimize the risk of dropping outonce other factors in our model were controlled. A concrete recommendation for schools andeducators who are encountering problems with students dropping out would be to ensure thatstudents had the option of arranging their high school schedules in a way that facilitated this 1-to-2ratio. In a high school where students typically amass 24 Carnegie units over 4 years, such a ratiocould be attained if 13 core academic credits were earned, 6.5 CTE credits, and 4.5 other credits(including foreign language, fine arts, or physical education).

Dropping Out of High School and the Place of Career and Technical Education
National Research Center for Career and Technical Education 27
Furthermore, beyond a school (or school system) merely allowing such coursetakingcombinations, the combinations should be actively encouraged, applauded, or described as high-status endeavors. It is no easy feat to establish particular courses or curricular programs as highstatus if popular opinion among students, parents, and possibly teachers suggests they are not highstatus. Nonetheless, we can suggest some possible strategies for actively encouraging andapplauding CTE involvement. These might include (a) featuring final projects or products fromthese courses at school-wide assemblies, (b) offering awards to individuals or groups of studentsfor excellence in their CTE courses, or (c) developing team-teaching arrangements or collaborationsbetween respected science, mathematics, English, or social studies teachers and the teachers of CTEcourses.
For older students, however, we are inclined to speculate that the social stigma or awkwardnessof a potential role inconsistency troubles them in a way that swamps or overwhelms potential effectsof many other aspects of the educational experience—including the CTE-to-academic ratio. Quitelikely, to be older than is normal as one enters and proceeds through high school is to be attractedor called to certain behaviors or involvements that are at odds with the life and allegiances of atypical high school student. As we make this speculation, we recall that an older student’sstandardized test performance was not among the significant predictors of dropping out. Westrongly suspect that social roles and feelings of fit and contentment are more relevant to the socialpsychology of these adolescents than are assessments of one’s academic competence.17
Indeed, Entwisle, Alexander, and Olson (2004) have reached similar conclusions. In their studyof high school dropouts in Baltimore, MD, they found many students who were old-for-grade dueto retention earlier in their schooling careers. These students were at elevated risk for dropping out.That these students had been retained and were old-for-grade could be interpreted as indicators ofless-than-adequate school performance, but Entwisle and colleagues inferred that retention’s powerto predict dropping out stemmed primarily from other sources. They reached this conclusion afternoting that for their sample test scores and grades, which are also measures of academicperformance, lacked predictive power. Entwisle and colleagues suggested that the effects ofretention on dropping out emerged because of the pressures students experience when they are off-time in the severely age-graded organization of the secondary school. This organization labelsstudents as “behind,” “dumb,” or “failures,” and adds to the time they must spend in schoolbefore graduation. By dropping out, retained and/or old-for-grade students can shed a punishingrole and, instead, seek desired status through paid work or other means.
Educators should give attention to trying to help students who are old-for-grade reclaim (orcreate for the first time) a healthy attachment to school and a goal of high school graduation. Ouranalyses suggest to us, however, that this will not be accomplished simply through directing suchstudents to a particular set of courses or combination of courses. Most likely, additional efforts willbe necessary to help these students feel integrated into the life and activities of the school, believethat degree-completion is both valuable and possible, and guard against too quickly embracing adultroles and involvements that run contrary to the roles and activities required of a high school student.
Despite caveats about weak or nonexistent effects of the CTE-to-academic ratio for studentswho are old-for-grade, we still stress the strong estimated effects of curricular offerings and
17 We stand by our speculation about social roles and feelings of fit being more relevant than assessments ofacademic competence for these older youth. However, we also note the observation of an anonymous reviewer, whostressed that as we note that ASVAB scores are not a significant predictor of dropping out for the older youth, weshould not lose sight of the fact that grade point average in the most recent term is significant—a finding that wouldcontradict the interpretation that achievement factors matter little for this group. Instead, one might infer that currentor recent achievement is more relevant for these students than is past achievement or ability.

Dropping Out of High School and the Place of Career and Technical Education
28 National Research Center for Career and Technical EducationN
experiences for students who were of a normal or young age upon high school entry. Thesefindings give support to our assertion that curricular offerings and experiences are parts of sociallypatterned and institutionalized structures leading to engagement for some adolescents anddisengagement for others. In making that assertion, we mean the following: Schools as institutionsmake decisions about what courses will be offered, and what competencies and interests will benurtured and served within their curricula. Educators, parents, and students make recommendationsor choices about what curricular path a given student will follow. Within their courses, students areexposed to a range of knowledge bases and visions of possible futures. Courses differ from oneanother in what they feature and what they reward. If it is true that students pick up cues about theirsuccess and satisfaction partly through their curricular experiences (and we see no reason tosuspect otherwise), then it makes sense that the balance of coursetaking from the fairly disparatedomains of CTE and core academics would be predictive of a student’s attachment to school and,ultimately, the act of dropping out or not.
As we and others push this line of research forward, next steps include incorporatingcomprehensive understandings of the menu of available offerings at a given school, andunderstanding a student’s choices or assignments within this organizational context. Also, weshould attempt to move beyond the simple assertion that “on average, it will be beneficial to have awide range of curricular opportunities and learning environments so that all students stand a decentchance of finding points of attachment and motivation.” More satisfying theories and explanationswould incorporate understandings of a given student’s set of skills, interests, and learning needs.And then, in turn, the match among these skills, interests, and needs and the opportunities featuredwithin a given school or school system should be assessed and evaluated for its impact. Finally, inseeking an overall assessment of the effects of CTE on opportunity structures and outcomes foryouth and young adults, findings about effects on dropping out should be considered inconjunction with findings related to other outcomes including employment, earnings, andpostsecondary education.
NLSY97 offers the opportunity to pursue this agenda partially, and other research settings anddata sources should be sought as well. We are encouraged to learn that a much larger set of highschool transcripts, extending well beyond the youth born in 1980, have now been collected andreleased (in 2005) as a part of the NLSY97 data. We hope that we (and others) can utilize these datato extend our analyses, and to work with samples that are more fully representative of all UnitedStates youth.

Dropping Out of High School and the Place of Career and Technical Education
National Research Center for Career and Technical Education 29
APPENDIX A
UNWEIGHTED DESCRIPTIVE STATISTICS FOR NLSY97 SAMPLE MEMBERSBORN IN 1980 AND FOR TRANSCRIPT SUBSAMPLE
Variable 1980 Cohort (N = 1,628)1980 Cohort – transcriptsubsample (n = 846)
Ever dropped 0ut (by R3 interview) 23.3% 13.9%
Female 49.8% 51.1%
Black 27.6% 22.8%
Hispanic 20.4% 18.7%
Asian 2.1% 2.0%
White 48.4% 55.2%
Other race/ethnicity 1.2% 1.3%
ln(household income) M = 10.1, SD = 2.0 M = 10.4, SD = 1.7
Parents’ highest grade completed M = 13.2, SD = 3.0 M = 13.6, SD = 2.9
Living w/biological mother only 25.7% 21.5%
Living w/biological father only 3.1% 2.8%
Living w/1 biological parent & 1 stepparent 11.9% 15.1%
Living w/2 biological parents 48.8% 53.5%
Other household arrangement 10.5% 7.1%
Urban location 74.2% 72.3%
Age (in months) at ninth-grade enrollment M = 176.9, SD = 7.9 M = 175.4, SD = 6.5
ASVAB—Math Knowledge (divided by 1,000) M = 0.24, SD = 1.01 M = 0.48, SD = 0.85
Time-dependent grade point average in month 18 (for mostrecently completed term) M = 2.67, SD = 0.76
Time-dependent CTE-to-Academic ratio in month 18 (for mostrecently completed term) M = 0.20, SD = 0.28
Time-dependent CTE-to-Academic ratio2 in month 18 (formost recently completed term) M = 0.12, SD = 0.29

Dropping Out of High School and the Place of Career and Technical Education
30 National Research Center for Career and Technical EducationN

Dropping Out of High School and the Place of Career and Technical Education
National Research Center for Career and Technical Education 31
APPENDIX B
USE AND PREPARATION OF NLSY97 HIGH SCHOOL TRANSCRIPT DATA
This appendix describes how we have treated the NLSY97 transcript data. We understand thatthese data have limitations. However, we have systematically cleaned, recoded, and compared thesedata with other national data. Ultimately, we believe that it is appropriate to use the NLSY97transcript data in our analyses.
Data and Coding
Based on communication with staff at the Center for Human Resources Research at The OhioState University, National Opinion Research Center, and the Bureau of Labor Statistics, weunderstand that the transcript data are most representative of the 1980 cohort. All of the datapresented in this manuscript describe the 1980 birth cohort of the NLSY97 sample. While the totalsample of youths born in 1980 is 1,691, transcript data are available for 873 (52%).
Timing of Coursetaking
The transcript data provide information on every term for every school attended by a student. Inaddition to course titles and grades received for each course, we know the start and stop dates foreach of these terms. The timing of these terms is important for our analyses. Therefore, it isimportant to describe our hand-coding procedures to deal with incomplete dates.
For some transcripts, the dates were incomplete; typically, a start month or year, or stop monthor year, or some combination of months/years was incomplete. For a particular student withmissing start and/or stop dates, we utilized available information for the academic schedule of thatsame school, information available about the type of term (i.e., fall, spring, summer), andinformation about a student’s high school completion date to complete the student’s trajectory.
In some cases, we followed general decision rules based on our knowledge of the start and stopmonths of a typical school system (i.e., the school year generally begins in September).
Credits
In addition to the timing and names of courses, we also know the credits earned for each course.In other analyses (not in the current manuscript), it has been important to document total creditsearned, in addition to understanding ratios of credits in one subject area to credits in another. Inorder to accomplish this, it is important to establish whether a school was awarding Carnegie unitsfor courses, or following some other system, and then to rescale as appropriate. For the presentanalyses, however, our reliance on the coursetaking ratio makes this part of our data treatmentinconsequential. Thus we will not give detail on those data inspection and recoding decisions.
We limit our discussion of course credits to a few relevant procedures. First, in a handful ofcases, we corrected obvious data entry errors (e.g., one course bringing 50 credits, while every othercourse brought 0.5 or 1.0 credits). Secondly, in some cases, we could tell that a course brought apassing grade with no credits. After careful hand inspection, we identified these cases and assignedwhat we judged to be the appropriate number of credits (based on other information available onthat same individual’s transcript).

Dropping Out of High School and the Place of Career and Technical Education
32 National Research Center for Career and Technical EducationN
Data Generalizability
We examined whether the transcript subsample differed significantly from the larger 1980sample (table available upon request). Overall, the transcript subsample matches the whole 1980cohort quite closely, with a few exceptions. The transcript sample appears to be slightly moreadvantaged socioeconomically and academically. For example, the transcript sample has fewerminority students, more educated parents, and higher family income. These students are also morelikely to be living with both parents.
In terms of academic achievement, the transcript sample is more likely have mostly As and lesslikely to have mostly Ds than the fuller 1980 sample. (These comparisons were made based uponstudent self-reported grades, which are distinct from transcript-recorded grades.) They also scorehigher on the arithmetic-reasoning test administered by the NLSY97, and are less likely to havebeen suspended. However, the two samples are similar with respect to gender composition, age,household size, residence region, and school type, as well as absences. They are also comparable interms of CTE program participation, across all types of programs.
We also compared our results on some basic coursetaking patterns to those found in othernationally representative data sets, such as High School and Beyond, National EducationLongitudinal Study, and the High School Transcript Study (table available upon request). TheNLSY97 1980 cohort represents students attending high school sometime between 1994 and 2000,depending on the year of graduation. Therefore, the data is mostly comparable to the later surveytime points shown for the High School Transcript Study. The NLSY97 sample seems to show aslightly lower percentage of students ever taking a CTE course, while the numbers are close forvocational credits, specific labor market courses, general labor market courses, and family andconsumer sciences. The NLSY97 1980 cohort sample shows about 22.4% vocational concentrators(students taking three or more courses in a single SLMP area), as compared to the next most recentsurvey showing 25% of American students as vocational concentrators. However, this survey wasdone in 1994, and percentages are likely to have changed by the time the NLSY97 1980 birth cohortwas finishing high school.
Data Limitations
As mentioned above, the transcript sample is somewhat limited relative to the entire NLSY97data set. First, we are missing transcripts for about half of the 1980 birth cohort, making a full-scaleanalysis of the experiences of that cohort problematic. Second, although we carefully inspected eachstudent’s transcript supplemented by other available information about the student or school, it ispossible that one could misinterpret a school’s credit system or grading system. Third, there aresome incomplete transcripts. Although this is to be expected given student dropout rates andtransfers, it still poses some problems for validity. Nonetheless, given the comparisons we havemade with the full 1980 cohort and other national data sets, we feel confident that these data canbegin to give us an understanding of current patterns of coursetaking and associations withdropping out of high school.

Dropping Out of High School and the Place of Career and Technical Education
National Research Center for Career and Technical Education 33
REFERENCES
Advisory Committee for the National Assessment of Vocational Education. (2003). Report of theAdvisory Committee for the National Assessment of Vocational Education. Washington,DC: U.S. Department of Education Office of the Under Secretary.
Agodini, R., & Deke, J. (in press). The relationship between high school vocational education anddropping out. Princeton, NJ: Mathematica Policy Research.
Alexander, K. L., Entwisle, D. R., & Kabbani, N. S. (2001). The dropout process in life courseperspective: Early risk factors at home and school. Teachers College Record, 103(5),760–822.
Allison, P. D. (1995). Survival analysis using the SAS system: A practical guide. Cary, NC: SASInstitute.
Arum, R. (1998). Invested dollars or diverted dreams: The effect of resources on vocationalstudents’ educational outcomes. Sociology of Education, 71(2), 130–151.
Arum, R. (2003). Judging school discipline: The crisis of moral authority. Cambridge, MA:Harvard University Press.
Balfanz, R., & Legters, N. (2004). Locating the dropout crisis: Where are they located? Whoattends them? Baltimore: Johns Hopkins University Center for Social Organization ofSchools.
Bishop, J. (1988). Vocational education for at-risk youth: How can it be made more effective?(Working paper 88–11). Ithaca, NY: School of Industrial and Labor Relations at CornellUniversity. (ERIC Document Reproduction Service No. ED297150)
Bishop, J. H., & Mane, F. (2004). The impacts of career-technical education on high schoolcompletion and labor market success. Economics of Education Review, 23(4), 381–402.
Castellano, M., Stringfield, S., & Stone, J. R, III. (2003). Secondary career and technical educationand comprehensive school reform: Implications for research and practice. Review ofEducational Research, 73(2), 231–272.
Catterall, J. S., & Stern, D. (1986). The effects of alternative programs on high school completionand labor market outcomes. Educational Evaluation and Policy Analysis, 8(1), 77–86.
Cavanagh, S. (2005, February 23). Vocational education’s new job: Defend thyself. EducationWeek.
Coombs, J., & Cooley, W. W. (1968). Dropouts: In high school and after school. AmericanEducational Research Journal, 5, 343–363.
Curtin, T. R., Ingels, S. J., Wu, S., Heuer, R., & Research Triangle Institute. (2002). User’smanual: National education longitudinal study of 1988 [NELS:88]: Base-year to fourthfollow-up: Student component data file (NCES 2002–323). Washington, DC: U.S.Department of Education, Institute of Education Sciences, National Center for EducationStatistics. Retrieved October 1, 2005, from http://nces.ed.gov/pubsearch/pubsinfo.asp?pubid=2002323

Dropping Out of High School and the Place of Career and Technical Education
34 National Research Center for Career and Technical EducationN
DeLuca, S., Plank, S., & Estacion, A. (2005). Does the “new” vocational education promote orreduce educational stratification? The links between career and technical education andcollege enrollment. Unpublished manuscript, Johns Hopkins University.
Educational Testing Service. (1995). Dreams deferred: High school dropouts in the United States.Princeton, NJ: Author.
Entwisle, D. R., Alexander, K. L., & Olson, L. S. (2004). Temporary as compared to permanenthigh school dropout. Social Forces, 82(3), 1181–1205.
Fine, M. (1991). Framing dropouts: Notes on the politics of an urban high school. Albany: StateUniversity of New York Press.
Finn, J. D. (1989). Withdrawing from school. Review of Educational Research, 59(2), 117–142.
Grasso, J. F., & Shea, J. R. (1979). Vocational education and training: Impact on youth. Berkeley,CA: Carnegie Council on Policy Studies in Higher Education.
Kaufman, P., Alt, M. N., & Chapman, C. D. (2004). Dropout rates in the United States: 2001.Washington, DC: U.S. Department of Education.
Kaufman, P., Kwon, J. Y., Klein, S., & Chapman, C. D. (1999). Dropout rates in the United States:1998. Washington, DC: U.S. Department of Education.
Klerman, J. A., & Karoly, L. A. (1994). Young men and the transition to stable employment.Monthly Labor Review, 117, 31–48.
Kulik, J. A. (1998). Curricular tracks and high school vocational education. In A. Gamoran (Ed.),The quality of vocational education: Background papers from the 1994 NationalAssessment of Vocational Education. Washington, DC: U.S. Department of Education.
Levesque, K., Lauen, D., Teitelbaum, P., Alt, M., & Liebrera, S. (2000). Vocational education in theUnited States: Toward the Year 2000 (NCES 2000–029). Washington, DC: U.S.Department of Education.
Little, R. J. A., & Rubin, D.B . (1987). Statistical analysis with missing data. New York: JohnWiley.
Lynch, R. L. (2000). High school career and technical education for the first decade of the 21stcentury. Journal of Vocational Education Research, 25, 155–198.
McDill, E. L., Natriello, G., & Pallas, A. M. (1986). A population at risk: Potential consequences oftougher school standards for student dropouts. American Journal of Education, 94(2),135–181.
Mertens, D. M., Seitz, P., & Cox, S. (1982). Vocational education and the high school dropout.Columbus, OH: National Center for Research on Vocational Education. (ERIC DocumentReproduction Service No. ED228297)
Miao, J., & Haney, W. (2004). High school graduation rates: Alternative methods and implications.Education Policy Analysis Archives, 12(55). Retrieved November 22, 2004, fromhttp://epaa.asu.edu/epaa/v12n55/

Dropping Out of High School and the Place of Career and Technical Education
National Research Center for Career and Technical Education 35
Mishel, L., & Bernstein, J. (1994). The state of working America. New York: Economic PolicyInstitute.
National Center for Education Statistics. (1999). 1998 revision of the Secondary School Taxonomy(Working paper no. 1999–06). Washington, DC: U.S. Department of Education.
National Center for Education Statistics. (2001). Features of occupational programs at thesecondary and postsecondary education levels (NCES 2001–018). Washington, DC: U.S.Department of Education.
National Center for Education Statistics. (2004). The high school transcript study: A decade ofchange in curricula and achievement, 1990–2000 (NCES 2004–455). Washington, DC:U.S. Department of Education.
National Research Council. (1993). Losing generations: Adolescents in high-risk settings.Washington, DC: National Academy Press.
Newmann, F. M., Wehlage, G. G., & Lamborn, S. D. (1992). The significance and sources ofstudent engagement. In F. M. Newmann (Ed.), Student engagement and achievement inAmerican secondary schools (pp. 11–39). New York: Teachers College Press.
The Ohio State University, Center for Human Resource Research. NLSY97 [National longitudinalsurvey of youth 1997] user’s guide: A guide to the rounds 1–5 data. 2003. Washington,DC: U.S. Department of Labor, Bureau of Labor Statistics. Retrieved October 1, 2005, fromhttp://www.bls.gov/nls/97guide/rd5/nls97ugall.pdf
Orfield, G. (Ed.). (2004). Dropouts in America: Confronting the graduation rate crisis.Cambridge, MA: Harvard Education Publishing Group.
Perlmutter, D. E. (1982). Career training choice: Project CATCH. A follow-up study of studentsdenied admission to vocational high schools. Brooklyn: New York City Board ofEducation, Office of Occupational and Career Education. (ERIC Document ReproductionService No. ED219563)
Pittman, R. B. (1991). Social factors, enrollment in vocational/technical courses, and high schooldropout rates. Journal of Educational Research, 84(5), 288–295.
Plank, S. B. (2001). A question of balance: CTE, academic courses, high school persistence, andstudent achievement. Journal of Vocational Education Research, 26(3), 279–327.
Rasinski, K. A., & Pedlow, S. (1998). The effect of high school vocational education on academicachievement gain and high school persistence: Evidence from NELS:88. In A. Gamoran(Ed.), The quality of vocational education: Background papers from the 1994 NationalAssessment of Vocational Education. Washington, DC: U.S. Department of Education.
Rubin, D. B. (1987). Multiple imputation for nonresponse in surveys. New York: John Wiley.
Rumberger, R. W. (1987). school dropouts: A review of issues and evidence. Review ofEducational Research, 57(2), 101–121.

Dropping Out of High School and the Place of Career and Technical Education
36 National Research Center for Career and Technical EducationN
Rumberger, R. W. (2001, January 13). Why students drop out of school and what can be done.Revised version of paper presented at the conference, “Dropouts in America: How severe isthe problem? What do we know about intervention and prevention?” Harvard University,Cambridge, MA. Retrieved November 21, 2004, from http://www.civilrightsproject.harvard.edu/research/dropouts/rumberger.pdf
Rumberger, R. W. (2004). Why students drop out of school. In G. Orfield (Ed.), Dropouts inAmerica: Confronting the graduation rate crisis (pp. 131–155). Cambridge, MA: HarvardEducation Publishing Group.
Rumberger, R. W., & Lamb, S. P. (1998). The early employment and further education experiencesof high school dropouts: A comparative study of the United States and Australia. Paperprepared for the Organisation for Economic Co-operation and Development.
Schafer, J. L. (1997). Analysis of incomplete multivariate data. London: Chapman and Hall.
Stone, J. R., III. (2000). [Editor’s notes]. Journal of Vocational Education Research, 25, 85–91.
Swanson, C. B., & Chaplin, D. (2003). Counting high school graduates when graduates count:Measuring graduation rates under the high stakes of NCLB. Washington, DC: The UrbanInstitute. Retrieved November 23, 2004, from http://www.urban.org/UploadedPDF/410641_NCLB.pdf
U.S. Department of Education. (1999). Taking responsibility for ending social promotion.Washington, DC: Author.
Weber, J. M. (1988). Dropout rates for students in different high school curricula. Journal ofVocational Education Research, 13, 35–49.
Wehlage, G. G., Rutter, R. A., Smith, G., Lesko, N., & Fernandez, R. (1989). Reducing the risk:Schools as communities of support. Philadelphia: Falmer.
Willett, J. B., & Singer, J. D. (1991). From whether to when: New methods for studying studentdropout and teacher attrition. Review of Educational Research, 61(4), 407–450.