driving digital intelligence through unified data, analytics, and visualization: expanding...
TRANSCRIPT

Expanding Uniformance Driving Digital Intelligence through Unified Data, Analytics, and Visualization

The Information Challenge
© 2015 Honeywell Process Solutions All Rights Reserved 2
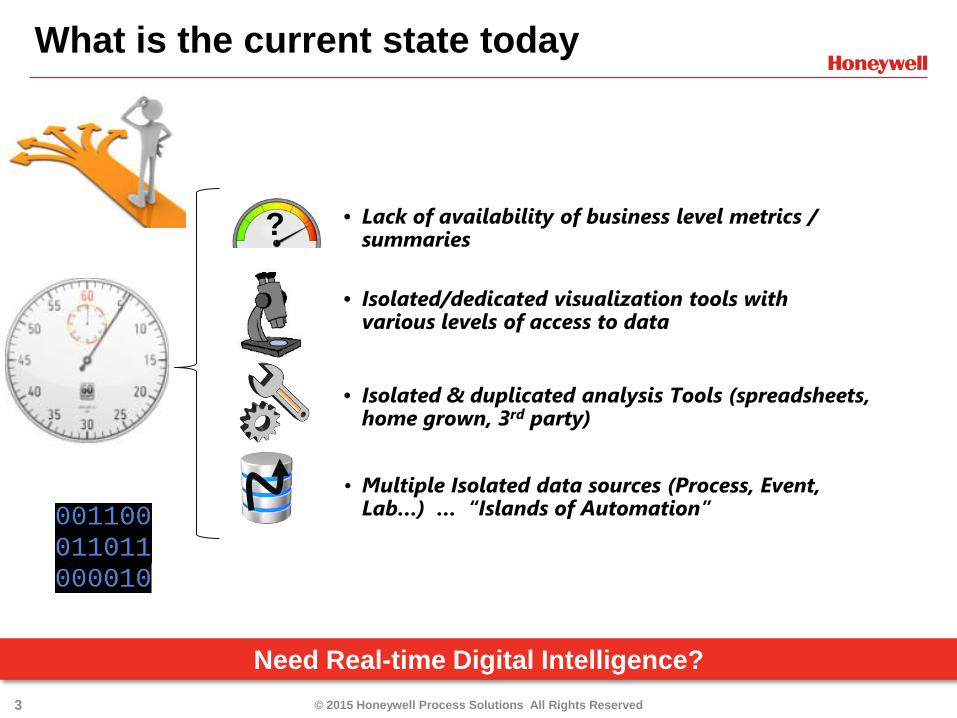
What is the current state today
© 2015 Honeywell Process Solutions All Rights Reserved 3
Need Real-time Digital Intelligence?
• Lack of availability of business level metrics / summaries
• Isolated & duplicated analysis Tools (spreadsheets, home grown, 3rd party)
• Isolated/dedicated visualization tools with various levels of access to data
• Multiple Isolated data sources (Process, Event, Lab…) … “Islands of Automation”
?
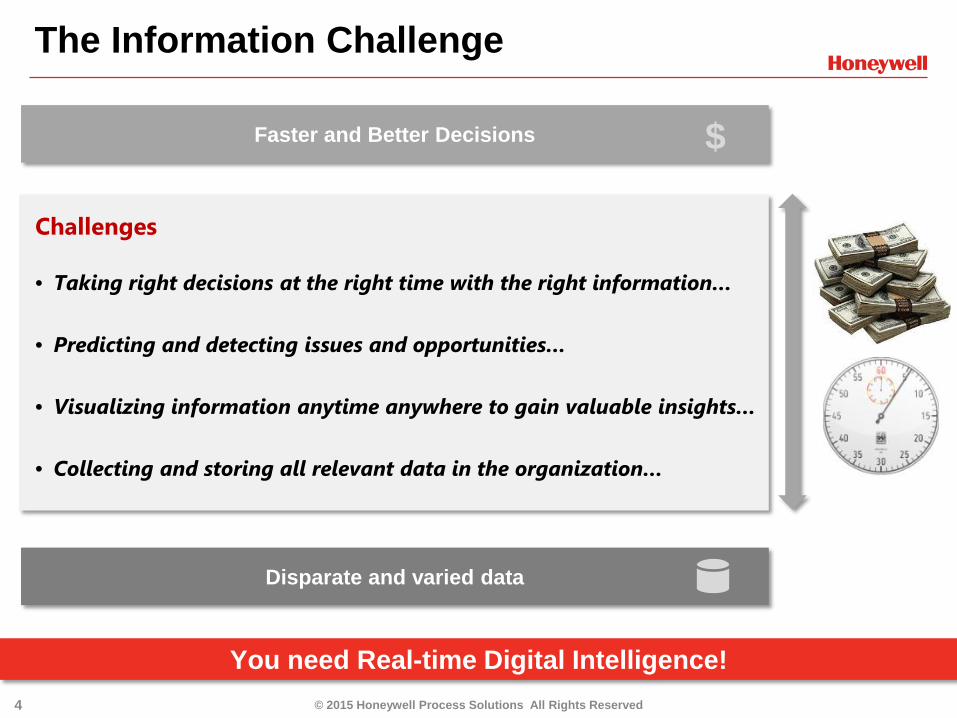
The Information Challenge
© 2015 Honeywell Process Solutions All Rights Reserved 4
Challenges
• Taking right decisions at the right time with the right information… • Predicting and detecting issues and opportunities…
• Visualizing information anytime anywhere to gain valuable insights…
• Collecting and storing all relevant data in the organization…
You need Real-time Digital Intelligence!
Disparate and varied data
Faster and Better Decisions $
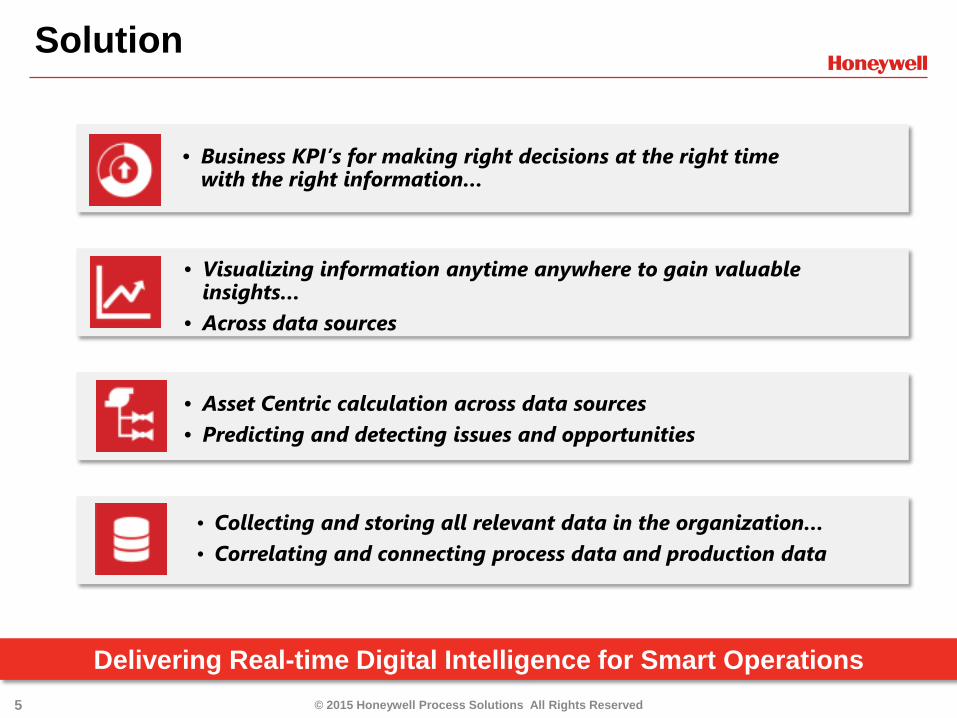
Solution
© 2015 Honeywell Process Solutions All Rights Reserved 5
Delivering Real-time Digital Intelligence for Smart Operations
• Business KPI’s for making right decisions at the right time with the right information…
• Asset Centric calculation across data sources • Predicting and detecting issues and opportunities
• Visualizing information anytime anywhere to gain valuable insights…
• Across data sources
• Collecting and storing all relevant data in the organization… • Correlating and connecting process data and production data
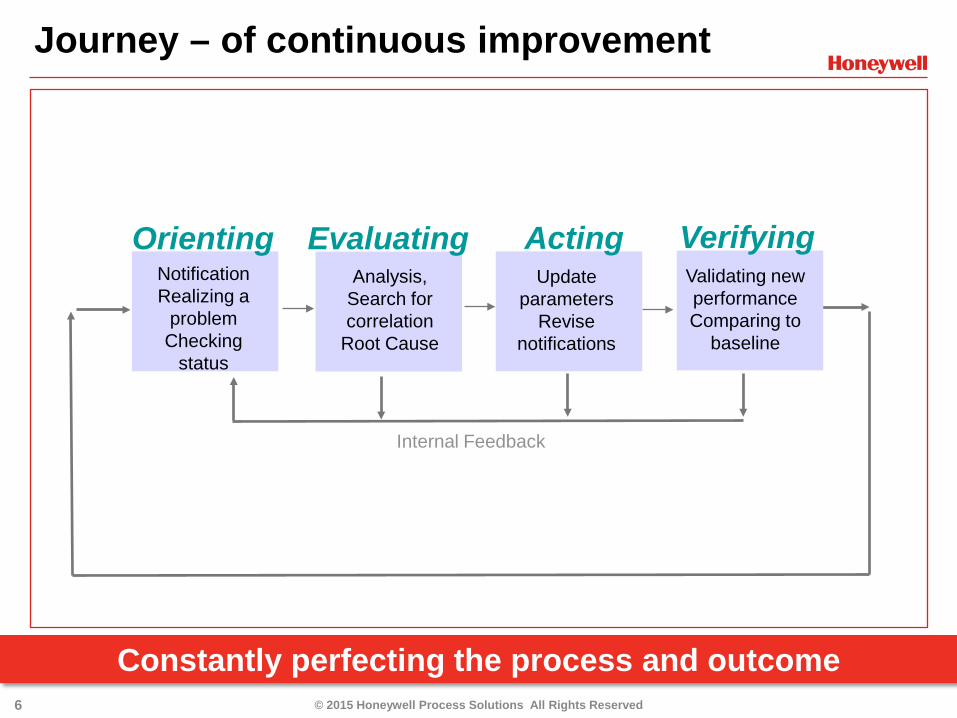
Journey – of continuous improvement
Constantly perfecting the process and outcome © 2015 Honeywell Process Solutions All Rights Reserved 6
Analysis, Search for correlation
Root Cause
Internal Feedback
Orienting Evaluating Notification Realizing a
problem Checking
status
Update parameters
Revise notifications
Acting Verifying Validating new performance Comparing to
baseline

7
New Crude vendor affects the quality and energy use
7 © 2015 Honeywell Process Solutions All Rights Reserved
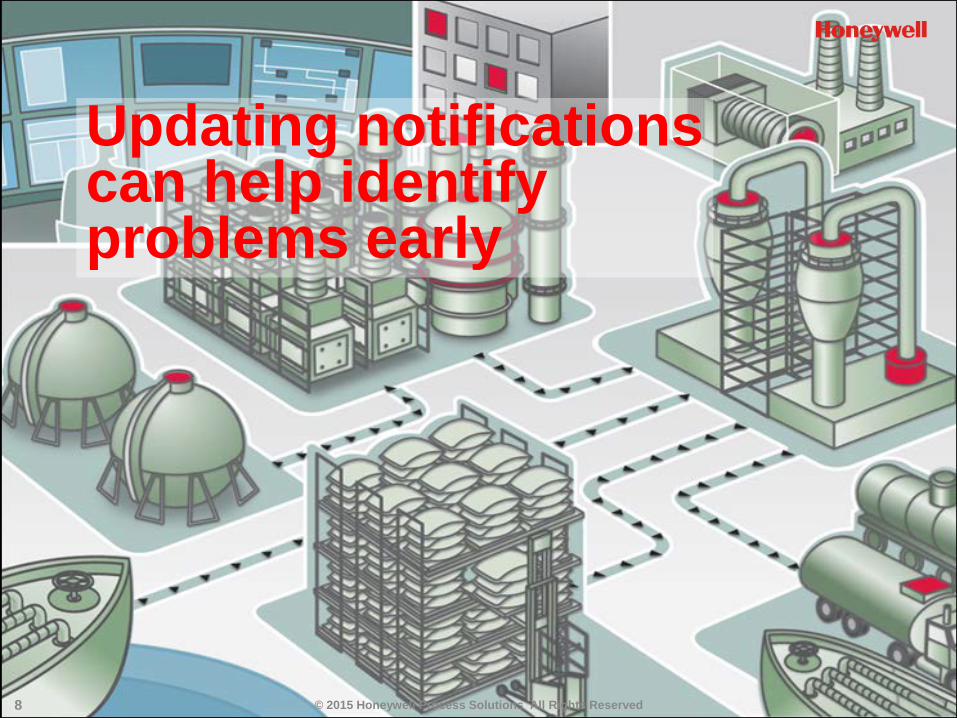
8
Updating notifications can help identify problems early
© 2015 Honeywell Process Solutions All Rights Reserved 8

9 © 2015 Honeywell Process Solutions All Rights Reserved 9
Equipment issues can have an effect on product quality
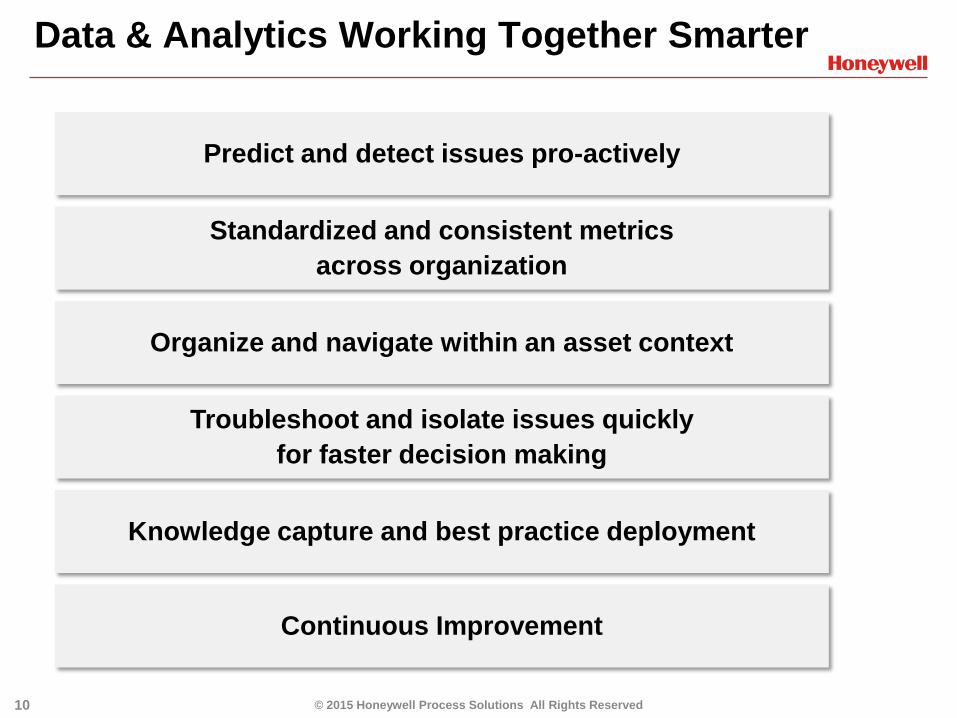
Data & Analytics Working Together Smarter
© 2015 Honeywell Process Solutions All Rights Reserved 10
Predict and detect issues pro-actively
Standardized and consistent metrics across organization
Organize and navigate within an asset context
Troubleshoot and isolate issues quickly for faster decision making
Knowledge capture and best practice deployment
Continuous Improvement
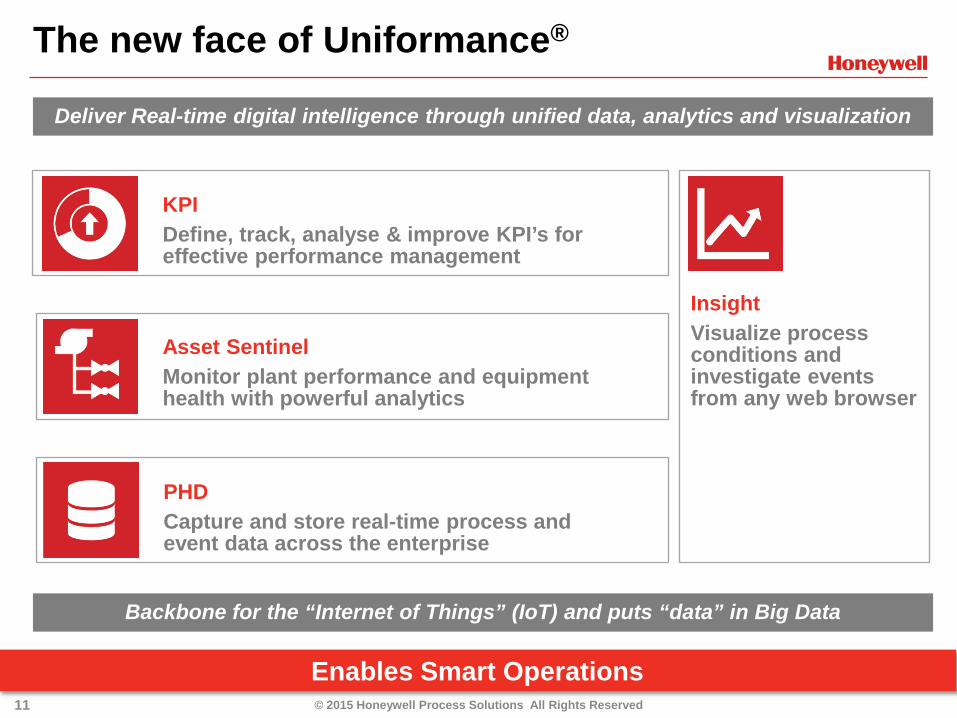
The new face of Uniformance®
Enables Smart Operations © 2015 Honeywell Process Solutions All Rights Reserved 11
Deliver Real-time digital intelligence through unified data, analytics and visualization
PHD Capture and store real-time process and event data across the enterprise
Asset Sentinel Monitor plant performance and equipment health with powerful analytics
KPI Define, track, analyse & improve KPI’s for effective performance management
Insight Visualize process conditions and investigate events from any web browser
Backbone for the “Internet of Things” (IoT) and puts “data” in Big Data

The new face of Uniformance®
Driving better and faster decision making © 2015 Honeywell Process Solutions All Rights Reserved 12
Adding Asset data and calculations as well as process KPI’s
The traditional Process Historian expanded with advanced asset based calculation capability as well as KPI visualization.
PHD Capture and store real-time process and event data across the enterprise
Asset Sentinel Monitor plant performance and equipment health with powerful analytics
KPI Define, track, analyse & improve KPI’s for effective performance management
Insight Visualize process conditions and investigate events from any web browser
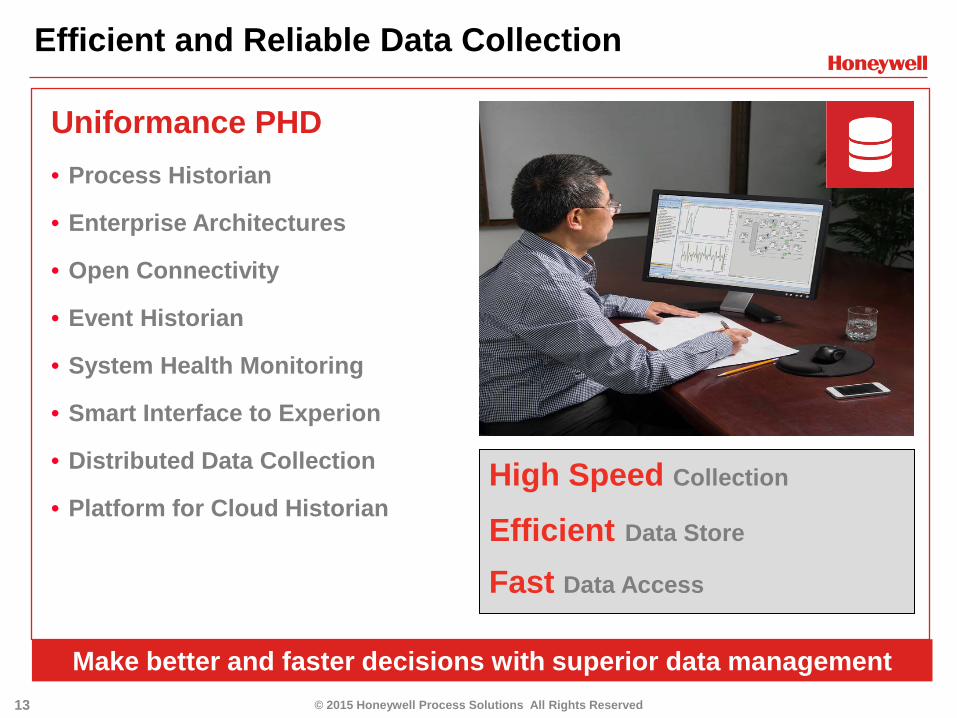
Uniformance PHD • Process Historian
• Enterprise Architectures
• Open Connectivity
• Event Historian
• System Health Monitoring
• Smart Interface to Experion
• Distributed Data Collection
• Platform for Cloud Historian
Make better and faster decisions with superior data management
Efficient and Reliable Data Collection
© 2015 Honeywell Process Solutions All Rights Reserved 13
High Speed Collection
Efficient Data Store
Fast Data Access

Features • Enterprise Historian • Scalability to
• millions of tags • years of history
• Consolidated Event Journal to correlate events with process History
• Premier integration with Experion® DCS
• Tag Sync for Experion and OPC
Benefits • Security • Combined process, engineering
and business data • A foundation for process analysis
and reporting • The right tools to transform data
to valuable information
Uniformance® PHD
© 2015 Honeywell Process Solutions All Rights Reserved 14
Text PHD is the perfect choice for any Historian application, large / small, connected to Experion or OPC, and provides not only Process
History but also a powerful Event History database.

Uniformance® Process Studio • Easy to learn
• Enables Productivity and Collaboration
• Reuse of existing trends and displays
• Includes: Trend Graphics Excel Companion Adv. Analysis trends Event History viewer
Powerful End User Analysis tool for History and Events
Industry Leading User Tools
© 2015 Honeywell Process Solutions All Rights Reserved 15
Intuitive operation
Advanced trending
Open connectivity

Features • Common drag and drop • User-friendly time control • Flexible trend • Advanced analysis trends and
charts • Excel Companion add-in • Graphics • OPC HDA data access • Event history viewer (CEJ)
Benefits • Easy to learn • Enables productivity and
collaboration • Reuse of existing trends and
displays • Single tool for data visualization
and analysis
Uniformance® Process Studio
© 2015 Honeywell Process Solutions All Rights Reserved 16
Text Uniformance Process Studio is the perfect comprehensive tool for rich visualization and analysis of time series data as well as event data. UPS can be used with any Historian supporting OPC HDA.

Uniformance® Asset Sentinel • Comprehensive monitoring
solution from instruments to process unit
• Continuously calculates and assess performance against fault/rules model to predict & detect potential faults
• Makes problems visible through notifications and web-based health and performance dashboards, trends and reports
• Organizes and presents data according to plant/asset model vs. tag based organization
Real-time sentinel for continuous health surveillance
Real-time process/asset monitoring & analytics
© 2015 Honeywell Process Solutions All Rights Reserved 17
Asset Sentinel Modules: Instrument Sentinel Process & Equipment Sentinel Energy Sentinel

Features Advanced calculation engine
• Scheduled & On-data Change • Template calculations • Embedded performance models • UniSim and Thermo package
Event Detection • Rules engine • Notifications
Visualization & Reporting • Asset dashboards, trends, reports • Graphics & Displays
Benefits • Automated surveillance to predict
and detect problems - free up resources for problem solving
• Ready access to information to address problems quickly
• Easy to configure and maintain with embedded content
• Consolidates multiple monitoring functions and applications in single location
Uniformance® Asset Sentinel
© 2015 Honeywell Process Solutions All Rights Reserved 18
Text Robust field-proven solution monitoring billions of dollars of process assets across industries including mining,
oil and gas, power, and aerospace.
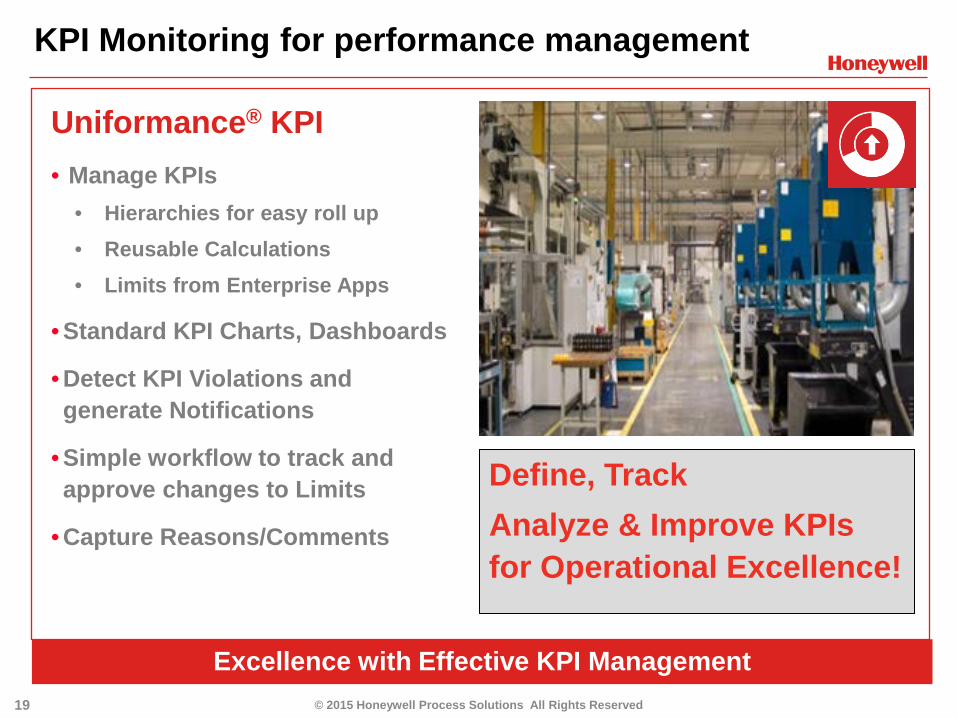
Uniformance® KPI • Manage KPIs
• Hierarchies for easy roll up • Reusable Calculations • Limits from Enterprise Apps
• Standard KPI Charts, Dashboards
• Detect KPI Violations and generate Notifications
• Simple workflow to track and approve changes to Limits
• Capture Reasons/Comments
Excellence with Effective KPI Management
KPI Monitoring for performance management
© 2015 Honeywell Process Solutions All Rights Reserved 19
Define, Track Analyze & Improve KPIs for Operational Excellence!

Features • Connect to any Honeywell or 3rd
party applications. • Visualize and analyze KPI’s to get
insights • Track thousands of KPIs to grow
with your business; retain history for years
• Obtain alerts when KPI violates a limit
• Access KPI’s and the related information on mobile devices
Benefits • Improved insights • Improved business decision
making • Increased business performance
Uniformance® KPI
© 2015 Honeywell Process Solutions All Rights Reserved 20
Text Complete solution for effective KPI management

Uniformance® Insight • Thin client web visualization
• Interactive user-defined trends
• Process dashboards
• Ad-Hoc visualization
• Visualization of events, trend with events
• Dynamic Calculations
• Access Data and Model
• Sharing and collaboration
• Mobile device support
Gain powerful insight from process and production data
Powerful User based visualization
© 2015 Honeywell Process Solutions All Rights Reserved 21
Ad-hoc analysis
Flexible workspaces
Convenient sharing

Features • Graphics and flexible ad-hoc
trends • Available in the office from a PC
or in the field from a tablet • Supports Uniformance PHD and
3rd party historians and data sources
• Thin client application requires no installation on user devices
• Easy workspace layout management
Benefits • Collaborate to share discoveries
and useful displays with coworkers
• Intuitive so users are productive from Day One
• No cost to get the application to users’ desktops / tablet
Uniformance® Insight
© 2015 Honeywell Process Solutions All Rights Reserved 22
Text Uniformance Insight will be the perfect thin client visualization and analysis tools for PHD and any OPC HDA based Historian. HTML5 support will make it run in any modern browser / device.

Solutions and Case Stories
© 2015 Honeywell Process Solutions All Rights Reserved 23

Solution – Equipment Health Surveillance
© 2015 Honeywell Process Solutions All Rights Reserved 24
Challenge • No clear view of all equipment • Ad-hoc maintenance expensive • Increased downtime from upsets • Lack of surveillance automation
Solution Applied • Asset Sentinel - advanced analytics and event detection to predict failures.
• Insight - additional visualization and analysis to troubleshooting and diagnosing of problems
Key Results • Increased plant and asset
availability • Reduced maintenance cost • Extended equipment life • Increased safety

Solution – KPI Management
© 2015 Honeywell Process Solutions All Rights Reserved 25
Challenge • Lack of visibility into performance • Reduced productivity
Solution Applied • PHD to log all process data from the plant
• KPI to organize data for all processes, and to generate KPI’s and KPI dashboards for easy visualization of the process goals.
Key Results • Greater understanding of
performance • Improved decision making • Better reporting • Enhanced productivity

Solution – Process Monitoring
© 2015 Honeywell Process Solutions All Rights Reserved 26
Challenge • Equipment Downtime issues • Lack of full understanding of operations and profitability
Solution Applied • Asset Sentinel - performance models for measuring actuals vs. expected efficiency
• KPI – visualization and tracking of key performance metrics
• Insight – visualization and analysis
Key Results • Improved profitability and unit
operations • Energy Savings • Improved Equipment Reliability • Reduced Downtime

Solution – Energy Monitoring
© 2015 Honeywell Process Solutions All Rights Reserved 27
Challenge • Rising Energy costs • Lack of visibility into energy use
Solution Applied • PHD – logging of energy data • Asset Sentinel - organizing and calculate energy consumption of key assets.
• KPI – Energy Dashboard
Key Results • Reduced Energy costs • Lower resource utilization • Improved reliability and efficiency

Roadmap
© 2015 Honeywell Process Solutions All Rights Reserved 28

Uniformance Insight after R100
• Enhanced mobile device interaction
• Integrated calculations for any data source
• Asset templating and navigation
• Event monitoring and investigation
• Thin client HMIWeb display builder
• Migration tools
• Advanced Charts • Annotations • Trending with Events
R100 is just the beginning © 2015 Honeywell Process Solutions All Rights Reserved 29
Summary
Strong competitive feature set
The New Enhanced Uniformance Suite • Adding new powerful visualization • Strong Asset Modelling and Templates • New Advanced Analysis
‒ Asset based analysis with powerful new libraries ‒ KPI Analysis and Visualization ‒ Event detection and Notification
• Fully integrated ‒ provide superior interaction and collaboration
© 2015 Honeywell Process Solutions All Rights Reserved 30

Expanding the Uniformance Suite
Digital Intelligence enables Smart Operations © 2015 Honeywell Process Solutions All Rights Reserved 31
Powerful process and event data collection
Strong Asset based modeling, eventing, notifications and calculations
Process KPI calculations and visualization
New modern thin-client visualization and analysis client
Capture and store real-time process and event data across the enterprise
Uniformance® PHD
Monitor plant performance and equipment health with powerful analytics
Uniformance Asset Sentinel
Define, track, analyze & improve KPI’s for effective performance management
Uniformance® KPI Uniformance® Insight
Visualize process conditions and investigate events from any web browser

Customer overview
© 2015 Honeywell Process Solutions All Rights Reserved 32
Engineering Procurement Construction Customers

Don’t forget to get more information!
Sessions to add to Schedule:
Today 4:15 pm Uniformance Asset Sentinel Intelligent Process and Equipment Surveillance Grand Oaks Ballroom EF
Tomorrow 8:55 am Chevron Pipeline Measurement Solution (Using Asset Sentinel) Oil and Gas Breakout Grand Oaks Ballroom CD
© 2015 Honeywell Process Solutions All Rights Reserved 33
Digital Transformation Uniformance Suite Software Pod #5

Go Mobile with Honeywell
© 2015 Honeywell Process Solutions All Rights Reserved 34
• Stay connected to plant performance anywhere
• View plant data and information in real time
• Look for trends and upset conditions
• Identify problems as early as possible
• Enable a faster response to issues
Stay Connected to Your Enterprise – Wherever You Are

35 © 2015 Honeywell Process Solutions All Rights Reserved 35

36 © 2015 Honeywell Process Solutions All Rights Reserved 36

Data and Analytics working together and smarter
© 2015 Honeywell Process Solutions All Rights Reserved 37