drivers of oss bss spending
TRANSCRIPT
Drivers of OSS BSS Spending
Jayesh Easwaramony,Vice President, ICT Practice
2P4E6-60
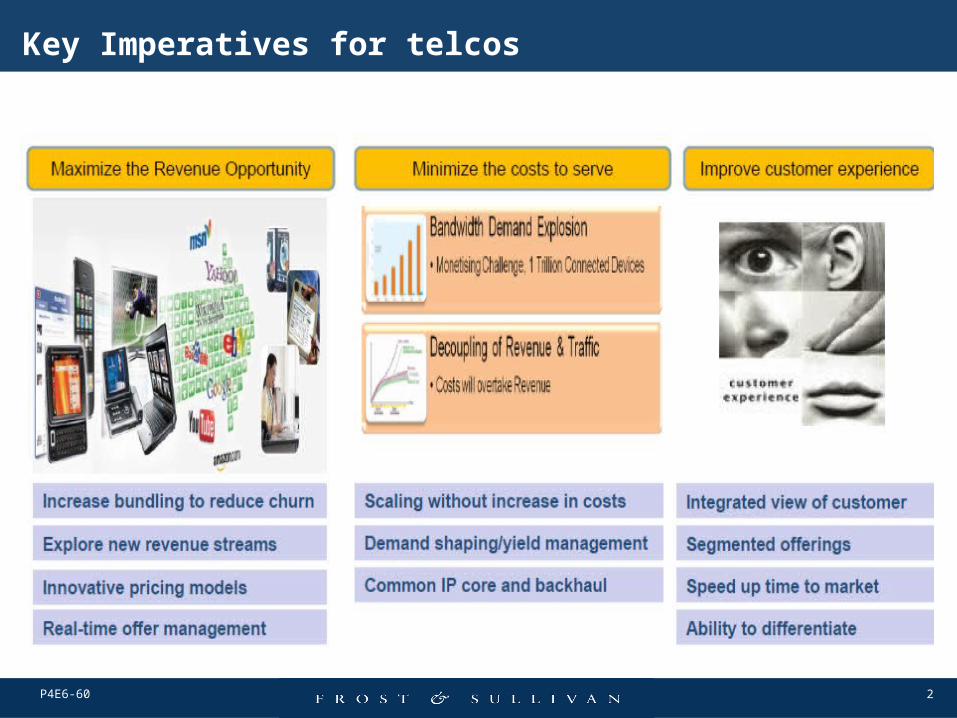
Key Imperatives for telcos
3P4E6-60
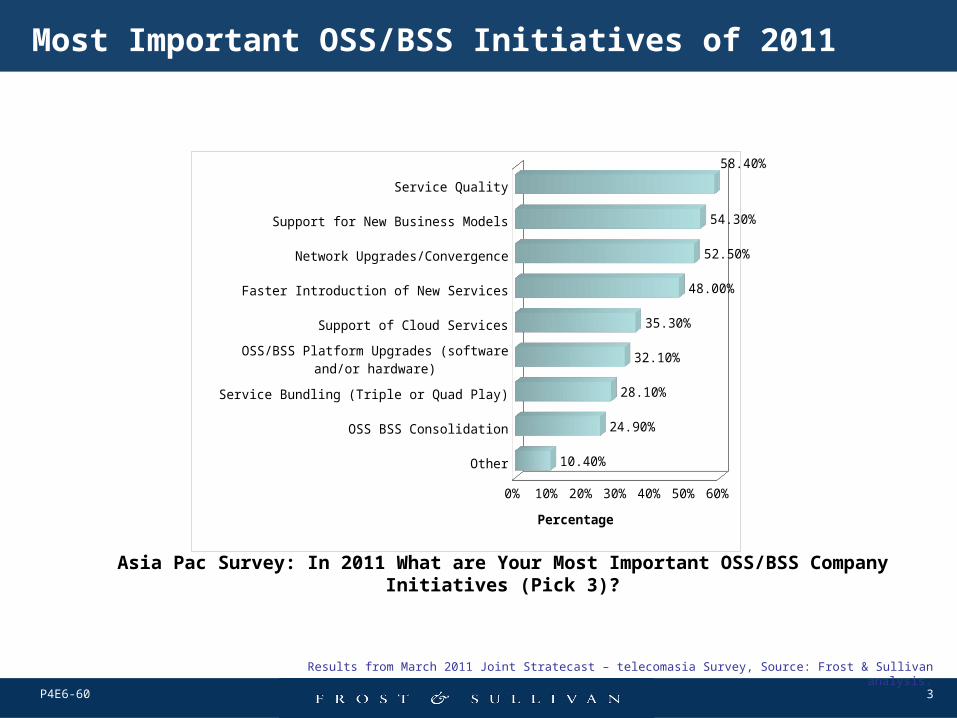
Most Important OSS/BSS Initiatives of 2011
Asia Pac Survey: In 2011 What are Your Most Important OSS/BSS Company Initiatives (Pick 3)?
Results from March 2011 Joint Stratecast – telecomasia Survey, Source: Frost & Sullivan analysis.
Other
OSS BSS Consolidation
Service Bundling (Triple or Quad Play)
OSS/BSS Platform Upgrades (software and/or hardware)
Support of Cloud Services
Faster Introduction of New Services
Network Upgrades/Convergence
Support for New Business Models
Service Quality
0% 10% 20% 30% 40% 50% 60%
10.40%
24.90%
28.10%
32.10%
35.30%
48.00%
52.50%
54.30%
58.40%
Percentage
4P4E6-60
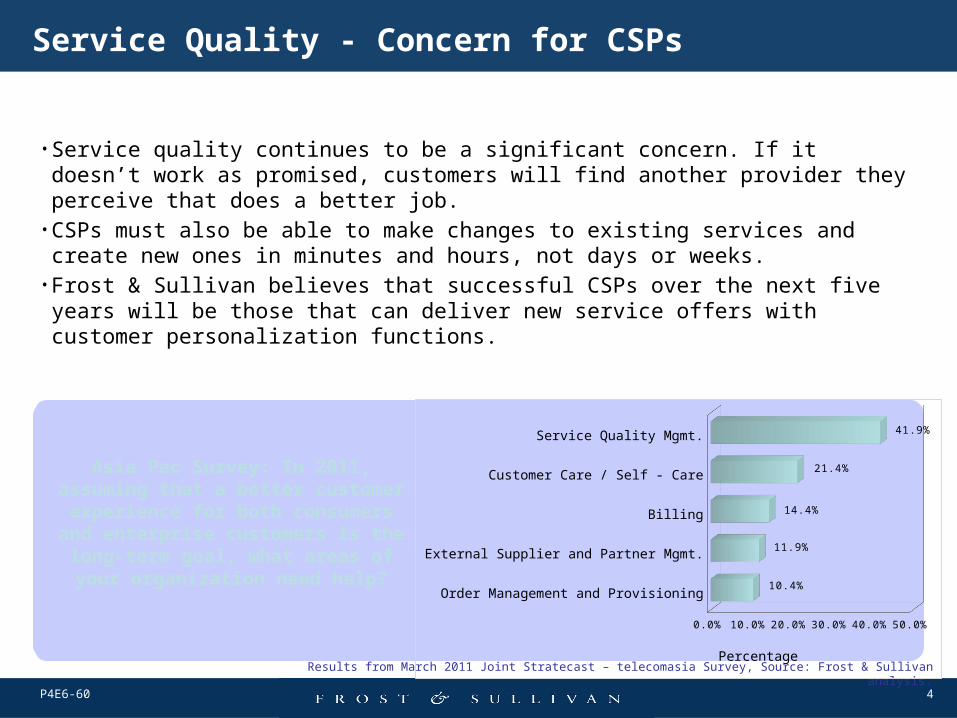
Service Quality - Concern for CSPs
• Service quality continues to be a significant concern. If it doesn’t work as promised, customers will find another provider they perceive that does a better job.
• CSPs must also be able to make changes to existing services and create new ones in minutes and hours, not days or weeks.
• Frost & Sullivan believes that successful CSPs over the next five years will be those that can deliver new service offers with customer personalization functions.
Asia Pac Survey: In 2011, assuming that a better customer experience for both consumers and enterprise customers is the long-term goal, what areas of your organization need help?
Results from March 2011 Joint Stratecast – telecomasia Survey, Source: Frost & Sullivan analysis.
Order Management and Provisioning
External Supplier and Partner Mgmt.
Billing
Customer Care / Self - Care
Service Quality Mgmt.
0.0% 10.0% 20.0% 30.0% 40.0% 50.0%
10.4%
11.9%
14.4%
21.4%
41.9%
Percentage
5P4E6-60
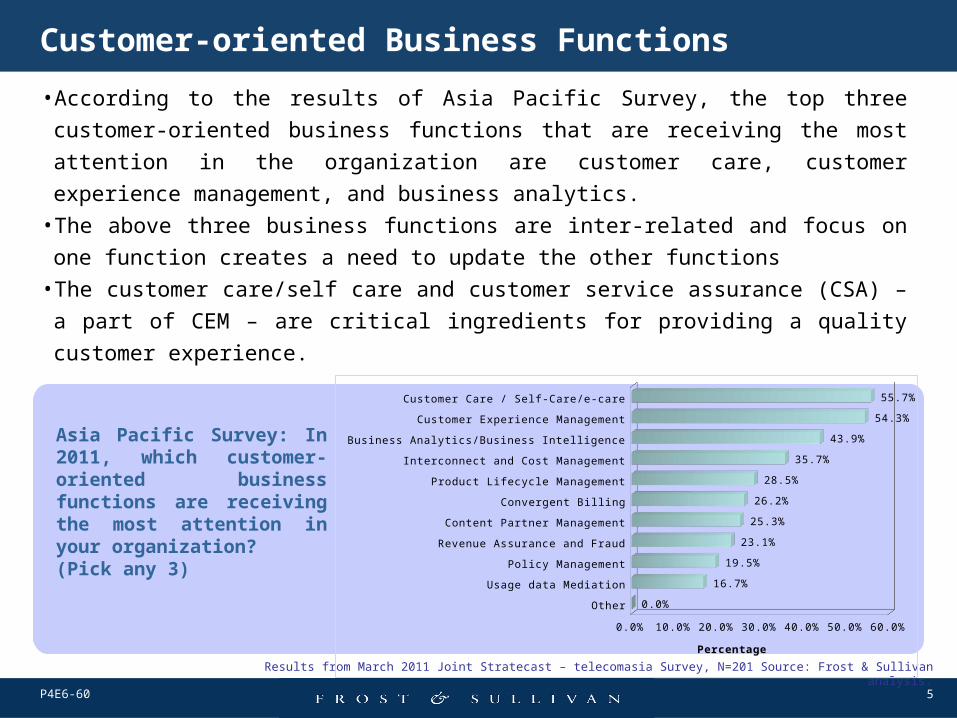
Customer-oriented Business Functions
Asia Pacific Survey: In 2011, which customer-oriented business functions are receiving the most attention in your organization?(Pick any 3)
• According to the results of Asia Pacific Survey, the top three customer-oriented
business functions that are receiving the most attention in the organization are
customer care, customer experience management, and business analytics. • The above three business functions are inter-related and focus on one function
creates a need to update the other functions• The customer care/self care and customer service assurance (CSA) – a part of
CEM – are critical ingredients for providing a quality customer experience.
Results from March 2011 Joint Stratecast – telecomasia Survey, N=201 Source: Frost & Sullivan analysis.
Other
Usage data Mediation
Policy Management
Revenue Assurance and Fraud
Content Partner Management
Convergent Billing
Product Lifecycle Management
Interconnect and Cost Management
Business Analytics/Business Intelligence
Customer Experience Management
Customer Care / Self-Care/e-care
0.0% 10.0% 20.0% 30.0% 40.0% 50.0% 60.0%
0.0%
16.7%
19.5%
23.1%
25.3%
26.2%
28.5%
35.7%
43.9%
54.3%
55.7%
Percentage
6P4E6-60
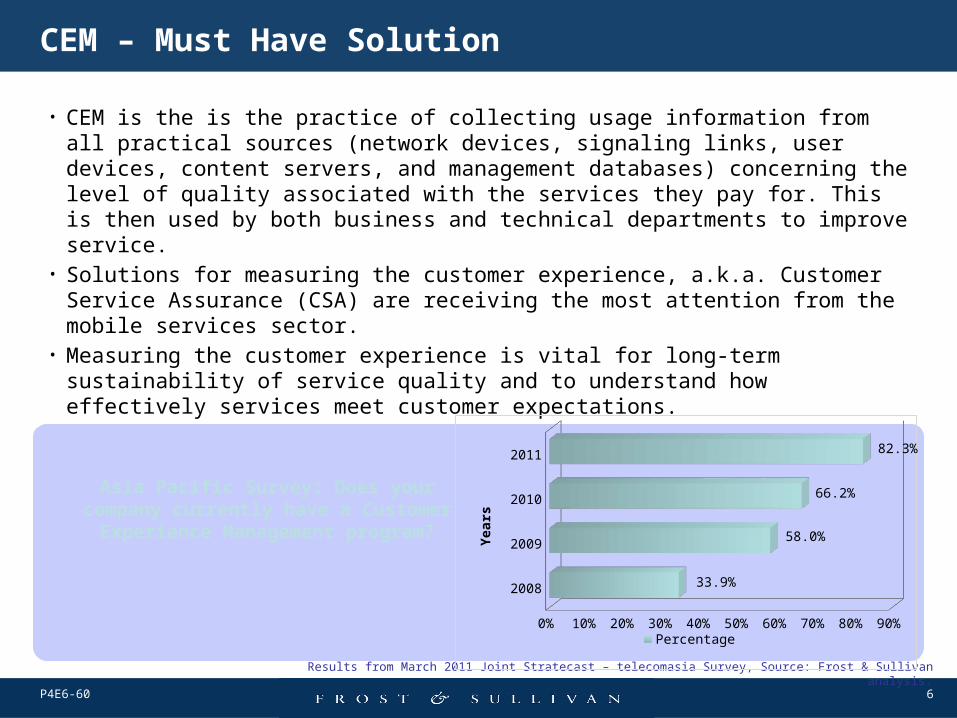
CEM – Must Have Solution
• CEM is the is the practice of collecting usage information from all practical sources (network devices, signaling links, user devices, content servers, and management databases) concerning the level of quality associated with the services they pay for. This is then used by both business and technical departments to improve service.
• Solutions for measuring the customer experience, a.k.a. Customer Service Assurance (CSA) are receiving the most attention from the mobile services sector.
• Measuring the customer experience is vital for long-term sustainability of service quality and to understand how effectively services meet customer expectations.
Asia Pacific Survey: Does your company currently have a Customer Experience
Management program?
Results from March 2011 Joint Stratecast – telecomasia Survey, Source: Frost & Sullivan analysis.
2008
2009
2010
2011
0% 10% 20% 30% 40% 50% 60% 70% 80% 90%
33.9%
58.0%
66.2%
82.3%
Percentage
Years
7P4E6-60
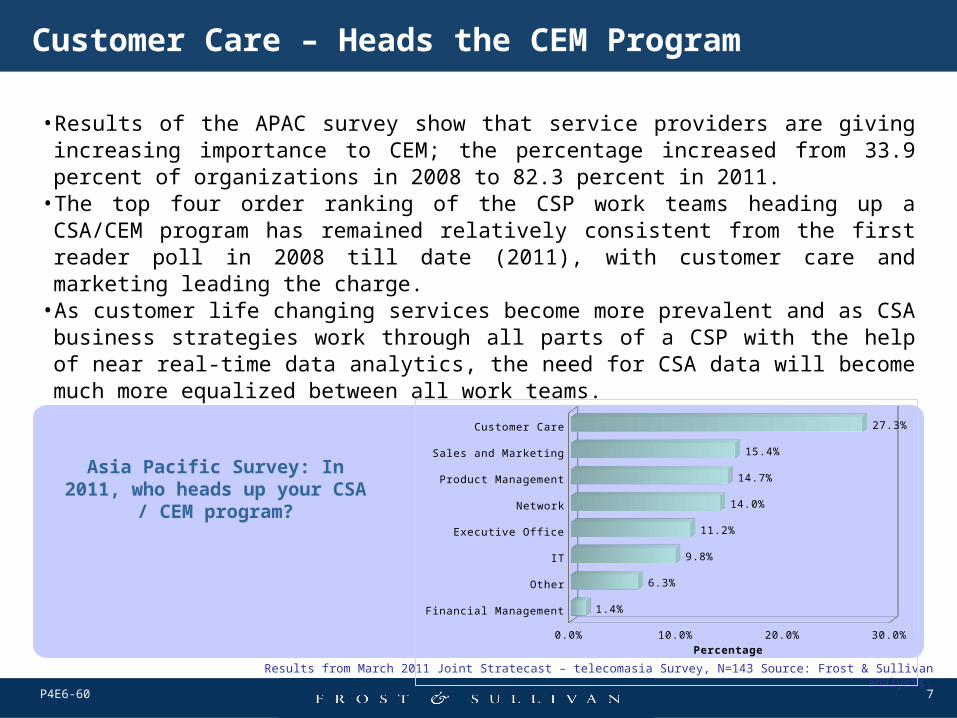
Customer Care – Heads the CEM Program
Asia Pacific Survey: In 2011, who heads up your CSA /
CEM program?
• Results of the APAC survey show that service providers are giving increasing importance to CEM; the percentage increased from 33.9 percent of organizations in 2008 to 82.3 percent in 2011.
• The top four order ranking of the CSP work teams heading up a CSA/CEM program has remained relatively consistent from the first reader poll in 2008 till date (2011), with customer care and marketing leading the charge.
• As customer life changing services become more prevalent and as CSA business strategies work through all parts of a CSP with the help of near real-time data analytics, the need for CSA data will become much more equalized between all work teams.
Results from March 2011 Joint Stratecast – telecomasia Survey, N=143 Source: Frost & Sullivan analysis.
Financial Management
Other
IT
Executive Office
Network
Product Management
Sales and Marketing
Customer Care
0.0% 10.0% 20.0% 30.0%
1.4%
6.3%
9.8%
11.2%
14.0%
14.7%
15.4%
27.3%
Percentage
8P4E6-60
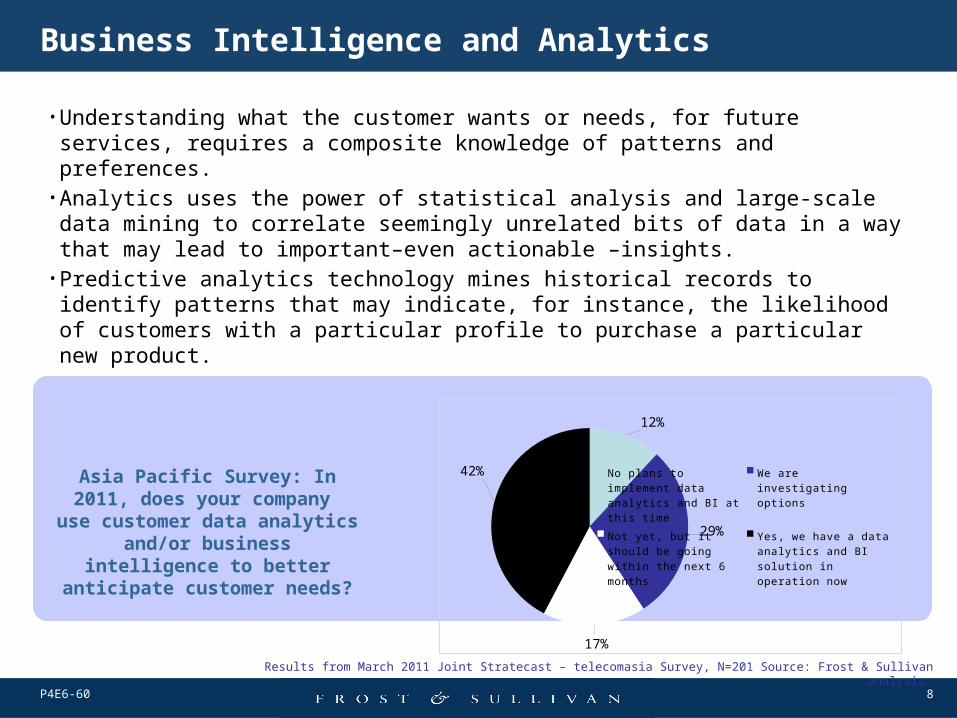
Business Intelligence and Analytics
• Understanding what the customer wants or needs, for future services, requires a composite knowledge of patterns and preferences.
• Analytics uses the power of statistical analysis and large-scale data mining to correlate seemingly unrelated bits of data in a way that may lead to important–even actionable –insights.
• Predictive analytics technology mines historical records to identify patterns that may indicate, for instance, the likelihood of customers with a particular profile to purchase a particular new product.
Asia Pacific Survey: In 2011, does your company use customer data analytics
and/or business intelligence to better anticipate
customer needs?
Results from March 2011 Joint Stratecast – telecomasia Survey, N=201 Source: Frost & Sullivan analysis.
12%
29%
17%
42%No plans to implement data analytics and BI at this time
We are investigating op-tions
Not yet, but it should be going within the next 6 months
Yes, we have a data ana-lytics and BI solution in operation now
9P4E6-60
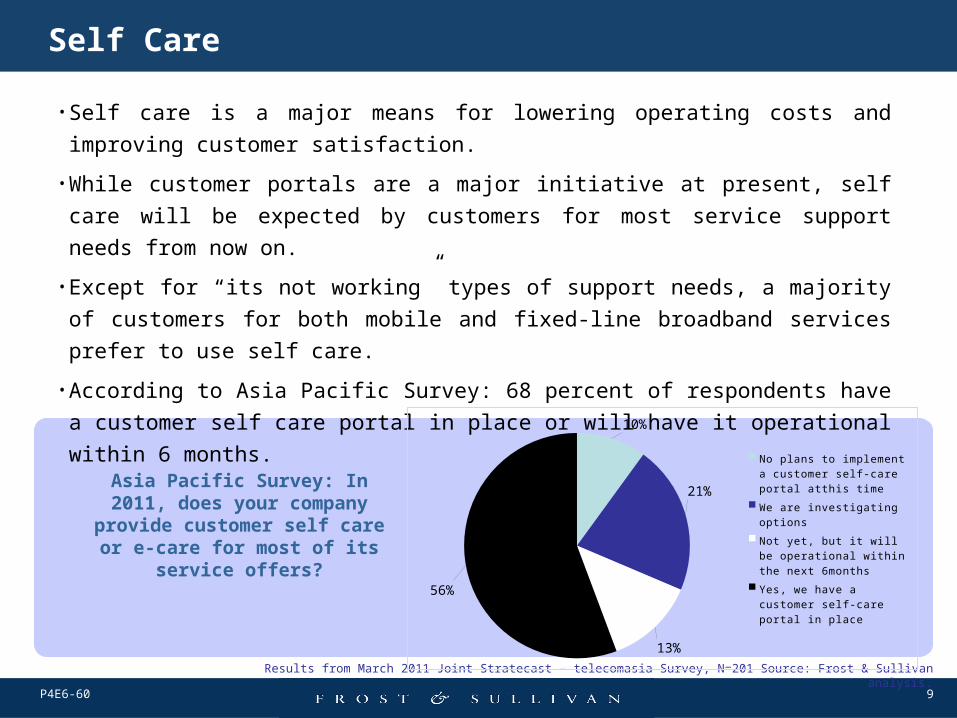
Self Care
Asia Pacific Survey: In 2011, does your company provide customer self care or e-care
for most of its service offers?
• Self care is a major means for lowering operating costs and improving
customer satisfaction.
• While customer portals are a major initiative at present, self care will be
expected by customers for most service support needs from now on.
• Except for “its not working” types of support needs, a majority of customers
for both mobile and fixed-line broadband services prefer to use self care.
• According to Asia Pacific Survey: 68 percent of respondents have a customer
self care portal in place or will have it operational within 6 months.
Results from March 2011 Joint Stratecast – telecomasia Survey, N=201 Source: Frost & Sullivan analysis.
10%
21%
13%
56%
No plans to implement a customer self-care portal atthis time
We are investigating op-tions
Not yet, but it will be opera-tional within the next 6months
Yes, we have a customer self-care portal in place
10P4E6-60
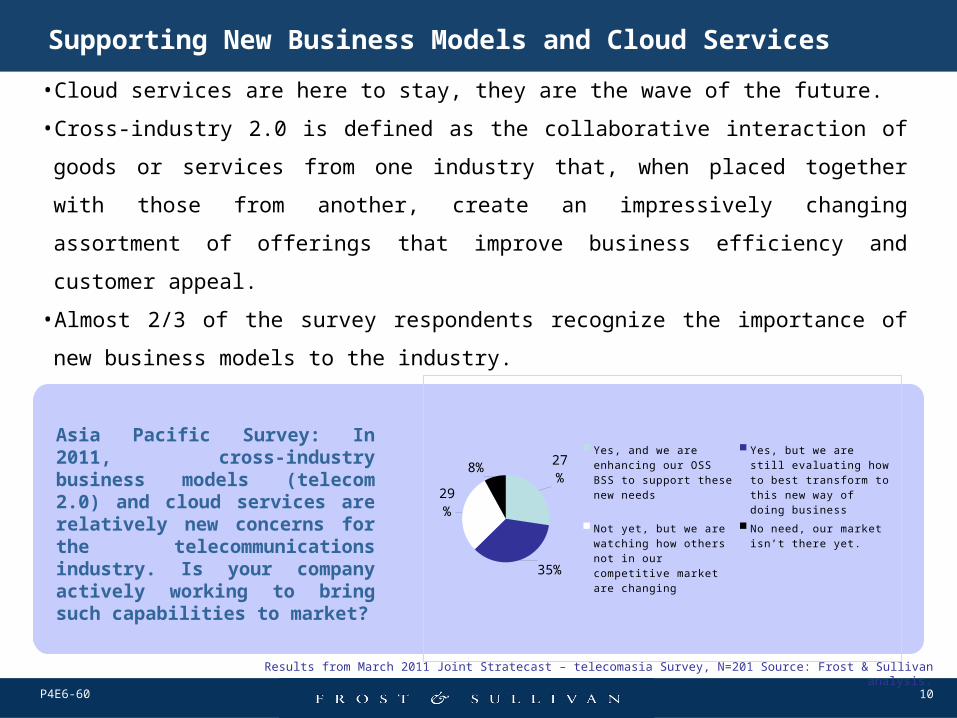
Supporting New Business Models and Cloud Services
Asia Pacific Survey: In 2011, cross-industry business models (telecom 2.0) and cloud services are relatively new concerns for the telecommunications industry. Is your company actively working to bring such capabilities to market?
• Cloud services are here to stay, they are the wave of the future.
• Cross-industry 2.0 is defined as the collaborative interaction of goods or
services from one industry that, when placed together with those from another,
create an impressively changing assortment of offerings that improve business
efficiency and customer appeal.
• Almost 2/3 of the survey respondents recognize the importance of new
business models to the industry.
Results from March 2011 Joint Stratecast – telecomasia Survey, N=201 Source: Frost & Sullivan analysis.
27%
35%
29%
8%
Yes, and we are enhanc-ing our OSS BSS to sup-port these new needs
Yes, but we are still evaluating how to best transform to this new way of doing business
Not yet, but we are watching how others not in our competitive mar-ket are changing
No need, our market isn’t there yet.
11P4E6-60
http://twitter.com/frost_sullivan
Follow Frost & Sullivan on Facebook, LinkedIn, SlideShare, and Twitter
http://www.facebook.com/pages/Frost-Sullivan/249995031751?ref=ts
http://www.linkedin.com/companies/4506
http://www.slideshare.net/FrostandSullivan
12P4E6-60
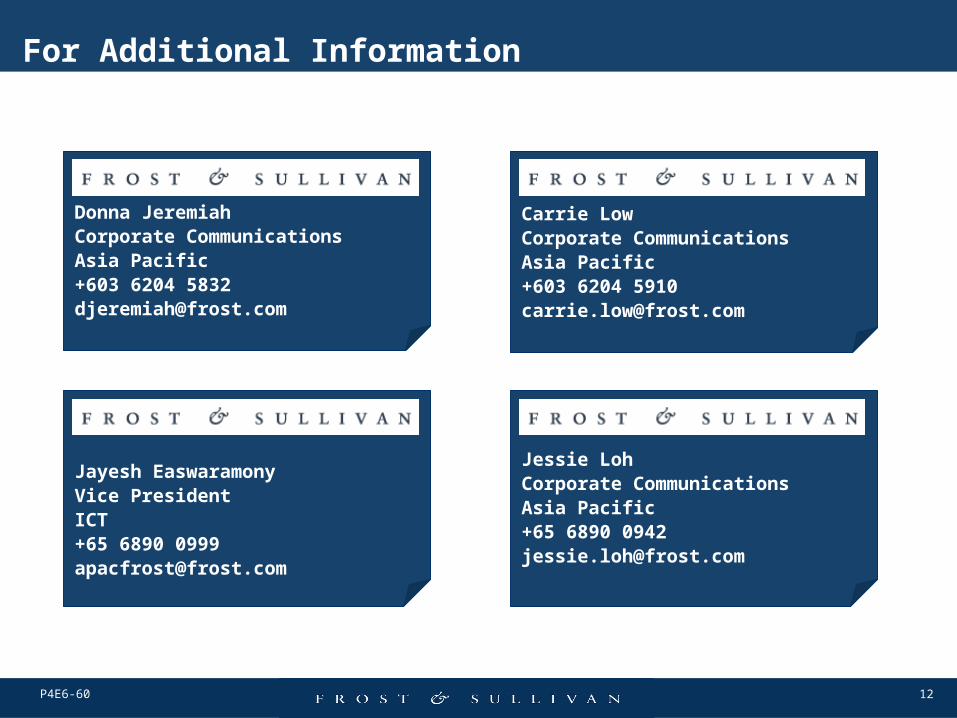
For Additional Information
Donna JeremiahCorporate CommunicationsAsia Pacific+603 6204 [email protected]
Carrie LowCorporate CommunicationsAsia Pacific+603 6204 [email protected]
Jayesh EaswaramonyVice PresidentICT+65 6890 [email protected]
Jessie LohCorporate CommunicationsAsia Pacific+65 6890 [email protected]