drive pulley lagging -- the importance of proper technical ... · pdf filedrive pulley lagging...
TRANSCRIPT
Drive Pulley Lagging – The Importance of Proper Technical Analysis and Selection
Presented at the 2010 Annual SME Meeting in Phoenix, AZ
Paul Ormsbee, Allen V. Reicks P.E.
Overland Conveyor Company, Inc. Lakewood, CO
ABSTRACT
A follow-up paper to “Ceramic Lagging – A Good Thing Can Be Costly if Misused” presented at the 2006 annual meeting. The performance of drive pulley lagging has become much more important in recent years due to higher torque drives, higher conveyor belt speeds, and the use of ceramic lagging. The popularity of ceramic lagging is due to the reduced risk of drive pulley slip and reduction of lagging wear. However, the application of ceramic lagging to a pulley can lead to lagging failure of costly wear to the belt; the most expensive component on the conveyor. Modern analysis and simulation tools and a better understanding of how lagging and belting interact during torque transmission are necessary for a modern conveyor designer to select this relatively inexpensive but important component. Case studies will be presented as well as analysis techniques.
INTRODUCTION
There are a few basic reasons for the application of lagging to both driven and non-driven pulleys.
Lagging serves as a protective layer guarding the pulley from premature failure due to abrasion.
While protecting the pulley, the lagging can also protect the conveyor belting from a similar sort of wear failure caused by abrasion.
Lagging can also creates an increase in friction between the pulley and the belt which is usually needed when there is a requirement for torque transfer through the pulley to the belt.
Lagging is applied to nearly all conveyors to address at least one (if not all) of the basic points above. In addition to performing the points listed above, lagging should be applied in a way that the lagging itself does not wear prematurely due to abrasion, or delaminating from the pulley, as well as cause belt wear.
Now, the application of lagging onto conveyors with smaller belt tensions and lower drive torques is, in many ways, a more simple process than properly applying lagging onto a conveyor with high belt tensions, and high drive torques. Lagging applied to smaller conveyors tends to be selected based off an economical selection criterion and later evaluated on whether failures occur. Because of the lower tensions and torques (and relatively thick lagging), failures are not common and the lagging is effective. However, with the higher drive torques and belt

tensions seen in many of today’s applications, lagging can no longer be safely selected solely from an economical selection criterion without the significant risk of failure for the more expensive conveyor components on a high torque/high tension conveyor. In general, when slipping, lagging abrasion rate (and in the same way, belt bottom cover abrasion rate) is proportional to the contact pressure between the belt and the pulley face (Metlikovic (1996)). In other words, higher torques and higher tensions result in an increase in abrasion risk on pulley lagging and bottom belt cover. This is especially true with ceramic lagging. This paper will discuss how it is important analyze the effect that lagging design has upon each of the three basic reasons for the application of lagging on high torque conveyors as well as the effect the lagging design has on the relative expected life of the lagging. Analysis methods will be discussed, and examples will be given to illustrate the application of the analysis methods. It should be noted that this is a state of the development paper.
FAILURE AND ITS CAUSES
Before analysis methods can be discussed it is important to understand what the ultimate goal of these analyses might be. For the purpose of this paper, analysis is used to gain insight into:
The premature failure of both rubber and ceramic lagging due to abrasion and/or the delamination of the lagging from the pulley.
The potential for lagging to cause damage to other conveyor components (specifically the bottom cover of the belt).
Two determining factors as to whether high torque applications of pulley lagging will cause either of the points listed above are “localized slip” (which causes abrasion) and excessive internal stress/strain within the lagging which may result in the delaminating of the pulley lagging. Metlikovic (1996) showed that “nearly 75% of failed pulleys fail due to abrasion”, and furthermore that, “Abrasion failure is a complex problem and can not be solved only by improving the abrasion resistance of the lagging material.”
How does one predict abrasion and calculate internal stresses and strains? An understanding of abrasion tells us that abrasion happens when materials rub and slip against each other; so if we can predict any rubbing or slipping that occurs between the belt and the lagging we can predict where abrasion might occur and subsequently adjust our design such that the predicted slipping is mitigated. As for prediction of internal stresses, modern day Finite Element Analysis is a useful tool that can accurately predict the magnitude of stresses/strains within a lagging model.
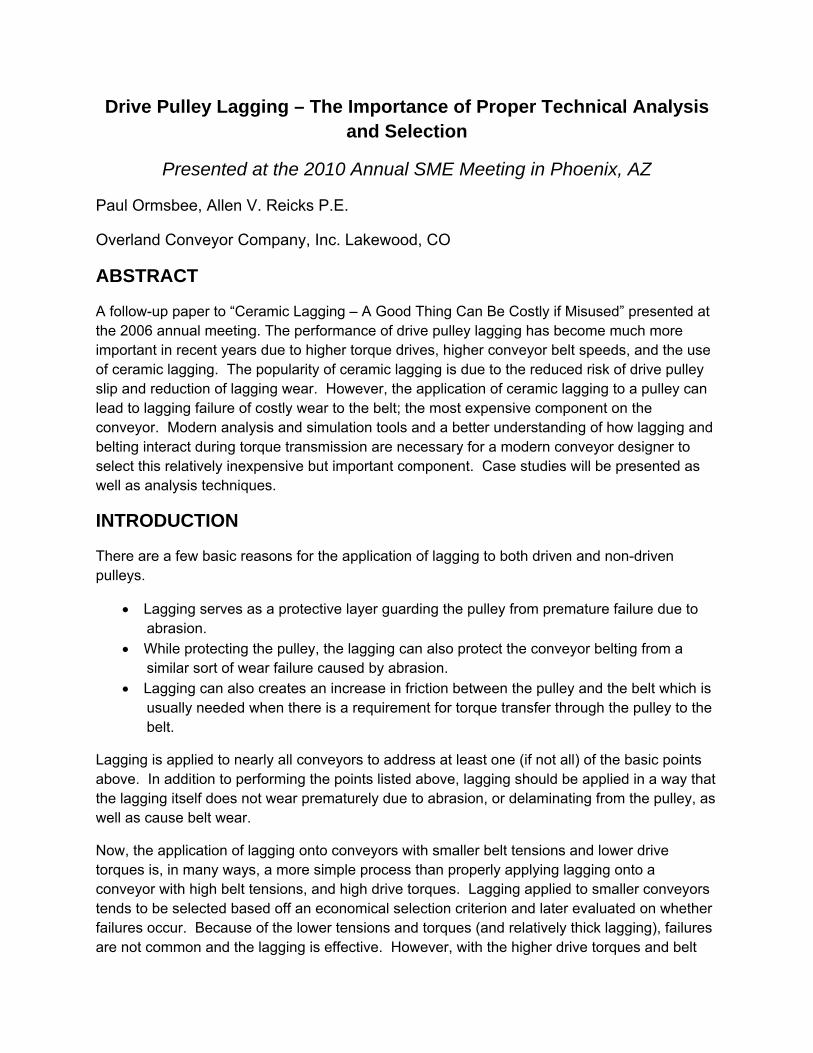
Now, it is not entirely clear the upper allowable limit of stress or strain within lagging before lagging mechanical failure occurs or how much localized slip accelerates the wear of the belt cover and/or pulley lagging. We do however know from experience that if localized slip or high stress/strain is left unaddressed there is significant risk towards accelerated lagging or belt cover failure, especially in high torque applications.
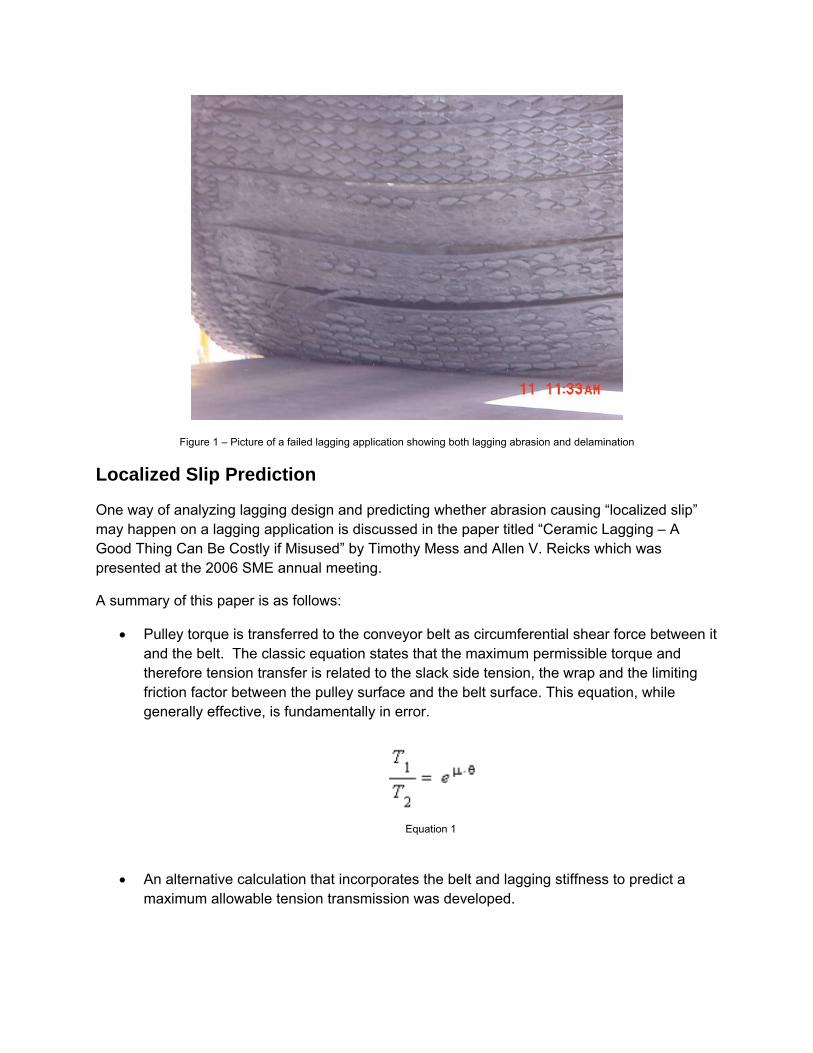
Figure 1 – Picture of a failed lagging application showing both lagging abrasion and delamination
Localized Slip Prediction
One way of analyzing lagging design and predicting whether abrasion causing “localized slip” may happen on a lagging application is discussed in the paper titled “Ceramic Lagging – A Good Thing Can Be Costly if Misused” by Timothy Mess and Allen V. Reicks which was presented at the 2006 SME annual meeting.
A summary of this paper is as follows:
Pulley torque is transferred to the conveyor belt as circumferential shear force between it and the belt. The classic equation states that the maximum permissible torque and therefore tension transfer is related to the slack side tension, the wrap and the limiting friction factor between the pulley surface and the belt surface. This equation, while generally effective, is fundamentally in error.
Equation 1
An alternative calculation that incorporates the belt and lagging stiffness to predict a
maximum allowable tension transmission was developed.
Experience tells us that continuous slip causes wear and most successful installations show little rubber wear. The successful history with the Euler equation (eq 1) can be explained by observing that the design value used for μ (0.35 for rubber lagging, 0.5 for ceramic lagging) CEMA (2005) is much lower than actual value measured by direct testing (0.6 to >1).
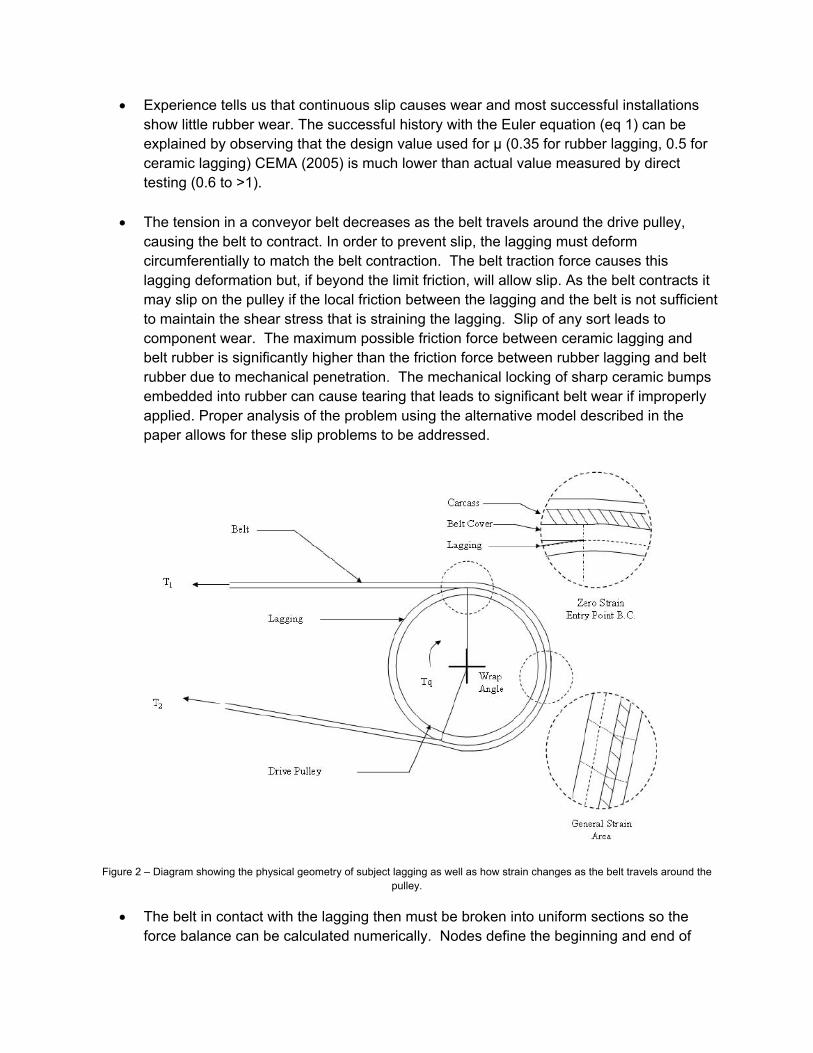
The tension in a conveyor belt decreases as the belt travels around the drive pulley, causing the belt to contract. In order to prevent slip, the lagging must deform circumferentially to match the belt contraction. The belt traction force causes this lagging deformation but, if beyond the limit friction, will allow slip. As the belt contracts it may slip on the pulley if the local friction between the lagging and the belt is not sufficient to maintain the shear stress that is straining the lagging. Slip of any sort leads to component wear. The maximum possible friction force between ceramic lagging and belt rubber is significantly higher than the friction force between rubber lagging and belt rubber due to mechanical penetration. The mechanical locking of sharp ceramic bumps embedded into rubber can cause tearing that leads to significant belt wear if improperly applied. Proper analysis of the problem using the alternative model described in the paper allows for these slip problems to be addressed.
Figure 2 – Diagram showing the physical geometry of subject lagging as well as how strain changes as the belt travels around the pulley.
The belt in contact with the lagging then must be broken into uniform sections so the force balance can be calculated numerically. Nodes define the beginning and end of
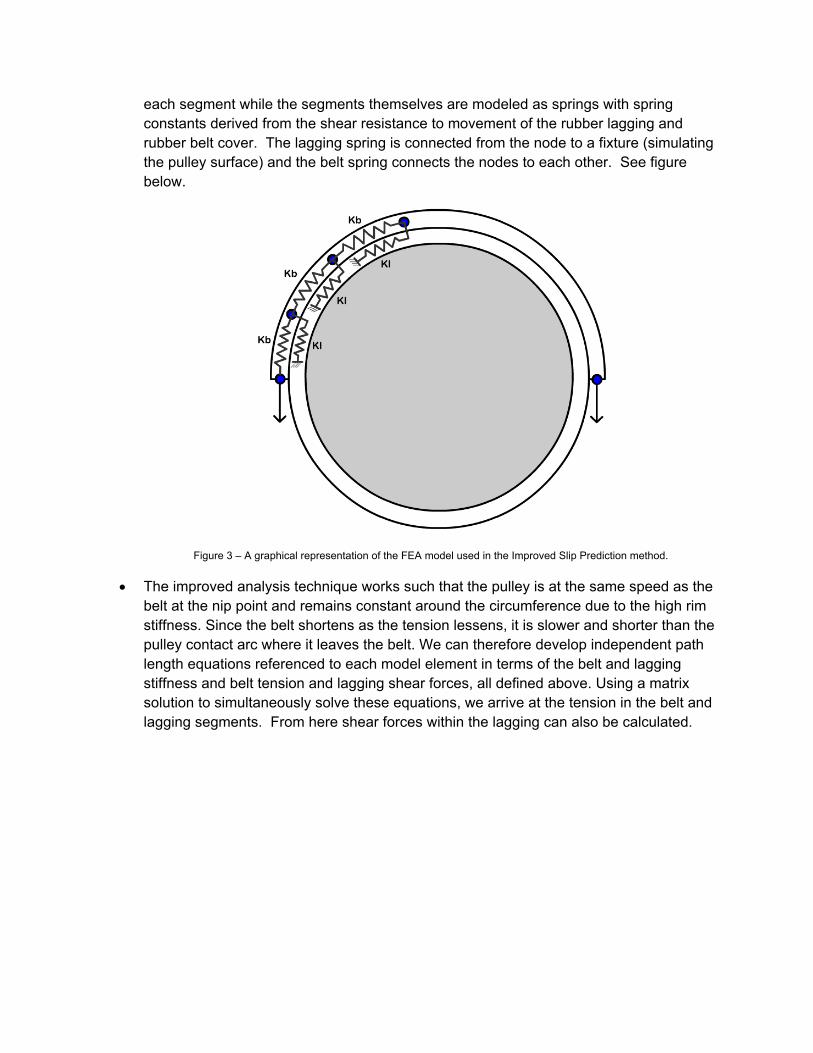
each segment while the segments themselves are modeled as springs with spring constants derived from the shear resistance to movement of the rubber lagging and rubber belt cover. The lagging spring is connected from the node to a fixture (simulating the pulley surface) and the belt spring connects the nodes to each other. See figure below.
Figure 3 – A graphical representation of the FEA model used in the Improved Slip Prediction method.
The improved analysis technique works such that the pulley is at the same speed as the belt at the nip point and remains constant around the circumference due to the high rim stiffness. Since the belt shortens as the tension lessens, it is slower and shorter than the pulley contact arc where it leaves the belt. We can therefore develop independent path length equations referenced to each model element in terms of the belt and lagging stiffness and belt tension and lagging shear forces, all defined above. Using a matrix solution to simultaneously solve these equations, we arrive at the tension in the belt and lagging segments. From here shear forces within the lagging can also be calculated.
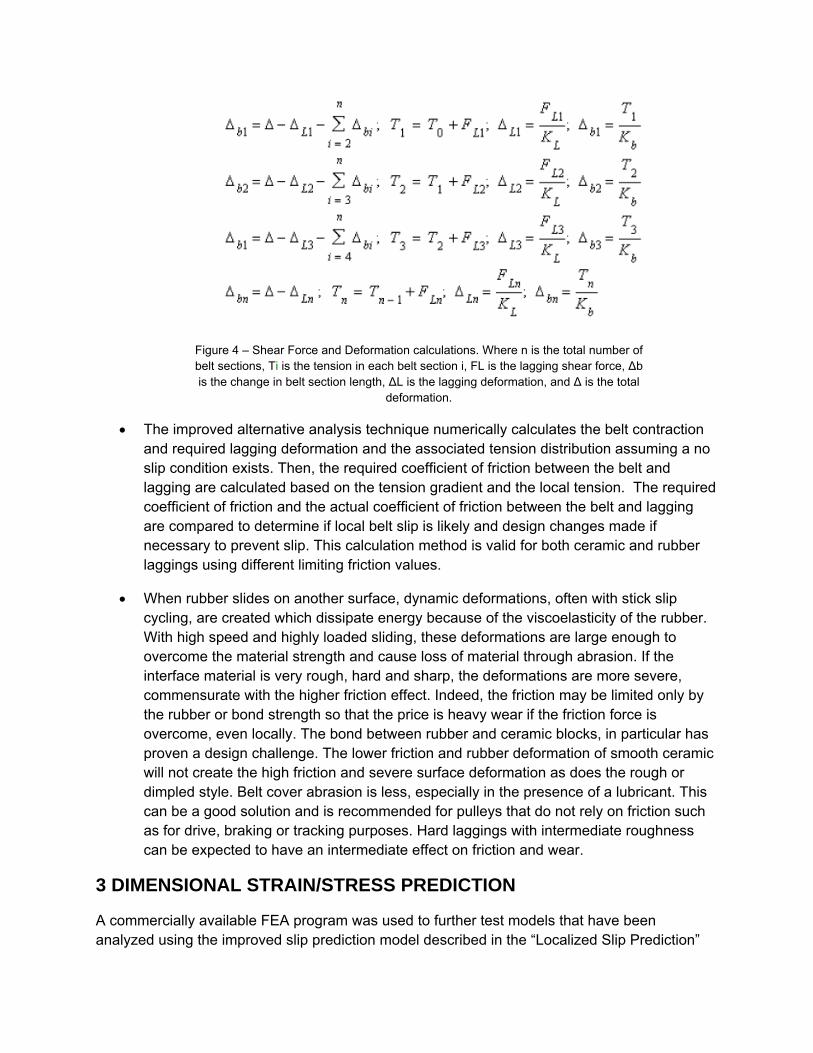
Figure 4 – Shear Force and Deformation calculations. Where n is the total number of belt sections, Ti is the tension in each belt section i, FL is the lagging shear force, Δb is the change in belt section length, ΔL is the lagging deformation, and Δ is the total
deformation.
The improved alternative analysis technique numerically calculates the belt contraction and required lagging deformation and the associated tension distribution assuming a no slip condition exists. Then, the required coefficient of friction between the belt and lagging are calculated based on the tension gradient and the local tension. The required coefficient of friction and the actual coefficient of friction between the belt and lagging are compared to determine if local belt slip is likely and design changes made if necessary to prevent slip. This calculation method is valid for both ceramic and rubber laggings using different limiting friction values.
When rubber slides on another surface, dynamic deformations, often with stick slip cycling, are created which dissipate energy because of the viscoelasticity of the rubber. With high speed and highly loaded sliding, these deformations are large enough to overcome the material strength and cause loss of material through abrasion. If the interface material is very rough, hard and sharp, the deformations are more severe, commensurate with the higher friction effect. Indeed, the friction may be limited only by the rubber or bond strength so that the price is heavy wear if the friction force is overcome, even locally. The bond between rubber and ceramic blocks, in particular has proven a design challenge. The lower friction and rubber deformation of smooth ceramic will not create the high friction and severe surface deformation as does the rough or dimpled style. Belt cover abrasion is less, especially in the presence of a lubricant. This can be a good solution and is recommended for pulleys that do not rely on friction such as for drive, braking or tracking purposes. Hard laggings with intermediate roughness can be expected to have an intermediate effect on friction and wear.
3 DIMENSIONAL STRAIN/STRESS PREDICTION
A commercially available FEA program was used to further test models that have been analyzed using the improved slip prediction model described in the “Localized Slip Prediction”
section of this paper. The FEA model assumed linear, elastic, material properties with a constant limiting friction factor to simulate contact between the belt and the lagging. The method described here has the following steps:
A model is constructed such that a length of rubber (or ceramic) lagging equivalent to the circumferential length in contact with the belt around the pulley is flattened out.
A belt with bottom cover and carcass is laid on top of the lagging in the same length as the arc of contact with the belt.
Using the belt tensions calculated by the Localized Slip Prediction method, a normal force perpendicular to the pulley face can be calculated by taking the tension change across a single node and using trigonometry to calculate out the normal component of the applied tensions (see figure below).
These normal forces are calculated across the entire arc of contact and then applied to the flattened belt carcass to simulate the normal force felt by a belt curved around a pulley.
Then, given a known effective tension (T1-T2) across the pulley face and a known belt elastic modulus, we know how much the belt will stretch or shrink from its natural tensioned state across the arc of contact. This change in length is applied to the model with a contact algorithm simulating a desired friction factor between the belt cover and lagging. The bottom of the lagging is fixed from movement during the analysis.
Meshing and running the model within the FEA program gives results mimicking the results seen with improved localized slip prediction method described above with the addition of some 3 dimensional effects. These 3 dimensional effects were used to compare stresses and strains at the bottom of the lagging to the stresses and strains seen at the arc of contact between the belt and the lagging which gives valuable insight into what may cause delamination risks. We can then change the geometry of the lagging in the model (such as adding grooves or changing rubber thickness) and see the resulting effects on stress and strain. Reduced stress and strain obviously reduce the risk for delamination. This model can also be used to estimate how geometry changes might affect the amount of slip seen in the lagging application.
CASE STUDIES
Using the Improved Localized Slip Prediction Model:
The following table gives a summary of 3 different studies that were input into the improved localized slip prediction model and their resulting outputs.
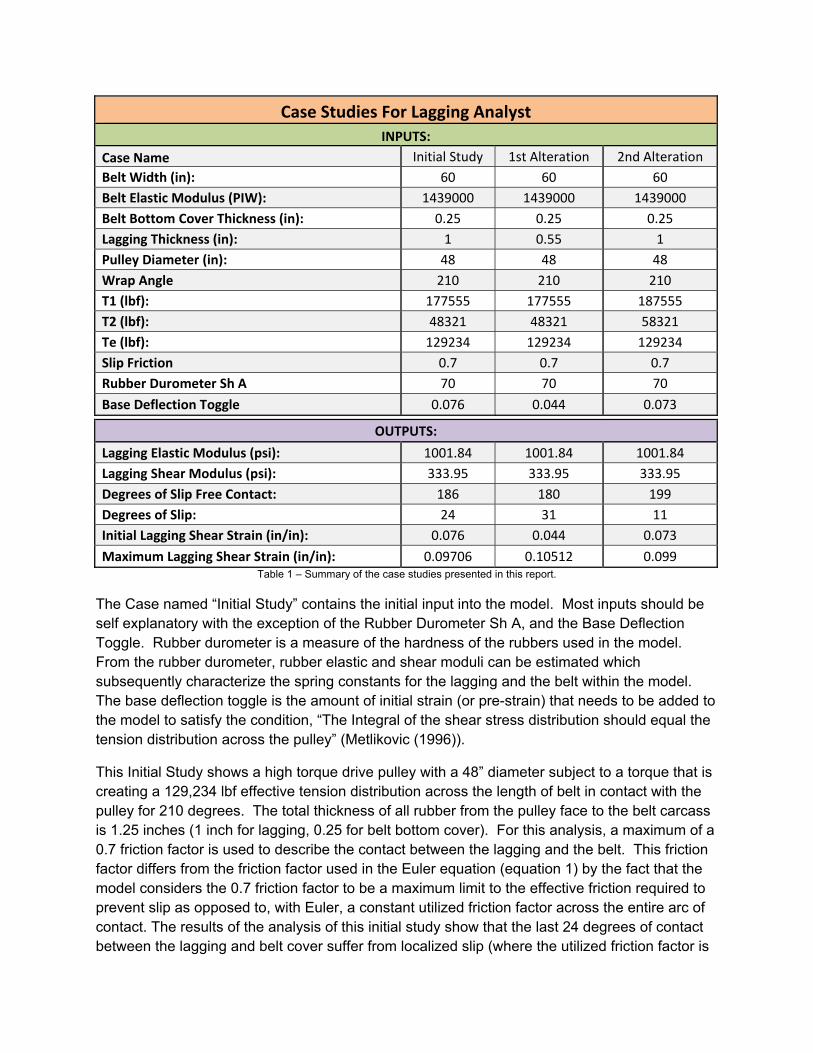
Case Studies For Lagging Analyst
INPUTS:
Case Name Initial Study 1st Alteration 2nd Alteration
Belt Width (in): 60 60 60
Belt Elastic Modulus (PIW): 1439000 1439000 1439000
Belt Bottom Cover Thickness (in): 0.25 0.25 0.25
Lagging Thickness (in): 1 0.55 1
Pulley Diameter (in): 48 48 48
Wrap Angle 210 210 210
T1 (lbf): 177555 177555 187555
T2 (lbf): 48321 48321 58321
Te (lbf): 129234 129234 129234
Slip Friction 0.7 0.7 0.7
Rubber Durometer Sh A 70 70 70
Base Deflection Toggle 0.076 0.044 0.073
OUTPUTS:
Lagging Elastic Modulus (psi): 1001.84 1001.84 1001.84
Lagging Shear Modulus (psi): 333.95 333.95 333.95
Degrees of Slip Free Contact: 186 180 199
Degrees of Slip: 24 31 11
Initial Lagging Shear Strain (in/in): 0.076 0.044 0.073
Maximum Lagging Shear Strain (in/in): 0.09706 0.10512 0.099 Table 1 – Summary of the case studies presented in this report.
The Case named “Initial Study” contains the initial input into the model. Most inputs should be self explanatory with the exception of the Rubber Durometer Sh A, and the Base Deflection Toggle. Rubber durometer is a measure of the hardness of the rubbers used in the model. From the rubber durometer, rubber elastic and shear moduli can be estimated which subsequently characterize the spring constants for the lagging and the belt within the model. The base deflection toggle is the amount of initial strain (or pre-strain) that needs to be added to the model to satisfy the condition, “The Integral of the shear stress distribution should equal the tension distribution across the pulley” (Metlikovic (1996)).
This Initial Study shows a high torque drive pulley with a 48” diameter subject to a torque that is creating a 129,234 lbf effective tension distribution across the length of belt in contact with the pulley for 210 degrees. The total thickness of all rubber from the pulley face to the belt carcass is 1.25 inches (1 inch for lagging, 0.25 for belt bottom cover). For this analysis, a maximum of a 0.7 friction factor is used to describe the contact between the lagging and the belt. This friction factor differs from the friction factor used in the Euler equation (equation 1) by the fact that the model considers the 0.7 friction factor to be a maximum limit to the effective friction required to prevent slip as opposed to, with Euler, a constant utilized friction factor across the entire arc of contact. The results of the analysis of this initial study show that the last 24 degrees of contact between the lagging and belt cover suffer from localized slip (where the utilized friction factor is
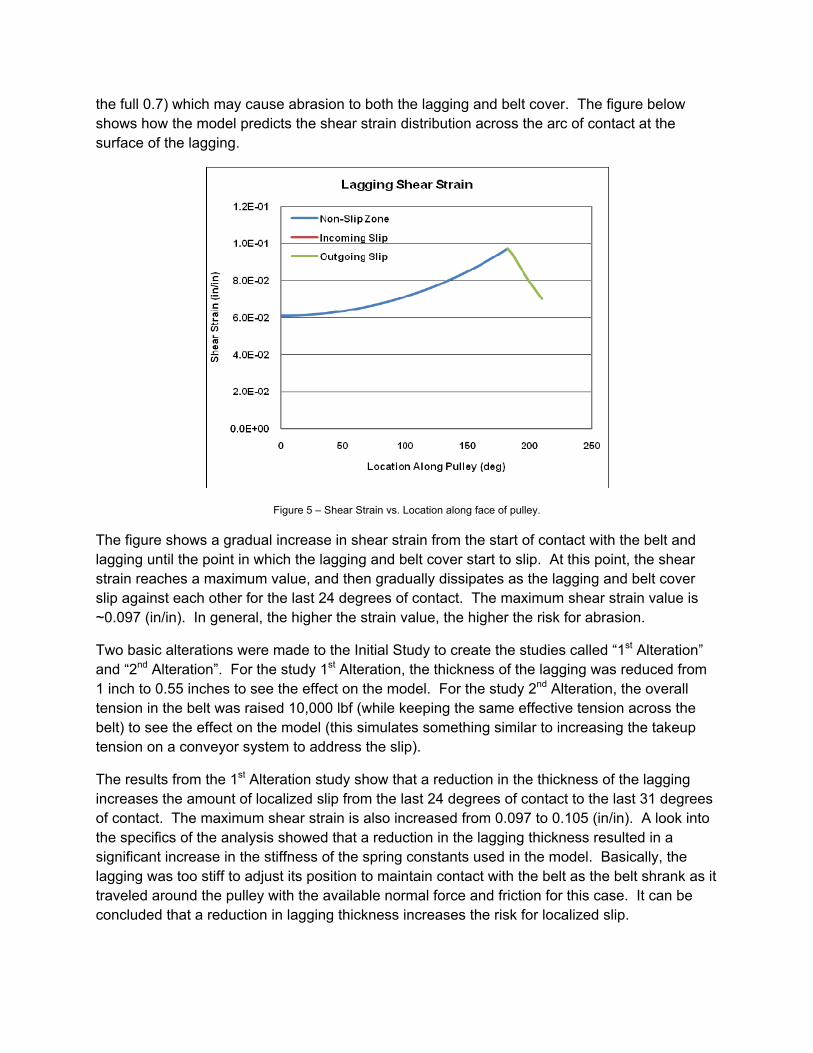
the full 0.7) which may cause abrasion to both the lagging and belt cover. The figure below shows how the model predicts the shear strain distribution across the arc of contact at the surface of the lagging.
Figure 5 – Shear Strain vs. Location along face of pulley.
The figure shows a gradual increase in shear strain from the start of contact with the belt and lagging until the point in which the lagging and belt cover start to slip. At this point, the shear strain reaches a maximum value, and then gradually dissipates as the lagging and belt cover slip against each other for the last 24 degrees of contact. The maximum shear strain value is ~0.097 (in/in). In general, the higher the strain value, the higher the risk for abrasion.
Two basic alterations were made to the Initial Study to create the studies called “1st Alteration” and “2nd Alteration”. For the study 1st Alteration, the thickness of the lagging was reduced from 1 inch to 0.55 inches to see the effect on the model. For the study 2nd Alteration, the overall tension in the belt was raised 10,000 lbf (while keeping the same effective tension across the belt) to see the effect on the model (this simulates something similar to increasing the takeup tension on a conveyor system to address the slip).
The results from the 1st Alteration study show that a reduction in the thickness of the lagging increases the amount of localized slip from the last 24 degrees of contact to the last 31 degrees of contact. The maximum shear strain is also increased from 0.097 to 0.105 (in/in). A look into the specifics of the analysis showed that a reduction in the lagging thickness resulted in a significant increase in the stiffness of the spring constants used in the model. Basically, the lagging was too stiff to adjust its position to maintain contact with the belt as the belt shrank as it traveled around the pulley with the available normal force and friction for this case. It can be concluded that a reduction in lagging thickness increases the risk for localized slip.
The results from the 2nd Alteration study show that an increase in overall tension decreases the amount of localized slip from the last 24 degrees of contact to the last 11 degrees of contact. The maximum shear strain remains almost unchanged at 0.099 (in/in). An increase in belt tension seems to be an effective way in addressing slip concerns, but may have adverse affects on other components in the conveyor system, including the belt.
Using 3-Dimensional FEA
The usefulness of a 3D FEA program to analyze a lagging application comes from being able to alter the physical geometry of the lagging and visualizing the results. In this paper, the effect of using non-grooved rubber lagging vs. using grooved rubber lagging vs. using ceramic lagging will be investigated.
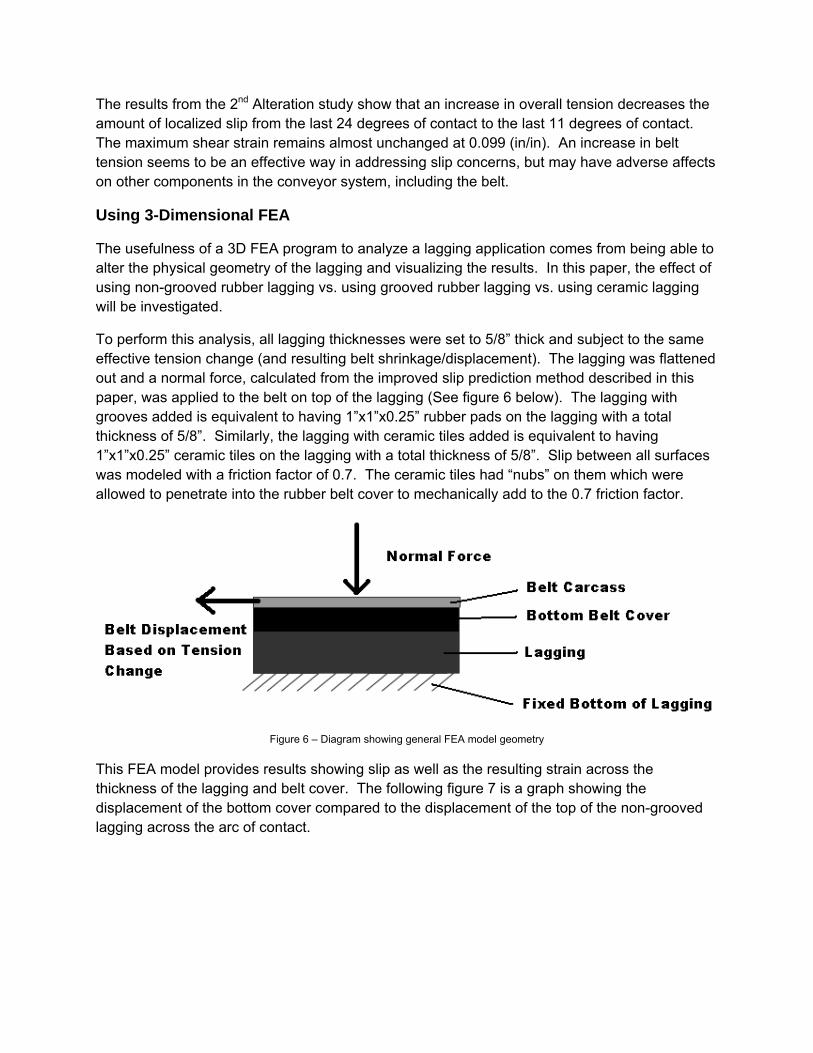
To perform this analysis, all lagging thicknesses were set to 5/8” thick and subject to the same effective tension change (and resulting belt shrinkage/displacement). The lagging was flattened out and a normal force, calculated from the improved slip prediction method described in this paper, was applied to the belt on top of the lagging (See figure 6 below). The lagging with grooves added is equivalent to having 1”x1”x0.25” rubber pads on the lagging with a total thickness of 5/8”. Similarly, the lagging with ceramic tiles added is equivalent to having 1”x1”x0.25” ceramic tiles on the lagging with a total thickness of 5/8”. Slip between all surfaces was modeled with a friction factor of 0.7. The ceramic tiles had “nubs” on them which were allowed to penetrate into the rubber belt cover to mechanically add to the 0.7 friction factor.
Figure 6 – Diagram showing general FEA model geometry
This FEA model provides results showing slip as well as the resulting strain across the thickness of the lagging and belt cover. The following figure 7 is a graph showing the displacement of the bottom cover compared to the displacement of the top of the non-grooved lagging across the arc of contact.
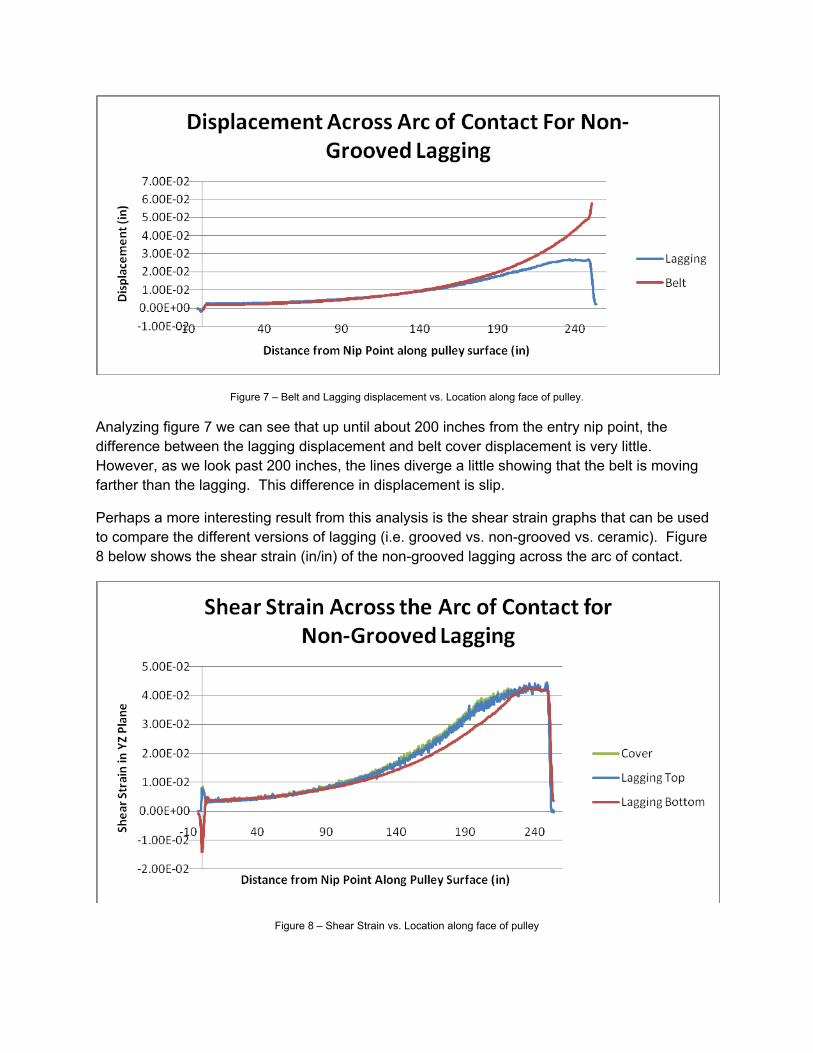
Figure 7 – Belt and Lagging displacement vs. Location along face of pulley.
Analyzing figure 7 we can see that up until about 200 inches from the entry nip point, the difference between the lagging displacement and belt cover displacement is very little. However, as we look past 200 inches, the lines diverge a little showing that the belt is moving farther than the lagging. This difference in displacement is slip.
Perhaps a more interesting result from this analysis is the shear strain graphs that can be used to compare the different versions of lagging (i.e. grooved vs. non-grooved vs. ceramic). Figure 8 below shows the shear strain (in/in) of the non-grooved lagging across the arc of contact.
Figure 8 – Shear Strain vs. Location along face of pulley
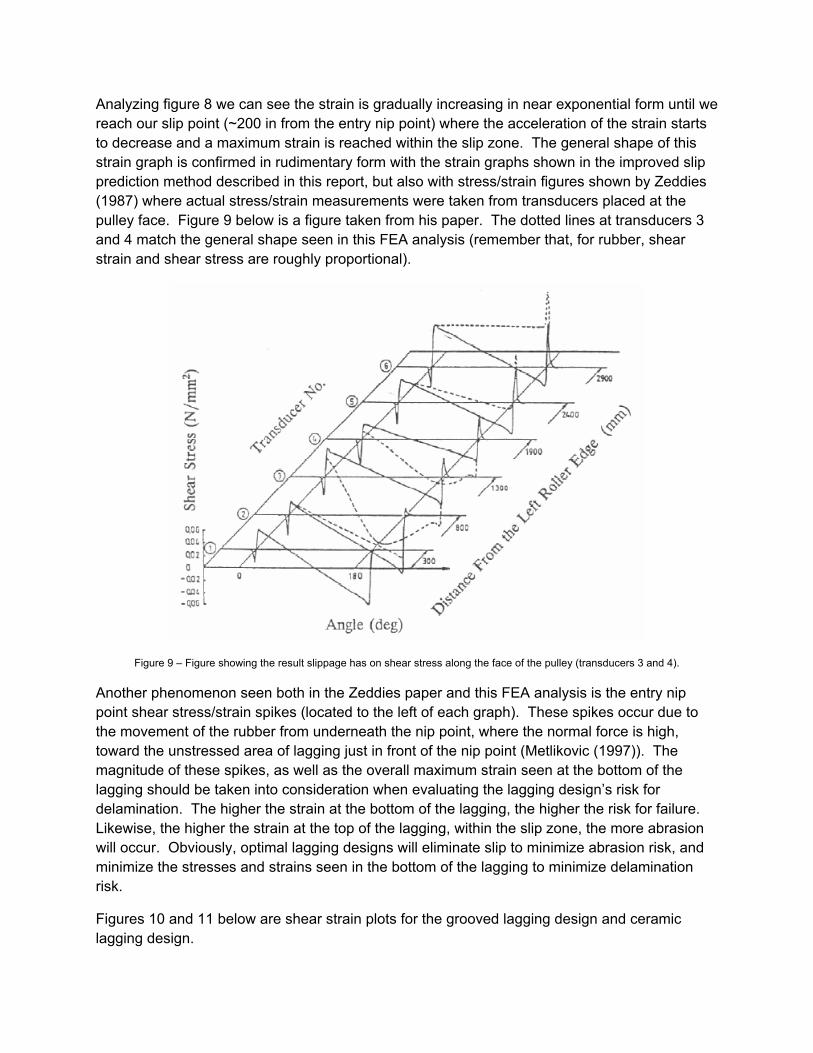
Analyzing figure 8 we can see the strain is gradually increasing in near exponential form until we reach our slip point (~200 in from the entry nip point) where the acceleration of the strain starts to decrease and a maximum strain is reached within the slip zone. The general shape of this strain graph is confirmed in rudimentary form with the strain graphs shown in the improved slip prediction method described in this report, but also with stress/strain figures shown by Zeddies (1987) where actual stress/strain measurements were taken from transducers placed at the pulley face. Figure 9 below is a figure taken from his paper. The dotted lines at transducers 3 and 4 match the general shape seen in this FEA analysis (remember that, for rubber, shear strain and shear stress are roughly proportional).
Figure 9 – Figure showing the result slippage has on shear stress along the face of the pulley (transducers 3 and 4).
Another phenomenon seen both in the Zeddies paper and this FEA analysis is the entry nip point shear stress/strain spikes (located to the left of each graph). These spikes occur due to the movement of the rubber from underneath the nip point, where the normal force is high, toward the unstressed area of lagging just in front of the nip point (Metlikovic (1997)). The magnitude of these spikes, as well as the overall maximum strain seen at the bottom of the lagging should be taken into consideration when evaluating the lagging design’s risk for delamination. The higher the strain at the bottom of the lagging, the higher the risk for failure. Likewise, the higher the strain at the top of the lagging, within the slip zone, the more abrasion will occur. Obviously, optimal lagging designs will eliminate slip to minimize abrasion risk, and minimize the stresses and strains seen in the bottom of the lagging to minimize delamination risk.
Figures 10 and 11 below are shear strain plots for the grooved lagging design and ceramic lagging design.

Figure 10 – Shear Strain vs. location along the arc of contact for different components within the lagging model for Grooved Lagging.
Figure 11 – Shear Strain vs. location along the arc of contact for different components within the lagging model for Ceramic Lagging.
Analyzing and comparing the figures (10 and 11) above with the non-groove strain graph (figure 9) we can start to get a picture of the effects each lagging design has upon the strain profiles. The non-groove strain graph (figure 9) shows a maximum shear strain of around 0.04 in/in with all three lines in the graph, bottom of the lagging, top of the lagging, and belt cover having very

similar shear strains throughout the entirety of the arc of contact. Compare that to the grooved lagging shear strain graph (figure 10) where the maximum shear strain is around 0.07 in/in with the bottom of the lagging seeing significantly less strain and the belt cover strain varying between the two other strain lines, we can see that the addition of grooving transfers strain away from the bottom of the lagging into the grooved top of the lagging. This makes sense as the grooving allows the individual rubber pads to move more and adjust themselves to the movement of the belt.
Finally, analyzing the ceramic lagging shear strain graph (figure 11) in regards to the other two lagging design shear strain graphs, we can see that the top of the ceramic tiles sees virtually no shear strain due to the stiffness of the hard ceramic tiles while the belt cover sees the maximum strain of around 0.065 in/in. The bottom of the rubber lagging and the top of the rubber part of the ceramic lagging see similar maximum shear strains of around 0.03 in/in. This graph seems to say that the hard ceramic tiles transfer some of the shear strain from the lagging into the bottom belt cover of the belt while leaving the thinner than normal rubber part of the lagging to absorb the rest (notice the bottom part of the lagging’s shear strain of 0.03 is higher than the grooved rubber lagging’s bottom’s shear strain of 0.02). This was deduced from the fact that the belt cover strain line for the ceramic lagging model increased to be the highest line on the graph (when compared to the grooved rubber lagging model) while the rubber lagging values increased slightly due to the reduced thickness of the rubber part of the ceramic lagging.
Further analyzing this graph might lead us to say that the ceramic lagging design could be improved by increasing the thickness of the rubber below the ceramic tiles to allow for more of the shear strain to be absorbed in the bottom of the lagging rather than being transferred into the bottom cover of the (perhaps very expensive) belt.
CONCLUSIONS
Certainly, the models and methods described in the paper are useful for optimizing lagging design for any conveyor pulley application. However, with the high torques and tensions of modern conveyor applications, the importance of using these analysis techniques to analyze these applications is amplified due to an increased risk of failure of these high torques and the associated cost of fixing these failures. The models and analysis techniques described in this paper can provide engineers with quantifiable feedback on lagging geometry and subsequent design changes needed to mitigate abrasion causing localized slip and minimize the risk for lagging delamination.
REFERENCES
Conveyor Equipment Manufacturers Association. 2005. Belt Conveyors of Bulk Materials. Sixth Edition. Naples, FL: Conveyor Equipment Manufacturers Association Metlikovic, Peter M. 1996. Mechanics of Rubber Covered Conveyor Rollers. Ph.D. dissertation: The University of Akron Zeddies, Hubertus. 1987. Untersuchung der Beanspruchung von Trommelbelagen mit dem Ziel der Belagsoptimierung. Braunkohle 39. Reicks, Allen V. Mess, Timothy. 2006. Ceramic Lagging- A Good Thing Can Be Costly If Misused. 2006 Annual Meeting of the Society for Mining, Metallurgy, and Exploration Conference.