drg workshop belgrade, 18-22.november 2013. funding policy based on drgs. casemix. methodology of...
TRANSCRIPT

DRG Workshop Belgrade, 18-22.November 2013.
Funding policy based on DRGs. Casemix. Methodology of DRG
costing. RIC
DRG Workshop Belgrade, 18-22.November 2013.
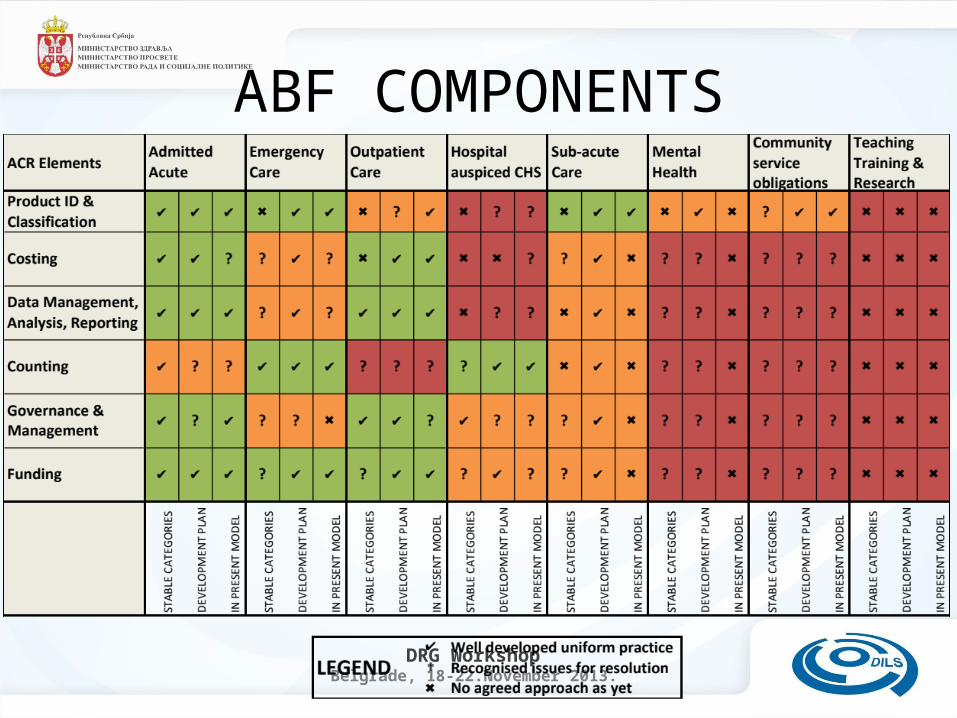
ABF COMPONENTS

DRG Workshop Belgrade, 18-22.November 2013.
Dataset and Classification Development

DRG Workshop Belgrade, 18-22.November 2013.
Data Flow for funding models
Hospital Information SystemsHospital Information SystemsHospital Financial DataHospital Financial Data
Minimum Basic Data Set-DRG Data Entry Tool- Clinical Data, DRG- Resource Consumption Data
(analysis tool)
Costing Engine
Coding Analysis Reports
PICQ Software
Cost Reports
Cost data- GL mappings-Allocation Statistics
(costfile)(volumefile)
(separations tbl)
Data Analysis Reports
(prepare costsheet)
Diagnosis and Procedures Analysis Reports

DRG Workshop Belgrade, 18-22.November 2013.
Data principles and privacy
• The National Health Reform Agreement includes principles to underpin data collection to:– ensure patient privacy– minimise administrative burden – improve the evidence base of hospital funding
• The Commonwealth and the States will enter into a National Health Information Agreement by that reflects the objectives of the National Health Reform Agreement

DRG Workshop Belgrade, 18-22.November 2013.
Towards a national pricing model for hospitals
• What is a hospital?• Normative pricing >>>
best practice pricing• Indexation rules• Private patients• http://www.ihpa.gov.au/internet/ihpa/publishi
ng.nsf/Content/EB8EFD07DF85BC70CA25798300033BE1/$File/IHPA%20Draft%20Pricing%20Framework_long%20version.pdf

DRG Workshop Belgrade, 18-22.November 2013.
Health Policy Solutions (in association with Casemix Consulting and Aspex Consulting) Page 58

DRG Workshop Belgrade, 18-22.November 2013.
Where does quality come in?• NHPA• ACSQH• Sentinel events loops• Clinical pathways• Complaints• Pricing signals• Epidemiology• Clinical trials• R&D new technology marketing

DRG Workshop Belgrade, 18-22.November 2013.
Health Policy Solutions (in association with Casemix Consulting and Aspex Consulting) Page 59

DRG Workshop Belgrade, 18-22.November 2013.
How to measure quality
• Process indicators• Protocol compliance• Outcome indicators• Effort• Inputs• Failures and risks• Value for money

DRG Workshop Belgrade, 18-22.November 2013.
THE FIRST IDEA OF A NATIONAL EFFICIENT PRICE
• COMPLETE DATA• ACCURATE DATA• CONSISTENT COUNTING
– Activity ~ Financial
• NORMATIVE PRICING• STANDARD PRICING• REFERENCE PRICING
• THE MARKET

DRG Workshop Belgrade, 18-22.November 2013.
THE SECOND IDEA OF A NATIONAL EFFICIENT PRICE
• Whose costs? Whose quality?• Who pays for what????
NHIFMoH
INSURERSPATIENT
HEALTH SYSTEMOPERATORS,
REGIONS,HMOs
EMPLOYED PRACTITIONERSDrug, MD SUPPLIERSSUPPORT SERVICESMANUFACTURERS
HOSPITALS,HEALTH CLINCS,PRACTITIONERS

DRG Workshop Belgrade, 18-22.November 2013.
INFORMATION SYSTEMS SCHEMA
SUPPLY HR FMIS PAS EHR
MPI
MHODS
AggregateAEDEMDESIS
MDSs
REPORTREPOSITORY
CUBESPIVOT
eg. COGNOS,BRIO, EXCELLeg. BUSINESS OBJECTSeg. SAS ,SPSS, STATA, ACCESS
BUSINESS LAYER
DATAWAREHOUSE
REPORTING LAYER (MIS)
STATISTICAL ANALYSIS
MHCMI
MHDW
eg. Oracle, SAP, etc

DRG Workshop Belgrade, 18-22.November 2013.
The basic components
• Patient costing fundamentals• Costing standards and methods• The Idea of Patient Level Information and
Costing• Allocating expenditure from accounts to
activity• Key uses of patient cost data• The relation between costing and pricing

DRG Workshop Belgrade, 18-22.November 2013.
The fundamental of costing

DRG Workshop Belgrade, 18-22.November 2013.
Australia National hospital cost data collection
DRG Description Cost Standard Number Number ALOS Average Cost per DRG ($) Average Component Cost
per DRG ($)
Weight Error of Seps of Days (Days) Total Direct Ohead Ward Medical Ward Nursing
Non Clinical Salaries
Pathology
DRG
Direct Ohead Direct Ohead Direct Ohead
W01Z Ventiln/Cranio Mult Sig Trauma 22.30 0.08 1,157 35,485 30.68 82,988 68,277 14,711 3,984 784 7,277 1,333 1,572 3,194 468
I69B Bne Dis&Sp Arth A>74/+Cscc 0.90 0.02 5,675 25,445 4.48 3,336 2,421 915 393 59 883 197 203 96 23
C63A Other Disorders Of The Eye +Cc 1.07 0.04 839 3,027 3.61 3,974 2,949 1,025 519 66 957 200 256 99 20
I68A Non-Surg Spinal Disorders +Cc 2.22 0.05 7,466 65,483 8.77 8,280 6,075 2,206 957 126 2,416 479 506 182 41
C01Z Proc For Penetratng Eye Injury 1.90 0.05 609 2,196 3.61 7,084 5,493 1,592 1,181 208 999 247 269 101 12
F21B Oth Circ Sys O.R. Pr -Ccc 1.93 0.02 1,037 5,456 5.26 7,186 5,541 1,645 802 136 1,405 288 383 150 36
E70A Whoopng Cgh &Acte Brnchio+Cc 1.66 0.03 1,722 7,963 4.62 6,186 4,550 1,636 895 109 1,975 315 422 151 34
B60B Estab Para/Quad+/-Or Pr-Ccc 2.14 0.04 4,319 28,993 6.71 7,963 5,979 1,985 892 144 2,258 512 485 155 29
U60Z Mental Health Treat+Samedy-Ect 0.22 0.00 11,571 11,652 1.01 829 623 206 80 8 66 32 23 21 5
J12C L Lmb Pr+Ulcr/Cels-Ccc-Graft 2.54 0.04 668 6,189 9.27 9,451 7,026 2,425 1,184 176 2,498 524 599 216 38
P66D Neo,Admwt 2000-2499G-Sg Op-Prb 1.01 0.04 2,510 13,625 5.43 3,746 2,731 1,015 658 67 1,093 242 176 47 13
X04A Other Pr Inj Lwr Lmb A>59/+Cc 2.66 0.03 497 3,636 7.32 9,890 7,675 2,215 1,084 161 1,958 409 452 218 36
M04A Testes Procedures + Cc 1.54 0.02 405 1,381 3.41 5,720 4,450 1,270 745 122 931 232 218 191 26
G10Z Hernia Procedures A<1 0.86 0.00 1,224 1,660 1.36 3,201 2,489 712 326 36 454 94 123 18 4
G67B Oesphs,Gastr&Mis Dg D A>9-Cscc 0.42 0.00 64,401 122,232 1.9 1,551 1,146 406 163 20 277 64 72 68 15
I19Z Other Elbow, Forearm Procs 1.72 0.01 10,576 27,694 2.62 6,386 5,065 1,321 553 87 705 166 193 41 8
N60B Malignancy Fem Reprod Sys-Cscc 1.02 0.02 1,111 2,964 2.67 3,792 2,866 925 381 51 870 159 277 81 20
F40Z Circ Sys Dx+Ventilator Support 5.70 0.04 749 6,440 8.6 21,204 17,123 4,081 1,252 191 1,334 251 456 1,069 181
I75A Inj Sh,Arm,Elb,Kn,Leg A>64+Cc 2.15 0.05 3,302 33,352 10.1 8,007 5,783 2,224 834 139 2,433 542 493 201 43
A09A Renal Transplant+Pancreas/+Ccc 13.04 0.23 224 3,471 15.52 48,540 40,935 7,604 3,736 696 6,760 1,024 1,496 2,961 398
I13C Humer,Tib,Fib,Ank Pr A<60-Cscc 2.00 0.01 12,090 43,547 3.6 7,448 5,863 1,585 713 116 997 244 253 42 8
B67B Degnrtv Nerv Sys Dis A>59-Cscc 1.16 0.02 2,907 16,200 5.57 4,323 3,194 1,129 566 76 1,203 264 288 95 21
P06B Neo,Admwt >2499G+Sig Or Pr-Mmp 5.18 0.02 425 4,388 10.33 19,264 15,603 3,661 974 70 914 135 402 843 223
G70B Other Digestive System Diag-Cc 0.39 0.01 13,873 22,142 1.6 1,460 1,100 359 199 21 238 58 75 38 8
E70B Whoopng Cgh &Acte Brnchio-Cc 0.79 0.01 11,193 25,954 2.32 2,947 2,170 777 438 42 935 156 207 77 21
F41B Crc Dsrd+Ami+Inva Inve Pr-Cscc 1.56 0.01 3,786 14,809 3.91 5,800 4,652 1,148 516 87 519 91 291 162 20
C15B Glaucoma/Cx Cataract Procs,Sd 0.66 0.02 1,957 1,957 1 2,469 1,882 587 395 33 98 42 48 3 1
B74Z Nontraumatic Stupor & Coma 0.85 0.02 1,183 3,620 3.06 3,157 2,451 706 322 45 690 138 136 138 26
H01B Pancreas, Liver &Shunt Pr-Ccc 3.99 0.03 1,129 9,704 8.59 14,844 11,870 2,974 1,466 187 2,414 467 629 556 90
P61Z Neonate, Admission Wt <750G 40.40 0.65 305 23,781 78 150,380 116,921 33,459 4,748 311 1,779 147 1,049 3,904 686
Z62Z Follow Up -Endoscopy 0.32 0.01 11,647 15,211 1.31 1,201 931 270 177 52 174 51 53 43 7
G05B Mnr Small & Large Bowel Pr -Cc 1.72 0.01 892 4,104 4.6 6,405 4,938 1,467 887 103 1,148 278 318 162 34
H01A Pancreas, Liver & Shunt Pr+Ccc 8.45 0.08 861 16,575 19.25 31,458 25,228 6,231 3,301 561 5,497 1,177 1,166 1,360 231
F09B Oth Cardiothor Pr-Pmp -Ccc 3.89 0.03 413 2,161 5.23 14,477 11,847 2,630 1,187 155 1,584 213 797 418 71
X06A Other Pr Other Injuries + Cscc 3.48 0.03 1,756 16,177 9.21 12,961 10,135 2,826 1,556 253 2,439 549 567 378 69
NATIONAL HOSPITAL COST DATA COLLECTION COST WEIGHTS FOR AR-DRG VERSION 5.1, Round 11 (2006-07)

DRG Workshop Belgrade, 18-22.November 2013.
NHCDC Reporting Standards
http://www.health.gov.au/internet/main/publishing.nsf/Content/0FABA9D6DB24D7E8CA257712000C5D3C/$File/HospitalPatientCostingStandards_v2_Final_June%202011.pdf
DRG Workshop Belgrade, 18-22.November 2013.
Why do we need clinical costing?
• Accurately value products – eg DRG’s for funding– Costweights for funding and payment – Activity analysis in weighted activity terms
• Benchmark our hospital against others and over time– Properly manage performance – care profiles– Set achievement targets – ‘match the above average
performers over the next two years’

DRG Workshop Belgrade, 18-22.November 2013.
Clinical Costing Standards Association

DRG Workshop Belgrade, 18-22.November 2013.
• Clinicians are the control locus of expenditure• “Every clinical decision is an expenditure
decision”• Hospitals must be able to provide feedback to
clinicians on comparative use of resource (cost) with benchmarks
• Both normative (peer hospitals) and best practice standards (clinical pathways)
The importance of hospitals being able to analyse their costs of production

DRG Workshop Belgrade, 18-22.November 2013.
• Starts with total expenditure of hospital.• Broken into overhead and direct.• INPATIENT FRACTION IS APPLIED *either here
• Overhead costs are attributed to treatment units. Then become part of direct costs of treating patients. *or here
• Unit costs are attributed to patients according to their service utilisation and/OR
• Direct patient costs allocated according to utilisation (activity) statistics.
The idea of fully absorbed costing

DRG Workshop Belgrade, 18-22.November 2013.
• Cost centres in general ledger and/or
• Inpatient ratio of staff utilisation
• Inpatient ratio of floor space, utilty access points, service times,
• Inpatient ratio of diagnostics orders
• Weighted units of service provided (eg beddays, consultations,
Inpatient expenditure fractions

DRG Workshop Belgrade, 18-22.November 2013.
• Almost anything can be a direct cost if individual patient utilisation is recorded.
• Many cost centres provide services to other cost centres.
• It is important to have a standard sequence of distributing the costs of overhead cost centres to other cost centres.
Direct costs and overhead costs

DRG Workshop Belgrade, 18-22.November 2013.
• A standard method of cost disaggregation from total hospital expenditure to patient episode or DRG.
• Follows a set sequence of disaggregation from overhead cost centres to ‘intermediate product’ cost centres.
• Allocates from intermediate products to patients according to utilisation or service weights.
The Yale cost model

DRG Workshop Belgrade, 18-22.November 2013.
• Cost per meal per patient per day for ward x compared to hospital average
• Cost of Xray A compared to other providers• Cost per hour of nursing service in ICU (b)• Surgeon cost for operation x compared to other
surgeons
Intermediate products of interest to hospital managers – examples

DRG Workshop Belgrade, 18-22.November 2013.
Types of Costing 1/2
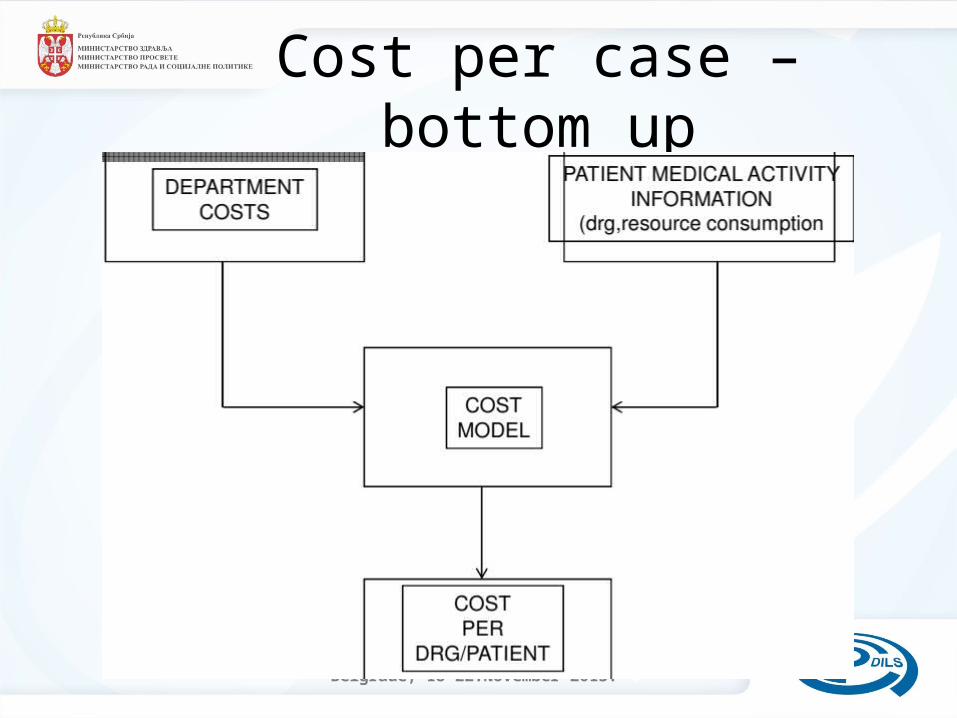
• Clinical Costing– bottom up costing approach – each patient episode is a product– requires data of all goods and services consumed
in the treatment of individual patients– Data are then converted into cost estimates for
each patient by reference to measures of the relative costs of providing these services
– Allows analysis of resource use by individual patient episode
DRG Workshop Belgrade, 18-22.November 2013.
Cost per case – bottom up

DRG Workshop Belgrade, 18-22.November 2013.
Types of Costing 2/2
• Cost Modelling– top down approach– Expenditure is allocated to groups of
patients in each DRG based on measures of average consumption for the patients in each DRG
– Relies on the use of service weights • and/or other generalised utilisation statistics.

DRG Workshop Belgrade, 18-22.November 2013.
DRG based – top down

DRG Workshop Belgrade, 18-22.November 2013.
Why Patient Costing?
• Patient costing provides detail at the individual patient episode
– Easier to apply patient costing to other patient types
• Patient costing systems are a good data repository
– Choice between the methodologies is dependent on information capture

DRG Workshop Belgrade, 18-22.November 2013.
Available costing systems
• Most systems, available currently use both methods of costing
• More precision is obtained by increasing clinical costing elements
• Pure patient costing is not (always) feasible – Feeders can be expensive– Skills are not always available
• A hybrid of clinical costing (preferred) and cost modelling (default) is usually the answer.

DRG Workshop Belgrade, 18-22.November 2013.
PLICS UK 2010 hospital survey• Over 95 acute organisations have either implemented a PLICS system, or are in
the process of implementing a PLICS system.• Almost a further 20 acute organisations are planning to implement PLICS in the
next few years.• Of the 51 organisations who have implemented PLICS,45 report that they have
used PLICS data to inform their 2009/10 reference cost return• Nearly 90% of those organisations who have implemented a PLICS system, or
are in the process of implementing a PLICS system report that they are using the Acute Clinical Costing Standards.
• Of those planning not to implement PLICS, 31 are acute providers, with the remainder being PCT, Community, Ambulance and other
• Take up or planned take of PLICS in the non-acute sector is primarily by Mental Health organisations

DRG Workshop Belgrade, 18-22.November 2013.
Cost allocation process
Recurrent Expenditure
Allocation Overhead Costs to Patient Care Cost Centres
Remove non-Inpatient Costs
GL costs, FTEs, Floor
space
Outpatients, Teaching and
Research
Patient Data
Allocate Final Costs to products
Overhead Allocation Statistics
Program Fractions
Inpatient Fractions
Weights/Utilisation

DRG Workshop Belgrade, 18-22.November 2013.
Recurrent Expenditure
• General Ledger information• Expenses eg
– nursing salaries– medical/surgical supplies– cleaning– drugs
• Group these into overhead and patient care cost centres

DRG Workshop Belgrade, 18-22.November 2013.
Overhead Allocation Statistics
• Measures or estimates the cost of the services provided by one cost centre to the others
• Cleaning costs are often distributed by cleaning staff rosters or floor space
• Human Resources – staff headcount

DRG Workshop Belgrade, 18-22.November 2013.
Reciprocal Allocation Method
Cleaning
FinanceAdministration
Cardiology

DRG Workshop Belgrade, 18-22.November 2013.
Program Fractions / Inpatient Fractions
• Remove cost data that doesn’t have patient information eg –Non-inpatient costs–Teaching and research

DRG Workshop Belgrade, 18-22.November 2013.
Allocate Final Costs
• Use service weights or utilisation data –Measure of the relative resource
utilisation by DRG for patient services where data on actual resource use is not known
–Estimated or actual cost and utilisation of service

DRG Workshop Belgrade, 18-22.November 2013.
Results
• Average cost by DRG • Estimated cost by patient• Detailed service utilisation data by patient • Reports give average utilisation of major
service type– Average nurse costs– Average medical costs– Average theatre costs– Average drug/imaging/pathology costs

DRG Workshop Belgrade, 18-22.November 2013.
• VISASYS – COMBO PRODUCTS– http://www.visasys.com.au/products.htm
• POWER HEALTH SOLUTIONS – PCM– http://www.powerhealthsolutions.com/products/PPM/CostManager/
• TRENDSTAR– http://www.yardleyconsulting.com/hospital-cost-accounting/90-hosptial-
activity-based-coting-abc
• ECLYPSYS – SUNRISE PRODUCTS– www.eclipsys.com/cb6d5ab4-2a9b-4117-86f8.../download.htm
• HOME MADE SOLUTIONS – eg SAS based
COSTING SOFTWARE

DRG Workshop Belgrade, 18-22.November 2013.
Let’s look at a costweight report
NHCDC PUBLIC COSTWEIGHTS TABLER13 PubCWest60.xls
http://www.health.gov.au/internet/main/publishing.nsf/Content/Round_13-cost-reports

DRG Workshop Belgrade, 18-22.November 2013.
KEY USES OF PATIENT COST DATA
• PRICING AND CASE WEIGHTING
• MANAGING EFFICIENCY AND QUALITY OF HOSPITAL SERVICES– BY COMPLETE OUTPUT UNITS– BY INTERMEDIATE PRODUCTS
• CLAIMS OPTIMISATION -
DRG Workshop Belgrade, 18-22.November 2013.
• Cost is ONE input into price considerations• Average cost, median cost, marginal cost can all be
considered.• Variable, fixed and variable or full economic cost
may be relevant for different purposes.• BASIC PRICE IS
– BUDGET/ACTIVITY – for public hospitals– MARKET QUOTE – for private sector providers
purchasers– PRODUCT DEMAND vs SUPPLY – if scarce
unregulated..eg..
The relationship between costs and price

DRG Workshop Belgrade, 18-22.November 2013.
THANKS
QUESTIONS?QUESTIONS?