drcog metro vision regional transportation plan … freight and...drcog metro vision regional...
TRANSCRIPT

Page 1
DRCOG Metro Vision Regional Transportation Plan Freight & Goods Movement Component
DRAFT for TAC Review: November 18, 2015
A. Introduction
The efficient movement of freight, goods, and packages is extremely important to Colorado and the
Denver region’s economy. Items are moved by railcars, trucks, vans, airplanes, and pipelines. They move
to, from, and within points in the region or pass through without a delivery or pickup. Major multimodal
terminals transfer large amounts of cargo between the
various travel modes and trucks. Most freight facilities
and terminals are concentrated near freeways and major
regional arterials. Local deliveries and pickups to and from
businesses in the area depend on the reliability of the
regional and local roadway systems.
B. Freight Background
Freight represents any physical goods, parcels, raw materials, or finished products that are transported
from one place to another. For the MVRTP, the focus is on surface freight transportation modes and
facilities – highways, streets, rail, and multimodal terminals. (The aviation section of the MVRTP
addresses aviation-related freight issues.) Examples of freight movement types include:
Coal shipped by rail from Wyoming through Denver to Texas;
Goods transported by truck or rail to the Denver region for local or statewide distribution;
Local products shipped from the metro area via truck or railcar to the Midwest;
Perishable agricultural products shipped within and beyond the region (“farm to table/market”);
Packages delivered within the region from Longmont to Littleton;
Automobiles arriving from manufacturers via railcar, then transferred to truck trailers;
Letters and parcels arriving by air and then distributed by express delivery services; and
Cross-country goods traveling westbound that arrive in “triple trailer” trucks and then are
converted to “double trailer” and “single trailer” trucks to cross the mountains.
Freight transport has become more diverse in recent years. Examples include home grocery delivery,
“app-based” on-demand delivery of goods and services, and even food trucks.
“Freight customers and economics
drive the market and locations
where freight moves.”
- 2004 Freight Forum at DRCOG

Page 2
Denver is the northern end of the Ports to Plains corridor connecting Colorado to Mexico via Laredo,
Texas. This could lead to increasing the Denver region’s role as a distribution center and freight
consolidation point for goods shipped to and from Mexico via I-70, US-40, and US-287.
C. MAP-21 Freight Requirements and Guidance
MAP-21 includes a number of provisions to improve the condition and performance of the transportation
system to enhance the movement of freight and support investment in freight-related surface
transportation projects.
MAP-21 establishes a national freight policy and associated goals ― “to improve the condition and
performance of the national freight network to ensure that the network provides the foundation for the
United States to compete in the global economy and achieve each [of the following] goals…” ―
To invest in infrastructure improvements and implement operational improvements that:
o Strengthen the contribution of the national freight network to the economic
competitiveness of the United States;
o Reduce congestion, and
o Increase productivity, particularly for domestic industries and businesses that
create high value jobs.
To improve the safety, security, and resilience of freight transportation;
To improve the state of good repair of the national freight network;
To use advanced technology to improve the safety and efficiency of the national freight
network;
To incorporate concepts of performance, innovation, competition, and accountability into the
operation and maintenance of the national freight network;
To improve the economic efficiency of the national freight network, and
To reduce the environmental impacts of freight movement on the national freight network.
MAP-21 also encourages state DOTs to develop a state freight plan. CDOT completed the State Highway
Freight Plan in 2014. It is the first phase of CDOT’s overall multimodal freight planning efforts. Finally,
MAP-21 will also require DRCOG, in coordination with CDOT, to develop and report on freight-related
performance-based planning targets and measures.
DRCOG’s freight planning efforts are also designed to address MAP-21’s transportation planning factors,
specifically:
Page 3
Planning Factor #1: Support the economic vitality of the metropolitan area, especially by
enabling global competitiveness, productivity and efficiency.
Planning Factor #4: Increase the accessibility and mobility options available to people and for
freight.
Planning Factor #6: Enhance the integration and connectivity of the transportation system,
across and between modes, and for people and freight.
Planning Factor #7: Promote efficient system management and operation.
D. Current Freight Planning Efforts & Stakeholder Input
CDOT is developing its state freight plan in two phases. The MAP-21-compliant State Highway Freight
Plan completed in 2014 was the first phase. The second phase will develop an integrated freight plan
that incorporates rail and aviation freight modes. CDOT has convened a Freight Advisory Council to do
so, which includes DRCOG.
DRCOG is conducting a commercial vehicle survey to provide data for its regional travel forecasting
model, FOCUS. The survey is being conducted in partnership with CDOT and other Front Range MPOs to
increase understanding of how commercial vehicles of all types affect travel and traffic patterns in the
Front Range.
1. Freight Stakeholder Input
DRCOG has conducted, hosted, and participated in numerous freight stakeholder activities, events, and
organizations in recent years. Key examples include:
Colorado Freight Summit (July 2009)
Colorado Freight Summit Roadmap (December 2009)
I-70 Mountain Corridor Coalition (ongoing)
CDOT MPO Town Halls (May 2014)
CDOT Statewide Freight Advisory Council (July, September, and November 2015)
Focus group on freight and commercial vehicles within mixed-use communities (September 2015)
DRCOG Commercial Vehicle Survey (2015/2016)
2. Key Concerns from Stakeholders
DRCOG has also received significant feedback from freight stakeholders over the years; this feedback
has consistently emphasized the following concerns:

Page 4
The level of congestion on the road system
slows truck operations and increases the
cost of moving freight. Ultimately, the
consumer pays higher prices for goods and
services. (see Figure 1, pg. 6)
One impact of increased roadway
congestion may be more truck traffic on the
roads during peak periods with smaller
payloads. Most trucking companies must
meet customer-required delivery and pickup times. As the speed of traffic slows, more trucks
may be added to the traffic flow to meet the customer schedules. This is because an individual
truck may not be able to make as many deliveries or travel as far during congested periods.
Rail freight traffic through the Front Range metropolitan areas is slow and has safety issues at
rail-highway crossings.
Many of the older roadways present problems in efficiently moving freight. Facilities built in the
1950s used design principles for shorter trucks and lower volumes. The design for shoulders
were narrow and for lower volumes at interchanges. Turning radius on the surface streets were
tighter for smaller trucks or reduced as lanes added within existing rights-of-way. Many long
haul operations now use two (tandem) or even three (triple) trailer combinations. The turning
movements, especially, take more space than was designed into many existing roads.
Many of the bridges cannot handle the larger freight loads. Bridges with weight limits create
out-of-direction travel, increasing miles traveled, time consumed and cost to move freight.
With increases in overall freight movement and size of truck fleets, many existing connections to
multimodal freight facilities need to be improved.
The increase in truck traffic has overloaded the rest area spaces for parking trucks while in-route.
Many truckers are stopping anywhere, including the side of the road.
According to the Colorado Motor Carriers Association, local governments and freight customer
rules affect the times deliveries and pickups can be made. This has an effect on freight
operations by limiting the number of stops a truck can make. It also leads to more trucks
operating during peak periods, increasing the time to complete trips. Both of these
characteristics increase the cost to move freight. The latter adds to congestion during the peak
periods. Some of this can be seen as more trucks on the road with partial loads.

Page 5
Shortages of qualified commercial vehicle/truck drivers in the labor force.
Poor roadway conditions, such as pavement, markings, and others.
Another important freight issue is circulation and delivery within transit-oriented developments,
traditional neighborhood developments, and other new urban neighborhoods with very narrow
streets.
Consistent freight-related themes from the 2014 MPO and Transportation Planning Region (TPR)
Telephone Town Halls and TPR meetings included:
More work is needed at the regional level to identify freight bottlenecks, factors hindering
freight movement, and the importance of Freight Corridors to the entire state.
Multi-state Freight Corridors are important to the state and regional economies and should be
prioritized for improvements.
Reliability of freight movement enables many regional businesses to compete in global markets.
Many planned highway improvements will benefit the movement of truck freight.
Air is vital to regional businesses to bring in shipments of important goods and enable client and
employee travel.
TPRs and MPOs could facilitate the creation of more or improved freight multimodal transfer
points (train/truck, truck/train, and truck/plane).
Truck freight is very sensitive to consumer demand and economic activities.
Mitigation of impacts of freight movement on communities and highways is needed, particularly
because freight movement is increasing and trucks are getting larger, and hauling heavier loads.
3. Other Activities
DRCOG also addresses freight in its Congestion Mitigation Program (CMP). For example, the 2012
Annual Report on Traffic Congestion in the Denver Region contains a section analyzing the cost of
congestion to commercial vehicles, mitigation strategies, and other data. It also includes the following
map (Figure 1) identifying the locations with the highest congestion costs to freight and businesses. In
total, the cost of congestion delay is more than $1 million a day to commercial vehicles and businesses
in the DRCOG region.

Page 6

Page 7
E. Freight Network & Facilities
Freight is transported in the Denver region through an interconnected system served by several major
travel modes, a roadway and railroad system on the ground, and several multimodal transfer facilities.
Figure 2 shows the Denver region’s rail, air, and multimodal freight network. The regional freight network
includes both public (Figure 2) and private facilities; the latter include railroad tracks, loading docks,
production warehouses, and other similar components. It is important to remember that every single
street is part of the freight network, from long-haul trucking on interstate highways to residential
deliveries on local streets.
From the national perspective, MAP-21 directed US DOT to establish a national freight network consisting
of the National Highway System, freight intermodal connectors, and aerotropolis (airport-related)
facilities. More specifically, the national freight network will include the Primary Freight Network (PFN),
non-PFN portions of the interstate highways system, and critical rural freight corridors. The PFN in turn
consists of the 27,000 highway centerline miles that are most critical to freight movement.
In October 2015, US DOT released the draft National Freight Strategic Plan for public and stakeholder
review. The draft plan notes US DOT’s “efforts to incorporate all of the criteria required of the PFN by
MAP-21 did not yield a network that could comprehensively represent the most critical elements of [the]
national freight system…” For this reason, the draft plan identifies a proposed national Multimodal
Freight Network (MFN) consisting of the highest volume freight routes and facilities for highways,
railroads, airports, waterways, and pipelines. An interactive map of the proposed PFN is accessible here:
www.transportation.gov/freight/MFN.
In the DRCOG region, the proposed MFN
includes the interstate highways, Pena Boulevard
and Denver International Airport, and portions of
US-85, US-6, US-36, and E-470. It also includes
the multimodal freight facilities and terminals
and the portions of arterial roadways that
connect to them, such as 80thAvenue, Brighton
Road, 88th Avenue, Pecos Street, and Broadway.
Finally, it also includes portions of East 6th
Avenue in Aurora and Lincoln Road in Lone Tree.
Draft Multimodal
Freight Network
Highways Railroads

Page 8
CDOT’s 2015 State Highway Freight Plan also designates specific freight corridors based on a range of
inputs, including truck traffic, connectivity, federal requirements, stakeholder input, and others. In the
DRCOG region, CDOT’s freight corridors include interstate highways, freeways, and a few major regional
arterials, such as US-287, SH-119, and South Santa Fe Drive.
CDOT also developed the State Freight and Passenger Rail Plan in 2012 to meet the requirements of the
federal Passenger Rail Improvement and Investment Act of 2008. The plan’s purpose is to “provide a
framework for future freight and passenger rail planning in Colorado” and “to move freight rail
transportation forward with a focus on economic development, as well as set the stage for the state to
take advantage of the momentum around the country in regard to the interest in expanding passenger
rail service.” The plan also created and adopted a vision and several goals addressing the state’s freight
and passenger rail system. Finally, policy recommendations and short and long term illustrative rail
system improvement needs were also identified in the plan.

Page 9

Page 10
DRAFT
1. Trucks/Roadways
The majority of freight movement in the Denver
region occurs via commercial vehicles such as trucks
and vans across the entire roadway system. Trucks
are generally classified as a vehicle with a gross
weight greater than 10,000 pounds. For example, a
Ford F350 pickup marks the bottom end of the
weight threshold.
The MVRTP’s 2040 fiscally constrained regional roadway system includes 8,300 lane miles of freeways,
tollways, major regional arterials, and principal arterials that serve many of the major freight origin and
destination locations. Thousands of additional miles of local roadways provide direct access to the
remaining locations. A few roadways are also designated as National Highway System Connectors. They
are noted on Figure 8 and provide connections to major multimodal terminals such as airports, rail
terminals, truck terminals, pipeline terminals, Park-n-Ride lots, bus terminals, and bus stations.
Regulatory and other issues facing truck movements include:
CDOT regulations and rules for longer combination vehicles (LCVs), trucks that pull more than
one trailer;
Local regulations regarding the time of day that trucks can make deliveries and pickups;
Weight and winter chain law restrictions on roadways;
Upgrading the port of entry into Denver to include “smart” technologies for electronic
credential checking and weigh-in-motion facilities;
Increased homeland security concerns—criminal background checks, facility security plans,
updating of hazardous material placards on
trucks;
Bridge clearance and associated lane
weaving;
Emergency response to truck crashes; and
Rest stops, truck stops and parking.
One important but often overlooked regulatory aspect is the conflict between federal “work shift”
requirements (the maximum length of a work shift) and CDOT road closures. For example, if CDOT has a

Page 11
DRAFT
wintertime closure in the I-70 mountain corridor, a long-haul trucker cannot extend his work shift to
accommodate the time delay from that closure. This type of situation has incident management
implications – one illustration of the interconnectedness of the various facets of freight movement.
2. Commercial Vehicle Volumes
Figures 3 and 4 show 2014 and 2040 forecasted commercial vehicle volumes on the region’s major
roadways and highways. These data are from DRCOG’s 2014 Annual Report on Traffic Congestion in the
Denver Region. As expected, the region’s interstates and freeways have the highest volumes of
commercial vehicles, though portions of roadways such as South Santa Fe Drive, Parker Road, and
Wadsworth Boulevard also have high commercial vehicle volumes. Additionally, relatively lower volume
roadways, such as interstates in rural areas, may have a high percentage of commercial vehicle traffic.
Package Delivery – from Seller to Buyer
One key way commercial vehicles affect our daily lives is in the
delivery of packages. The accompanying graphics illustrate typical
updates offered to consumers to track the delivery status of their
packages. From a goods movement perspective, it is interesting to
note how many places a package is transferred to and what modes
it may have traveled to reach the consumer. For example, both
packages originated in the Midwest and were routed through a
carrier facility in Hodgkins, Illinois (suburban Chicago) and then
were likely shipped by truck to a distribution center in Commerce
City based on the 1.5 days of transit time. Both packages were then
sorted and routed very early the next morning for delivery later
that day. This illustrates the multimodal nature of goods
movement, logistical complexities, and the importance of reliable
travel and delivery times.

Page 12
DRAFT

Page 13
DRAFT

Page 14
DRAFT
3. Crash/Safety
During the most recent three-year period available (2010-2012), there were 6,800 crashes involving
trucks in the Denver region, resulting in 159 serious injuries and 34 fatalities (Table 1). Truck-involved
crashes made up about four percent of all crashes and three percent of serious injuries, but seven
percent of all fatalities. Between 2010
and 2012, truck-involved crashes
increased nine percent, while total
crashes increased only three percent.
Serious injuries in truck-involved
crashes increased 68 percent, while
total serious injuries increased nine
percent. Finally, between 2010 and
2012, fatalities in truck-involved crashes
decreased 23 percent compared to a six
percent increase in total fatalities. It is
important to note crash-related statistics can vary considerably from year to year, and comparing truck-
involved crash trends can be difficult because they make up such a small proportion of total crashes.
Table 1: Comparison of Truck and Total Crashes (2010-2012)
Number Percent Number Percent Number Percent
Trucks 6,800 4% 160 3% 35 7%
All Vehicles 176,300 5,000 500
Total Crashes Serious Injuries Fatalities

Page 15
DRAFT
Crashes at railroad crossings are also an important issue. Figure 5 shows the number of railroad crossing
crashes statewide from 2005-2014 based on data from the Federal Railroad Administration’s Office of
Safety Analysis. As shown, the number of crashes has been decreasing significantly. Though the FRA data
does not break out fatalities or injuries, it does include other interesting information. For example, for
the most recent four year period (2011-2014), automobiles were the largest single category (35 percent)
of total crashes at crossings. The BNSF Railway had the highest proportion of crashes (44 percent); RTD
rail lines were involved in a single crash during the four-year period.
Figure 5: Colorado Railroad Crossing Crashes (2005-2014)

Page 16
DRAFT
4. Freight Railroads
Railroad cars carry the most ton-miles of freight in the Denver region. Railroads generally carry heavy
and bulky cargo of lesser value per unit of weight. Freight that is hauled by rail instead of trucks causes
less damage to the roadway infrastructure. Figure 6 (FHWA) illustrates freight flows by highways,
railroads, and waterways for 2010. While Colorado is an important state for connecting long-haul freight
shipping, the relative volume of freight passing through the state is less compared with adjacent states.
Figure 6: 2010 Freight Flows by Highway, Railroad, and Waterway
Freight rail traffic in the Denver metropolitan region is dominated by two Class I railroads: Union Pacific
(UP) and Burlington Northern Santa Fe (BNSF). Class I railroads are the largest carriers and are
designated as such by the Surface Transportation Board of the U.S. Department of Transportation. Two
Class III railroads also operate within the Denver region: Denver Rock Island Railroad (DRIR) and Great
Western Railway of Colorado (GWR). Active rail lines in the region are illustrated in Figure 8 along with
switching yards, multimodal terminals, and major transfer facilities.
Page 17
DRAFT
The BNSF railroad’s principal line through the Denver region runs north-south carrying the majority of
trains from Wyoming to Texas. Its principal cargo is coal. The BNSF operates four branch lines within the
region: Golden to Denver, Broomfield-Lafayette, Longmont-Barnett, and a line connecting Denver,
northeastern Colorado, and Nebraska to the northeast.
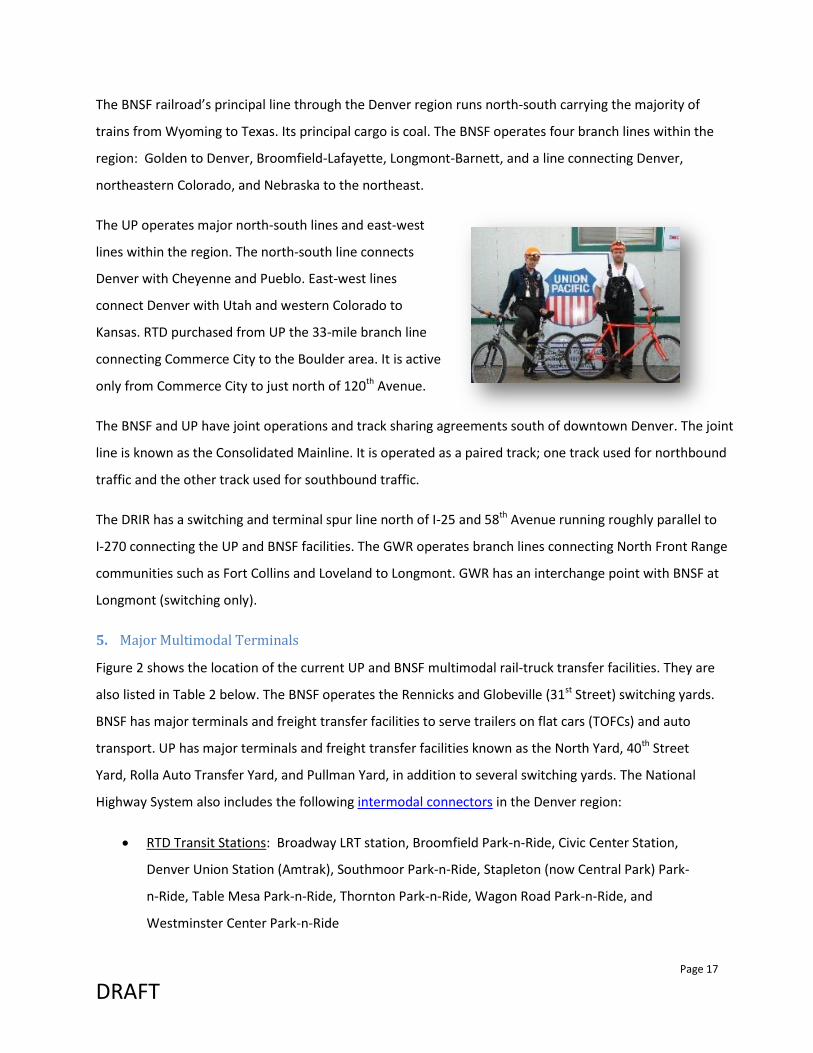
The UP operates major north-south lines and east-west
lines within the region. The north-south line connects
Denver with Cheyenne and Pueblo. East-west lines
connect Denver with Utah and western Colorado to
Kansas. RTD purchased from UP the 33-mile branch line
connecting Commerce City to the Boulder area. It is active
only from Commerce City to just north of 120th Avenue.
The BNSF and UP have joint operations and track sharing agreements south of downtown Denver. The joint
line is known as the Consolidated Mainline. It is operated as a paired track; one track used for northbound
traffic and the other track used for southbound traffic.
The DRIR has a switching and terminal spur line north of I-25 and 58th Avenue running roughly parallel to
I-270 connecting the UP and BNSF facilities. The GWR operates branch lines connecting North Front Range
communities such as Fort Collins and Loveland to Longmont. GWR has an interchange point with BNSF at
Longmont (switching only).
5. Major Multimodal Terminals
Figure 2 shows the location of the current UP and BNSF multimodal rail-truck transfer facilities. They are
also listed in Table 2 below. The BNSF operates the Rennicks and Globeville (31st Street) switching yards.
BNSF has major terminals and freight transfer facilities to serve trailers on flat cars (TOFCs) and auto
transport. UP has major terminals and freight transfer facilities known as the North Yard, 40th Street
Yard, Rolla Auto Transfer Yard, and Pullman Yard, in addition to several switching yards. The National
Highway System also includes the following intermodal connectors in the Denver region:
RTD Transit Stations: Broadway LRT station, Broomfield Park-n-Ride, Civic Center Station,
Denver Union Station (Amtrak), Southmoor Park-n-Ride, Stapleton (now Central Park) Park-
n-Ride, Table Mesa Park-n-Ride, Thornton Park-n-Ride, Wagon Road Park-n-Ride, and
Westminster Center Park-n-Ride

Page 18
DRAFT
Railroad Facilities: Burlington Northern Railroad Auto/Railroad Transfer Facilities, Southern
Pacific Railroad Transfer Facility, Union Pacific Railroad Auto/Railroad Transfer Facilities
Pipeline Facilities: Conoco Pipeline Transfer, Kaneb Pipeline Transfer, Phillips Pipeline, Total
Petroleum Pipeline Terminal
Other Facilities: Denver International Airport, Denver Greyhound Bus Station
Table 2: Existing Multimodal Freight Facilities
The appendix contains two “concept examples” of aerial photographs showing multimodal terminals
and the major roadway connectors providing access to them. These examples illustrate where these
multimodal terminals are located in relation to the region’s multimodal transportation network.
6. Air Cargo
Air cargo activity to and from Denver has grown dramatically over the past 25 years. According to DIA’s
Master Plan, total cargo volume is forecast to increase from approximately 310,800 tons in 2006 to
approximately 714,000 tons by 2030. The number of all-cargo aircraft operations is forecast to increase
Name Location Type
Conoco Pipeline Transfer 56th Ave. and Brighton Rd. Pipeline Terminal
Kanab Pipeline Transfer 80th Ave. and W. of SH-2 Pipeline Terminal
BNSF Rennicks Yard 53rd Ave. and Bannock St. Rail Yard
BNSF 31st St. Yard Globeville Rd. and 38th St. Rail Yard
UP Burham (4th Ave.) Yard 800 Seminole Rd. Rail Yard
UP Monaco Smith Rd. and Monaco Pkwy. Rail Yard
UP Roydale Smith Rd. and Peoria St. Rail Yard
UP 36th St. Yard Wazee St. Rail Yard
BNSF Big Lift SH-85 and Louviers Ave. Rail-Truck Transfer Facility
UP North Yard 901 W. 48th Ave. Rail-Truck Transfer Facility
BNSF TOFC Yard Pecos St. and 56th Ave. Rail-Truck Transfer Facility
UP Rolla Auto Transfer 96th Ave. and US-85 Rail-Truck Transfer Facility
UP 40th St. Yard 40th Ave. and York St. Rail-Truck Transfer Facility
BNSF Irondale Auto Transfer SH-2 and 88th Ave. Rail-Truck Transfer Facility
UP Pullman Yard
N. of 40th Ave. and SE of
Brighton Blvd. Rail-Truck Transfer Facility
BNSF Locomotive Shops
Park Ave., Delgany, and S.
Platte River Rail-Truck Transfer Facility
Page 19
DRAFT
from about 21,000 in 2006 to about 40,000 in 2030. Air freight is by nature high value and time sensitive
and is linked to the types of retail, service, and manufacturing businesses expected to lead the region’s
economic development in the future. DIA handles thousands of packages and containers per day, with
much smaller levels at Centennial, Rocky Mountain Metropolitan, and Front Range Airports. The aviation
section contains more detailed information about the region’s airport operations and future implications.
7. Pipelines
Pipelines in the Denver region ship in oil products and natural gas. Crude oil is processed into usable fuels
such as gasoline and delivered by truck to filling stations. Colorado’s only oil refinery is located in
Commerce City near I-270. Natural gas is used to generate electricity for homes (heating and cooking)
and businesses. Colorado requires investor-owned utilities to obtain 30 percent of their electricity from
renewable sources. Pipeline transfer facilities are shown in Figure 2.
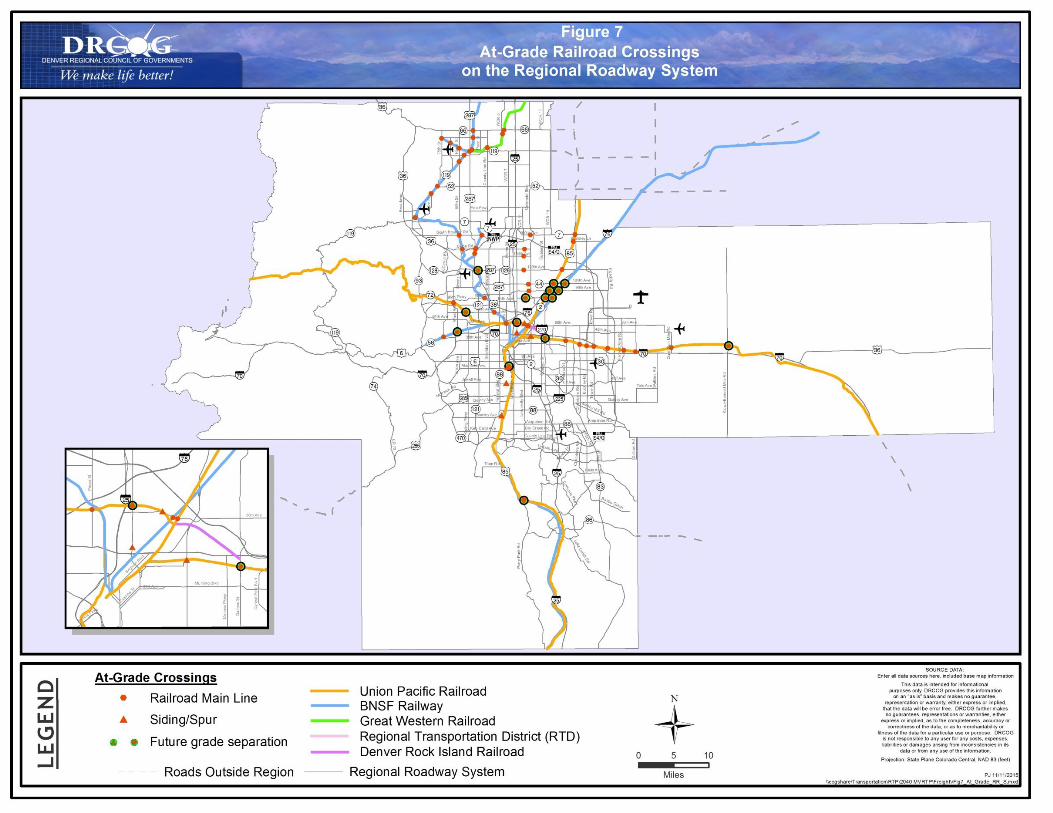
8. At-Grade Arterial Railroad Crossings
Over 500 at-grade intersections exist between the rail system and the roadway system in the Denver
metropolitan region. Many of these at-grade crossings are found north of the I-70 corridor in
predominately industrial and warehouse areas. At-grade crossings can pose safety concerns as well as
problems of delay to auto and truck traffic and emergency services. The 58 rail-on-roadway crossings on
the regional highway network are shown in Figure 7.
The number of trains that cross a road per day will increase on those lines that may serve commuter rail
in the future. Corridor studies will determine the need for constructing additional grade-separations at
such locations. In recent years, the region has converted several at-grade crossings into grade-separated
ones, such as the UP at Wadsworth Bypass/Grandview Avenue, the UP At Pecos Street, the UP/RTD East
Rail at Peoria Street, and others.
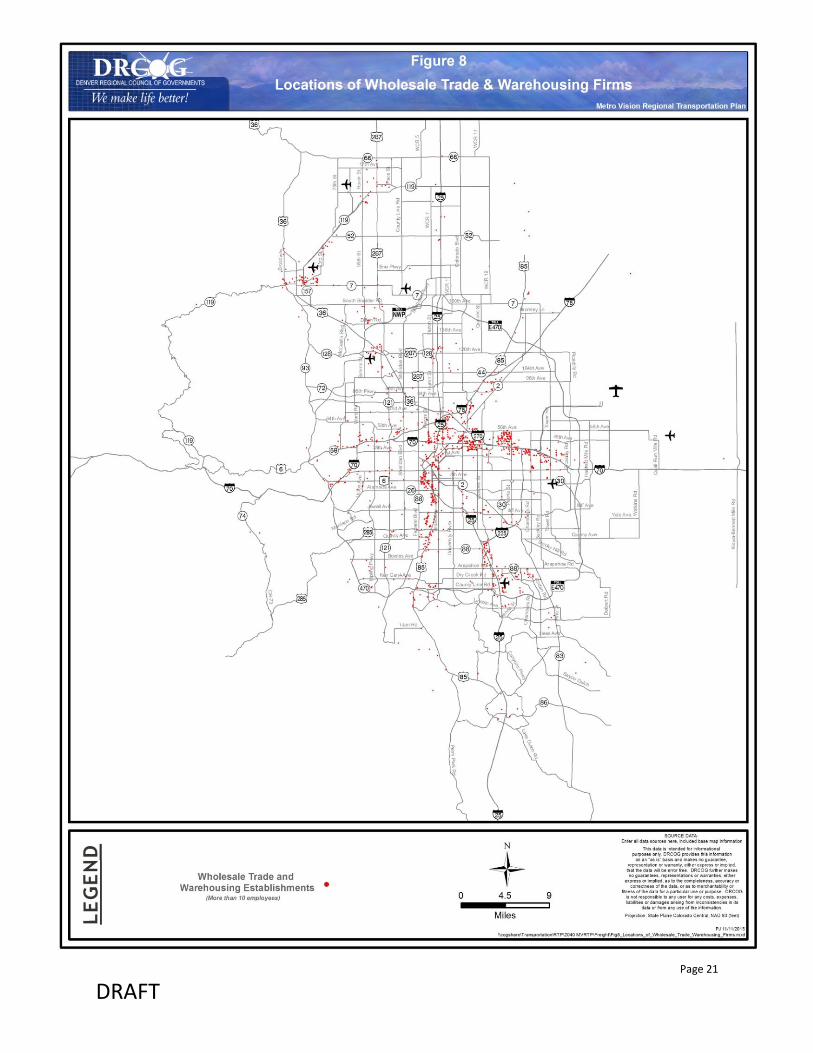
9. Warehousing
The Denver region is the hub of the state for warehousing and distribution activities. National Quarterly
Census of Employment and Wages (QCEW) data shows almost 3,000 firms (with at least 10 employees)
are engaged in wholesale trade and warehousing activities in the Denver region. Figure 8 shows the
locations and concentrations of wholesale trade and warehousing firms in the Denver region based on
the same data, which uses national NAICS employment category codes.
Page 20
DRAFT
Page 21
DRAFT

Page 22
DRAFT
10. Hazardous Materials
CDOT is responsible for designating hazardous materials (hazmat) routes based on several criteria and
policy directives, such as Title 42, Article 20 of the Colorado Revised Statutes and CDOT Policy Directives
1903 and 1903.1. In practical terms, CDOT’s Hazmat Advisory Team analyzes whether a proposed route
meets several criteria. If so, the Transportation Commission must approve the proposed designation,
and then CDOT files a petition with the Colorado State Patrol for final approval. The 12 required criteria
consider connectivity, interstate commerce, traffic volumes, safety, surrounding land uses and other
factors (see here for more information).
Figure 9 shows CDOT’s
graphical representation of
hazmat and nuclear materials
routes in the DRCOG region.
Roadways shown in green
are designated hazmat and
nuclear materials routes;
those in red are hazmat
routes only. The stars
indicate municipalities that
require gasoline, diesel, and
liquefied petroleum gas to
comply with routing
requirements. Designated
routes in the Denver region
include interstates and
portions of US-36, US-85,
US-285, C-470, SH-119, and
SH-52.
Figure 9: Designated Hazmat & Nuclear Materials Routes
Hazmat Routes Hazmat/Nuclear
Materials Routes

Page 23
DRAFT
F. Key Freight Commodity Flow Data
CDOT prepared commodity flow data profiles
identifying the top commodities transported by
truck into and out of 14 “economic regions” in
Colorado. CDOT identifies the Denver economic
region as Freight Zone #3 (Figure 10), which
corresponds to DRCOG’s planning area except for
excluding southwest Weld County. However,
additional data for Weld County is included where
feasible. According to CDOT’s State Highway Freight
Plan, oil and gas activity is heavily concentrated in
Weld County, with over 21,000 active wells
(40 percent of the statewide total). Besides oil and gas, agriculture is a principal industry in Weld County.
CDOT used the IHS Global Insight, Inc. Transearch 2010 database, consistent with the State Highway
Freight Plan, to prepare the commodity flow analysis which focuses on the top commodities transported
by truck by weight in class for 2010 and forecast for 2040. The Transearch database combines the
primary shipment data obtained from many of the nation’s largest rail and truck freight carriers with
information from public, commercial, and proprietary sources to generate a base year estimate of
freight flows at the county level. A separate model is then used to predict 2040 forecasts using
proprietary forecasts, as well as using supply and demand factors, including employment, output, and
purchases by industry and county. The Transearch forecast focuses on freight tonnage, but a value
forecast is also produced, which holds the base year price as fixed.
In preparing the commodity flow data profiles, CDOT determined the top commodities being
transported and the top locations where they are being transported to and from. Commodities in the
database were grouped using four digit Standard Transportation Commodity Codes (“STCC”) a system
designed by a special committee of the Association of American Railroads (AAR). Currently, the STCC is
maintained and published by the AAR and has been updated over the years to meet the needs of its
users, particularly the North American Freight Railroads.
Based on CDOT’s analysis, the following tables and maps highlight the top commodities transported on
highways within the DRCOG region. Commodities highlighted in light green are considered to be
Figure 10: CDOT Freight Zone #3
Page 24
DRAFT
secondary traffic, thereby indicating that a commodity is not necessarily produced in that region, but is
traveling through it.
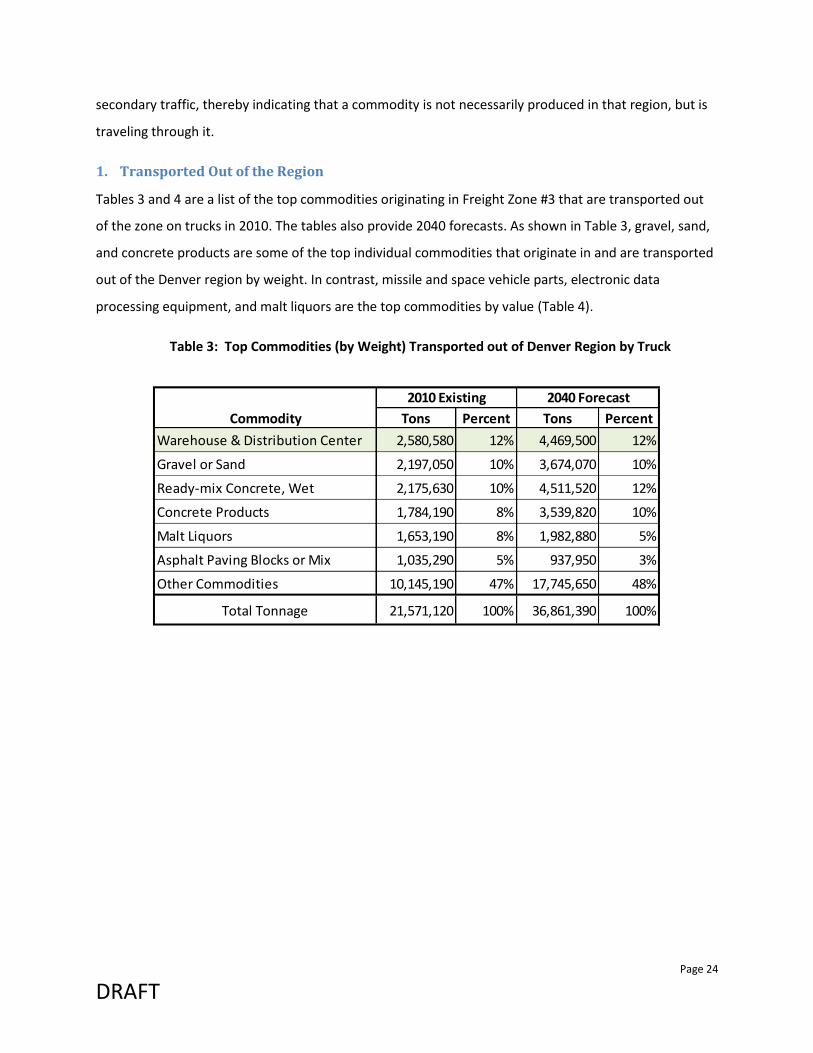
1. Transported Out of the Region
Tables 3 and 4 are a list of the top commodities originating in Freight Zone #3 that are transported out
of the zone on trucks in 2010. The tables also provide 2040 forecasts. As shown in Table 3, gravel, sand,
and concrete products are some of the top individual commodities that originate in and are transported
out of the Denver region by weight. In contrast, missile and space vehicle parts, electronic data
processing equipment, and malt liquors are the top commodities by value (Table 4).
Table 3: Top Commodities (by Weight) Transported out of Denver Region by Truck
Commodity Tons Percent Tons Percent
Warehouse & Distribution Center 2,580,580 12% 4,469,500 12%
Gravel or Sand 2,197,050 10% 3,674,070 10%
Ready-mix Concrete, Wet 2,175,630 10% 4,511,520 12%
Concrete Products 1,784,190 8% 3,539,820 10%
Malt Liquors 1,653,190 8% 1,982,880 5%
Asphalt Paving Blocks or Mix 1,035,290 5% 937,950 3%
Other Commodities 10,145,190 47% 17,745,650 48%
Total Tonnage 21,571,120 100% 36,861,390 100%
2040 Forecast2010 Existing
Page 25
DRAFT
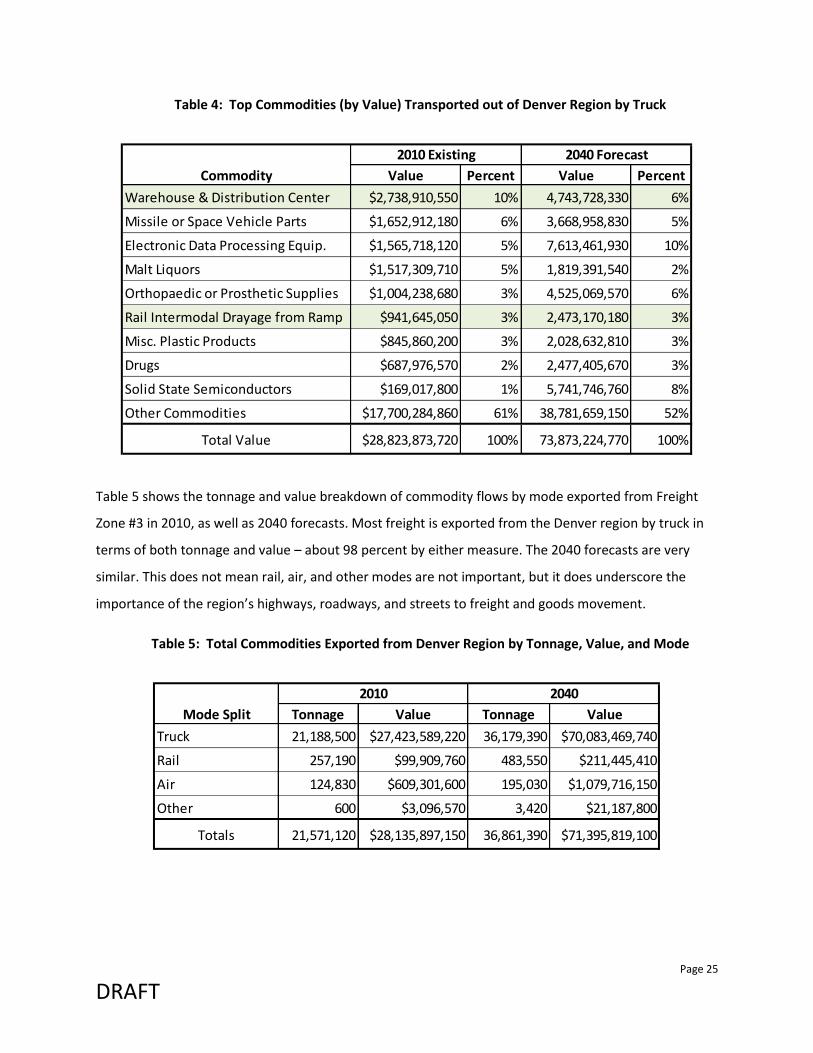
Table 4: Top Commodities (by Value) Transported out of Denver Region by Truck
Table 5 shows the tonnage and value breakdown of commodity flows by mode exported from Freight
Zone #3 in 2010, as well as 2040 forecasts. Most freight is exported from the Denver region by truck in
terms of both tonnage and value – about 98 percent by either measure. The 2040 forecasts are very
similar. This does not mean rail, air, and other modes are not important, but it does underscore the
importance of the region’s highways, roadways, and streets to freight and goods movement.
Table 5: Total Commodities Exported from Denver Region by Tonnage, Value, and Mode
Commodity Value Percent Value Percent
Warehouse & Distribution Center $2,738,910,550 10% 4,743,728,330 6%
Missile or Space Vehicle Parts $1,652,912,180 6% 3,668,958,830 5%
Electronic Data Processing Equip. $1,565,718,120 5% 7,613,461,930 10%
Malt Liquors $1,517,309,710 5% 1,819,391,540 2%
Orthopaedic or Prosthetic Supplies $1,004,238,680 3% 4,525,069,570 6%
Rail Intermodal Drayage from Ramp $941,645,050 3% 2,473,170,180 3%
Misc. Plastic Products $845,860,200 3% 2,028,632,810 3%
Drugs $687,976,570 2% 2,477,405,670 3%
Solid State Semiconductors $169,017,800 1% 5,741,746,760 8%
Other Commodities $17,700,284,860 61% 38,781,659,150 52%
Total Value $28,823,873,720 100% 73,873,224,770 100%
2010 Existing 2040 Forecast
Mode Split Tonnage Value Tonnage Value
Truck 21,188,500 $27,423,589,220 36,179,390 $70,083,469,740
Rail 257,190 $99,909,760 483,550 $211,445,410
Air 124,830 $609,301,600 195,030 $1,079,716,150
Other 600 $3,096,570 3,420 $21,187,800
Totals 21,571,120 $28,135,897,150 36,861,390 $71,395,819,100
2010 2040

Page 26
DRAFT
Figures 11 and 12 show the top in-state destinations for commodities transported out of the Denver
Region by tons (Figure 9) and by value (Figure 10) for both 2010 and 2040. As noted previously, CDOT
groups all of Weld County in a different freight zone “economic region” than the rest of the DRCOG
region. Even if CDOT had grouped southwest Weld County in Freight Zone #3, the results of Figures 11
and 12 would not likely change.
Figure 11: Top Colorado Destinations of Denver Region Exports by Tons in 2010 and 2040
2015: 3.4% 2040: 2.8% 2015: 4.0%
2040: 4.6%
2015: 2.5% 2040: 2.0%
2015: 5.1% 2040: 5.2%
2015: 1.3% 2040: 0.9%

Page 27
DRAFT
Figure 12: Top Colorado Destinations of Denver Region Exports by Value in 2010 and 2040

Page 28
DRAFT
2. Transported Out of State
Table 6 and Figure 13 show the top out of state destinations for commodities originating within and
exported from the Denver Region by truck, by weight in tons for 2010 and 2040. As shown, the Casper,
Wyoming region (known as Business Economic Area, or BEA) is the top export destination, both in 2010
and forecasted for 2040. The top five BEA destinations for DRCOG region commodity exports do not
change between 2010 and 2040, though their ranking changes slightly (between Albuquerque BEA and
Wichita BEA). Table 7 and Figure 14 show similar information, by commodity value.
Table 6: Top Out of State Destinations (by Weight) of Denver Region Exports by Truck
Business Economic Area (BEA) Tons Percent Tons Percent
Wyoming Portion of Casper BEA 1,318,840 16% 2,176,950 15%
Utah Portion of Salt Lake City BEA 949,770 12% 1,565,610 11%
New Mexico Portion of Albuquerque BEA 375,840 5% 634,920 4%
Kansas Portion of Wichita BEA 329,690 4% 664,540 5%
Non-CMA Saskatchewan 239,770 3% 428,960 3%
Other Destinations 4,899,770 60% 8,777,940 62%
Total Tonnage 8,113,680 100% 14,248,920 100%
2010 Existing 2040 Forecast

Page 29
DRAFT
Figure 13: Top Out of State Destinations of Denver Region Exports by Tons in 2010 and 2040

Page 30
DRAFT
Table 7: Top Out of State Destinations (by Value) of Denver Region Exports by Truck
Figure 14: Top Out of State Destinations of Denver Region Exports by Value in 2010 and 2040
Business Economic Area (BEA) Value Percent Value Percent
Wyoming Portion of Casper BEA $1,828,477,320 9% $3,743,802,300 7%
Utah Portion of Salt Lake City BEA $1,775,745,960 9% $3,253,535,190 6%
New Mexico Portion of Albuquerque BEA $1,292,333,840 7% $2,909,081,890 5%
Kansas Portion of Wichita BEA $1,150,107,780 6% $3,580,855,490 7%
Texas Portion of Amarillo BEA $752,754,740 4% $2,184,338,060 4%
Other Destinations $12,633,129,260 65% $38,185,693,000 71%
Total Value $19,432,548,900 100% $53,857,305,930 100%
2010 Existing 2040 Forecast

Page 31
DRAFT
3. Transported Into the Region (from in-state)
Tables 8 and 9 are a list of the top commodities imported into the DRCOG region (Freight Zone #3) by
truck for 2010 and 2040 (forecast). As shown in Table 8, crude petroleum, gravel, sand, and concrete
products are some of the top individual commodities by weight that are transported into the Denver
region by truck. Crude petroleum is also one of the top commodities by value, along with petroleum
refining products, plastics products, and electronic data processing equipment (Table 9).
Table 8: Top Commodities (by Weight) Transported into the Denver Region by Truck
Table 9: Top Commodities (by Value) Transported into the Denver Region by Truck
Commodity Tons Percent Tons Percent
Crude Petroleum 5,493,840 12% 7,615,930 10%
Warehouse & Distribution Center 4,668,530 10% 13,960,910 18%
Gravel or Sand 4,347,910 10% 6,445,850 8%
Ready-mix Concrete, Wet 3,837,630 8% 8,628,340 11%
Broken Stone/Riprap 3,191,810 7% 4,923,360 6%
Grain 3,070,240 7% 4,121,570 5%
All Other Commodities 20,939,370 46% 33,454,150 42%
Total Tonnage 45,549,330 100% 79,150,110 100%
2010 Existing 2040 Forecast
Commodity Value Percent Value Percent
Warehouse & Distribution Center $4,954,965,870 10% 14,817,486,140 12%
Crude Petroleum $2,333,185,230 5% 3,234,418,240 3%
Petroleum Refining Products $1,793,903,510 3% 1,270,911,540 1%
Misc. Plastic Products $1,497,621,040 3% 2,488,609,190 2%
Electronic Data Processing Equip. $1,367,234,890 3% 5,288,313,520 4%
Cash Grains, NEC $1,062,393,230 2% 1,238,915,990 1%
Drugs $856,487,510 2% 3,894,871,780 3%
Solid State Semiconductors $743,859,160 1% 22,645,608,370 18%
Radio or TV Transmitting Equip. $647,978,110 1% 3,749,756,770 3%
Other Commodities $36,291,372,900 70% 68,202,299,000 54%
Total Value $51,549,001,450 100% 126,831,190,540 100%
2010 Existing 2040 Forecast
Page 32
DRAFT
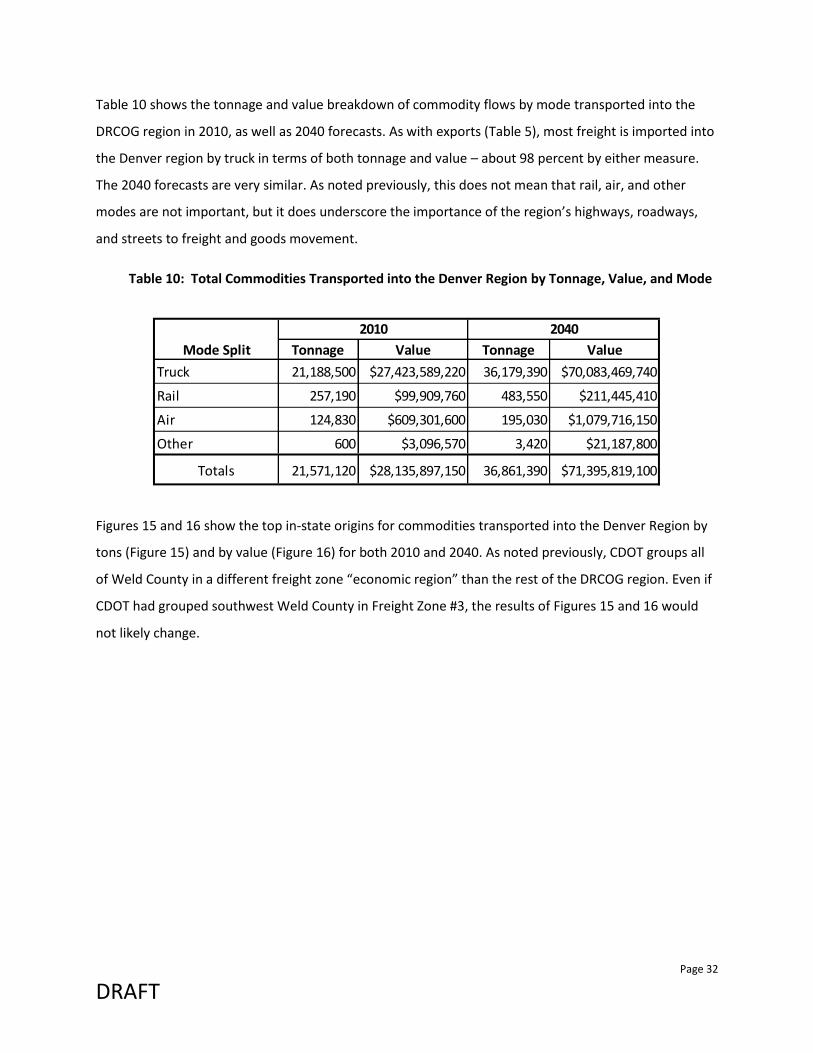
Table 10 shows the tonnage and value breakdown of commodity flows by mode transported into the
DRCOG region in 2010, as well as 2040 forecasts. As with exports (Table 5), most freight is imported into
the Denver region by truck in terms of both tonnage and value – about 98 percent by either measure.
The 2040 forecasts are very similar. As noted previously, this does not mean that rail, air, and other
modes are not important, but it does underscore the importance of the region’s highways, roadways,
and streets to freight and goods movement.
Table 10: Total Commodities Transported into the Denver Region by Tonnage, Value, and Mode
Figures 15 and 16 show the top in-state origins for commodities transported into the Denver Region by
tons (Figure 15) and by value (Figure 16) for both 2010 and 2040. As noted previously, CDOT groups all
of Weld County in a different freight zone “economic region” than the rest of the DRCOG region. Even if
CDOT had grouped southwest Weld County in Freight Zone #3, the results of Figures 15 and 16 would
not likely change.
Mode Split Tonnage Value Tonnage Value
Truck 21,188,500 $27,423,589,220 36,179,390 $70,083,469,740
Rail 257,190 $99,909,760 483,550 $211,445,410
Air 124,830 $609,301,600 195,030 $1,079,716,150
Other 600 $3,096,570 3,420 $21,187,800
Totals 21,571,120 $28,135,897,150 36,861,390 $71,395,819,100
2010 2040

Page 33
DRAFT
Figure 15: Top Colorado Origins of Commodities Transported into the Denver Region by Tons in 2010 and 2040

Page 34
DRAFT
Figure 16: Top Colorado Origins of Commodities Transported into the Denver Region by Value in 2010 and 2040

Page 35
DRAFT
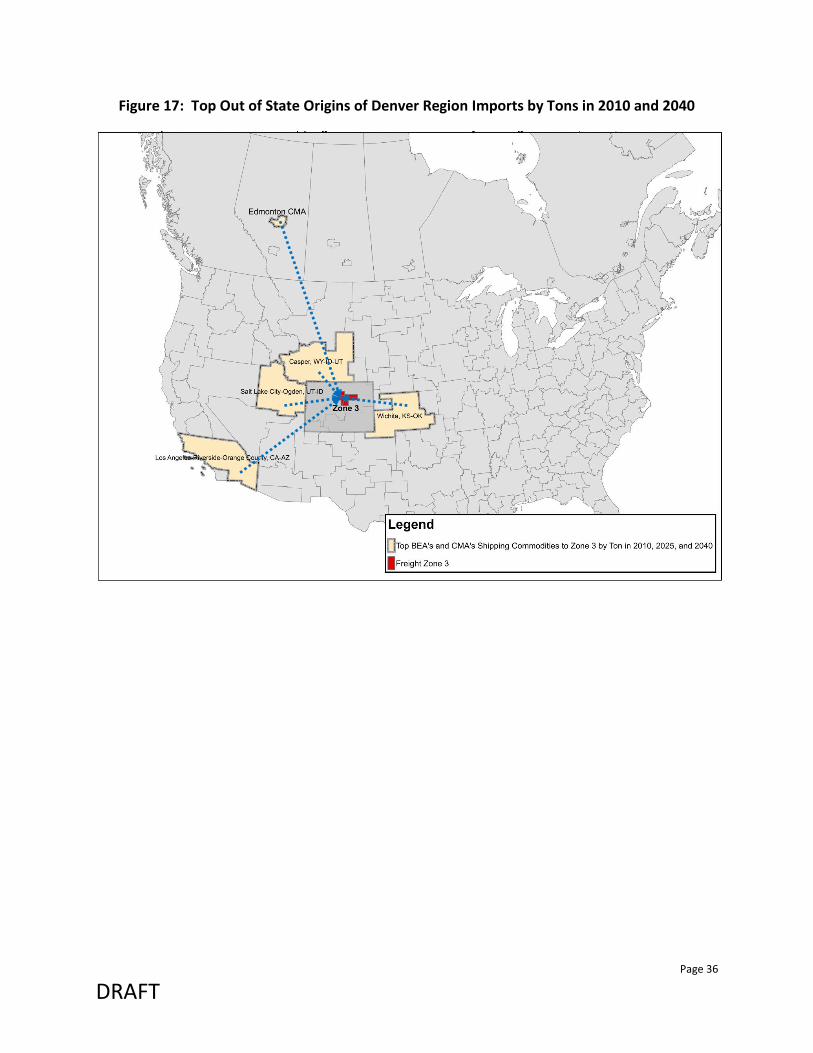
4. Transported Into the Region (from out of State)
Table 11 and Figure 17 show the top out of state origins for commodities transported into the Denver
Region by truck, by weight in tons for 2010 and 2040. As shown, the Edmonton, Alberta region is the top
import origin, both in 2010 and forecasted for 2040. The top five destinations for DRCOG region
commodity imports do not change significantly between 2010 and 2040, though their ranking changes
slightly. Table 12 and Figure 18 show similar information, by commodity value.
Table 11: Top Out of State Destinations (by Weight) of Denver Region Exports by Truck
Business Economic Area (BEA) Tons Percent Tons Percent
Edmonton, Alberta CMA 5,504,500 26% 7,655,840 20%
Utah Portion of Salt Lake City BEA 1,235,940 6% 2,490,820 7%
California Portion of Los Angeles BEA 1,149,340 5% 2,555,990 7%
Kansas Portion of Wichita BEA 995,650 5% 2,274,530 6%
Wyoming Portion of Casper BEA 801,670 4% 1,415,520 4%
Other Origins 11,274,290 54% 21,897,760 57%
Total Tonnage 20,961,390 100% 38,290,460 100%
2010 Existing 2040 Forecast
Page 36
DRAFT
Figure 17: Top Out of State Origins of Denver Region Imports by Tons in 2010 and 2040

Page 37
DRAFT
Table 12: Top Out of State Origins (by Value) of Denver Region Imports by Truck
Figure 18: Top Out of State Origins of Denver Region Imports by Value in 2010 and 2040
Business Economic Area (BEA) Value Percent Value Percent
California Portion of Los Angeles BEA $7,489,348,240 18% $18,790,425,150 17%
Utah Portion of Salt Lake City BEA $4,999,349,150 12% $20,284,254,420 19%
Edmonton, Alberta CMA $2,362,353,550 6% $3,351,652,410 3%
Kansas Portion of Wichita BEA $1,676,616,910 4% $3,769,683,340 3%
Grand Island, Nebraska BEA $1,278,166,320 3% $2,551,631,130 2%
New Mexico Portion of Albuquerque BEA $681,291,780 2% $5,523,340,610 5%
Arizona Portion of Phoenix BEA $439,420,810 1% $4,848,587,270 4%
Other Origins $21,929,858,150 54% $48,805,180,950 45%
Total Value $40,856,404,910 100% $107,924,755,280 100%
2010 Existing 2040 Forecast
Page 38
DRAFT
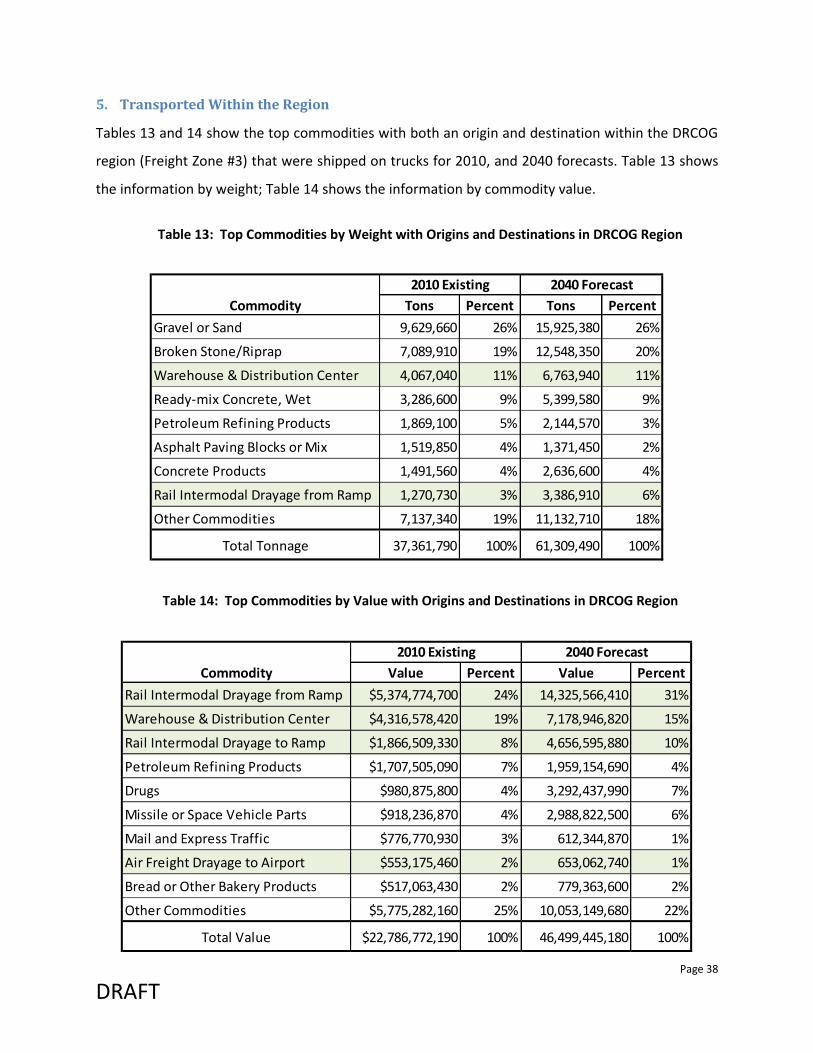
5. Transported Within the Region
Tables 13 and 14 show the top commodities with both an origin and destination within the DRCOG
region (Freight Zone #3) that were shipped on trucks for 2010, and 2040 forecasts. Table 13 shows
the information by weight; Table 14 shows the information by commodity value.
Table 13: Top Commodities by Weight with Origins and Destinations in DRCOG Region
Table 14: Top Commodities by Value with Origins and Destinations in DRCOG Region
Commodity Tons Percent Tons Percent
Gravel or Sand 9,629,660 26% 15,925,380 26%
Broken Stone/Riprap 7,089,910 19% 12,548,350 20%
Warehouse & Distribution Center 4,067,040 11% 6,763,940 11%
Ready-mix Concrete, Wet 3,286,600 9% 5,399,580 9%
Petroleum Refining Products 1,869,100 5% 2,144,570 3%
Asphalt Paving Blocks or Mix 1,519,850 4% 1,371,450 2%
Concrete Products 1,491,560 4% 2,636,600 4%
Rail Intermodal Drayage from Ramp 1,270,730 3% 3,386,910 6%
Other Commodities 7,137,340 19% 11,132,710 18%
Total Tonnage 37,361,790 100% 61,309,490 100%
2010 Existing 2040 Forecast
Commodity Value Percent Value Percent
Rail Intermodal Drayage from Ramp $5,374,774,700 24% 14,325,566,410 31%
Warehouse & Distribution Center $4,316,578,420 19% 7,178,946,820 15%
Rail Intermodal Drayage to Ramp $1,866,509,330 8% 4,656,595,880 10%
Petroleum Refining Products $1,707,505,090 7% 1,959,154,690 4%
Drugs $980,875,800 4% 3,292,437,990 7%
Missile or Space Vehicle Parts $918,236,870 4% 2,988,822,500 6%
Mail and Express Traffic $776,770,930 3% 612,344,870 1%
Air Freight Drayage to Airport $553,175,460 2% 653,062,740 1%
Bread or Other Bakery Products $517,063,430 2% 779,363,600 2%
Other Commodities $5,775,282,160 25% 10,053,149,680 22%
Total Value $22,786,772,190 100% 46,499,445,180 100%
2010 Existing 2040 Forecast

Page 39
DRAFT
Finally, Table 15 shows the percentage of commodities that have both an origin and destination
within the DRCOG region by year, by both weight and value.
Table 15: Commodities that Stay Within the DRCOG Region
Year Tonnage Value
2010 55% 29%
2025 56% 26%
2040 53% 23%

Page 40
DRAFT
G. MVRTP Freight-Related Transportation Improvements
One of the most consistent feedback themes provided by freight stakeholders over time is the
importance of travel time reliability and the impact of congestion on freight and goods movement. The
following roadway system improvement project types contained in the MVRTP will directly benefit the
movement of freight by decreasing congestion and improving travel time reliability:
Expand the regional roadway system (add nearly 1,200 lane-miles) by widening roads,
removing bottlenecks, and constructing new roads and interchanges;
Construct railroad crossing grade-separations at critical locations; and
Provide roadway management and Intelligent Transportation System applications, such as
traveler information systems, incident management, and variable message signs.
The following examples of regionally significant roadway capacity projects in the 2040 Fiscally Constrained
RTP will specifically benefit freight and goods movement because they are located on roadways that are
either designated freight corridors, provide access to multimodal freight terminals, have a large volume of
commercial vehicles, or are otherwise important to freight and goods movement:
I-25 (US-36 to SH-7): add managed lanes
I-25 (Santa Fe Drive to US-6): interchange capacity
I-70 (Brighton Boulevard to I-270): add 4 new managed lanes (project is currently being amended)
I-70 (Empire Junction (US-40) to Twin Tunnels): add peak period shoulder managed lanes
I-270 (I-25 to I-70): widen from 4 to 6 lanes
I-270/Vasquez Boulevard: interchange capacity
US-36 (I-25 to Table Mesa Drive): add managed lanes
US-85 (Highlands Ranch Parkway to County Line Road): widen from 4 to 6 lanes
C-470 (Kipling Parkway to I-25): add toll managed lanes
SH-2 (72nd Avenue to I-76): widen from 2 to 4 lanes
Pena Blvd. (I-70 to E-470): widen from 4 to 8 lanes
88th Ave. (I-76 to SH-2): widen from 2 to 4 lanes
The MVRTP includes the following projects, strategies, and concepts to benefit the freight railroad system:
Eastern railroad bypass. CDOT concluded the Colorado Rail Relocation Implementation Study
(aka R2C2 Study) in 2009. Two alternative alignments were determined to have a positive benefit-
to-cost ratio. Either alignment could result in a diversion of a substantial amount of freight rail
traffic that currently uses the Consolidated Mainline through the Denver region.

Page 41
DRAFT
Railroad grade-separation bridges/underpasses on the regional roadway system at the
following example locations:
o BNSF at 88th Avenue
o BNSF at 96th Avenue
o BNSF at 104th Avenue
o BNSF at SH-67 and UP at SH-67 (Sedalia)
o BNSF/UP at Santa Fe Drive/Kalamath Street
o RTD at 88th Avenue
o UP at 72nd Avenue
o UP at 88th Avenue
o UP at 96th Avenue
o UP at 104th Avenue
o UP at Broadway (SH-53)
o UP at Quebec Street frontage road ramps
o UP at SH-79
o UP at Washington Street
Railroad grade-separations on local streets off the regional roadway system will also be
considered at critical locations.
DRCOG’s Transportation Improvement Program (TIP) also contains many multimodal transportation
projects that will address and benefit freight and goods movement, such as the US-36 managed lanes
project. The TIP implements the MVRTP and identifies all transportation projects to be completed in the
Denver region over a six-year period with federal, state, or local funds.
There are other improvements that will be implemented as components of larger-scale projects built by
CDOT or by local governments:
Improve intersection turning radii at busy locations where trucks have difficulty making turns;
Construct or widen shoulders to provide adequate space for trucks to pull over;
Reconstruct bridges to handle typical truck load weights; and
Construct additional rest areas or expand parking at existing areas on the outskirts of the
Denver region.
Page 42
DRAFT
The City of Denver reached agreement in 2015 with adjacent jurisdictions to begin developing an
“aerotropolis” around DIA. Potential freight implications include air cargo and airport-related storage,
warehouse, transfer and other facilities for higher-value goods.
Land owners in the vicinity of Front Range Airport have proposed a new air/rail/highway multimodal
facility known as Spaceport Colorado. Planned or envisioned improvements that will benefit terminals
include:
Widening of several regional system roadways that are located in the vicinity of
multimodal terminals; and
Constructing new multimodal freight centers to handle truck/rail transfers and
relocate some existing multimodal terminals.
H. Operations & Technology
Operations and technology are important aspects of freight and goods movement. The overall objective
of transportation system management and operation (TSM&O) strategies is to safely provide more
reliable trip travel times and reduce the amount of delay faced by drivers, passengers, trucks, and
commercial vehicles on the roadway and transit system. The strategies also have a positive impact on
safety and air quality. Roadway operational improvement projects are generally low to moderate cost
and do not explicitly add significant new capacity to the system. These improvements cost-effectively
reduce delay, improve traffic flow (such as by reducing bottlenecks), and increase safety – all important
benefits to freight and goods movement and the shipping and delivery of goods and services. As another
example, the National ITS Architecture includes components on carrier operations and fleet
management, cargo movement and condition, roadside safety, driver security, hazmat management,
and commercial vehicle tracking.
Technology is important in my ways, such as real-time traffic/travel and weather data and managing
fleet deployment and payload logistics. Connected vehicle applications are an emerging technology that
is working to address such topics as curve speed warnings, oversize vehicle warnings, and smart
roadside wireless inspection. CDOT recently unveiled its RoadX initiative to use innovative technology to
improve transportation system safety, mobility, and efficiency. Such technology could include smart
device apps, connected vehicles, truck platoons linked through technology, virtual guardrails, and
others. CDOT will initially invest $20 million to start RoadX and partner with the private sector to evolve
the program.
Page 43
DRAFT
I. Air Quality Concerns with Freight Movement
The economic benefit of freight travel is not without environmental impacts, particularly to the region’s air
quality. A large percentage of heavy trucks are powered by diesel engines. The state Air Pollution Control
Division (APCD) estimates that heavy-duty diesel vehicles are responsible for about 50 percent of the
primary PM10 emissions from motor vehicles. Similarly, heavy-duty diesel engines are a large contributor to
NOx emissions. Continued improvements to diesel engines and fuels will result in cleaner running trucks.
Improvements that reduce roadway and rail congestion will also result in less pollution from truck and rail
operations.
J. Summary – Eye on the Future
Freight and goods movement is increasingly important at the federal, state, regional, and local levels. Many
freight-related issues, concerns, and solutions apply to the region’s overall transportation system, while
some are unique to freight and goods movement. As with other components of the MVRTP, DRCOG, CDOT,
local governments, and others will continue to work closely with freight stakeholders to plan for the future.
The MVRTP recognizes that rapid technological evolution requires the region to be nimble, flexible, and
responsive to adapt quickly to changing trends and innovations.

Page 44
DRAFT
APPENDIX
DRAFT Concept Examples of Multimodal Terminal Graphics

Page 45
DRAFT
Kaneb Pipeline Transfer (80th) BNSF Auto Transfer (88th)
Conoco, Total Petro., and Phillips Pipeline Transfer (56th and Brighton)