draft - university of toronto
TRANSCRIPT
Draft
Biodiversity assessments in the 21st century: The potential of insect traps to complement environmental samples for
estimating eukaryotic and prokaryotic diversity using high-throughput DNA metabarcoding
Journal: Genome
Manuscript ID gen-2018-0096.R2
Manuscript Type: Article
Date Submitted by the Author: 24-Nov-2018
Complete List of Authors: Ritter, Camila; University of Duisburg-Essen, Department of Eukaryotic MicrobiologyHäggqvist , Sibylle ; Swedish Museum of Natural History, Department of Zoology, Box 50007, 104 05 Stockholm, SwedenSääksjärvi , Ilari; Biodiversity Unit, University of Turku, FI-20014 Turku, FinlandKarlsson, Dave; Station Linné, Skogsby 161, 386 94 Färjestaden, SwedenMuasya, Muthama; University of Cape Town Department of Biological SciencesNilsson, R. Henrik; Goteborgs Universitet, Biological and Environmental SciencesAntonelli, Alexandre; Goteborgs Universitet, Biological and Environmental Sciences
Keyword: Environmental DNA, COI mtDNA, Non-destructive DNA extraction, Metabarcoding, 16S rDNA, 18S rDNA
Is the invited manuscript for consideration in a Special
Issue? :7th International Barcode of Life
Note: The following files were submitted by the author for peer review, but cannot be converted to PDF. You must view these files (e.g. movies) online.
Appendix 1 Collection Protocol.docx
https://mc06.manuscriptcentral.com/genome-pubs
Genome
Draft
Biodiversity assessments in the 21st century: The potential of insect traps to complement
environmental samples for estimating eukaryotic and prokaryotic diversity using high-
throughput DNA metabarcoding
Camila D. Ritter1*, S. Häggqvist2, D. Karlsson3, I.E. Sääksjärvi4, A. Muthama Muasya5, R.
Henrik Nilsson6,7, Alexandre Antonelli6, 7, 8,
1Department of Eukaryotic Microbiology, University of Duisburg-Essen, Universitätsstrasse 5
S05 R04 H83 D-45141 Essen, Germany
2Swedish Museum of Natural History, Department of Zoology, Box 50007, 104 05
Stockholm, Sweden
3Station Linné, Skogsby 161, 386 94 Färjestaden, Sweden
4Biodiversity Unit, University of Turku, FI-20014 Turku, Finland
5Department of Biological Sciences, University of Cape Town, Rondebosch 7701, RSA
6Gothenburg Global Biodiversity Centre, Box 461, SE-405 30 Göteborg, Sweden
7Department of Biological and Environmental Sciences, University of Gothenburg, Box 463,
405 30 Göteborg, Sweden
8Gothenburg Botanical Garden, Carl Skottsbergs gata 22A, SE-41319 Göteborg, Sweden
*Corresponding author: Camila D. Ritter [email protected].
[email protected], [email protected] Phone: +55 48991434597.
Page 1 of 35
https://mc06.manuscriptcentral.com/genome-pubs
Genome
Draft
Abstract
The rapid loss of biodiversity, coupled with difficulties in species identification, call for
innovative approaches to assess biodiversity. Insects make up a substantial proportion of
extant diversity and play fundamental roles in any given ecosystem. To complement
morphological species identification, new techniques such as metabarcoding make it possible
to quantify insect diversity and insect-ecosystem interactions through DNA sequencing. Here
we examine the potential of bulk insect samples (i.e., containing many non-sorted specimens)
to assess prokaryote and eukaryote biodiversity and to complement the taxonomic coverage of
soil samples. We sampled 25 sites on three continents and in various ecosystems, collecting
insects with Slam-traps (Brazil) and Malaise-traps (South Africa and Sweden). We then
compared our diversity estimates with the results obtained with biodiversity data from soil
samples from the same localities. We found a largely different taxonomic composition
between the soil and insect samples, testifying to the potential of bulk insect samples to
complement soil samples. Finally, we found that non-destructive DNA extraction protocols,
which preserve insect specimens for morphological studies, constitute a promising choice for
cost-effective biodiversity assessments. We propose that the sampling and sequencing of
insect samples should become a standard complement for biodiversity studies based on
environmental DNA.
Key-words: Environmental DNA, COI mtDNA, Non-destructive DNA extraction,
Metabarcoding, 16S rDNA, 18S rDNA.
Page 2 of 35
https://mc06.manuscriptcentral.com/genome-pubs
Genome
Draft
Background
Quantification of biological diversity is crucial for many biological and societal applications,
including biogeography and ecosystem services, understanding biological interactions, and
for designing conservation and management strategies. But quantifying biodiversity is a big
challenge in that it requires taxonomic expertise, substantial time, and significant funding
(Campbell et al. 2011). Recent molecular (DNA-based) tools, however, hold the potential to
speed up biodiversity quantification manifold while keeping costs down. With methods such
as DNA metabarcoding (Taberlet et al. 2012a), it is now possible to quantify the genetic
diversity of any locality without the need to spend years examining specimens and their
morphological characters (Gibson et al. 2014; Bush et al. 2017; Lugg et al. 2017).
Metabarcoding techniques have been used successfully for species identification from bulk
organism samples (e. g. Taberlet et al. 2012b; Liu et al. 2013) as well as from environmental
samples of soil, litter, faeces, and water (Taberlet et al. 2012a; Lanzen et al. 2016). Insects
represent more than 50% of the described eukaryotic diversity (Stork et al. 2015; Stork 2018)
and are essential for ecosystem functioning (e. g. Bascompte et al. 2003; Calvignac-Spencer
et al. 2013; Miller et al. 2016). Applying metabarcoding methods to insect samples may allow
us not only to assess insect biodiversity per se, but also the prokaryote and eukaryotic
diversity in those samples, including organisms present on and inside the insect bodies and
any food remains in their digestive system. For instance, Schnell et al. (2015) used
hematophagous leeches to estimate the diversity of vertebrates in the region where the leeches
were sampled.
Page 3 of 35
https://mc06.manuscriptcentral.com/genome-pubs
Genome

Draft
To test the usefulness of bulk insect samples as environmental DNA (eDNA) in different
environments, we sampled insects and soil on three continents (Europe, Africa, and South
America). We sequenced two fragments of the ribosomal genes using general primers for
prokaryotes (the 16S gene) and eukaryotes (the 18S gene). We tested six different DNA
extraction protocols, of which three were destructive and three were non-destructive
(preserving the exoskeleton of insects), to assess the efficiency of non-destructive protocols to
register other organisms beyond insects. The goals of this study are to i) evaluate the
taxonomic coverage that can be attained through metabarcoding of insect samples; ii) test the
feasibility of a range of lab protocols and sampling techniques on samples from various
environments, ranging from tropical rainforests to temperate grasslands; and iii) based on the
results from (i) and (ii), propose a standardized protocol for collecting and processing soil and
insect samples, including the prokaryotic and eukaryotic organisms associated with the
insects. Our unified framework facilitates the assessment of a large portion of the total
biodiversity of any site and thereby complements traditional taxonomic inventories.
Material and Methods
Sampling design: Soil samples were collected in three countries: Brazil, South Africa, and
Sweden following the protocol described in Tedersoo et al. (2014) and Ritter et al. (2018).
Arthropods, mainly flying insects, were collected in the same localities with Slam-traps
(Brazil) or Malaise-traps (South Africa and Sweden). Both are tent-like traps made of fine
mesh-netting, widely used in entomological studies and aimed at capturing strong-flying
insects (e.g. wasps, mosquitos and butterflies) that typically fly upwards after hitting a fine-
scale net, and which are ultimately trapped in a bottle filled with ethanol or another preserving
liquid. These two traps differ mainly in shape, with Slam-traps resembling an igloo (dome-
Page 4 of 35
https://mc06.manuscriptcentral.com/genome-pubs
Genome
Draft
shaped) and Malaise-traps a Canadian tent (higher on one end). Figure 1 summarizes our
sampling design and shows examples of these two insect traps. The sampling locations are
shown in Fig. 2. Sampling time differed among countries due to logistic conditions: in Brazil
and South Africa we were just able to keep the traps open for one day, whereas in Sweden we
were able to keep them open for seven days. The details of the sampling localities are
summarized in Table 1.
DNA extraction: We first tested the efficiency of five DNA extraction protocols on five insect
samples obtained from Sweden (Table S1). Since we did not find significant differences
between the protocols in either an ANOVA test (with the total number of OTUs; p = 0. 96) or
a Kruskal-Wallis test (with the number of OTUs by taxonomic group; p = 0. 66), we decided
to perform all subsequent analyses using the non-destructive protocol of Aljanabi and
Martinez (1997) for insect sample DNA extractions. The samples were immersed in 15 ml of
salt buffer (0. 4 M NaCl, 10 mM Tris-HCl pH = 8, and 2mM EDTA pH = 8) using a vortex
mixer for 1 min. Then 1.5 ml of 20% SDS and 20 μl of 20mg/ml Proteinase K were added.
Whenever the insects were not completely covered by the buffer, we added additional buffer
of the same proportion of reagents until all insects were covered. The samples were incubated
at 60°C overnight. After that, we transferred 15 ml of clear lysis solution into a new tube and
the insects were transferred into 99% ethanol for preservation. Then, 11.25 ml of 6 M NaCl
were added to the lysis solution, and the samples were vortexed for 30 s at maximum speed.
The samples were then centrifuged at 10,000 g for 30 min, and 25 ml of the supernatant were
transferred to a new tube. An equal volume of isopropanol was added. The samples were
incubated at -20°C for 1 h, and then centrifuged at 10,000 g for 20 min at 4°C. Pellets were
washed with 2 ml of 70% ethanol, dried in room temperature, and re-suspended in 300 μl of
sterile dH2O. For soil samples, 10 grams of dried soil were used for extraction with the
Page 5 of 35
https://mc06.manuscriptcentral.com/genome-pubs
Genome
Draft
PowerMax® Soil DNA Isolation Kit (MO BIO Laboratories, USA), following the
manufacturer’s instructions as detailed in Ritter et al. (2018).
PCR amplification: The amplification and sequencing of the nuclear 16S, 18S and
cytochrome c oxidase subunit I mitochondrial (COI) genes regions were performed by
Macrogen (Republic of Korea). For 16S we targeted the V3-V4 region (~460) using the
forward primer (5’- CCTACGGGNGGCWGCAG - 3’) and reverse primer (5’-
GACTACHVGGGTATCTAATCC - 3’) from Klindworth et al. (2013), following standard
protocols of Macrogen (South Korea). Sequencing was performed using the Illumina MiSeq
2x300 platform. For metabarcoding of the 18S region, we targeted the hypervariable V7
region of the 18S rRNA gene using the 5’-TTTGTCTGSTTAATTSCG-3’ and 5’-
TCACAGACCTGTTATTGC-3’ forward and reverse primers designed by Guardiola et al.
(2015) and later tested soil samples in French Guiana (Zinger et al. 2017), which yield a 100–
110 long fragment. Sequencing was done using the Illumina MiSeq 2x250 platform. For COI,
we amplified a region of ~313 using an internal forward primer (5’ -
GGWACWGGWTGAACWGTWTAYCCYCC - 3’, Leray et al. 2013) and the COI
degenerate reverse primer (5’ – TAAACTTCAGGGTGACCAAARAAYCA - 3’, Folmer et
al. 1994). Sequencing was carried out using the Illumina MiSeq 2x300 platform.
Operational taxonomic unit (OTU) assessment: OTU selection for each library was
performed using the USEARCH/UPARSE v9. 0. 2132 (Edgar 2013) Illumina paired reads
pipeline. We filtered the sequences by quality to discard chimeras and clustered sequences
into OTUs at a minimum similarity of 97% using a “greedy” algorithm that performs chimera
filtering and OTU clustering simultaneously (Edgar 2013). Singletons were removed. We
Page 6 of 35
https://mc06.manuscriptcentral.com/genome-pubs
Genome
Draft
used SILVAngs 1. 3 for taxonomic assignments of the OTUs of 16S and 18S, using a
representative sequence from each OTU for all insects and soil samples. The reference data
were SINA v1.2.10 for ARB SVN (revision 21008) and BLAST (Altschul et al. 1997) for the
classification of sequences (Camacho et al. 2009). For COI, we used the sequences available
in GenBank (Benson et al. 2005) and blasted them with the “blastn” tool.
Statistical analysis: We first rarefied all samples to equal depth, where the depth was
determined by the lowest number of reads obtained from a single plot (Fig. 3). We also
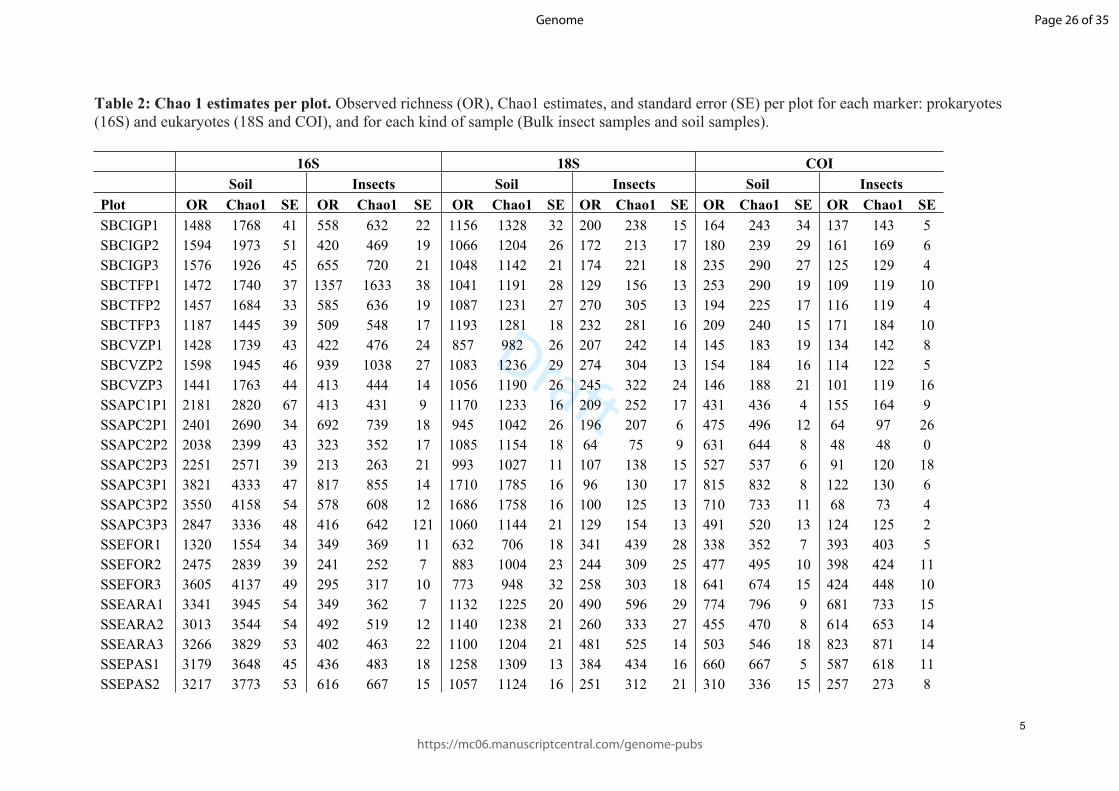
estimated the Chao1 richness for each plot based on the original data with the number of
reads, using the “estimateR” function (Table 2). As the Chao1 estimates and the rarefied
richness were high correlated (the lowest correlation was observed for insect samples of the
COI gene [0.83], whereas the highest correlation was observed for soil samples of the COI
gene [0.99]) we just used the rarefied data in the subsequent analyses (Table S2). We
subsequently transformed the OTU tables to presence/absence for both prokaryotic (16S) and
eukaryotic (18S) data. We employed two methods to test the difference among samples. First,
we used a permutational multivariate analysis of variance (PERMANOVA) test with country,
habitat, and kind of sample (insects or soil) as predictors, and dissimilarity matrices using the
Jaccard index of OTUs from prokaryotes (16S), eukaryotes (18S) and eukaryotes (COI) as
response variables. Second, we ran a two-dimensional Non-metric Multidimensional Scaling
(NMDS) ordination of all samples (Legendre and Legendre 1998) with the Jaccard distance
matrix. In this run we used the “envfit” method to fit country, habitat type, and kind of sample
onto the NMDS ordination as a measure of the correlation of these factors with the NMDS
axes. The function “envfit” finds vectors or factor averages of environmental variables.
Vector fitting is a regression and as a regression the R2 is easily computed. All analyses were
Page 7 of 35
https://mc06.manuscriptcentral.com/genome-pubs
Genome

Draft
made in the VEGAN package version v. 2. 4-3 (Oksanen et al. 2007) run in the R
environment R v3.4.2 (R Development Core Team 2017).
Results
After rarefaction, the prokaryotic (16S) data presented a total of 10,679 OTUs from the soil
samples and 5,721 OTUs from the insect samples. Of these, we were able to assign 10,492
(98%, soils) and 5,334 (93%, insects) to a taxonomic affiliation at or below the order level.
For eukaryotes (18S) we obtained 9,508 OTUs (soil samples) and 2,168 OTUs (insect
samples), of which 8,344 (88%) and 1,929 (89%) were assignable to the order level or below,
respectively. For eukaryotes (COI) we obtained 6,611 OTUs (soil samples) and 3,287 OTUs
(insect samples), of which 3,748 (57%) and 1,812 (56%) were assignable to the order level or
below, respectively. Tables with the number of reads of each OTU by plot, and their
taxonomic assignments, are provided in the supplementary material (S3 – S5).
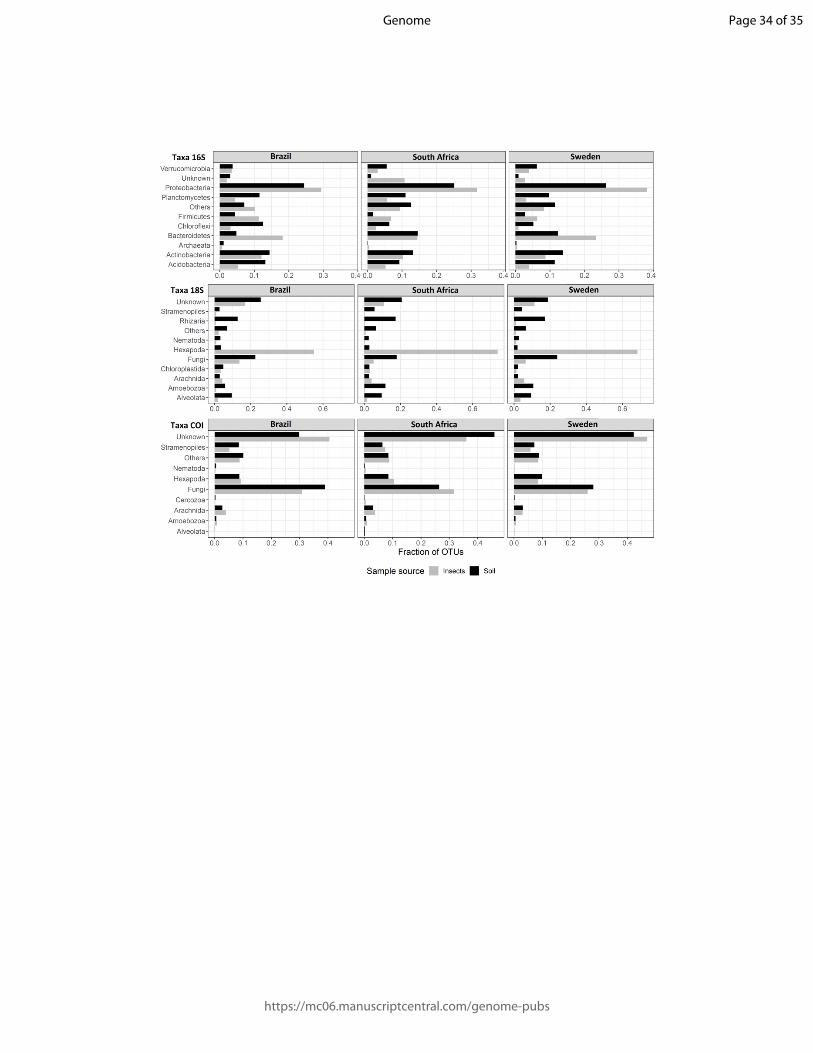
The taxonomic composition of prokaryotes and eukaryotes was different between the soil and
the insect samples (Fig. 4). For the prokaryotic component of the soil samples, the highest
number of OTUs was found to stem from Proteobacteria (~25%, mostly
Alphaproteobacteria), Actinobacteria (~15%), and Acidobacteria (~10%, Fig. 3). For the
insect samples, however, the corresponding order was Proteobacteria (~30%), Bacteroides
(~20%), and Actinobacteria (~12%, Fig. 3). For eukaryotes (18S) from the soil samples, the
group with the highest number of OTUs was Fungi (~25%, mainly Ascomycota and
Basidiomycota) followed by Rizharia (~15%) and Alveolata and Amebozoa (both with ~10%,
Fig. 4). For the insect samples, and apart from the obvious dominance of insects due to the
Page 8 of 35
https://mc06.manuscriptcentral.com/genome-pubs
Genome

Draft
highest insect biomass in the samples (~70%), we found a relatively high proportion of Fungi
(~15%), Arachnida, Chloroplastida (Viridiplantae), and Alveolata (all with ~5%, Fig. 4).
Interestingly, for COI we found similar proportions of taxonomic groups in soil and insect
samples (Fig. 4), with the highest number of “unknown” OTUs (~40%). The assigned group
with the highest number of OTUs was Fungi (~30%, mainly Ascomycota and
Basidiomycota), followed by Hexapoda and Stramenopiles (both with ~10% in soil samples
and Stramenopiles with ~5% in insect samples, Fig. 4).
No clear difference in taxonomic composition considering orders was observed with respect
to habitat types for either the prokaryote or the eukaryote datasets. With respect to the number
of OTUs belonging to insects, the decreasing order of OTUs in the insect samples was
Sweden (794 [18S] and 176 [COI]), Brazil (561 [18S] and 82 [COI]) and South Africa (405
[18S] and 44 [COI]). The most common insect orders in soil and insect samples were
Coleoptera, Diptera, Hymenoptera, and Lepidoptera. The number of OTUs for each order per
marker and sample type are summarized in Table 3.
The PERMANOVA results showed a significant effect for country (16S [R2 = 0.16, p <
0.001], 18S [R2 = 0.14, p < 0.001], COI [R2 = 0.13, p < 0.001]) and type of sample (16S [R2 =
0.22, p < 0. 001], 18S [R2 = 0.22, p < 0.001], COI [R2 = 0.08, p < 0.001]) for all the
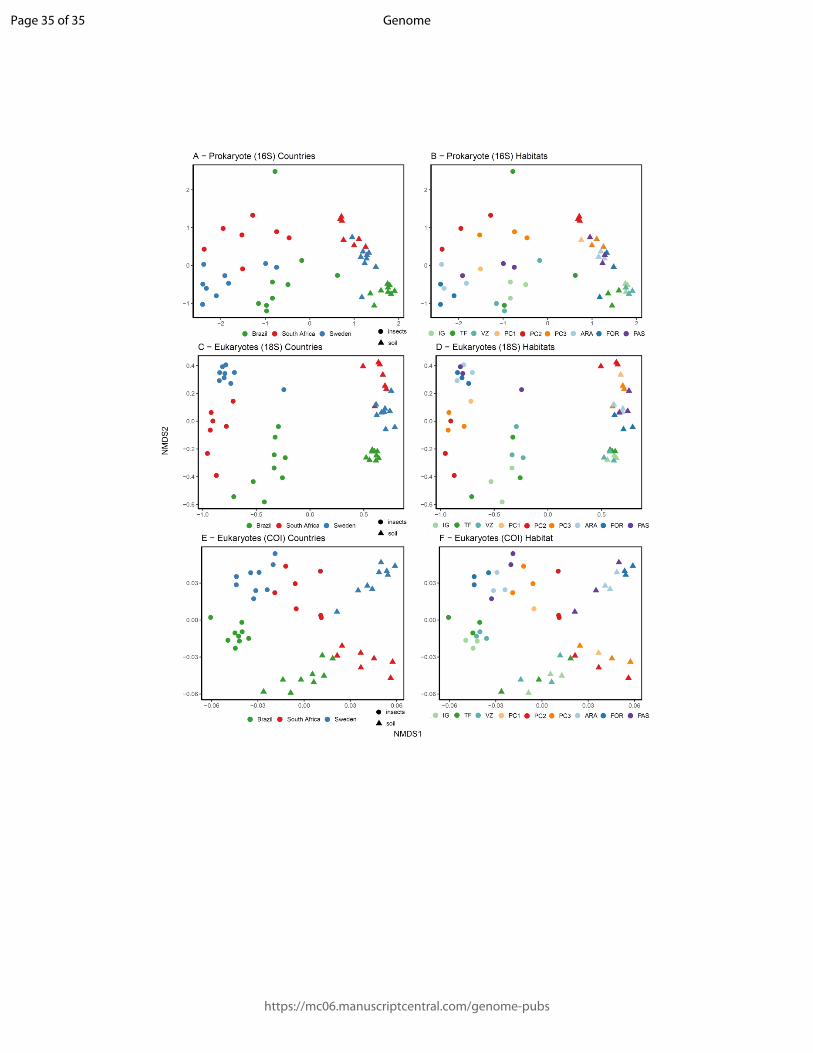
prokaryote (16S), the eukaryotic (18S) and (COI) communities. The results of the NMDS
showed a clear separation in community composition among the plots by country and type of
sample (Fig. 5). The envfit test indicated significant effects of country on the communities of
prokaryotes (R2 = 0. 16, p = 0.007) and eukaryotes based on COI (R2 = 0. 42, p = 0.001), but
not for eukaryotes based on 18S (R2 = 0. 10, p = 0.055). However, for the latter relationship
we note that the p-value of 0.055 is close to the arbitrary alpha value of significance, which
Page 9 of 35
https://mc06.manuscriptcentral.com/genome-pubs
Genome
Draft
indicates at least a tendency of difference among countries. The envfit test also indicated a
significant effect for kind of sample on the prokaryote (R2 = 0. 63, p < 0.001), eukaryote 18S
(R2 = 0.79, p < 0.001) and eukaryote COI (R2 = 0.40, p < 0.001) communities. For habitat
type, the effect was just significant for eukaryotic COI communities (R2 = 0.43, p < 0.001).
Discussion
In this study we show that sequencing both bulk insect samples and soils in a unified
framework (including the gene regions 16S, 18S, and COI) allows the assessment of a large
portion of the prokaryotic and eukaryotic diversity of any location. A previous comparison
between soil and insect samples was done by Yang et al. (2014), however with an exclusive
focus on insects collected in these different samples. Interestingly, between 22% and 40% of
the OTUs recovered in our eukaryotic 18S data were found to stem from other groups than
insects (such as Arachnida, Fungi, and various organisms of the protist type), indicating that
our approach allows the identification of organisms associated with insects and provides a
cost-effective identification tool for multiple taxonomic groups. This result was even stronger
in the COI data, where around 83% of the assigned OTUs belonged to other groups than
insects.
Significant differences in community composition were detected between soil and insect
samples for both the prokaryote and the eukaryote datasets. These results support the use of
bulk insect samples to complement environmental biodiversity assessments based on soils.
Insect trapping is known to primarily recover living organisms, whereas soil samples often
retrieve a significant proportion of dead organisms and legacy DNA (Carini et al. 2016). For
the insect trapping dataset, we know that we targeted living organisms present in the
Page 10 of 35
https://mc06.manuscriptcentral.com/genome-pubs
Genome
Draft
environment at the time of sampling, since adult insects have a short life span, usually around
a few weeks or even days. This offers the possibility of drawing a direct connection between
diversity estimates, time of the year, and even climatic conditions under which those insects
are active. It also minimizes the risk of sequencing organisms no longer living in the locality
but still detectable in the form of dead tissue, which happens in soil samples (Baldrian et al.
2012; Creer et al. 2016).
The non-significant difference among habitat types for both the prokaryote (16S) and
eukaryote (18S) datasets is probably due to the low number of replicates and the high number
of habitat types surveyed. However, the COI data showed a significant difference among
habitat types. This result highlights the usefulness of insect samples in any environment, since
our results portrayed different taxonomic profiles in the insect samples and the corresponding
soil samples across all habitat types surveyed. For insect samples, Sweden registered the
highest number of OTUs for insects (794 [18S] and 176 [COI]) compared to Brazil (561
[18S] and 82 [COI]) and South Africa (405 [18S] and 44 [COI]). This ranking of absolute
numbers is most probably related to the sampling design, since in Sweden the traps were open
for seven days, compared to a single day in Brazil and South Africa for logistic reasons. In
mega-diverse habitats such as Amazonia, a comprehensive long-term insect diversity
sampling may take months or even years and should be carried out with multiple collecting
methods (Gómez et al. 2018; Matos-Maraví et al. 2018). However, in light of logistic and
financial limitations, fast massive sampling such as one week or even one day may allow a
rather substantial biodiversity registration, especially when compared to a one-day traditional
inventory of macro-organisms such as vertebrates or plants.
Universal primers, such as the 18S primers we used, are capable of detecting the majority of
eukaryote organisms. However, the 18S is not variable enough to distinguish all eukaryotes at
Page 11 of 35
https://mc06.manuscriptcentral.com/genome-pubs
Genome
Draft
the species level (Hartmann et al. 2010; Lindahl et al. 2013). The use of other gene regions or
markers might extend the taxonomic groups detected. Suitable additional markers include the
nuclear internal transcribed spacer region (ITS) for fungi (Tedersoo et al. 2014) and plants
(Chen et al. 2010). However, the incomplete nature of sequence databases, combined with the
short length of the regions sequenced, also pose a problem for our COI data, despite its
widespread use in initiatives such as the International Barcode of Life project
(http://ibol.org/). Although we used general primers for metazoans (Hebert et al. 2003), we
still found that around 40% of the OTUs could not be assigned even at the phylum level. On
the other hand, most insects in the COI dataset were identified at least to the family level,
while with the 18S dataset most matchings could be made at the order level (tables S3 – S5).
Using markers with better taxonomic resolution or more specific for target groups, the bulk
insect samples could also be used for monitoring rare or hard-to-sample groups, for instance
mammals (Kocher et al. 2017), or network interactions such as plant-insects (Kergoat et al.
2017) and host-parasite interactions (Toju 2015).
Page 12 of 35
https://mc06.manuscriptcentral.com/genome-pubs
Genome
Draft
Based on our tests, we recommend the use of non-destructive protocols, which allow
subsequent use of the insects and other organisms captured in the ethanol samples for
morphological studies, vouchering in museums, photographic documentation, and re-
sequencing for other genetic markers. Given that the vast majority of extant insects remains to
be described (Stork 2018), it is promising that non-destructive DNA extraction protocols
allow molecular studies from bulk insect samples. Any interesting insect lineages recovered
in the DNA sequencing stage can then be tracked back to the bulk sample where it comes
from, located manually, and then studied further using traditional morphological means, with
only small losses (e. g., some color fading and increased fragility of specimens). This
possibility also protects the species discovery potential of metabarcoding efforts (e. g. Nilsson
et al. 2016).
Unified protocol. Based on the results obtained and our experience in field over many years
and environments, we suggest a general sampling protocol for any student, researcher, or
practitioner aiming at assessing diversity across locations (Appendix 1, Supplementary
material). We recommend the sampling of insects using Malaise traps for at least a week for
rapid biodiversity assessment. Studies seeking to do a taxonomic survey of one particular
locality should take seasonal variations into account, ideally by sampling a few times per
year. We also recommend the use of non-destructive DNA extraction protocols to allow
complementary taxonomic studies and documentation, such as the one used here. Traditional
taxonomic assessments remain crucial for the identification and description of new species,
but it is clear from the present study that both techniques – molecular and morphological – are
complementary and should be combined in future efforts, whenever possible.
Page 13 of 35
https://mc06.manuscriptcentral.com/genome-pubs
Genome
Draft
Conclusions
In this study we show the value of collecting and sequencing bulk insect samples to
complement soil samples in rapid biodiversity assessments, thereby capturing a much larger
proportion of a site’s prokaryote and eukaryote diversity than traditional methods during the
same time allocation. Another important advantage of the use of bulk insect samples is that it
can be used in a wide range of environments, from hot and humid rainforests, to species-rich
Mediterranean meadows, and natural and anthropogenic habitats in the temporal zone. The
use of non-destructive DNA extraction also allows complementary taxonomic studies,
speeding up the discovery of new species (e. g. Gómez et al. 2018). Adopting a massive and
standardised sampling scheme would allow fast and cost-effective estimations of global
biodiversity.
Page 14 of 35
https://mc06.manuscriptcentral.com/genome-pubs
Genome
Draft
Acknowledgements
We thank Anna Ansebo, Sven Toresson, and Ylva Heed for laboratory and administrative
assistance, Mats Töpel for help with bioinformatics, Hans ter Steege for advice on sampling
localities and experimental design, and members of our research group for discussions and
suggestions. We acknowledge Hans ter Steege for valuable comments in the manuscript. We
also thank for the constructive comments from three anonymous reviewers and the editors.
Computational analyses were run at the University of Gothenburg bioinformatics cluster
(http://albiorix.bioenv.gu.se/).
Funding – Funding for this study was primarily provided by CNPq (Conselho Nacional de
Desenvolvimento Científico e Tecnológico - Brazil: 249064/2013-8) and the Swedish
Research Council (B0569601). AA is further supported by the Swedish Foundation for
Strategic Research, a Wallenberg Academy Fellowship, the Faculty of Sciences at the
University of Gothenburg, the Wenner-Gren Foundations, and the David Rockefeller Center
for Latin American Studies at Harvard University.
Data Avalailiability and Accessibility - Raw data with the DNA sequences are under
Bioproject 410648; BioSample accession SAMN09081757 - SAMN09081906; NCBI SRA:
PRJNA464362. OTUs tables and R-script used in the analysis are in the Supplementary
Material.
Conflicts of interest – The authors declare that they have no conflicts of interest.
Permit(s) – Permits for this research were provided by the Brazilian authorities ICMBio
(register number 48185-2) and IBAMA (register number 127341), and by the South Africa
authority CapeNature (register number 0056-AAA041-00150).
Page 15 of 35
https://mc06.manuscriptcentral.com/genome-pubs
Genome
Draft
References:
Aljanabi S.M, and Martinez I. 1997. Universal and rapid salt-extraction of high quality
genomic DNA for PCR-based techniques. Nucleic Acids Res. 1;25(22):4692-3. doi:
10.1093/nar/25.22.4692.
Altschul S.F., Madden T.L., Schäffer A.A., Zhang J., Zhang Z., Miller W., Lipman D.J. 1997.
Gapped BLAST and PSI-BLAST: a new generation of protein database search
programs. Nucleic Acids Res. 1997; 25(17), pp.3389-3402. doi: 10.1093/nar/25.17.3389.
Baldrian P., Kolařík M., Štursová M., Kopecký J., Valášková V., and Větrovský T., et al.
2012. Active and total microbial communities in forest soil are largely different and highly
stratified during decomposition. ISME J. 2012; 6(2):248. doi: 10.1038/ismej.2011.95.
Bascompte J., Jordano P., Melián C.J., and Olesen J.M. 2003. The nested assembly of plant–
animal mutualistic networks. PNAS. 5;100(16):9383-7. doi: 10.1073/pnas.1633576100.
Benson D.A., Karsch-Mizrachi I., Lipman D.J., Ostell J., and Wheeler D.L. 2005
GenBank. Nucleic Acids Res. 33(suppl_1):D34-8. doi: 10.1093/nar/gki063.
Bush A., Sollmann R., Wilting A., Bohmann K., Cole B., and Balzter H., et al. 2017.
Connecting Earth observation to high-throughput biodiversity data. Nat Ecol
Evol. 1(7):0176. doi: 10.1038/s41559-017-0176.
Calvignac‐Spencer S., Merkel K., Kutzner N., Kühl H., Boesch C., and Kappeler P.M., et al.
2013. Carrion fly‐derived DNA as a tool for comprehensive and cost‐effective assessment
of mammalian biodiversity. Mol Ecol. 22(4):915-24. doi: 10.1111/mec.12183.
Page 16 of 35
https://mc06.manuscriptcentral.com/genome-pubs
Genome

Draft
Camacho C., Coulouris G., Avagyan V., Ma N., Papadopoulos J., and Bealer K., et al. 2009.
BLAST+: architecture and applications. BMC bioinformatics. 2009;10(1):421. doi:
10.1186/1471-2105-10-421.
Campbell G., Kuehl H., Diarrassouba A., N'Goran P.K., and Boesch C. 2011. Long-term
research sites as refugia for threatened and over-harvested species. Biol Lett. 23;7(5):723-
6. doi: 10.1098/rsbl.2011.0155.
Carini P., Marsden P.J., Leff J.W., Morgan E.E., Strickland M.S., and Fierer N. 2017. Relic
DNA is abundant in soil and obscures estimates of soil microbial diversity. Nat Microbiol.
2(3):16242. doi: 10.1038/nmicrobiol.2016.242.
Chen S., Yao H., Han J., Liu C., Song J., and Shi L., et al. 2010. Validation of the ITS2
region as a novel DNA barcode for identifying medicinal plant species. PloS one.
7;5(1):e8613. doi: 10.1371/journal.pone.0008613.
Creer S., Deiner K., Frey S., Porazinska D., Taberlet P., and Thomas W.K., et al. 2016. The
ecologist's field guide to sequence‐based identification of biodiversity. Methods Ecol
Evol. 1;7(9):1008-18. doi: 10.1111/2041-210X.12574.
Edgar R.C. 2013. UPARSE: highly accurate OTU sequences from microbial amplicon reads.
Nature methods. 18;10(10):996. doi: 10.1038/nmeth.2604.
Folmer O., Black M., Hoeh W., Lutz R., and Vrijenhoek R. 1994. DNA primers for
amplification of mitochondrial cytochrome c oxidase subunit I from diverse metazoan
invertebrates. Mol. Mar. Biol. Biotechnol. 3:294-299.
Gibson J., Shokralla S., Porter T.M., King I., van Konynenburg S., and Janzen D.H., et al.
2014. Simultaneous assessment of the macrobiome and microbiome in a bulk sample of
Page 17 of 35
https://mc06.manuscriptcentral.com/genome-pubs
Genome
Draft
tropical arthropods through DNA metasystematics. PNAS. 3;111(22):8007-12. doi:
10.1073/pnas.1406468111.
Gómez I.C., Sääksjärvi I.E., Mayhew P.J., Pollet M., Rey del Castillo C., and Nieves‐Aldrey
J.L., et al. 2018. Variation in the species richness of parasitoid wasps (Ichneumonidae:
Pimplinae and Rhyssinae) across sites on different continents. Insect Conserv Diver.
11(3):305-16. doi: 10.1111/icad.12281.
Guardiola M., Uriz M.J., Taberlet P., Coissac E., Wangensteen O.S., and Turon X. 2015.
Deep-sea, deep-sequencing: metabarcoding extracellular DNA from sediments of marine
canyons. PLoS One. 5;10(10):e0139633. doi: 10.1371/journal.pone.0139633.
Hartmann M., Howes C.G., Abarenkov K., Mohn W.W., and Nilsson R.H. 2010. V-Xtractor:
an open-source, high-throughput software tool to identify and extract hypervariable regions
of small subunit (16 S/18 S) ribosomal RNA gene sequences. J Microbiol Methods.
1;83(2):250-3. doi: 10.1016/j.mimet.2010.08.008.
Hebert P.D., Cywinska A., and Ball S.L. 2004. Biological identifications through DNA
barcodes. Proc R Soc Lond [Biol]. 7;270(1512):313-21. doi: 10.1098/rspb.2002.2218.
Kergoat G.J., Meseguer A.S., and Jousselin E. 2017. Evolution of Plant–Insect Interactions:
Insights From Macroevolutionary Approaches in Plants and Herbivorous Insects. In -
Advances in Botanical Research. Academic Press.1 (Vol. 81, pp. 25-53).
Klindworth A., Pruesse E., Schweer T., Peplies J., Quast C., and Horn M., et al. 2013.
Evaluation of general 16S ribosomal RNA gene PCR primers for classical and next-
generation sequencing-based diversity studies. Nucleic Acids Res. 1;41(1):e1-. doi:
10.1093/nar/gks808.
Page 18 of 35
https://mc06.manuscriptcentral.com/genome-pubs
Genome

Draft
Kocher A., Thoisy B., Catzeflis F., Huguin M., Valière S., and Zinger L., et al. 2017.
Evaluation of short mitochondrial metabarcodes for the identification of Amazonian
mammals. Methods Ecol Evol. 1;8(10):1276-83. doi: 10.1111/2041-210X.12729.
Legendre P., and Legendre L. 1998. Numerical ecology: second English edition.
Developments in environmental modelling. p. 20.
Leray M., Yang J.Y., Meyer C.P., Mills S.C., Agudelo N., and Ranwez V., et al. 2013. A new
versatile primer set targeting a short fragment of the mitochondrial COI region for
metabarcoding metazoan diversity: application for characterizing coral reef fish gut
contents. Front Zool. 10(1):34. doi: 10.1186/1742-9994-10-34.
Lindahl B.D., Nilsson R.H., Tedersoo L., Abarenkov K., Carlsen T., and Kjøller R., et al.
2013. Fungal community analysis by high‐throughput sequencing of amplified markers–a
user's guide. New Phytol. 1;199(1):288-99. doi: 10.1111/nph.12243.
Liu S., Li Y., Lu J., Su X., Tang M., and Zhang R., et al. 2013. SOAPBarcode: revealing
arthropod biodiversity through assembly of Illumina shotgun sequences of PCR amplicons.
Methods Ecol Evol. 4(12):1142-50. doi: 0.1111/2041-210X.12120.
Lugg W.H., Griffiths J., van Rooyen A.R., Weeks A.R., and Tingley R. 2018. Optimal
survey designs for environmental DNA sampling. Methods Ecol Evol. 9(4):1049-59. doi:
10.1111/2041-210X.12951.
Matos-Maraví P., Duarte Ritter C., Barnes C.J., Nielsen M., Olsson U., and Wahlberg N., et
al. 2018. Biodiversity seen through the perspective of insects: 10 simple rules on
methodological choices, common challenges, and experimental design for genomic studies.
PeerJ Preprints. 11;6:e26661v1. doi: 10.7287/peerj.preprints.26661v1.
Page 19 of 35
https://mc06.manuscriptcentral.com/genome-pubs
Genome
Draft
Miller K.E., Hopkins K., Inward D.J., and Vogler A.P. 2016. Metabarcoding of fungal
communities associated with bark beetles. Ecol Evol. 6(6):1590-600. doi:
10.1002/ece3.1925.
Nilsson R.H., Wurzbacher C., Bahram M., Coimbra V.R., Larsson E., and Tedersoo L., et al.
2016. Top 50 most wanted fungi. MycoKeys. 12: 29–40. doi: 10.3897/mycokeys.12.7553.
Oksanen J., Kindt R., Legendre P., O’Hara B., Stevens M.H., and Oksanen MJ. 2007. The
Vegan Package — Community Ecology Package. R package. version 2.0-9. Available
from http://cran.r-project.org/, http://r-forge.r-project.org/projects/vegan/ [accessed 15
February 2017].
R Development Core Team. R: a language environment for statistical computing. 2017.
Vienna: R Foundation for Statistical Computing. Available from http://www.r- project.org/
[accessed 15 February 2017].
Ritter C.D., Zizka A., Barnes C., Nilsson R.H., Roger F., and Antonelli A. 2018. Locality or
habitat? Exploring predictors of biodiversity in Amazonia. Ecography. doi:
10.1111/ecog.03833.
Schnell I.B., Sollmann R., Calvignac-Spencer S., Siddall M.E., Douglas W.Y., and Wilting
A., et al. 2015. iDNA from terrestrial haematophagous leeches as a wildlife surveying and
monitoring tool–prospects, pitfalls and avenues to be developed. Front Zool. 12(1):24.
doi: 10.1186/s12983-015-0115-z.
Stork N.E., McBroom J., Gely C., and Hamilton A.J. 2015. New approaches narrow global
species estimates for beetles, insects, and terrestrial arthropods. PNAS. 16;112(24):7519-
23. doi: 10.1073/pnas.1502408112.
Page 20 of 35
https://mc06.manuscriptcentral.com/genome-pubs
Genome

Draft
Stork N.E. 2018. How many species of insects and other terrestrial arthropods are there on
Earth?. Annu Revi Entomol. 7;63:31-45. doi: 10. 1146/annurev-ento-020117-043348.
Taberlet P., Coissac E., Pompanon F., Brochmann C., and Willerslev E. 2012a. Towards
next‐generation biodiversity assessment using DNA metabarcoding. Mol Ecol.
21(8):2045-50. doi: 10.1111/j.1365-294X.2012.05470.x.
Taberlet P., Coissac E., Hajibabaei M., and Rieseberg L.H. 2012b. Environmental DNA. Mol
Ecol. 21(8):1789-93. doi: 10.1111/j.1365-294X.2012.05542.x.
Tedersoo L., Bahram M., Põlme S., Kõljalg U., Yorou N.S., and Wijesundera R., et al. 2014.
Global diversity and geography of soil fungi. Science. 28;346(6213):1256688. doi:
10.1126/science.1256688.
Toju H. 2015. High-throughput DNA barcoding for ecological network studies. Popul Ecol.
1;57(1):37-51. doi: 10.1007/s10144-014-0472-z
Yang C., Wang X., Miller J.A., de Blécourt M., Ji Y., and Yang C., et al. 2014. Using
metabarcoding to ask if easily collected soil and leaf-litter samples can be used as a general
biodiversity indicator. Ecol Indic. 1;46:379-89. doi: 10.1016/j.ecolind.2014.06.028.
Zinger L., Taberlet P., Schimann H., Bonin A., Boyer F., and De Barba M., et al. 2017. Soil
community assembly varies across body sizes in a tropical forest. bioRxiv. 1:154278. doi:
10.1101/154278.
Page 21 of 35
https://mc06.manuscriptcentral.com/genome-pubs
Genome

Draft
1 Tables:
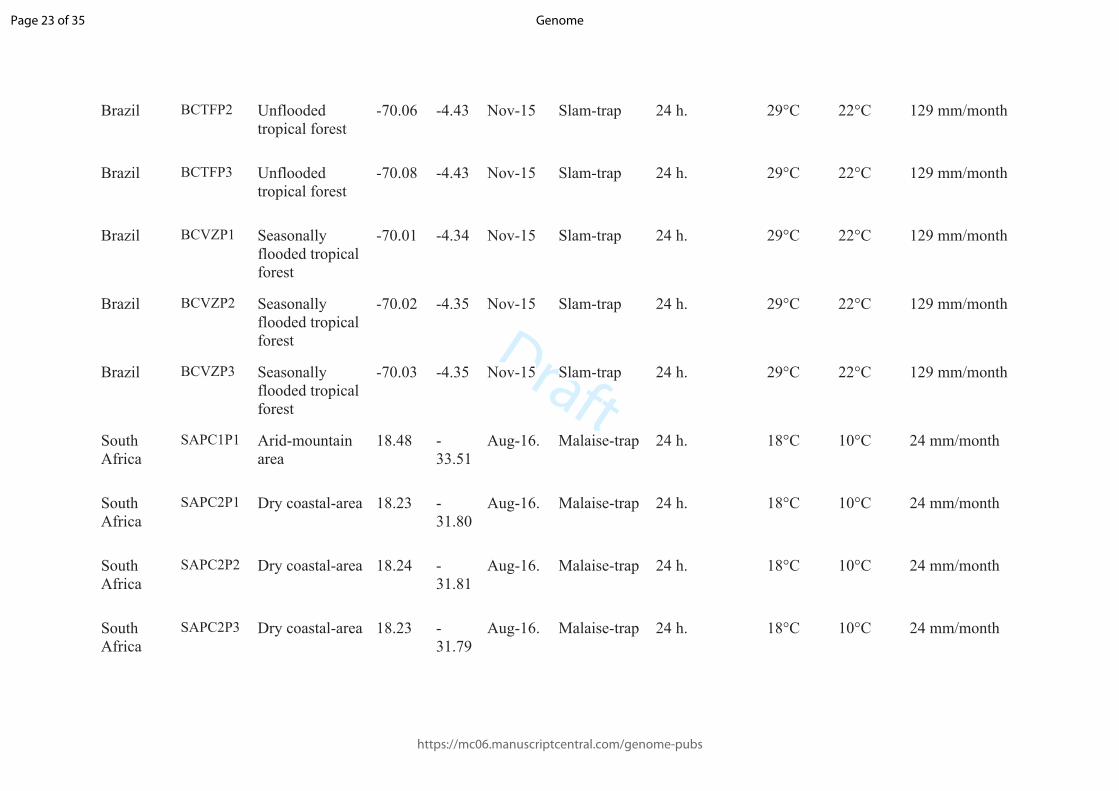
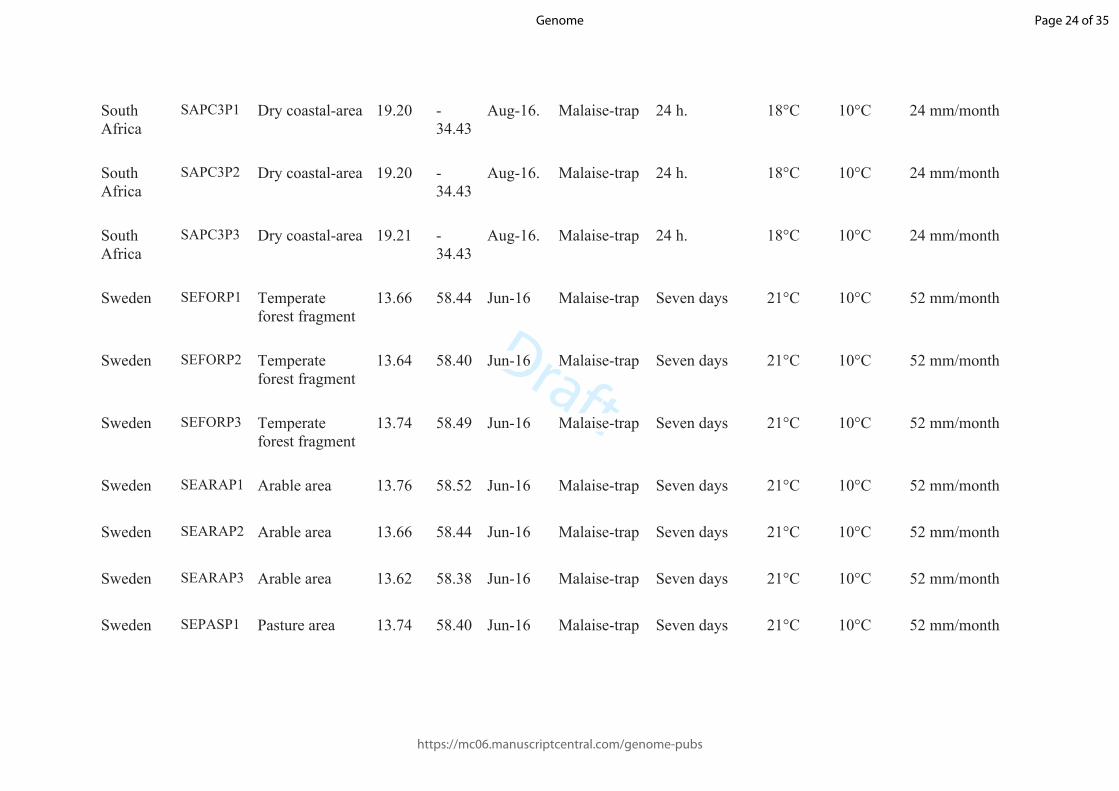
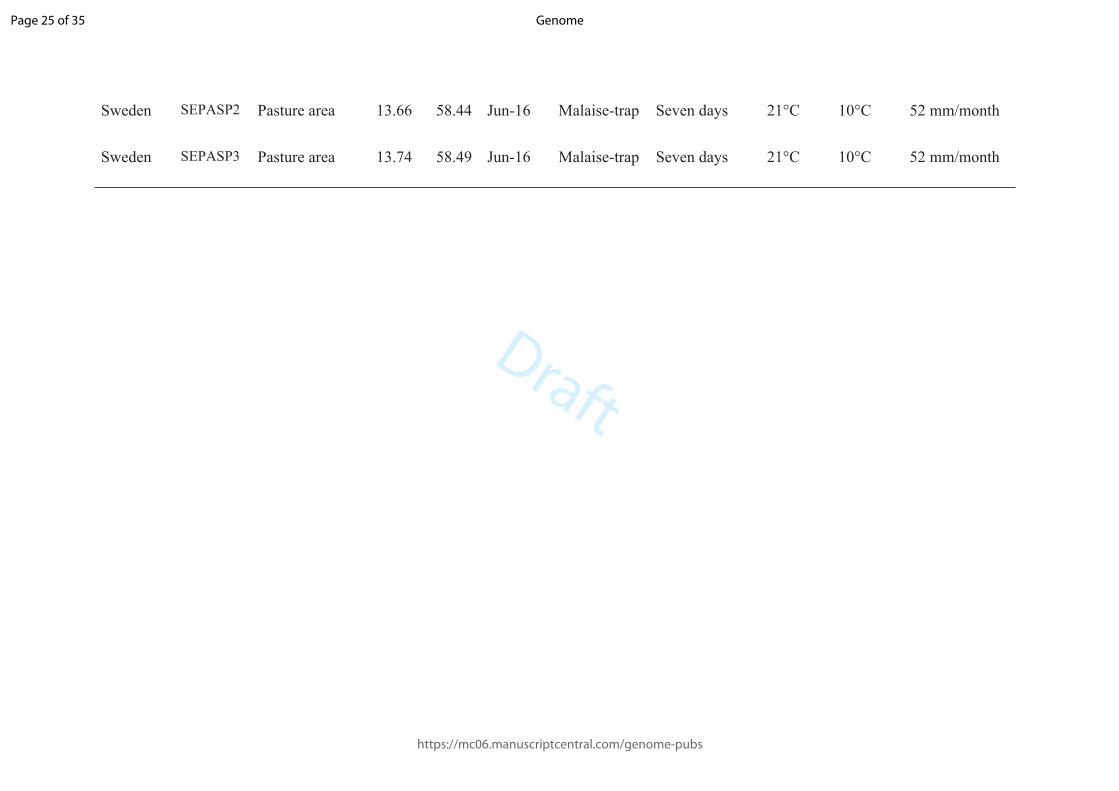
2 Table 1: Description of the sampling localities. Country, type of environment (Vegetation), longitude, latitude, date of sampling (Date), kind of
3 trap used to collect insects, period of time the traps were opened (Time of sampling), highest and coldest average temperature, and precipitation
4 average of the sampled month (extracted from https://pt.weatherspark.com/) for each plot.
5
Country Locality Vegetation Long Lat Date Trap Time of sampling
Average temp. Average prec.
Highest Coldest
Brazil BC IG P1 Seasonally flooded tropical forest
-70.01 -4.33 Nov-15 Slam-trap 24 h. 29°C 22°C 129 mm/month
Brazil BCIGP2 Seasonally flooded tropical forest
-70.00 -4.32 Nov-15 Slam-trap 24 h. 29°C 22°C 129 mm/month
Brazil BCIGP3 Seasonally flooded tropical forest
-70.00 -4.32 Nov-15 Slam-trap 24 h. 29°C 22°C 129 mm/month
Brazil BCTFP1 Unflooded tropical forest
-70.07 -4.43 Nov-15 Slam-trap 24 h. 29°C 22°C 129 mm/month
Page 22 of 35
https://mc06.manuscriptcentral.com/genome-pubs
Genome
Draft
Brazil BCTFP2 Unflooded tropical forest
-70.06 -4.43 Nov-15 Slam-trap 24 h. 29°C 22°C 129 mm/month
Brazil BCTFP3 Unflooded tropical forest
-70.08 -4.43 Nov-15 Slam-trap 24 h. 29°C 22°C 129 mm/month
Brazil BCVZP1 Seasonally flooded tropical forest
-70.01 -4.34 Nov-15 Slam-trap 24 h. 29°C 22°C 129 mm/month
Brazil BCVZP2 Seasonally flooded tropical forest
-70.02 -4.35 Nov-15 Slam-trap 24 h. 29°C 22°C 129 mm/month
Brazil BCVZP3 Seasonally flooded tropical forest
-70.03 -4.35 Nov-15 Slam-trap 24 h. 29°C 22°C 129 mm/month
South Africa
SAPC1P1 Arid-mountain area
18.48 -33.51
Aug-16. Malaise-trap 24 h. 18°C 10°C 24 mm/month
South Africa
SAPC2P1 Dry coastal-area 18.23 -31.80
Aug-16. Malaise-trap 24 h. 18°C 10°C 24 mm/month
South Africa
SAPC2P2 Dry coastal-area 18.24 -31.81
Aug-16. Malaise-trap 24 h. 18°C 10°C 24 mm/month
South Africa
SAPC2P3 Dry coastal-area 18.23 -31.79
Aug-16. Malaise-trap 24 h. 18°C 10°C 24 mm/month
Page 23 of 35
https://mc06.manuscriptcentral.com/genome-pubs
Genome
Draft
South Africa
SAPC3P1 Dry coastal-area 19.20 -34.43
Aug-16. Malaise-trap 24 h. 18°C 10°C 24 mm/month
South Africa
SAPC3P2 Dry coastal-area 19.20 -34.43
Aug-16. Malaise-trap 24 h. 18°C 10°C 24 mm/month
South Africa
SAPC3P3 Dry coastal-area 19.21 -34.43
Aug-16. Malaise-trap 24 h. 18°C 10°C 24 mm/month
Sweden SEFORP1 Temperate forest fragment
13.66 58.44 Jun-16 Malaise-trap Seven days 21°C 10°C 52 mm/month
Sweden SEFORP2 Temperate forest fragment
13.64 58.40 Jun-16 Malaise-trap Seven days 21°C 10°C 52 mm/month
Sweden SEFORP3 Temperate forest fragment
13.74 58.49 Jun-16 Malaise-trap Seven days 21°C 10°C 52 mm/month
Sweden SEARAP1 Arable area 13.76 58.52 Jun-16 Malaise-trap Seven days 21°C 10°C 52 mm/month
Sweden SEARAP2 Arable area 13.66 58.44 Jun-16 Malaise-trap Seven days 21°C 10°C 52 mm/month
Sweden SEARAP3 Arable area 13.62 58.38 Jun-16 Malaise-trap Seven days 21°C 10°C 52 mm/month
Sweden SEPASP1 Pasture area 13.74 58.40 Jun-16 Malaise-trap Seven days 21°C 10°C 52 mm/month
Page 24 of 35
https://mc06.manuscriptcentral.com/genome-pubs
Genome
Draft
Sweden SEPASP2 Pasture area 13.66 58.44 Jun-16 Malaise-trap Seven days 21°C 10°C 52 mm/month
Sweden SEPASP3 Pasture area 13.74 58.49 Jun-16 Malaise-trap Seven days 21°C 10°C 52 mm/month
Page 25 of 35
https://mc06.manuscriptcentral.com/genome-pubs
Genome
Draft
5
Table 2: Chao 1 estimates per plot. Observed richness (OR), Chao1 estimates, and standard error (SE) per plot for each marker: prokaryotes (16S) and eukaryotes (18S and COI), and for each kind of sample (Bulk insect samples and soil samples).
16S 18S COI Soil Insects Soil Insects Soil Insects
Plot OR Chao1 SE OR Chao1 SE OR Chao1 SE OR Chao1 SE OR Chao1 SE OR Chao1 SESBCIGP1 1488 1768 41 558 632 22 1156 1328 32 200 238 15 164 243 34 137 143 5SBCIGP2 1594 1973 51 420 469 19 1066 1204 26 172 213 17 180 239 29 161 169 6SBCIGP3 1576 1926 45 655 720 21 1048 1142 21 174 221 18 235 290 27 125 129 4SBCTFP1 1472 1740 37 1357 1633 38 1041 1191 28 129 156 13 253 290 19 109 119 10SBCTFP2 1457 1684 33 585 636 19 1087 1231 27 270 305 13 194 225 17 116 119 4SBCTFP3 1187 1445 39 509 548 17 1193 1281 18 232 281 16 209 240 15 171 184 10SBCVZP1 1428 1739 43 422 476 24 857 982 26 207 242 14 145 183 19 134 142 8SBCVZP2 1598 1945 46 939 1038 27 1083 1236 29 274 304 13 154 184 16 114 122 5SBCVZP3 1441 1763 44 413 444 14 1056 1190 26 245 322 24 146 188 21 101 119 16SSAPC1P1 2181 2820 67 413 431 9 1170 1233 16 209 252 17 431 436 4 155 164 9SSAPC2P1 2401 2690 34 692 739 18 945 1042 26 196 207 6 475 496 12 64 97 26SSAPC2P2 2038 2399 43 323 352 17 1085 1154 18 64 75 9 631 644 8 48 48 0SSAPC2P3 2251 2571 39 213 263 21 993 1027 11 107 138 15 527 537 6 91 120 18SSAPC3P1 3821 4333 47 817 855 14 1710 1785 16 96 130 17 815 832 8 122 130 6SSAPC3P2 3550 4158 54 578 608 12 1686 1758 16 100 125 13 710 733 11 68 73 4SSAPC3P3 2847 3336 48 416 642 121 1060 1144 21 129 154 13 491 520 13 124 125 2SSEFOR1 1320 1554 34 349 369 11 632 706 18 341 439 28 338 352 7 393 403 5SSEFOR2 2475 2839 39 241 252 7 883 1004 23 244 309 25 477 495 10 398 424 11SSEFOR3 3605 4137 49 295 317 10 773 948 32 258 303 18 641 674 15 424 448 10SSEARA1 3341 3945 54 349 362 7 1132 1225 20 490 596 29 774 796 9 681 733 15SSEARA2 3013 3544 54 492 519 12 1140 1238 21 260 333 27 455 470 8 614 653 14SSEARA3 3266 3829 53 402 463 22 1100 1204 21 481 525 14 503 546 18 823 871 14SSEPAS1 3179 3648 45 436 483 18 1258 1309 13 384 434 16 660 667 5 587 618 11SSEPAS2 3217 3773 53 616 667 15 1057 1124 16 251 312 21 310 336 15 257 273 8
Page 26 of 35
https://mc06.manuscriptcentral.com/genome-pubs
Genome

Draft
6
SSEPAS3 2933 3552 57 661 842 35 1367 1462 19 161 254 35 491 551 26 58 59 1
Page 27 of 35
https://mc06.manuscriptcentral.com/genome-pubs
Genome
Draft
7
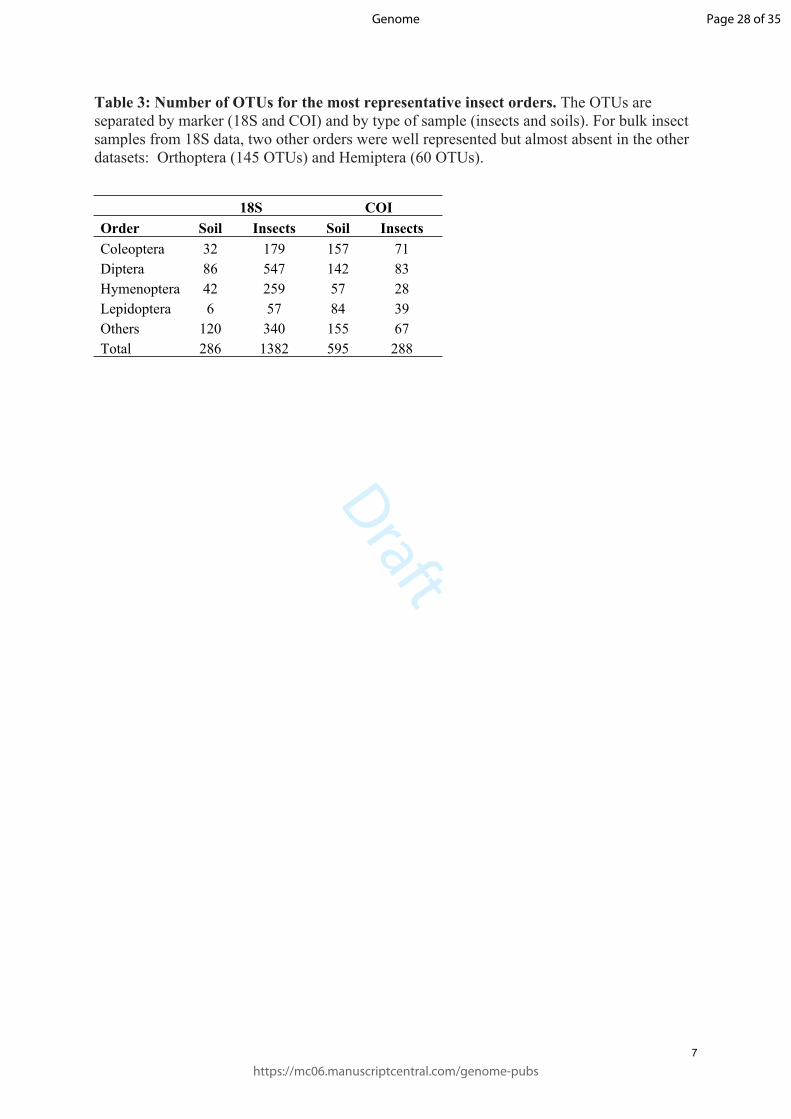
Table 3: Number of OTUs for the most representative insect orders. The OTUs are separated by marker (18S and COI) and by type of sample (insects and soils). For bulk insect samples from 18S data, two other orders were well represented but almost absent in the other datasets: Orthoptera (145 OTUs) and Hemiptera (60 OTUs).
18S COIOrder Soil Insects Soil InsectsColeoptera 32 179 157 71Diptera 86 547 142 83Hymenoptera 42 259 57 28Lepidoptera 6 57 84 39Others 120 340 155 67Total 286 1382 595 288
Page 28 of 35
https://mc06.manuscriptcentral.com/genome-pubs
Genome
Draft
8
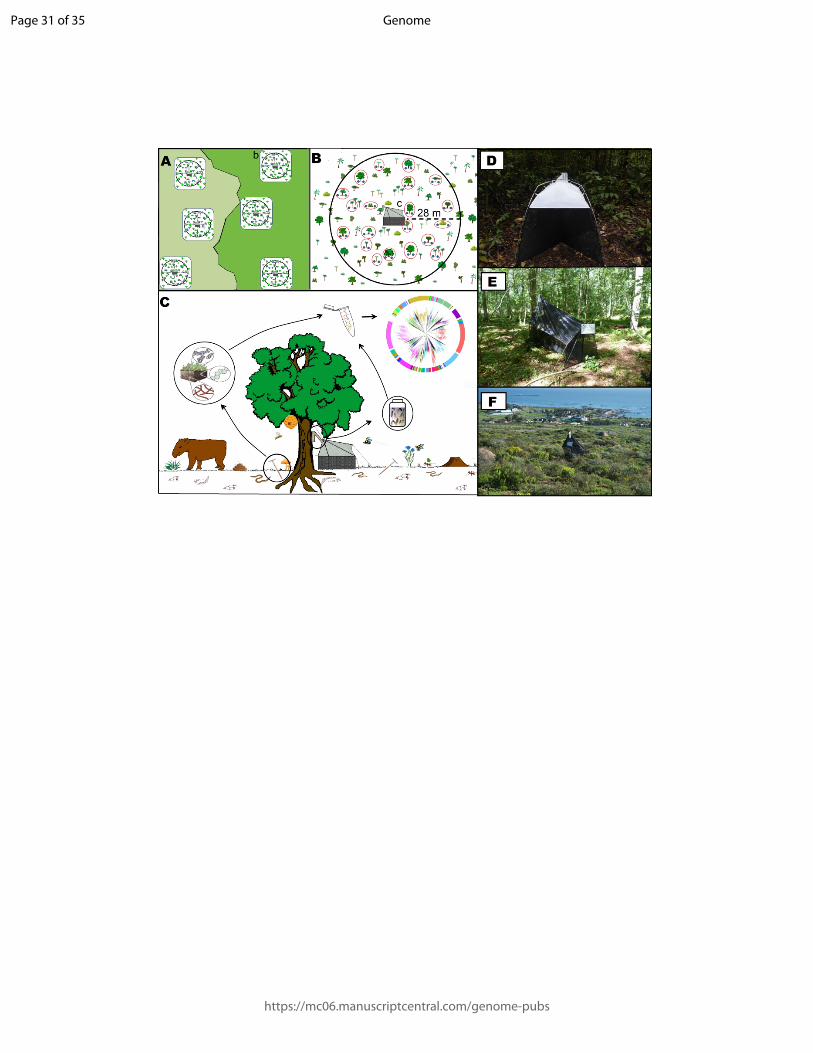
Figure 1 Sampling design within a specific locality. (A) Location of plots in one locality:
three plots are set up in each major vegetation type present (illustrated here by different
shades of green), (B) Scheme for one plot, showing the Malaise or Slam trap in the middle,
and twenty trees arbitrarily chosen for soil sampling within a 28-m radius (in red circles), (C)
The Malaise or Slam trap provides insects and the plants consumed by them, as well as any
parasites or parasitoids in their bodies, while the soil samples provide eDNA for a large
proportion of the habitat’s total biodiversity (e. g. soil organisms, roots, leaves, dead animals,
and faeces). Together, this framework covers a large proportion of the biodiversity in the plot,
(D) Photo of a Slam trap used in Brazil, (E) Photo of a Malaise trap in a forest fragment in
Sweden, (F) the Malaise trap used in the coastal area of South Africa.
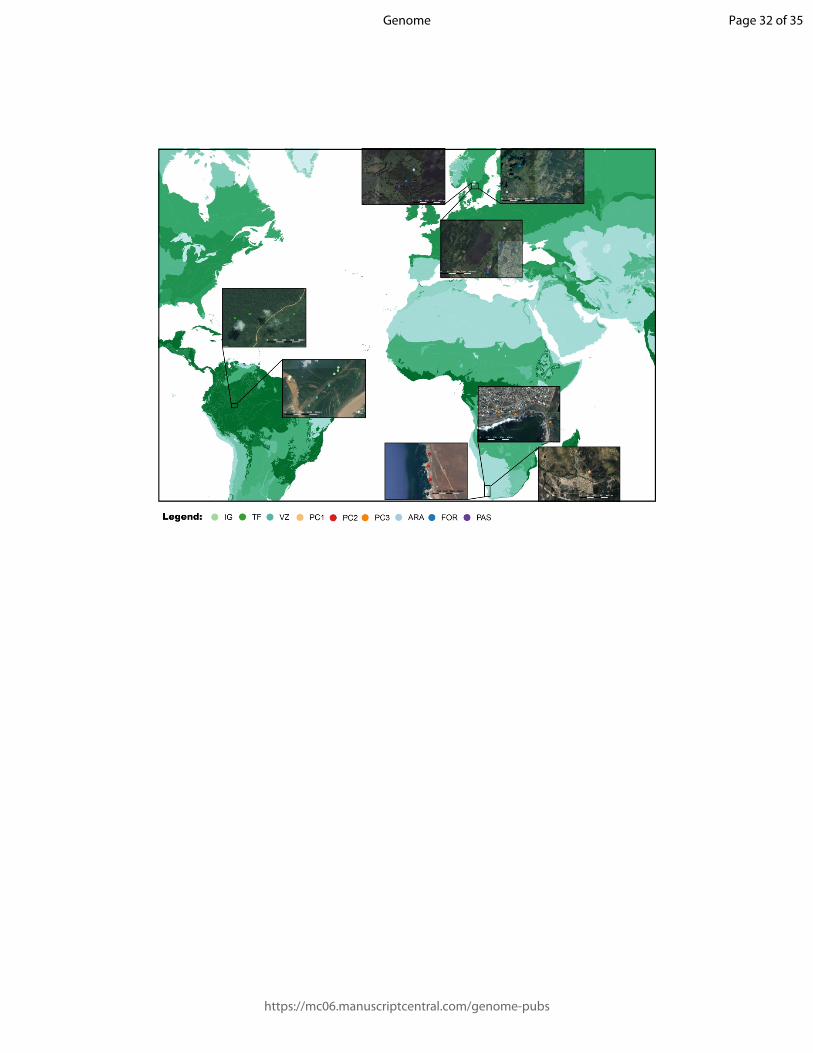
Figure 2. Map of sampling localities. The sampling localities used for this study cover a wide
geographical range comprising the Amazonian rainforest in Brazil, the western coast of South
Africa, and central-south Sweden. In each locality, different environments were sampled to
test the usefulness of our methodology in a wide range of habitats. Habitats are: TF = terra-
firmes, VZ = várzeas, and IG = igapós in Brazil, PC1, PC2, and PC2 in South Africa, and
ARA = arable farms, FOR = forest fragments, and PAS = pasture farms in Sweden. The green
gradient represent biomes described in Olson et al. (2001), ranging from densely forested
areas (dark green) to open areas (light green).
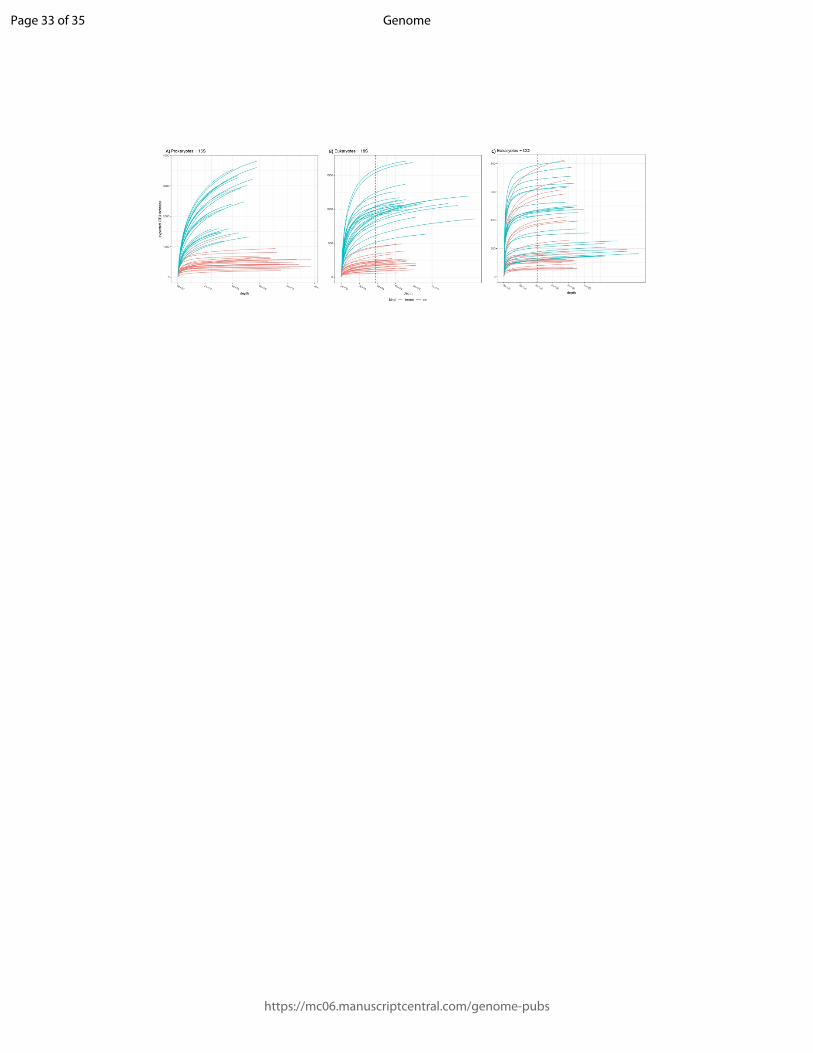
Figure 3: Rarefaction curves. Rarefaction by sample for the A) the prokaryote dataset (16S),
B) the eukaryote dataset for 18S, and C) the eukaryote dataset for COI. The red lines show the
minimum number of reads. The 18S marker data are more variable in read number than are
the 16S and COI data. In the COI data, all curves tend towards an asymptote.
Page 29 of 35
https://mc06.manuscriptcentral.com/genome-pubs
Genome
Draft
9
Figure 4: Taxonomic composition of the OTU communities. These bar plots show the fraction
of OTUs by taxonomic groups for each country for soil (black bars) and insect (gray bars)
samples. There is no clear taxonomic variation among groups for country, but a clear
difference by kind of samples, except for the COI datasets.
Figure 5: Community structure related to country and habitat type. Visualization of non-
metric multidimensional scaling (NMDS) for 16S and 18S OTU communities. A) prokaryote
(16S) colored by country, B) eukaryote (18S) OTU colored by country, C) prokaryote (16S)
colored by country, and D) eukaryote (18S) colored by habitat type. Triangles represent soil
samples and circles represent insect samples. Habitat abbreviations as in Fig. 2. These results
show that the kind of sample (soil or insects) is the main explanatory factor underpinning
similarity among localities. The clustering of communities per country is stronger than per
habitat type.
Page 30 of 35
https://mc06.manuscriptcentral.com/genome-pubs
Genome
Draft
Page 31 of 35
https://mc06.manuscriptcentral.com/genome-pubs
Genome
Draft
Page 32 of 35
https://mc06.manuscriptcentral.com/genome-pubs
Genome
Draft
Page 33 of 35
https://mc06.manuscriptcentral.com/genome-pubs
Genome
Draft
Page 34 of 35
https://mc06.manuscriptcentral.com/genome-pubs
Genome
Draft
Page 35 of 35
https://mc06.manuscriptcentral.com/genome-pubs
Genome