draft - university of toronto t-space · soil pipe interaction, ... draft 2 abstract the...
TRANSCRIPT

Draft
Soil Restraints on Buried Pipelines Subjected to Reverse
Fault Displacement
Journal: Canadian Geotechnical Journal
Manuscript ID cgj-2016-0564.R1
Manuscript Type: Article
Date Submitted by the Author: 16-Feb-2017
Complete List of Authors: Wijewickreme, Dharma; University of British Columbia Monroy, Manuel; Golder Associates Ltd. Honegger, Douglas; D.G. Honegger Consulting, Nyman, Douglas; D J Nyman & Associates
Keyword: Soil pipe interaction, Reverse thrust fault crossings, Earthquake-induced ground movements, Buried steel pipelines, Soil restraints on pipes
https://mc06.manuscriptcentral.com/cgj-pubs
Canadian Geotechnical Journal
Draft
1
Soil Restraints on Buried Pipelines Subjected to Reverse Fault Displacement
By
Dharma Wijewickreme, Ph.D., P.Eng.
Professor of Civil Engineering, University of British Columbia
Vancouver, B.C., Canada, V6T 1Z4
Tel.: +1 604-822-5112
Fax: +1 604-822-6901
E-mail: [email protected]
Manuel Monroy, Ph.D., P.Eng.
Geotechnical Engineer
Golder Associates Ltd.
200 - 2920 Virtual Way
Vancouver, British Columbia
Canada V5M 0C4
Tel.: +1 604 296 4200
E-mail: [email protected]
Douglas G. Honegger,
President
D.G. Honegger Consulting
2690 Shetland Place
Arroyo Grande, CA 93420, U.S.A.
Tel.: +1-805-473-0856
E-mail: [email protected]
Douglas J Nyman, Ph.D., P.E.
Principal Engineer
D J Nyman & Associates
350 Horseshoe Ridge S
Kerrville, TX 78028, U.S.A.
Tel: +1-830-890-5266
E-mail: [email protected]
Manuscript Submitted for
Possible Publication as an Article
in the Canadian Geotechnical Journal
May 02, 2017
Page 1 of 33
https://mc06.manuscriptcentral.com/cgj-pubs
Canadian Geotechnical Journal
Draft
2
Abstract
The interaction between a buried pipeline and surrounding soil during large ground displacements is
typically simulated using numerical non-linear soil restraint springs aligned in three orthogonal directions
with respect to the longitudinal axis of the pipeline. There are only very limited experimental data
available to characterize the soil springs for simulating pipelines crossing reverse faults where large
oblique soil displacements relative to the pipe could occur. Full-scale model testing was undertaken to
evaluate this complex soil-pipe interaction problem. The tests simulated the performance of ~400-mm
diameter (NPS 16) pipe specimens buried in moist sand and crushed limestone trench backfill. The peak
normalized oblique soil restraint (Nθ) values for oblique pipe movement angles (θ), when θ = 0°
(horizontal movement) and θ = 90° (vertical movement) estimated based on state-of-practice approaches
were in agreement with those from full-scale testing. The value of Nθ was found to be significantly
dependent on the peak friction angle of soil (φ′p) when θ was closer 0°, whereas the Nθ was less sensitive
to φ′p when θ was beyond about 35°. The theoretical values of Nθ based on limit-equilibrium approaches
compared well with the experimental findings.
Keywords: Soil pipe interaction, Reverse thrust fault crossings, Earthquake-induced ground
movements, Buried steel pipelines, Soil restraints on pipes
Page 2 of 33
https://mc06.manuscriptcentral.com/cgj-pubs
Canadian Geotechnical Journal
Draft
3
Introduction
Buried pipeline systems, including oil and gas pipelines, form an important part of lifeline infrastructure
and major disruption to the performance of these systems can result in undesirable impacts on businesses,
economies, or the living conditions of society. Ground displacements related to slope movement,
liquefaction-induced lateral spreading, and surface fault movement can lead to the development of
significant strains in buried pipelines that are sufficient to cause loss of pressure integrity or interruption
of normal service. Pipe burial depth, native and backfill soil properties, and the magnitude and direction
of ground displacement directly influence the level of strain imposed on buried pipelines.
The numerical simulation of the response of buried pipelines to ground displacement involves nonlinear
finite element analysis conducted in accordance with industry guidelines (e.g., Honegger and Nyman
2004; PRCI 2009). In this approach, the pipeline is modelled with pipe elements, and the soil is modelled
with three discrete independent non-linear springs at each node that represent the soil restraint in three
orthogonal directions: vertical, axial, and horizontal. The definition of soil restraint as a function of
relative displacement between the pipeline and the soil is generally taken to have a constant value after
reaching the maximum. Relationships defining soil restraint have been developed mainly based upon the
experimental results from tests on anchors and pipes, as well as some analytical approaches and numerical
models that have been conducted to study the effect of transverse horizontal and longitudinal axial ground
movement on pipes. Except for a few experimental (mostly small-scale), analytical, and numerical studies
that have been reported (Audibert and Nyman 1977; Nyman 1984; Trautmann and O’Rourke 1985;
Paulin et al. 1998; Guo 2005; Prisco and Galli 2006; Hsu 1996, CCORE 2008, Wijewickreme et al. 2009;
Daiyan et al. 2010), comprehensive experimental data to characterize soil restraint versus pipe
displacement are relatively scarce in the published technical literature.
Page 3 of 33
https://mc06.manuscriptcentral.com/cgj-pubs
Canadian Geotechnical Journal

Draft
4
The numerical simulation methodology cited above is generally conservative (or overestimates the
resulting strain in the pipeline) in cases for which a reduction in pipe strength is not likely and in cases
where the soil restraint is likely to be reduced at large relative displacements between the pipe and the
soil. With the exception of situations with a large vertical component of ground displacement, the level of
conservatism associated with neglecting a post-peak reduction in soil restraint and assuming independent
orthogonal components of soil restraint is typically acceptable. However, for situations where the vertical
component of ground displacement is greater than the depth of cover over the pipeline, a substantial
reduction in soil restraint is likely as soil sloughs off of the top of the fully-exposed pipeline and as the
pipeline breaks through the ground surface. Neglecting this effect is overly conservative and can lead to
impractical and excessive design alternatives.
The design of pipelines to withstand the effects of large reverse fault displacements warrants inclusion of
improved soil restraint boundary conditions that account for the reduction of vertical soil restraint as the
pipe ploughs generally parallel to the fault dip plane (obliquely) through the backfill toward the ground
surface. Except for a limited work addressing the problem of pipelines crossing faults (e.g., Hsu et al.
2006; Hsu et al. 2001; Jung et al. 2016; Saiyar et al. 2016; O’Rourke et al. 2016), currently, there is a
general absence of public literature relating to oblique soil restraint relationships, particularly
relationships that have been validated by appropriate full-scale testing. To alleviate this gap in knowledge,
a series of full-scale oblique-displacement pipe-soil interaction model tests have been undertaken at the
University of British Columbia (UBC) Advanced Soil Pipe Interaction Research (ASPIReTM) laboratory.
The objective of testing at UBC was to evaluate the mobilization of soil restraints on buried steel
pipelines subjected to ground displacements (including oblique displacements as described above) and to
determine corresponding pipe-soil displacement relationships. Tests were conducted in two different
backfill materials, and the results were used to define pipe-soil interaction relationships for a major
international pipeline project.
Page 4 of 33
https://mc06.manuscriptcentral.com/cgj-pubs
Canadian Geotechnical Journal

Draft
5
Experimental aspects
A large soil chamber (2.5m W x 3.8m L x 2.5m H) at the UBC-ASPIReTM facility as described by
(Wijewickreme et al. 2009; Monroy 2013) and shown in Fig. 1 was used to perform large-scale lateral
soil restraint tests. The soil chamber allows investigation of the force-displacement relationship of buried
pipe configurations subject to axial, lateral, and horizontally oblique loadings. In lateral loading tests, the
pipe is aligned parallel to the shorter direction of the chamber, thus requiring the length of tested pipes to
be approximately 2.4 m (see Fig. 2). The outside-wall of the chamber is fitted with a Plexiglas sheet to
allow visual observation of the sectional view of the trench configuration, formation of failure wedges,
and movement of pipe test specimens during the tests (i.e., note the front visible side in Fig. 1).
The boundary effects associated with the soil chamber during testing had been studied previously by
Karimian (2006) during the original design and found to be negligible. The size of the chamber and
location of pipe were selected during the design process to allow unhindered formation of displacement
zones during lateral soil restraint testing. Displacement zones estimated using analytical and numerical
models confirmed the suitability of the selected chamber dimensions. Interface friction between the soil
and vertical sidewalls of the box during lateral pipe pullout was minimized by having the back wall lined
with stainless steel sheeting and the front wall with Plexiglas material (i.e., material promoting low
interface friction with soil). The estimated sidewall friction force was less than 5% of the total soil loads
on the pipe (Karimian 2006).
A plan and lateral view layout of the testing chamber used to mimic the vertical oblique displacement
associated with reverse-fault displacement is depicted in Fig. 2. The figure shows the connections made
through a sheave system for applying displacements to a buried pipe specimen with a predefined
orientation with respect to the horizontal. In particular, the system was designed to subject the pipe
Page 5 of 33
https://mc06.manuscriptcentral.com/cgj-pubs
Canadian Geotechnical Journal

Draft
6
specimen to displacements oriented in the vertical and horizontal directions as well as at 35° and 45°
angles to the horizontal, the range in fault dip angle for the reverse faults being investigated.
Tests were carried out using a NPS16 (406-mm outside diameter) steel pipe. Two types of soil were used
in the tests: (i) uniformly-graded Fraser River sand; and (ii) uniformly-graded crushed limestone. Tests in
sand were necessary to provide a basis for comparison with data from unidirectional horizontal and
vertical uplift tests, which, in nearly all cases, have been performed in dry or moist sand soils. Crushed
limestone was selected because it was expected to be the only practicable backfill alternative for the
construction of a reverse fault crossing in an actual project scenario where neither sand or pea gravel was
reasonably available. The details of the soil parameters and grain size curves for the two trench backfill
materials are presented in Table 1 and Fig. 3, respectively. The available soil parameters for the well-
graded crushed sand and gravel that was used to represent the pipe trench wall (as described in details in
the next section titled “Test Program”) are also presented in Table 3 from the viewpoint of completion.
The reported values of effective friction angle (φ′p) and dilation angle (ψ) for sand (in Table 1) is based
on the detailed stress-strain response reported by Karimian (2006) using triaxial tests conducted on Fraser
River sand; the triaxial tests were conducted at effective confining stress and sand density ranges that
envelope the conditions corresponding to the physical modeling soil-pipe configurations presented in this
paper. Due to the relatively large particle size, the tests on limestone were performed using direct shear
tests using a 0.3 m x 0.3 m large shear box available from an industry laboratory. The friction angle value
for limestone was estimated based on data available from these tests, again, conducted in alignment with
the density and effective confining stress ranges used in the testing program. Due to the strain non-
uniformities, the ψ value is not meaningfully obtainable from the direct shear test data. As such, it was
back calculated using the data from lateral load tests as per O’Rourke et al. (2008), where the backfill
dilation angle is related to the vertical to horizontal ratio of pipe displacement.
Page 6 of 33
https://mc06.manuscriptcentral.com/cgj-pubs
Canadian Geotechnical Journal

Draft
7
The backfill soil was placed in the soil chamber in 200-mm lifts and mechanically compacted using a
static roller to achieve the desired target average soil density. The as-placed compaction densities were
measured and controlled using a number of methods: (a) direct measurement using nuclear densometer
(Troxler Model 3440 Roadreader™ Nuclear Moisture/Density Gauge, Troxler Electronic Laboratories,
Inc., North Carolina); (b) weighing of soil and moisture content of soil included in metallic bowls of
known volume buried in the backfill; (c) density calculations based on overall soil mass placed in the
chamber with respect to the final volume of the soil placed in the chamber. After initial placement of soil
to a thickness of about 450 mm, the pipe specimen was placed on the soil bed and the filling of the box
was continued up to the level corresponding to the desired overburden ratio, H/D (where H is the vertical
distance from the pipe centerline to the ground surface, and D is the pipe diameter). The NPS 16 pipe
segments used herein were tested with 450 mm of soil cover above the crown of the pipe (H/D = 1.6).
A coupling system consisting of end clamps at each end of the pipe with double-ended hook cables was
used for pulling the pipe test specimen. Each cable was connected to a loading system consisting of two
double-acting hydraulic actuators (capacity 418 kN) with a load cell mounted on the actuator rod.
Bending of the pipe at this scale was assessed to be negligible due to the high section modulus of the steel
pipes used in the testing. Two inclinometers and a set of eight string potentiometers (four per loading
cable) were utilized to verify and record the displacements applied along the required inclinations during
the testing process. In all tests, the total load per unit length on the pipe was determined by adding the
load measured from each load cell and then dividing it by the length of the pipe specimen. Symmetry of
the pulling system was verified by controlling the difference in indicated readings from each load cell to
be less than 5%.
Karimain (2006) and Monroy (2013), through a number of tests conducted on identically prepared
specimens at the UBC-ASPIReTM facility, have shown similar characteristic response in soil restraint
Page 7 of 33
https://mc06.manuscriptcentral.com/cgj-pubs
Canadian Geotechnical Journal

Draft
8
versus pipe displacement relationships between respective tests. Their work has demonstrated good test
repeatability in terms of specimen preparation and test control, and data acquisition undertaken at the
UBC facility.
Test program
Seven tests conducted using the ASPIReTM soil chamber to represent pipe displacements occurring
perpendicular (lateral) to the pipeline alignment, but at different angles (θ) to the horizontal are presented
in this paper: 0° (horizontal), 35
°, 45
°, and 90
° (vertical). Key test parameters are summarized in Table 2.
Tests No. 1 through 3 were conducted using sand backfill around the pipe, and Tests No. 4 through 7
were performed with a crushed limestone backfill.
In the tests where pipes were displaced in the horizontal and vertical directions (θ = 0° and 90°,
respectively), the horizontal and vertical displacement tests were conducted without a simulated trench as
these tests were aimed at providing comparison with past investigations by others in sand backfill and a
direct comparison between past sand tests and tests in crushed limestone. Tests No. 2, 5, and 6, where the
pipe specimen was subject to displacements oriented at 35° or 45° inclination to the horizontal, were
conducted with a configuration that included a trench with sloped side walls representing the trench
design for the reverse fault crossings. The trench wall material was selected so that it would simulate a
trench excavated in stiff native soil boundary conditions. Compacted 19-mm minus well-graded crushed
sand and gravel (often called as “road mulch” in industry practice) was used in this regard to represent the
trench wall. The ability to re-use a “fixed” trench wall for multiple tests provided significant cost
efficiency since the backfill material and pipes only needed to be replaced, while the built trench
remained unchanged between tests.
Page 8 of 33
https://mc06.manuscriptcentral.com/cgj-pubs
Canadian Geotechnical Journal

Draft
9
The pipe specimens were loaded in a displacement-controlled manner at a rate of 2.5 mm/s in all cases.
During oblique tests, the spatial changes in position of each pair of control points located along the left
and right pulling cables was calculated from the recordings of the string potentiometers. This data
provided the basis to confirm that the pipe remained in an orientation perpendicular to the direction of
applied displacement.
A key part in addressing the objectives of this paper is the evaluation of the soil force development on the
pipes during the tests. As mentioned previously, Tests No. 2, 5, and 6 were conducted with a
configuration simulating a pipe buried in a trench excavated in stiff native soil boundary conditions,
whereas the remaining Tests No. 1, 3, 4, and 7 were conducted with the test pipe buried in a uniform
backfill. From a test comparison point of view, it would have been ideal if all the tests were conducted
under identical burial configurations (i.e., in a configuration with no trenches and only uniform backfill
conditions such as those corresponding to the Tests No. 1, 3, 4, and 7); however, undertaking such
additional testing was not feasible due to the cost and schedule constraints for this project-directed
investigation. From the findings from studies conducted by Monroy (2013) using the UBC ASPIReTM, as
per below, it was possible to demonstrate that the use of data from the tests conducted with the pipe
buried in a trench backfill is still applicable for comparison with those performed with uniform backfill
conditions. Monroy (2013) conducted a number of inclined lateral pipe displacement tests with θ = 35°
and 45° buried in a trench configuration identical to that used for the Tests No. 2, 5, and 6, but with the
trench slopes lined with different geotextiles. In some of these tests, the pipe trench was lined using two
layers of geotextiles before the backfill was placed around the pipe. When the results from these
geotextile-lined tests were compared with those conducted without geotextile lining, it was found that the
soil restraint developed in tests with and without geotextile lining were very similar. This observation
suggested that the failure wedges in these tests did not extend far enough to mobilize the geotextile
Page 9 of 33
https://mc06.manuscriptcentral.com/cgj-pubs
Canadian Geotechnical Journal
Draft
10
interface with the lower friction angle; this inference was also corroborated by evidence from the visual
observations of failure wedges through the transparent face of the soil chamber. The evidence that the
soil-pipe response is not affected by the presence of the trench in these inclined lateral pipe displacement
tests (i.e., where the pipes were obliquely pulled with θ = 35° and 45°), suggested that the data from Tests
No. 2, 5, and 6 (with the presence of the trench) would justifiably qualify for use along with the results
from Tests No. 1, 3, 4, and 7 in the present assessment.
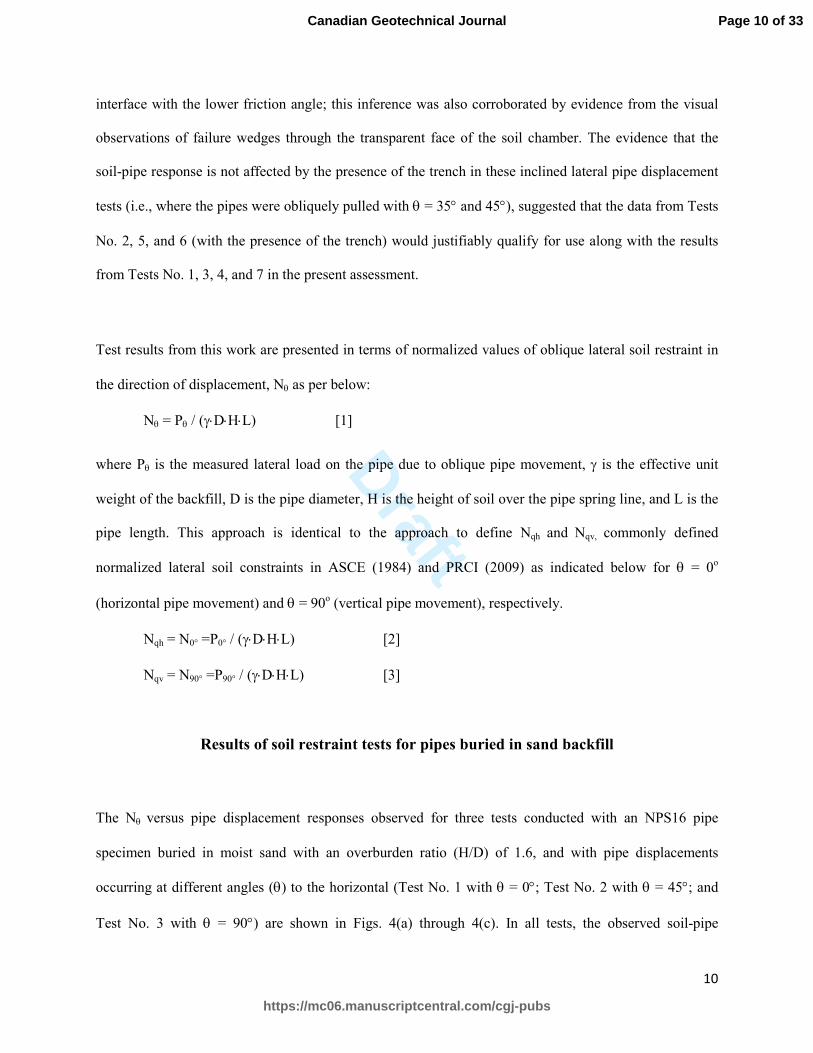
Test results from this work are presented in terms of normalized values of oblique lateral soil restraint in
the direction of displacement, Nθ as per below:
Nθ = Pθ / (γ⋅D⋅H⋅L) [1]
where Pθ is the measured lateral load on the pipe due to oblique pipe movement, γ is the effective unit
weight of the backfill, D is the pipe diameter, H is the height of soil over the pipe spring line, and L is the
pipe length. This approach is identical to the approach to define Nqh and Nqv, commonly defined
normalized lateral soil constraints in ASCE (1984) and PRCI (2009) as indicated below for θ = 0o
(horizontal pipe movement) and θ = 90o (vertical pipe movement), respectively.
Nqh = N0° =P0° / (γ⋅D⋅H⋅L) [2]
Nqv = N90° =P90° / (γ⋅D⋅H⋅L) [3]
Results of soil restraint tests for pipes buried in sand backfill
The Nθ versus pipe displacement responses observed for three tests conducted with an NPS16 pipe
specimen buried in moist sand with an overburden ratio (H/D) of 1.6, and with pipe displacements
occurring at different angles (θ) to the horizontal (Test No. 1 with θ = 0°; Test No. 2 with θ = 45°; and
Test No. 3 with θ = 90°) are shown in Figs. 4(a) through 4(c). In all tests, the observed soil-pipe
Page 10 of 33
https://mc06.manuscriptcentral.com/cgj-pubs
Canadian Geotechnical Journal
Draft
11
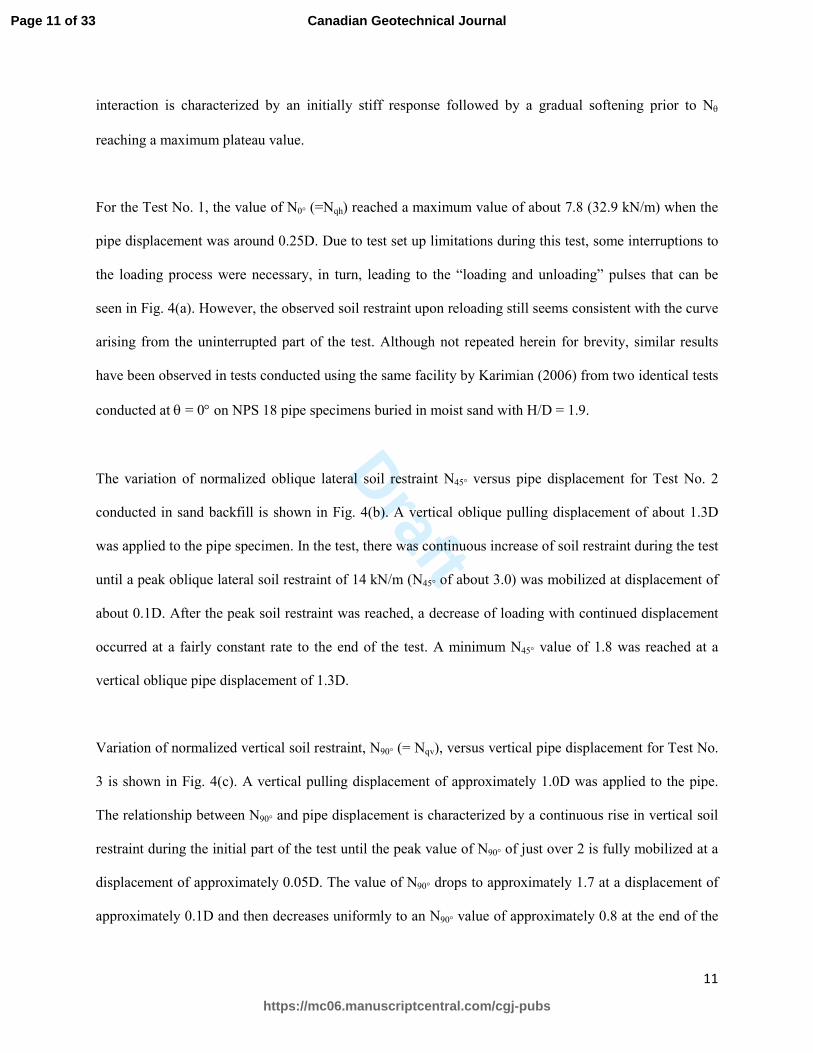
interaction is characterized by an initially stiff response followed by a gradual softening prior to Nθ
reaching a maximum plateau value.
For the Test No. 1, the value of N0° (=Nqh) reached a maximum value of about 7.8 (32.9 kN/m) when the
pipe displacement was around 0.25D. Due to test set up limitations during this test, some interruptions to
the loading process were necessary, in turn, leading to the “loading and unloading” pulses that can be
seen in Fig. 4(a). However, the observed soil restraint upon reloading still seems consistent with the curve
arising from the uninterrupted part of the test. Although not repeated herein for brevity, similar results
have been observed in tests conducted using the same facility by Karimian (2006) from two identical tests
conducted at θ = 0° on NPS 18 pipe specimens buried in moist sand with H/D = 1.9.
The variation of normalized oblique lateral soil restraint N45° versus pipe displacement for Test No. 2
conducted in sand backfill is shown in Fig. 4(b). A vertical oblique pulling displacement of about 1.3D
was applied to the pipe specimen. In the test, there was continuous increase of soil restraint during the test
until a peak oblique lateral soil restraint of 14 kN/m (N45° of about 3.0) was mobilized at displacement of
about 0.1D. After the peak soil restraint was reached, a decrease of loading with continued displacement
occurred at a fairly constant rate to the end of the test. A minimum N45° value of 1.8 was reached at a
vertical oblique pipe displacement of 1.3D.
Variation of normalized vertical soil restraint, N90° (= Nqv), versus vertical pipe displacement for Test No.
3 is shown in Fig. 4(c). A vertical pulling displacement of approximately 1.0D was applied to the pipe.
The relationship between N90° and pipe displacement is characterized by a continuous rise in vertical soil
restraint during the initial part of the test until the peak value of N90° of just over 2 is fully mobilized at a
displacement of approximately 0.05D. The value of N90° drops to approximately 1.7 at a displacement of
approximately 0.1D and then decreases uniformly to an N90° value of approximately 0.8 at the end of the
Page 11 of 33
https://mc06.manuscriptcentral.com/cgj-pubs
Canadian Geotechnical Journal

Draft
12
test.
Results of soil restraint tests for pipes buried in crushed limestone
Normalized purely horizontal soil restraint-displacement response, N0°, for Test No. 4 is shown in Fig.
4(d). From the results presented in Fig. 4(d), it can be observed that the peak normalized soil restraint
factor is approximately 12 at a displacement of approximately 0.1D, followed by a drop in lateral soil
restraint to near-constant post-peak level of restraint corresponding to an N0° of 10 for values of
displacement greater than about 0.2D.
Variation of N35° with pipe displacement for Test No. 5 is shown in Fig. 4(e). As can be observed from
the plot in Fig. 4(e), a continuous increase in soil restraint, similar to Test No. 4, occurred during the
initial part of the test until an N35° value of about 3.8 was reached at a displacement of 0.18D. The soil
restraint decreased at a near-uniform rate after reaching the peak restraint, reaching an N35° value of 1.9 at
a vertical oblique displacement of 1.2D at the end of the test.
The observed N45° versus pipe displacement relationship for Test No. 6 is shown in Fig. 4(f). As with
Test No. 5, a continuous rise of soil restraint occurred during the initial part until a normalized vertical
oblique soil restraint factor, N45°, of about 2.9 was reached at a displacement of about 0.15D. Once the
peak value of N45° was reached, the soil restraint continuously decreased to an N45° value of about 1.4
when the test was terminated.
Variation of normalized vertical soil restraint N90° (= Nqv) versus displacement for Test No. 7 is shown in
Fig. 4(g). A vertical pulling displacement of approximately 0.8D was applied to the pipe specimen. The
Page 12 of 33
https://mc06.manuscriptcentral.com/cgj-pubs
Canadian Geotechnical Journal

Draft
13
soil-pipe interaction behavior under vertical displacement shows a large decrease in soil restraint at
displacements beyond that at which the maximum restraint occurs. The peak value of N90° for Test No. 7
was about 2.3 and occurred at a value of displacement of approximately 0.1D. At a displacement of 0.2D,
the vertical soil restraint had reduced to 50% of the peak value. For displacements greater than 0.2D, the
vertical soil restraint continued to decrease to a value of about 25% of the peak value at a displacement of
0.8D.
Discussion - results of soil restraint tests
A summary of the results obtained during this experimental program is given in the Table 3. Firstly, the
difference in the observed levels of peak soil restraint for the two materials can be attributed to the
differences in their frictional properties (see Table 3 for the significant difference in the friction angles).
A comparison of the N0° and N90° values (i.e., Nqh and Nqv, repectively) obtained from the tests in different
backfills with those derived from the PRCI (2009) approach, based upon Yimsiri et al. (2004), is
presented in Table 4. The estimation of N0° and N90° values corresponding to the case with crushed
limestone backfill required extrapolation since the PRCI method does not provide the predictions for
backfills having φ′p values greater than 45°. The peak N0° and N90° values estimated based on PRCI
(2009) using the φ′p values obtained from material-specific laboratory element testing are in reasonable
agreement with those directly measured from full-scale soil-pipe interaction chamber testing. The
recommended values of displacement to reach maximum N0° in PRCI guidelines are 0.08 for an H/D
value of 1.6. As indicated in the load-displacement plots in Fig. 4, the pipes tested at H/D ratio 1.6 had
displacements at maximum N0° ranging from 0.08D to 0.25D. It appears that the determination of
displacement at maximum N0° is not simply a function of H/D ratio, but is dependent on other factors
such as the backfill soil gradation and material density. A lower value of displacement to mobilize the
maximum soil restraint results in a stiffer soil restraint characterization, which is generally conservative
Page 13 of 33
https://mc06.manuscriptcentral.com/cgj-pubs
Canadian Geotechnical Journal

Draft
14
for the purposes of evaluating pipeline response to lateral ground displacements as it leads to a higher rate
of pipe deformation with ground displacement.
The rates of change in vertical soil restraint with pipe displacements after peak may be related to the
particle size distribution of the different backfill materials. The rate of post-peak load reduction (with
respect to pipe displacement) for tests in sand is less than that for tests in limestone with equal geometric
conditions. The ability of crushed limestone particles to flow more easily around the pipe (due to the lack
of suction from moisture in the moist Fraser River sand), and therefore, reduce the soil mass existing
above the pipe may explain the higher rate of post-peak load reduction (Wijewickreme et. al. 2014).
Even though the number of tests were limited, they are sufficient to draw very useful conclusions
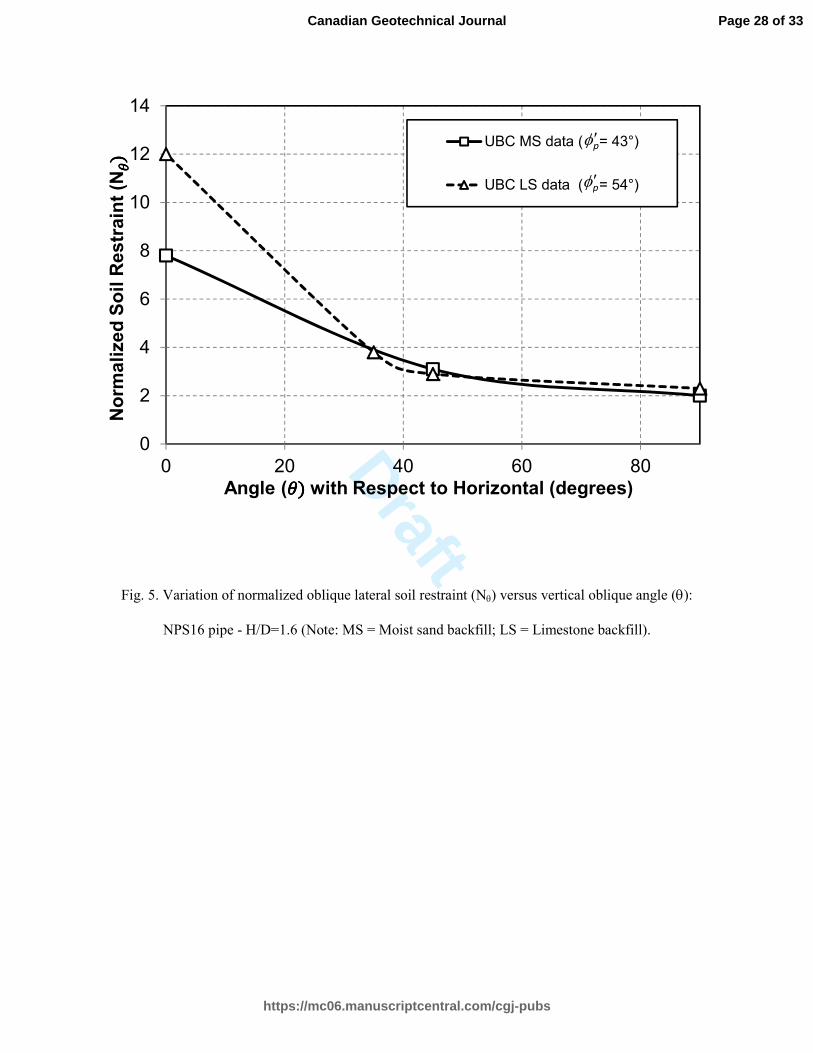
regarding the general trends in oblique soil restraint for the two types of soil material tested. Variations of
Nθ with the vertical oblique angle (θ) derived from the above tests on NPS 16 pipes are illustrated in Fig.
5 for uniformly graded moist sand (MS) and uniformly graded crushed limestone (LS). For both the
backfill cases tested, the difference in peak normalized soil restraint is negligible for the two soil types for
vertical oblique angles greater than about 35° to 45o. However, at oblique angles less than about 35°
(more horizontal), the normalized soil restraint for the two materials are considerable different with the
crushed limestone producing much higher soil restraint.
Comparisons with other research findings
Two comparisons are made with previous research related to oblique vertical soil restraint on buried
pipelines: the relationship between oblique restraint and inclination angle proposed by Nyman (1984) and
the theoretical solution proposed by Hsu (1996).
Nyman (1984) proposed the following expression for relating oblique soil restraint to the angle of
inclination, α, that varies from 0° for pure uplift restraint and 90° for pure lateral restraint:
Page 14 of 33
https://mc06.manuscriptcentral.com/cgj-pubs
Canadian Geotechnical Journal

Draft
15
0.251 190 0.75
horizontaloblique uplift
uplift
PP P
P
αα
= + − −
o [5]
where:
Poblique = maximum oblique soil restraint
Puplift = maximum soil restraint in the upward direction
Phorizontal = maximum soil restraint in the horizontal direction
Nyman (1984) based values of Puplift and Phorizontal on work by Vesic (1971) and Audibert and Nyman
(1984), respectively. Rearranging equation [5] to be consistent with the definition of an oblique angle in
this paper and recognizing the variation in soil restraint force is the same as a variation in Nq, equation [5]
can be expressed as shown in equation [6].
0
9090
22.5 0.251 122.5 0.75
θθ
θ
− = + − +
o
o
o
o
o
NN N
N [6]
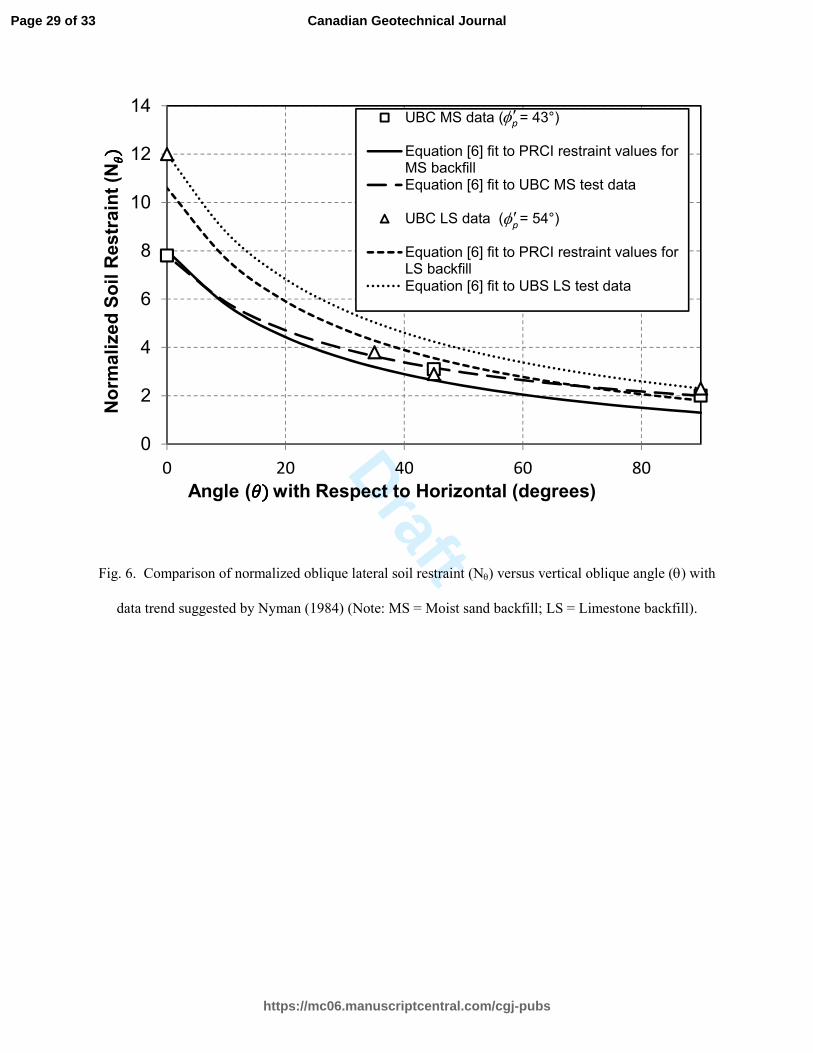
The variation in oblique soil restraint described by equation [6] is compared to the values obtained using
currently recommended relationships for N90° and N0° as presented in the 2009 PRCI guidelines and as
obtained in the tests (see summary of PRCI and test values in Table 4). As can be seen in Fig. 6, adopting
the PRCI 2009 values for N0° and N90° and the trend in equation [6] is generally in good agreement with
the experimental data presented herein. Although the data points are limited, curves have been drawn to
assist understanding the trends; as such, the actual curve should be used with caution.
Using the measured N0° and N90° values in the trend in equation [6] produces a good match with the MS
data point at N45° but the match is worse for the LS data. The poor match with the LS data is not
unexpected given the similarity in the normalized soil restraint for the MS and LS tests for angles greater
than 35°.
Page 15 of 33
https://mc06.manuscriptcentral.com/cgj-pubs
Canadian Geotechnical Journal

Draft
16
Nyman (1984) and Hsu (1996) propose a theoretical force equilibrium solution based upon work on
inclined plate anchors by Meyerhof (1973), the only difference being the way soil weight within the zone
occupied by the top of the pipe is treated (see Fig. 7). Using the approach recommended by Hsu, the
oblique force can be determined by finding the value of ω that minimizes the value of Pu given by
equation [7].
( )1 sin( ) cos( ) tan( )( )
cos( ) sin( ) tan( )u
W RP
φ φ ω φω
α α ω φ
+ − −=
+ − [7]
where:
W, R1, α, and ω defined in Fig. 7.
φ = internal friction angle
Pu = maximum soil restraint felt by the pipe during oblique pipe movement
A key challenge in applying equation [7] is related to the computation of the value of force R1, which
would also be governed by the appropriate ratio of horizontal soil stress to vertical effective soil stress.
Hsu (1996) suggested the use of an “at rest” soil condition for computing R1 for α values less than about
20°, as the amount of lateral soil displacement is small, and the active pressure for larger α values. The
use of an “at rest” value also led to calculations of soil restraint consistent with his test results in loose
sand with an internal friction angle of 33°, a unit weight of 15.2 kN/m3, and a relative density of 21%.
In the present work, the use of equation [7] with an “at rest” soil stress value for determining R1,
theoretical oblique soil restraint values were computed for the soil properties of the UBC MS and LS
tests. The results are plotted in Fig. 8, along with the UBC data points. Again, it is noted that the curves
have been drawn to assist understanding the trends; as such, the actual curve should be used with caution.
Page 16 of 33
https://mc06.manuscriptcentral.com/cgj-pubs
Canadian Geotechnical Journal

Draft
17
The theoretical approach from Hsu (1996) compares favorably with the limited UBC data for values of θ
less than about 60° (or α >30°); the predicted values when θ is at 90° (or α = 0°) have a slightly poorer
match with the experimental results. The significant effect of soil friction angle (i.e., difference between
sand and limestone soil types) observed in UBC experiments for lower values of θ, where the direction of
pipe movement is closer to the horizontal direction, is well captured by the theory. The similarity in
oblique soil restraint for the two materials for values of θ ≥ 35° also seems to be well captured.
Considering that the theory is based on soil block movements along an assumed failure surface, finite
element or finite difference numerical analysis that has the ability to model the soil stiffness effects in a
continuum basis should be considered for arriving at more robust assessments. The work undertaken by
Jung et al. (2016) is an example of the types of finite element analyses that can be employed. It is of
relevance to note that the maximum horizontal (θ = 0°), inclined (θ = 45°), and vertical (θ = 90°) soil
restraint values for sand generated from their work are also in good agreement with those presented
herein. However, it is not appropriate to directly compare these values from Jung et al. (2016) with those
presented in this paper since the lateral soil restraint values in their paper are for H/D values greater than
2.
Conclusions
A series of full-scale pipe soil interaction model tests were undertaken at the University of British
Columbia (UBC), Vancouver, British Columbia (BC), Canada, to evaluate the mobilization of soil
restraints on buried steel pipelines when subjected to oblique ground displacements. The availability of
data from full-scale soil-pipe interaction tests on relatively larger diameter pipes is scarce mainly due to
high costs in experimentation and the lack of testing facilities. In this context, the tests conducted at UBC
to simulate the performance of an NPS 16 (~ 400-mm outside diameter) pipe specimens buried in two
different trench backfill materials (uniformly graded moist sand and uniformly graded crushed limestone)
Page 17 of 33
https://mc06.manuscriptcentral.com/cgj-pubs
Canadian Geotechnical Journal

Draft
18
provided a unique data set to evaluate soil spring characteristics for numerical modeling of soil-pipe
interaction in pipelines subject to oblique ground movements. While the test program was focused on
supporting the design of pipeline crossings of reverse faults, the experimental results were sufficient to
draw very useful conclusions regarding the variation in oblique soil restraint with relative displacement
between the pipe and soil and the general trends for the two types of soil material tested.
The peak normalized oblique soil restraint (Nθ) values for θ = 0° (horizontal pipe movement) and θ = 90°
(vertical pipe movement) estimated based on PRCI (2009) using the effective soil friction angle (φ′p)
values obtained from material-specific laboratory element testing were found to be in reasonable
agreement with those directly measured from full-scale soil-pipe interaction chamber testing. The
significant effect of φ′p (i.e., difference between sand and limestone soil types) on the magnitude of Nθ
was observed in the experiments for lower values of θ where the direction of pipe movement is closer to
the horizontal direction; on the other hand, the Nθ was found to be less sensitive to the soil friction angle
when the values of θ increases beyond about 35°.
The tests also revealed that there is a significant reduction of the oblique soil restraint with increasing
pipe displacements after reaching a peak Nθ value, particularly for the cases where pipe displacements
occur with θ values greater than about 35°. The rates of change in oblique soil restraint with pipe
displacements after the peak appeared to be related to the particle size distribution of each backfill
material. The soils having uniform particles that can potentially “flow” more easily around the pipe (such
as the nature of uniform graded crushed limestone) seem to have increased peak load reduction tendency
with increasing pipe displacements compared to soils with smaller particles (e.g., moist sand).
The experimental findings for Nθ compared reasonably well with the theoretical equations recommended
by Hsu (1996) particularly for values of θ less than about 60° (or when the direction of pipe movement is
closer to the horizontal direction. Considering that the theory is based on soil block movements along an
Page 18 of 33
https://mc06.manuscriptcentral.com/cgj-pubs
Canadian Geotechnical Journal

Draft
19
assumed failure surface, finite element or finite difference numerical analysis that captures the soil
stiffness effects in a continuum basis should be considered for arriving at more robust assessments.
References
Audibert, J.M.E., and Nyman, K.J. 1977. Soil restraint against horizontal motion of pipes. ASCE Journal
of the Geotechnical Engineering Division, 103(GT10), 1119-1142.
C-CORE. 2008. Pipeline Integrity for Ground Movement Hazards. Final report prepared for United States
Department of Transportation, C-CORE Report R-07-082-459.
Daiyan, N., Kenny, S., Phillips, R., and Popescu, R. 2011. Investigating pipeline-soil interaction under
axial-lateral relative movements in sand. Canadian Geotechnical Journal, 48(11), 1683-1695.
Guidelines for the seismic design of oil and gas pipeline systems. Committee on Gas and Liquid Fuel
Lifelines; ASCE, New York, 1984.
Guidelines for constructing natural gas and liquid hydrocarbon pipelines in areas subject to landslide and
subsidence hazards. report prepared by D. G. Honegger Consulting, C-CORE and SSD Inc. for
the Design, Construction & Operations Technical Committee of Pipeline Research Council
International Inc.; PRCI 2009, Catalog No. L52292(V).
Guo, P. J. 2005. Numerical modeling of pipe-soil interaction under oblique loading. Journal of
Geotechnical and Geoenvironmental Engineering, 131(2), 260-268.
Honegger, D. G., and Nyman, D. J. 2004. Guidelines for the seismic design and assessment of natural gas
and liquid hydrocarbon pipelines. Report prepared for Pipeline Design, Construction &
Operations Technical Committee of Pipeline Research Council International, Inc., PR-268-9823.
Hsu, T. W. 1996. Soil restraint against oblique motion of pipelines in sand. Canadian Geotechnical
Journal, 33, 180–188.
Page 19 of 33
https://mc06.manuscriptcentral.com/cgj-pubs
Canadian Geotechnical Journal

Draft
20
Hsu, T.W., Chen, Y.J., and Hung, W.C. 2006. Soil restraint to oblique movement of buried pipes in dense
sand. Journal of Transportation Engineering 132(2): 175-181.
Hsu, T.W., Chen, Y.J., and Wu, C.Y. 2001. Soil friction restraint of oblique pipelines in loose sand.
Journal of Transportation Engineering 127(1): 82-87.
Jung, J.K., O'Rourke, T., and Argyrou, C. 2016. Multi-Directional Force-Displacement Response of
Underground Pipe in Sand. Canadian Geotechnical Journal. doi: 10.1139/cgj-2016-0059.
Karimian, H. 2006. Response of Buried Steel Pipelines subjected to Longitudinal and Transverse Ground
Movement, Ph.D. Thesis, University of British Columbia.
Meyerhof, G. 1973. Uplift resistance of inclined anchors and piles. Proceeding of the 8th International
Conference on Soil Mechanics and Foundation Engineering, Moscow, 2, 167-172.
Monroy, M. 2013. Soil restraints on steel buried pipelines crossing active seismic faults. Ph.D. Thesis,
University of British Columbia, Vancouver, Canada.
Nyman, K. J. 1984. Soil response Against Oblique Motion of Pipes. Journal of Transpotation
Engineering. 110, 190-202.
O’Rourke, T.D., Jung, J.K., and Argyrou, C. 2016. Underground pipeline response to earthquake-induced
ground deformation. Soil Dynamics and Earthquake Engineering.
doi: http://dx.doi.org/10.1016/j.soildyn.2016.09.008.
O’Rourke, T.D., Jezerski, J.M., Olson, N. A., Bonneau, A.L., Palmer, M.C., Stewart, H.E., O’Rourke, M.
J., and Abdoun, T. 2008. Geotechnics of pipeline system response to earthquakes, Proceedings of
the Geotechnical Earthquake Engineering and Soil Dynamics IV, Sacramento, California,
GSP(181).
Page 20 of 33
https://mc06.manuscriptcentral.com/cgj-pubs
Canadian Geotechnical Journal

Draft
21
Paulin, M.J., Phillips, R., Clark, J.I., Trigg, A., and Konuk, I. 1998. A full-scale investigation into
pipeline/soil interaction. Proceedings, International Pipeline Conference, Calgary, AB, ASME,
779-788.
Prisco, C., and Galli, A. 2006. Soil-pipe interaction under monotonic and cyclic loads: experimental and
numerical modelling. Proceedings of the 1st Euro mediterranean symposium in advances on
geomaterials and structures, Hammamet, Tunisia , 755–761.
Saiyar, M., Ni, P., Take, W.A., and Moore, I.D. 2016. Response of pipelines of differing flexural stiffness
to normal faulting. Géotechnique 66(4): 275-286. doi: 10.1680/jgeot.14.P.175.
Trautmann, C.H., and O’Rourke, T.D. 1985. Lateral force displacement response of buried pipe. ASCE
Journal of Geotechnical Engineering, 111(9), 1077-1092.
Wijewickreme, D., Karimian, H., and Honegger, D. 2009. Response of buried steel pipelines subject to
relative axial soil movement. Canadian Geotechnical Journal, 46(7), 735-752.
Wijewickreme, D., Monroy, M., Nyman, D.J., and Honegger, D.G. 2014. Response of Buried Pipelines
Subjected to Ground Displacements Under Different Trench Backfill Conditions, 10th U.S.
National Conference on Earthquake Engineering (10NCEE) Conference, EERI, Anchorage,
Alaska, USA, July 21-25, 2014.
Yimsiri, S., Soga, K., Yoshizaki, K., Dasari, G.R., and O’Rourke, T.D. 2004.Lateral and upward soil-
pipeline interactions in sand for deep embedment conditions. ASCE Journal of Geotechnical and
Geoenvironmental Engineering, 130 (8).
Vesic, A.S. 1971. Breakout resistance of objects embedded in ocean bottom, Journal of the Soil
Mechanics and Foundation Engineering Division, ASCE, 97 (SM9), pp.1183-1205.
Page 21 of 33
https://mc06.manuscriptcentral.com/cgj-pubs
Canadian Geotechnical Journal

Draft
22
List of Figures
Table 1: Summary of parameters related to test soil backfill materials
Table 2: Details of soil restraint tests
Table 3: Summary of soil restraint test results
Table 4: Summary of peak normalized soil restraint derived soil restraint testing.
Page 22 of 33
https://mc06.manuscriptcentral.com/cgj-pubs
Canadian Geotechnical Journal

Draft
23
List of Figure Captions
Fig.1. General view of the Advanced Soil Pipe Interaction Research (ASPIReTM) facility at UBC.
Fig. 2. Configuration of the ASPIReTM facility to study vertical oblique soil restraints.
Fig. 3. Grain size distribution of trench backfill materials used in the present study.
Fig. 4. Normalized oblique lateral soil restraint (Nθ) versus displacement NPS16 pipe - H/D=1.6: (a) Test
No. 1, θ = 0°, Moist sand backfill; (b) Test No. 2, θ = 45°, Moist sand backfill; (c) Test No. 3, θ = 90°,
Moist sand backfill; (d) Test No. 4, θ = 0°, Limestone backfill; (e) Test No. 5, θ = 35°, Limestone
backfill; (f) Test No. 6, θ = 45°, Limestone backfill; (g) Test No. 7, θ = 90°, Limestone backfill.
Fig. 5. Variation of normalized oblique lateral soil restraint (Nθ) versus vertical oblique angle (θ):
NPS16 pipe - H/D=1.6 (Note: MS = Moist sand backfill; LS = Limestone backfill).
Fig. 6. Comparison of normalized oblique lateral soil restraint (Nθ) versus vertical oblique angle (θ) with
data trend suggested by Nyman (1984) (Note: MS = Moist sand backfill; LS = Limestone backfill).
Fig. 7. Equilibrium formulations of Nyman (1984) and Hsu (1996).
Fig. 8. Comparison of theoretical solutions for normalized oblique lateral soil restraint (Nθ) versus
vertical oblique angle (θ) with data from testing at UBC (Note: MS = Moist sand backfill; LS =
Limestone backfill).
Page 23 of 33
https://mc06.manuscriptcentral.com/cgj-pubs
Canadian Geotechnical Journal

Draft
List of Figures
Fig.1. General view of the Advanced Soil Pipe Interaction Research (ASPIReTM) facility at UBC.
Structural System used for
pulling the pipe at different
displacement directions
Plexiglas panels
Hydraulic
System
Data
Acquisition
System
Page 24 of 33
https://mc06.manuscriptcentral.com/cgj-pubs
Canadian Geotechnical Journal

Draft
2500
H/D
750
3
816
16
16
4
22
10
6
18
18
17
2324
14
15
35 degrees
45 degrees
25
7 77
7
7
21
8
26
26
14X
Z
Fig. 2. Configuration of the ASPIReTM facility to study vertical oblique soil restraints
19
1
2
3
4
4
8
8
6
6
910
11
12
12
1415
1415
16
16
1718
18
18
Direction of appliedpipe movement
20
21
22
22
1216
1216
12161216 1216
X
Y
1. Soil chamber
2. Plexi-glass panel
3. Pipe specimen
4. Load cell for lateral
soil restraint
5. Load cell for axial
soil restraint
6. 25 mm steel cables
7. String
potentiometer
8. Hydraulic actuator
system
9. VDT
10. Servo controller
11. To hydraulic power
12. Steel cable to pipe
connector
13. Reaction steel plate
14. Load cell for oblique
soil restraint and
inclinometer
15. Sheave system for
oblique pulling
16. Vertical steel frame
system
17. Steel brace for
lateral stiffness
18. Data acquisition
system & computer
19. Control System
20. -Steel foundation
pad
21. Hydraulic system for
vertical pulling
22. Sheave system for
vertical pulling
23. Crane
24. Collar steel beam
25. Trench wall (1:1
slope)
(b) Lateral view
(a) Plan view
Page 25 of 33
https://mc06.manuscriptcentral.com/cgj-pubs
Canadian Geotechnical Journal

Draft
Fig. 3. Grain size distribution of trench backfill materials used in the present study.
0
10
20
30
40
50
60
70
80
90
100
0.001 0.01 0.1 1 10 100
% P
assin
g
Sieve aperture (mm)
Crushed Limestone
Fraser River Sand
Page 26 of 33
https://mc06.manuscriptcentral.com/cgj-pubs
Canadian Geotechnical Journal

Draft
(a)
(b)
(c)
(d)
(e)
(f)
(g)
0.0
2.0
4.0
6.0
8.0
10.0
12.0
0 0.1 0.2 0.3 0.4 0.5 0.6 0.7 0.8 0.9 1
No
rmali
zed
So
il R
estr
ain
t (N
0°)
Pipe Displacement /Pipe Diameter (D)
Moist Sand (����= 00)
0.0
0.5
1.0
1.5
2.0
2.5
3.0
3.5
0 0.2 0.4 0.6 0.8 1 1.2
No
rmali
zed
So
il R
estr
ain
t (N
45°)
Pipe Displacement /Pipe Diameter (D)
Moist Sand (����= 450)
0.0
0.5
1.0
1.5
2.0
2.5
0 0.1 0.2 0.3 0.4 0.5 0.6 0.7 0.8 0.9 1
No
rmali
zed
So
il R
estr
ain
t (N
90°)
Pipe Displacement /Pipe Diameter (D)
Moist Sand (����= 900)
0.0
2.0
4.0
6.0
8.0
10.0
12.0
0 0.1 0.2 0.3 0.4 0.5 0.6 0.7 0.8 0.9 1
No
rmali
zed
So
il R
estr
ain
t (N
0°)
Pipe Displacement / Pipe Diameter (D)
Crushed Limestone (����=00)
0.0
0.5
1.0
1.5
2.0
2.5
3.0
3.5
4.0
0 0.2 0.4 0.6 0.8 1 1.2
No
rmali
zed
So
il R
estr
ain
t (N
35°)
Pipe Displacement /Pipe Diameter (D)
Crushed Limestone(����=350)
0.0
0.5
1.0
1.5
2.0
2.5
3.0
3.5
0 0.2 0.4 0.6 0.8 1 1.2
No
rmali
zed
So
il R
estr
ain
t (N
45°)
Pipe Displacement /Pipe Diameter (D)
Crushed Limestone(����=450)
0.0
0.5
1.0
1.5
2.0
2.5
0 0.1 0.2 0.3 0.4 0.5 0.6 0.7 0.8 0.9 1
No
rmali
zed
So
il R
estr
ain
t (N
90°)
Pipe Displacement /Pipe Diameter (D)
Crushed Limestone(����=900)
Fig. 4. Normalized oblique lateral soil restraint (Nθ) versus displacement NPS16 pipe - H/D=1.6: (a) Test
No. 1, θ = 0°, Moist sand backfill; (b) Test No. 2, θ = 45°, Moist sand backfill; (c) Test No. 3, θ = 90°,
Moist sand backfill; (d) Test No. 4, θ = 0°, Limestone backfill; (e) Test No. 5, θ = 35°, Limestone backfill;
(f) Test No. 6, θ = 45°, Limestone backfill; (g) Test No. 7, θ = 90°, Limestone backfill.
Page 27 of 33
https://mc06.manuscriptcentral.com/cgj-pubs
Canadian Geotechnical Journal
Draft
Fig. 5. Variation of normalized oblique lateral soil restraint (Nθ) versus vertical oblique angle (θ):
NPS16 pipe - H/D=1.6 (Note: MS = Moist sand backfill; LS = Limestone backfill).
0
2
4
6
8
10
12
14
0 20 40 60 80
No
rmali
zed
So
il R
estr
ain
t (N
�� ��)) ))
Angle (����)))) with Respect to Horizontal (degrees)
UBC MS data ( = 43°)
UBC LS data ( = 54°)
pφ ′
pφ ′
Page 28 of 33
https://mc06.manuscriptcentral.com/cgj-pubs
Canadian Geotechnical Journal
Draft
Fig. 6. Comparison of normalized oblique lateral soil restraint (Nθ) versus vertical oblique angle (θ) with
data trend suggested by Nyman (1984) (Note: MS = Moist sand backfill; LS = Limestone backfill).
0
2
4
6
8
10
12
14
0 20 40 60 80
No
rmali
zed
So
il R
estr
ain
t (N
�� ��)) ))
Angle (����) ) ) ) with Respect to Horizontal (degrees)
UBC MS data ( = 43°)
Equation [6] fit to PRCI restraint values forMS backfillEquation [6] fit to UBC MS test data
UBC LS data ( = 54°)
Equation [6] fit to PRCI restraint values forLS backfillEquation [6] fit to UBS LS test data
pφ ′
pφ ′
Page 29 of 33
https://mc06.manuscriptcentral.com/cgj-pubs
Canadian Geotechnical Journal

Draft
2 1
2 1
sin( ) cos( ) cos( )
cos( ) sin( ) sin( )
u
u
P R R
P R W R
α ω φ φ
α ω φ φ
− − = −
+ − = +
Fig. 7. Equilibrium formulations of Nyman (1984) and Hsu (1996)
Page 30 of 33
https://mc06.manuscriptcentral.com/cgj-pubs
Canadian Geotechnical Journal

Draft
Fig. 8. Comparison of theoretical solutions for normalized oblique lateral soil restraint (Nθ) versus
vertical oblique angle (θ) with data from testing at UBC (Note: MS = Moist sand backfill; LS =
Limestone backfill).
0
2
4
6
8
10
12
14
0 20 40 60 80
No
rmali
zed
So
il R
estr
ain
t (N
�� ��)
Angle (����) with Respect to Horizontal (degrees)
UBC MS data ( = 43°)
Equation [7] fit to UBC MS soilpropertiesUBC LS data ( = 54°)
Equation [7] fit to UBC LS soilproperties
pφ ′
pφ ′
Page 31 of 33
https://mc06.manuscriptcentral.com/cgj-pubs
Canadian Geotechnical Journal

Draft
1
List of Tables
Table 1: Summary of parameters related to test soil backfill materials
Fraser River sand Crushed Limestone Road Mulch
Average dry density
(kg/m3)
1,600 1,700 1,800
Average moisture
content (%) 3 to 4 Approx. <4% Approx. <4%
Internal peak friction
angle φ′p 43° 54° 49°-59°
Dilation angle ψ 12° 16° Not available.
ψ values corresponding with the density and effective confining stress ranges used in the soil restraint
testing.
Table 2: Details of soil restraint tests
Test
No. Pipe
Trench
details
H/D
ratio
Pulling
oblique
angle (θθθθ)
w.r.t
horizontal
Backfill
(moisture
content)
Average
backfill dry
density
(kg/m3)
1 NPS16 No
Trench 1.6 0
o Sand (4%) 1,600
2 NPS16 Trench
@45o
1.6 45° Sand (4%)
1,600
3 NPS16 No
Trench 1.6 90° Sand (4%)
1,600
4 NPS16 No
Trench 1.6 0
o Crushed
Limestone (4%) 1,700
5 NPS16 Trench
@45o
1.6 35° Crushed
Limestone (4%) 1,700
6 NPS16 Trench
@45o
1.6 45° Crushed
Limestone (4%) 1,700
7 NPS16 No
Trench 1.6 90° Crushed
Limestone (4%) 1,700
Page 32 of 33
https://mc06.manuscriptcentral.com/cgj-pubs
Canadian Geotechnical Journal

Draft
2
Table 3: Summary of soil restraint test results
Test
No.
Oblique
angle (θθθθ)
w.r.t
horizontal
H/D
ratio
Backfill
(φ′p = Effective peak friction
angle; ψ = Dilation angle)
Peak
normalized
soil restraint
Pipe
displacement
at peak
1 0o 1.6 Sand (φ′p = 43°; ψ = 12° ) 7.8 0.25D
2 45° 1.6 Sand (φ′p = 43°; ψ = 12°) 3.0 0.10D
3 90° 1.6 Sand (φ′p = 43°; ψ = 12°) 2.0 0.05D
4 0o 1.6
Crushed Limestone
(φ′p = 54°; ψ = 16°) 12.0 0.10D
5 35° 1.6 Crushed Limestone
(φ′p = 54°; ψ = 16°) 3.8 0.18D
6 45° 1.6 Crushed Limestone
(φ′p = 54°; ψ = 16°) 2.9 0.15D
7 90° 1.6 Crushed Limestone
(φ′p = 54°; ψ = 16°) 2.3 0.10D
Table 4. Summary of peak normalized soil restraint derived soil restraint testing.
Backfill type φφφφ′′′′p
Oblique
angle (θθθθ)
w.r.t
horizontal
Peak normalized soil
restraint
From
full-scale
laboratory
testing
Predicted
using
PRCI
(2009)
Moist Sand 43° 0° 7.8 8.0
90° 2.0 1.3
Crushed Limestone 54° 0° 12.0 10.6(1)
90° 2.3 1.8
Note (1): Estimated based on linear extrapolation of PRCI (2009) guidelines.
Page 33 of 33
https://mc06.manuscriptcentral.com/cgj-pubs
Canadian Geotechnical Journal