draft - university of toronto t-space · draft the effect of ... lipemia, high-intensity exercise,...
TRANSCRIPT

Draft
The effect of exercise intensity and excess post-exercise
oxygen consumption on postprandial blood lipids in physically-inactive men
Journal: Applied Physiology, Nutrition, and Metabolism
Manuscript ID apnm-2016-0581.R3
Manuscript Type: Article
Date Submitted by the Author: 15-Mar-2017
Complete List of Authors: Littlefield, Laurel; Lubbock Christian University, Exercise and Sport Sciences Papadakis, Zacharias; Baylor University, School of Education, Department of Health, Human Performance and Recreation Rogers, Katie; Baylor University, School of Education, Department of Health, Human Performance and Recreation Moncada-Jiménez, José; University of Costa Rica, Human Movement Sciences Taylor, J. Kyle; Auburn University Montgomtery, Medical & Clinical Laboratory Sciences Grandjean, Peter W.; Baylor University
Is the invited manuscript for consideration in a Special
Issue? :
Keyword: Excess Post-Exercise Oxygen Consumption, Triglycerides, Postprandial Lipemia, High-Intensity Exercise, exercise intensity < exercise
https://mc06.manuscriptcentral.com/apnm-pubs
Applied Physiology, Nutrition, and Metabolism

Draft
1 LAL is currently affiliated with Lubbock Christian University, 5601 19
th Street, Lubbock TX,
79407, [email protected]
Title
The effect of exercise intensity and excess post-exercise oxygen consumption on postprandial
blood lipids in physically-inactive men
Authors
Laurel A. Littlefield, Zacharias Papadakis, Katie M. Rogers, José Moncada-Jiminez, J. Kyle
Taylor, Peter W. Grandjean
Corresponding Author
Laurel A. Littlefield, Exercise and Sport Sciences, Lubbock Christian University, 5601 19th
Street, Lubbock, TX, 79407, 806-720-7865, [email protected]
Author Affiliations
LAL1, ZP, KMR, PWG: College of Health & Human Sciences, HHPR, One Bear Place #97313,
Baylor University, Waco, TX 76798; [email protected], [email protected],
[email protected], [email protected]
JMJ: Department of Human Movement Sciences, Human Movement Sciences Research Center,
University of Costa Rica, San José, Costa Rica, P.O. Box 239-1200; [email protected]
JKT: Medical & Clinical Laboratory Sciences, Auburn University Montgomery, P.O. Box
244023, Montgomery, AL, 36124; [email protected]
Page 1 of 34
https://mc06.manuscriptcentral.com/apnm-pubs
Applied Physiology, Nutrition, and Metabolism

Draft
Exercise Intensity and Postprandial Lipemia 2
ABSTRACT
Background: Reductions in postprandial lipemia have been observed following aerobic exercise
of sufficient energy expenditure. Increased excess post-exercise oxygen consumption (EPOC)
has been documented when comparing high- versus low-intensity exercise. The contribution of
EPOC energy expenditure to alterations in postprandial lipemia has not been determined.
Objective: The purpose of this study was to evaluate the effects of low- and high-intensity
exercise on postprandial lipemia in healthy, sedentary, overweight and obese men (43 + 10 years;
31.1 + 7.5 ml/kg/min; 31.8 + 4.5 kg/m2) and to determine the contribution of EPOC to reductions
in postprandial lipemia.
Design: Participants completed 4 conditions: non-exercise control, low-intensity exercise at 40-
50% VO2R (LI), high-intensity exercise at 70-80% VO2R (HI), and HI plus EPOC re-feeding (HI
+ EERM) where the difference in EPOC energy expenditure between LI and HI was re-fed in the
form of a sports nutrition (Power Bar ®) bar. Two hours following exercise participants ingested
a high-fat (1,010 kcals, 99g sat fat) test meal. Blood samples were obtained before exercise,
before the test meal, and at 2-, 4- and 6- hours postprandially.
Results: Triglyceride incremental area-under-the-curve (AUCI) was significantly reduced
following LI, HI and HI + EERM when compared to non-exercise control (p < 0.05) with no
differences between the exercise conditions (p > 0.05).
Conclusions: Prior LI and HI exercise equally attenuated postprandial triglyceride responses to
the test meal. The extra energy expended during EPOC does not contribute significantly to
exercise energy expenditure or to reductions in postprandial lipemia in overweight men.
Key Words: Postprandial Lipemia, Postprandial Blood Lipids, Triglycerides, Excess-Post
Exercise Oxygen Consumption (EPOC), Exercise Intensity, High-Intensity Exercise
Page 2 of 34
https://mc06.manuscriptcentral.com/apnm-pubs
Applied Physiology, Nutrition, and Metabolism
Draft
Exercise Intensity and Postprandial Lipemia 3
INTRODUCTION
Exaggerated elevations in postprandial triglycerides are associated with increased risk for
the development of cardiovascular disease (CVD) and are observed in coronary heart disease
(CHD), hypertension, and metabolic syndrome (MetS) (Bansal, et al., 2007, Karpe, et al., 1999,
Kolovou, et al., 2003, Nordestgaard, et al., 2007, Patsch, et al., 1992). High plasma triglycerides
are associated with increased triglyceride-rich lipoprotein remnants (TRL), small, dense low-
density lipoprotein cholesterol (LDLC) and oxidized LDLC, and are inversely associated with
high-density lipoprotein cholesterol (HDLC) levels (Kathiresan, et al., 2006, Kolovou, et al.,
2011, Park, et al., 2011, Zilversmit, 1995). Collectively, these atherogenic lipid abnormalities
promote the development of CVD.
Aerobic exercise performed 1 to 16 hours prior to meal ingestion reduces postprandial
lipemia (Aldred, et al., 1994, Gill, et al., 1998, Petitt and Cureton, 2003, Zhang, et al., 2004).
The positive effect of exercise in mitigating postprandial lipemia has been observed following
high-fat or mixed test meals with varying macronutrient composition. The fat content of
individual test meals has ranged from approximately 35 – 90% of the total calories consumed in
one sitting (Burton, et al., 2008, Gill, et al., 1998, Kolovou, et al., 2011, Zhang, et al., 2004).
Gill, et.al, (1998) was the first to suggest that the positive effect of exercise on postprandial
lipemia is mediated, in part, by the energy expenditure of the exercise session. Exercise of
varying intensities and durations yield similar significant reductions in postprandial triglycerides
when sessions are isocaloric (Mestek, et al., 2008, Tsetsonis and Hardman, 1996). Furthermore,
exercise sessions that elicit greater caloric expenditure, by increased intensity or duration,
enhance reductions in postprandial lipemia (Gill, et al., 2002, Tsetsonis and Hardman, 1996). An
exception to this observation comes from Katsanos, et.al, (2004) where exercise at 65% of
Page 3 of 34
https://mc06.manuscriptcentral.com/apnm-pubs
Applied Physiology, Nutrition, and Metabolism
Draft
Exercise Intensity and Postprandial Lipemia 4
VO2peak was shown to be superior to exercise at 25% of VO2peak for lowering postprandial
triglycerides, despite equal energy expenditure of the exercise sessions. A lower volume of
exercise appears to be sufficient to lower postprandial triglycerides when maximal or near-
maximal intensity exercise is utilized (Freese, et al., 2011). Together, these studies suggest that
there may be additional benefit to performing higher intensity exercise over lower or moderate-
intensity exercise for lowering postprandial triglycerides.
When the energy that was expended during exercise is replaced by increasing caloric
consumption through mixed-meal supplements that contain approximately 35% of calories from
fat, the positive effect of exercise on lowering postprandial triglycerides is attenuated but not
abolished (Burton, et al., 2008, Freese, et al., 2011). Although low-, moderate-, and high-
intensity exercise sessions may qualify as isocaloric, exercise of greater intensity has been shown
to facilitate increased excess post-exercise oxygen consumption (EPOC) when compared to
exercise of lower intensity, resulting in a greater overall energy expenditure following high-
intensity exercise (Borsheim and Bahr, 2003). The difference in EPOC following exercise of
moderate- and high- intensity has not been quantified with the intention of determining its
contribution to changes in postprandial lipemia. EPOC has been estimated when replacing the
energy expenditure of exercise, yet no studies have specifically examined its individual
contribution to reducing postprandial lipemia. When energy balance has been manipulated by
reducing caloric consumption, postprandial triglycerides are favorably altered, however to a
lesser extent when compared to an exercise induced energy deficit (Gill and Hardman, 2000,
Maraki and Sidossis, 2010). It remains to be determined whether replacing the caloric
expenditure incurred in EPOC affects postprandial lipemia.
Page 4 of 34
https://mc06.manuscriptcentral.com/apnm-pubs
Applied Physiology, Nutrition, and Metabolism

Draft
Exercise Intensity and Postprandial Lipemia 5
Low- intensity aerobic exercise at 35 to 45% VO2peak significantly lowers postprandial
lipemia, while an isocaloric session of exercise at 60 to 70% of VO2peak was shown to lower
postprandial triglycerides non-significantly in men with MetS (Mestek, et al., 2008). The effects
of higher-intensity exercise (at or above 70% VO2peak) on postprandial lipemia have not been
examined in sedentary, overweight males. The purpose of this study was to evaluate the effects
of low- and high-intensity exercise on postprandial lipemia in sedentary overweight men and to
determine the contribution of EPOC to reductions in postprandial lipemia.
MATERIALS AND METHODS
Subjects
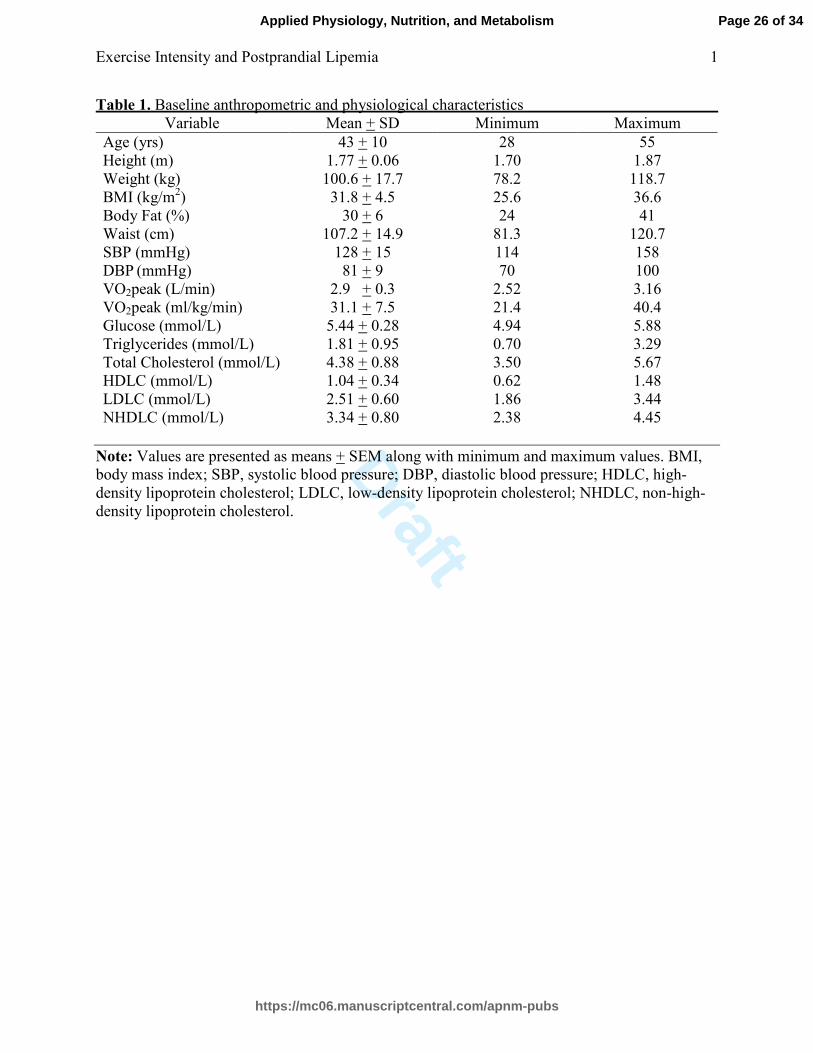
Participant characteristics are presented in Table 1. Middle-aged, obese and overweight
men were recruited via informational flyers and e-mails. All participants were sedentary,
reporting that they engaged in less than 2.5 hours per week of low to moderate physical activity
and were free of cardiovascular and metabolic disease. Participants were weight stable, non-
smokers, were not taking any medication known to affect glucose or lipid metabolism, were
lactose tolerant, and were free from orthopedic injury that would limit walking or jogging on a
treadmill. All procedures were reviewed and approved by the Internal Review Board (IRB) at
Baylor University and each participant gave written, informed consent before the study began.
Prior to subject recruitment a power analysis was conducted to determine the number of
participants necessary to maintain power at 0.8 at an alpha level of 0.05. Effect sizes from
studies that employed similar study design and population criteria were calculated using the 4-
hour triglyceride concentration values following non-exercise control and exercise interventions
as primary variables of interest. The calculated effect size was 0.98, and it was determined that 6
participants were needed for analysis.
Page 5 of 34
https://mc06.manuscriptcentral.com/apnm-pubs
Applied Physiology, Nutrition, and Metabolism

Draft
Exercise Intensity and Postprandial Lipemia 6
Preliminary Screening
A phone interview was conducted to assess the volunteer’s age, physical activity habits,
and disease state. Volunteers who met entry criteria visited the lab on 2 occasions thereafter.
Participants completed a health-history questionnaire that was reviewed by a physician prior to
exercise testing.
After an 8- to 10-hour fast a small blood sample (17 ml) was obtained by venipuncture
from an antecubital vein for the determination of baseline blood glucose and lipids (Becton
Dickinson (BD) Vacutainer, Franklin Lakes, NJ, USA, SST 16 x 100 mm, 7.5 mg). Body
composition was determined using dual-energy x-ray absorptiometry (DXA) (Hologic, Bedford,
MA, USA). Participants performed a standardized maximal graded exercise test on a treadmill
using the modified Bruce protocol to determine their cardiovascular fitness (Bruce, et al., 1973).
The cardiovascular response to exercise was determined using continuous 12- lead
electrocardiography (Cardio Control, Welch Allyn, Skaneateles, NY, USA). VO2peak was
determined via respiratory gas analysis throughout the graded exercise test and was defined as
the highest VO2 maintained for one minute (ParvoMedics, Sandy, UT, USA). Two of 3 criteria
were required for validation of maximal effort: 1) heart rate within 10 beats of age predicted
maximum; 2) rating of perceived exertion ≥ 18, or; 3) respiratory exchange ratio (RER) ≥ 1.15.
The maximum heart rate and VO2peak obtained from the participant’s graded exercise test was
used to determine exercise intensities that are equal to 40-50% and 70-80% of heart rate reserve
(HRR) and VO2 reserve (VO2R) (Karvonen, et al., 1957). Participants who met all inclusion
criteria and were cleared to exercise based on a normal cardiovascular response to exercise as
reviewed by the physician were asked to continue to take part in the study.
Page 6 of 34
https://mc06.manuscriptcentral.com/apnm-pubs
Applied Physiology, Nutrition, and Metabolism

Draft
Exercise Intensity and Postprandial Lipemia 7
Participants were instructed to keep detailed records of their diet and physical activity
habits for 3 days leading up to each trial. The records submitted before the initial experimental
condition were replicated as closely as possible for all subsequent trials. Failure to comply with
replication of dietary and physical activity habits was established a priori as an exclusion criteria
due to the potential confounding influence of these variables on postprandial lipemia. Dietary
intake and macronutrient composition were analyzed using nutritional analysis software (Food
Processor, SLQ, Version 10.7, ESHA Research, Salem, OR, USA).
Experimental Trials
Overview
Each participant performed 4 experimental trials: non-exercise control (CON), low-
intensity exercise (LI) at 40 to 50% VO2R, high-intensity exercise (HI) at 70 to 80% VO2R, and
high-intensity exercise + EPOC energy replacement (HI + EERM). Testing order was
randomized except for the fourth and final trial where the EPOC energy difference between LI
and HI was replaced. The fourth trial was not randomized due to the necessity of determining
the EPOC energy expenditure difference between LI and HI prior to energy replacement. Each
condition was separated by at least 5 days and no more than 14 days. On the morning of each
trial, the participants reported to the lab in the morning after a 12-hour fast limited to water
intake only. Each was measured for height and weight (SECA, Hamburg, Germany), and fitted
with a heart rate monitor (Polar, Lake Success, NY, USA). Heart rate and blood pressure were
measured after 5 minutes of seated rest. All experimental trials began in the morning between
approximately 7 and 9 a.m., and successive trials for each participant were standardized to begin
at the same time of day. A high-fat test meal in the form of a milk shake was consumed
following respiratory gas analysis in CON and 2 hours following each exercise session in LI, HI
Page 7 of 34
https://mc06.manuscriptcentral.com/apnm-pubs
Applied Physiology, Nutrition, and Metabolism

Draft
Exercise Intensity and Postprandial Lipemia 8
and HI + EERM. Blood samples were obtained prior to the determination of resting energy
expenditure, immediately before the high-fat meal and at 2, 4 and 6 hours postprandially.
Exercise Interventions
Participants sat upright and respiratory gasses were measured for 15 minutes using a
portable respiratory gas analysis system (VO2000, Medgraphics, St. Paul, MN, USA). The final
10 minutes of oxygen consumption were averaged and used for the calculation of resting caloric
expenditure. Participants were then asked to walk or jog on a treadmill in order to expend 500
calories of energy. Warm-up consisted of walking for 3 minutes at 2.5 miles per hour and a 2%
grade.
The approximate time needed for each session and the rate of caloric expenditure was
estimated before each session using the oxygen consumption data obtained from the participant’s
graded exercise test and a 5 kilocalorie (kcal)*L-1
of O2 equivalent (Karvonen, et al., 1957).
During the HI session participants were asked to exercise continuously at 70-80% of VO2R for
approximately 45-60 minutes. During the LI session participants were asked to exercise
continuously at 40-50% VO2R for approximately 70-90 minutes. Respiratory gasses were
measured regularly at approximate 10-15 minute intervals to verify oxygen consumption and to
determine that a 500 calorie energy expenditure had been achieved. During both HI and LI heart
rate was measured continuously.
After LI and HI, EPOC was determined from respiratory gasses measured while the
participant sat quietly for 2 hours or until the participant’s oxygen consumption, averaged over
10-minute intervals, reached resting values obtained prior to the exercise session. Oxygen
consumption was averaged over 1-minute intervals and was used to calculate caloric
expenditure. Immediately after the final HI session, participants consumed a meal with a caloric
Page 8 of 34
https://mc06.manuscriptcentral.com/apnm-pubs
Applied Physiology, Nutrition, and Metabolism

Draft
Exercise Intensity and Postprandial Lipemia 9
content equal to the difference in calories spent in the hours after the LI and HI sessions. This
meal was a portioned amount of a commercially available meal bar. (Peanut Butter Power Bar ®:
240 kcals, 4 g fat, 44 g carbohydrate, 9 g protein).
Non-Exercise Control
Participants sat upright and respiratory gasses were measured using a portable respiratory
gas analysis system for 45 minutes. The final 10 minutes of resting data were averaged for the
determination of resting oxygen consumption. This measurement allowed for the estimation of
caloric expenditure under fasting and non-exercised conditions.
Test Meal
Participants consumed the test meal within 15 minutes of the pre-meal blood draw. The
high-fat milk shake was composed of 255 mL of whipping cream and 74 g of ice cream (1,010
kcals, 100 g fat, 99 g saturated fat, 17 g carbohydrate and 3 g protein) (Mestek, et al., 2008,
Plaisance, et al., 2008, Zhang, et al., 1998).
Blood Sampling
Blood samples were obtained prior to determination of resting energy expenditure,
immediately before ingesting the high-fat test meal, and again at 2, 4, and 6 hours postprandially
(BD Vacutainer, Franklin Lakes, NJ, USA, 16 x 100 mm; BD Vacutainer, Franklin Lakes, NJ,
USA, 13 x 75 mm, K2EDTA). A plastic catheter (BD Vacutainer, Franklin Lakes, NJ, USA, 0.9
* 25 mm) was inserted into the antecubital vein and an intermittent injection site was attached
(Kawasumi Laboratories, Inc., Tokyo, Japan).
Following each blood draw sodium heparin was injected to maintain patency (Heparin
Lock Flush, 10 USD units/mL, APP Pharmaceuticals, Schaumburg, IL, USA). Prior to sampling
before the test meal and at 2, 4 and 6 hours, a small amount of blood was removed to ensure no
Page 9 of 34
https://mc06.manuscriptcentral.com/apnm-pubs
Applied Physiology, Nutrition, and Metabolism

Draft
Exercise Intensity and Postprandial Lipemia 10
sodium heparin contaminated the samples. At each sampling point 4 microcapillary tubes were
filled with blood and centrifuged at 3900 X g for 15 minutes to determine hematocrit and assess
alterations in fluid volume (75 mm Hematocrit Tubes, Drummond, Broomall, PA, USA;
ZipOcrit LW Scientific, Lawrenceville, GA, USA) (Van Beaumont, 1973). Vacutainers were
allowed to clot on ice for 30 minutes before being centrifuged at 3500 X g for 15 minutes
(Clinical 50, VWR, Randor, PA, USA). Serum and plasma were aliquoted into 2.0 mL plastic
ultracentrifuge tubes and stored at - 80.0°C.
Sample Analyses
Triglyceride, insulin, HDLC, non-esterified fatty acids (NEFA), non-HDLC, total
cholesterol (TC), apolipoproein B (ApoB), and apolipoprotein A (ApoA) were measured from
plasma and serum samples. Homeostatic model assessment (HOMA) and glucose to insulin
ratio (G/I ratio) were calculated to assess insulin resistance in the fasted state [HOMA = fasting
glucose (mg/dl)/fasting insulin (mU/mL) * 22.5; G/I ratio = fasting glucose (mg/dl)/fasting
insulin concentration (mU/mL)] (Matthews, et al., 1985). Triglycerides, total cholesterol, LDLC
and glucose were determined enzymatically (Siemens Vista Autoanalyzer, Malvern, PA, USA).
NEFA was determined enzymatically as described by Wako Diagnostics (Wako Diagnostics,
Richmond, VA, USA). The intra-assay coefficients of variation for triglycerides, total
cholesterol, LDLC, glucose and NEFA were 1.5%, 2.5%, 3.1%, 1.8%, and 2.9%, respectively.
HDLC was determined by immunoinhibition colorimetrically as described by Siemens (Siemens
Vista Autoanalyzer, Malvern, PA, USA). The intra-assay coefficient of variation for HDLC was
3.1%. ApoB and ApoA1 were determined by immunoinhibition, and the ApoB/A1 ratio was
calculated by dividing Apo B by ApoA1. The intra-assay coefficients of variation for ApoB and
ApoA1 were 2.4% and 2.6 %. The non-HDLC was calculated by subtracting HDLC from total
Page 10 of 34
https://mc06.manuscriptcentral.com/apnm-pubs
Applied Physiology, Nutrition, and Metabolism

Draft
Exercise Intensity and Postprandial Lipemia 11
cholesterol. Insulin was determined by enzyme linked immunosorbent assay (ELISA) (Siemens
Vista Autoanalyzer, Malvern, PA, USA). The intra-assay coefficient of variation for insulin was
2.1%.
Statistical Analyses
The mean triglyceride value at each time point was used to analyze postprandial changes
in triglycerides. Additionally, the total (AUCT) and incremental (AUCI) areas under the curve
were calculated using the trapezoidal rule and the equations detailed below (Matthews, et al.,
1990). The AUCI was used to reflect the postprandial triglyceride area under the curve response
while accounting for fasting triglyceride concentrations. Total and incremental areas under the
curve were calculated to examine differences in insulin concentration between conditions.
AUCT (mmol * L -1
* 6 h) = nB + 2[n2 + n4] + n6 (Total)
AUCI (mmol * L -1
* 6 h) = 2[n2 + n4] + n6 – 5nB (Incremental)
Proc Univariate procedures were performed to determine data distribution. Differences in
fasting triglyceride concentrations, AUCT and AUCI were determined using separate repeated
measures analysis of variance (ANOVA). Temporal alterations in insulin, HDLC, NEFA, non-
HDLC, total cholesterol, ApoB, and ApoA were examined using repeated measures ANOVA’s.
Additionally, AUCT and AUCI were calculated to assess postprandial alterations in insulin
concentrations. Follow-up was performed by using Duncan’s New Multiple Range test when
significant differences were observed between groups. Statistical Analysis Software (SAS,
Version 9.2, Cary, NC, USA) was utilized for analysis of data and comparison wise alpha level
of p < 0.05 was considered statistically significant.
Page 11 of 34
https://mc06.manuscriptcentral.com/apnm-pubs
Applied Physiology, Nutrition, and Metabolism

Draft
Exercise Intensity and Postprandial Lipemia 12
RESULTS
Dietary Intake and Fasting Physiologic Parameters
Nine men were recruited to participate, however, after completing the study and
following analysis of dietary records, it was determined that 2 participants participated in
activities prior to the control trial that could not be replicated prior to the other experimental
conditions and had strong potential to affect the blood lipid response to the high-fat test meal.
One of these participants reported consuming a high-calorie meal that contained alcohol prior to
the control trial, and the other participant reported gastrointestinal distress in the hours leading
up to and during the control trial. For this reason, data is presented for the 7 individuals who
were able to closely replicate dietary and physical activity habits leading up to each experimental
trial. Physiologic variables across conditions are presented in Table 2. Analysis of variables in
the fasted state before each of the experimental trials confirmed that participants began each trial
under similar physiologic conditions. Body weight, glucose, insulin, HOMA score, G/I ratio,
and resting energy expenditure were not significantly different between the experimental
conditions (p > 0.05 for all variables). Reported intake of total calories, macronutrients, and the
polyunsaturated/saturated fat ratio were not different between the 4 conditions.
Responses to Treadmill Exercise
Characteristics of each exercise session are presented in Table 3. The caloric
expenditures of the LI, HI, and HI + EERM exercise trials were each approximately 500 calories,
with no significant differences between the conditions (p = 0.975). The exercise time for both
high-intensity trials averaged 47 + 2 minutes, and, by design, the mean exercise time for the LI
session was significantly longer, at 74 + 2 minutes (p < 0.0001). Participants achieved
intensities of 39.1 + 0.6% for LI, and 69.3 + 1.5, and 70.3 + 2.9% of VO2peak during the high-
Page 12 of 34
https://mc06.manuscriptcentral.com/apnm-pubs
Applied Physiology, Nutrition, and Metabolism

Draft
Exercise Intensity and Postprandial Lipemia 13
intensity trials (p < 0.0001). The relative exercise intensities and average RER during the high-
intensity trials were statistically similar, and were significantly higher than those measured in the
LI trial as expected (Intensity, p < 0.0001; RER, p < 0.001). Average heart rate was significantly
different between the three conditions: 112 + 5 (LI), 149 + 6 (HI), and 140 + 5 (HI + EERM) (p
< 0.0001). All participants were able to complete each of the exercise trials with no adverse
events.
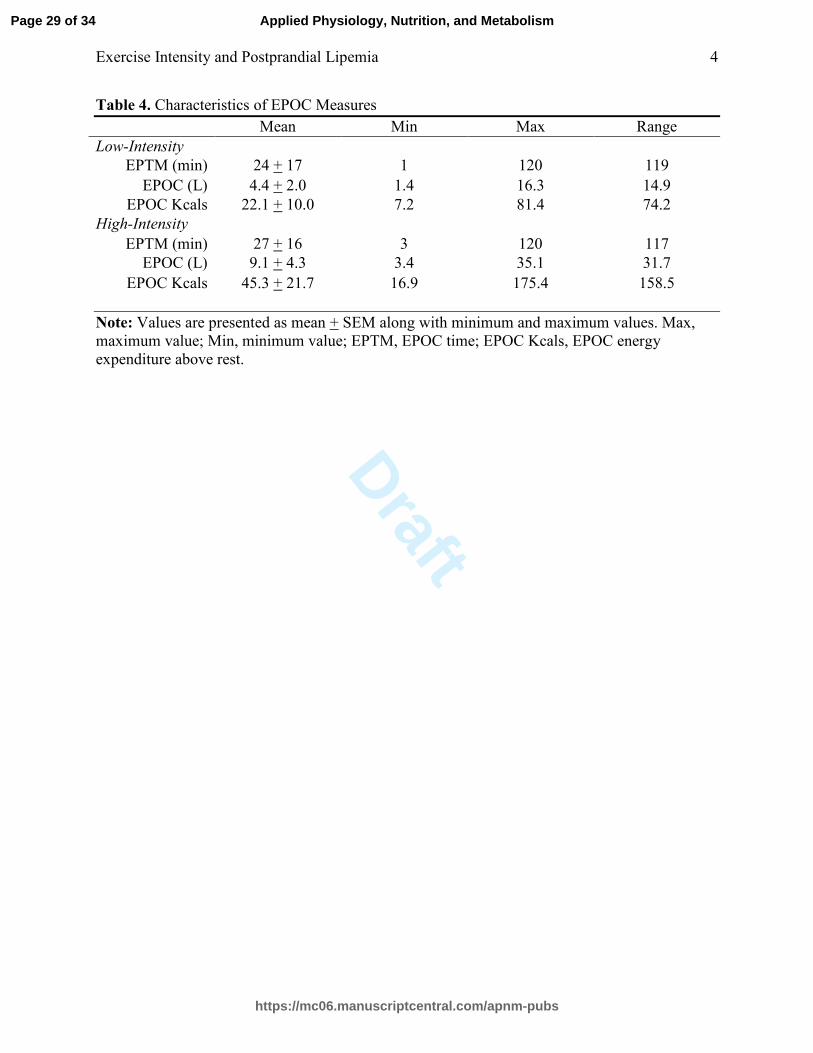
Results for EPOC measurements are presented in Table 4. Following LI and HI exercise,
oxygen consumption was elevated above rest for an average of and 24 + 17 and 27 + 16 minutes
(p = 0.119). EPOC was more than 2-times higher following HI when compared to LI exercise
(9.1 + 4.3 L vs. 4.4 + 2.0 L), yet there was no statistically significant difference between the
conditions (p = 0.098). The energy expenditures resulting from EPOC following HI and LI
exercise were equal to 45.3 + 21.7 and 22.0 + 10.0 calories (p = 0.099). There were no
statistically significant differences in EPOC time or calories expended during EPOC between
exercise conditions.
Postprandial and Fasting Blood Lipid Responses
There were no statistically significant changes in plasma volume across conditions or
time points, therefore, values presented are derived from unadjusted data. (p = 0.256).
The temporal triglyceride response is presented in Figure 1. At 4 hours, triglyceride
concentrations were significantly reduced below CON values for both the LI and HI exercise
trials, with no significant difference between the control and HI + EERM. Six hours after LI, a
significantly reduced triglyceride response was observed when compared to CON (triglyceride
by time, p < 0.0001).
Page 13 of 34
https://mc06.manuscriptcentral.com/apnm-pubs
Applied Physiology, Nutrition, and Metabolism

Draft
Exercise Intensity and Postprandial Lipemia 14
Triglyceride AUCI is depicted in Figure 2. For both total and incremental areas under the
curve, the LI, HI, and HI + EERM trials were significantly lower when compared to the control
trial (AUCT, p < 0.05; AUCI, p < 0.05). No statistically significant differences were found for
total or incremental triglyceride responses between the 3 exercise conditions.
The temporal NEFA responses to exercise are presented in Figure 3. NEFA
concentrations decreased at 2 hours, and rose at hours 4 and 6 under all conditions. At 0 and 2
hours, NEFA concentrations were significantly higher during each exercise condition when
compared to control.
The temporal responses of TC, HDLC, ApoB, ApoA1, and the ApoB/A1 ratio are
presented in Table 5. HDLC was decreased during the postprandial period significantly at both 2
and 4-6 hours when compared to baseline (p < 0.0001). Apo B and the ApoB/A1 ratio rose
significantly across time points as early as 2 hours into the postprandial period (ApoB, p <
0.0001; ApoB/A1 ratio, p < 0.05). ApoA1 was significantly elevated at 4 and 6 hours
postprandially (p < 0.05)
Fasting and Postprandial Glucose and Insulin Responses
Insulin concentrations were statistically similar between the conditions, but a main effect
was found for time, with the 2-hour postprandial insulin concentrations significantly higher than
all other time points across conditions. Likewise, glucose levels did not differ significantly
across conditions, but a significant interaction was found for time, with significantly lower
values observed at 4 and 6 hours when compared 0 and 2-hour time points (p < 0.0001). Total
and incremental areas under the curve for insulin were not significantly different between any of
the 4 conditions (total, p = 0.824; incremental, p = 0.061).
Page 14 of 34
https://mc06.manuscriptcentral.com/apnm-pubs
Applied Physiology, Nutrition, and Metabolism

Draft
Exercise Intensity and Postprandial Lipemia 15
DISCUSSION
Our findings indicate that, in sedentary, overweight men, exercise of a 500 calorie energy
expenditure at both 40 to 50% and 70 to 80% of VO2R is sufficient to favorably alter the
postprandial hypertriglyceridemia incurred following a high fat meal. Contrary to our hypothesis,
HI was not superior to LI in lowering postprandial triglycerides. Our results also demonstrate
that differences in EPOC between low- and high- intensity exercise did not contribute
substantially to alterations in postprandial lipemia.
Our findings are in agreement with other studies that have indicated exercise resulting in
a 500-calorie energy expenditure significantly lowers postprandial triglycerides (Maraki and
Sidossis, 2013). Zhang, et.al, (2007) has shown that exercise at 60% of VO2peak lowers
postprandial triglycerides when 45 or 60 minutes is performed, but not 30 minutes in men with
MetS. The energy expenditures of these sessions were approximately 450, 597 and 300 calories,
respectively. These findings agree with our own, suggesting that exercise at 60 to 70% of
VO2peak with a 450 to 500 calorie energy expenditure produces statistically significant changes
in postprandial triglycerides in unfit men. Mestek, et.al, (2008) has shown that, when compared
to non-exercise control, exercise resulting in a 500 calorie energy expenditure and averaging
39% of VO2peak significantly lowers postprandial triglyceride AUCI by 27%, while exercise at
63% lowers triglycerides similarly, although not significantly by 20% in men with MetS. Our
work adds to these findings by demonstrating that exercise at a higher relative percentage of
VO2peak (69 to 70 compared to 63% of VO2peak) results in similar reductions in postprandial
triglycerides compared to low-intensity exercise (39% of VO2peak). In contrast to Mestek, et al.,
(2008), we found the reduction in postprandial triglycerides to be significant following low- and
high-intensity exercise when compared to non-exercise control, with reductions in triglyceride
Page 15 of 34
https://mc06.manuscriptcentral.com/apnm-pubs
Applied Physiology, Nutrition, and Metabolism

Draft
Exercise Intensity and Postprandial Lipemia 16
AUCI of 31% following LI and 27% following HI. This finding may indicate that there is,
indeed, a benefit to performing high-intensity exercise. However, subtle differences in study
design related to meal timing may have contributed to the disparity in our findings. Our
participants ingested the high-fat meal 2 hours following exercise, while in Mestek’s study
approximately 12 hours separated exercise and meal ingestion.
Our findings may seem contradictory to others who have shown exercise intensity to be a
factor in lowering postprandial triglycerides. Katsanos, et. al. (2004) reported finding a
significantly lower triglyceride response following moderate- (65%) when compared to low-
intensity (25%) exercise. However, in the former study physically active participants with a
substantially higher VO2peak were examined, and the intensities in the two exercise trials
differed by 40% of VO2peak (Katsanos, et al., 2004, Trombold, et al., 2013). The absolute
differences in oxygen consumption attained by Katsanos, et al., between the low- and moderate-
intensity trials were greater than that achieved in our study.
Additional evidence supporting the use of high- versus low- or moderate- intensity
exercise for lowering postprandial lipemia comes from studies that have examined near-maximal
or maximal-intensity exercise (Freese, et al., 2011, Trombold, et al., 2013). While our findings
may seem contrary and do not suggest a benefit to performing high- over low- intensity exercise
in the context of lipid alterations, we examined continuous exercise at a lower intensity, with the
high-intensity session averaging approximately 70% of VO2peak. We maintained RER values
below 1.0 for all participants during the high-intensity trial and, for multiple subjects, it was not
possible to maintain a workload that elicited an exercise intensity close to 80% of VO2peak
without increasing the RER to at or near 1.0. Maintaining a continuous intensity of aerobic
exercise in order to expend the threshold (450 to 500) number of calories required to positively
Page 16 of 34
https://mc06.manuscriptcentral.com/apnm-pubs
Applied Physiology, Nutrition, and Metabolism

Draft
Exercise Intensity and Postprandial Lipemia 17
affect postprandial lipemia at intensity higher than 70% may not be possible for many untrained
subjects. Because a lower volume of exercise may be sufficient to lower postprandial
triglycerides when exercise is near maximal intensity, the effects of maximal or near maximal
interval exercise on postprandial lipemia in overweight males should be determined.
Although the differences were not statistically significant, EPOC was 210% higher
following HI when compared to LI, increasing from 9.1 to 4.4 L. These findings are similar to
others reported in the literature (Gore and Withers, 1990, Phelain, et al., 1997). Borsheim and
Bahr (2003) have conducted an extensive review of the literature on EPOC and have concluded
that exercise intensity makes the greatest contribution to EPOC. Our participants were of low
cardiovascular fitness, with an average VO2peak of 31.1 + 7.5, representing the 10th
percentile
for men between the ages of 40 and 49, and thus the absolute VO2 that each participant was able
to maintain continuously during HI was relatively low compared to those of average or high-
fitness (Pescatello, 2013). Thus, HI for these participants may have produced a smaller EPOC
than would have been observed for an individual capable of maintaining a higher oxygen
consumption continuously. Although EPOC is indeed elevated to a greater extent following HI
when compared to LI exercise, the differences are not robust enough to drastically increase
energy expenditure at the intensities utilized.
Re-feeding the caloric difference that resulted from EPOC between low- and high-
intensity exercise did not significantly affect the ability of exercise to positively impact
postprandial lipemia. Three previous studies have shown that, when the energy that was
expended during exercise is fully replaced by increasing caloric intake, the positive effects of
exercise on lowering postprandial lipemia is significantly lessened but not abolished (Burton, et
al., 2008, Freese, et al., 2011, Harrison, et al., 2009). Our work adds to these findings by
Page 17 of 34
https://mc06.manuscriptcentral.com/apnm-pubs
Applied Physiology, Nutrition, and Metabolism

Draft
Exercise Intensity and Postprandial Lipemia 18
demonstrating that the caloric expenditure of EPOC alone is not sufficient to affect postprandial
triglycerides when exercise is performed at 39 and 70% of VO2peak. We re-fed a small meal to
our participants, with a mean of 23.2 calories, compared with approximately 670, 1,500 and 260
calories in the previously mentioned re-feeding studies (Burton, et al., 2008, Freese, et al., 2011,
Harrison, et al., 2009).The caloric threshold at which re-feeding negates the positive effect of
exercise energy expenditure on postprandial triglycerides remains to be determined.
While the decrements in postprandial lipemia appear to be mediated by energy
expenditure and energy intake, the precise mechanisms responsible remain elusive and were not
directly investigated in this study. Likely candidates include reduced hepatic VLDL secretion
and increased lipoprotein lipase (LPL) activity (Dekker, et al., 2010). LPL activity has been
shown to be increased from 4 to 24 hours following exercise at 60 to 75% of VO2peak (Greiwe,
et al., 2000, Kiens, et al., 1989, Nilsson-Ehle, et al., 1980). In obese men, moderate exercise
performed the day before a high-fat meal results in increased clearance of VLDL particles when
compared to non-exercise control (Al-Shayji, et al., 2012). In addition, a 500 calorie energy
expenditure results in increased clearance of VLDL particles in addition to decreased hepatic
VLDL production in women (Bellou, et al., 2012). It is likely that increased triglyceride
clearance and/or reduced hepatic VLDL secretion contributed to our findings.
Prior moderate-intensity exercise has been shown to lower postprandial insulin
concentrations, a finding that we did not observe (Katsanos, et al., 2004). While decreased
insulin concentration is associated with increased skeletal muscle LPL activity, others have
reported reductions in postprandial lipemia in the absence of reduced insulin concentration
(Kiens, et al., 1989, Mestek, et al., 2008). Our test meal was relatively low in carbohydrate (17
grams) and consisted primarily of fatty acids. It is possible that the insulin response would have
Page 18 of 34
https://mc06.manuscriptcentral.com/apnm-pubs
Applied Physiology, Nutrition, and Metabolism

Draft
Exercise Intensity and Postprandial Lipemia 19
differed had the meal had higher carbohydrate content. Although reduced insulin concentration
may be permissive in allowing increased LPL activity, increased post-heparin LPL activity has
been observed in the absence of significantly reduced insulin levels and postprandial
triglycerides have been shown to be lowered even in the absence of significant increases in
muscle LPL activity (Herd, et al., 2001, Katsanos, et al., 2004).
While the CON, LI and HI trials were completed in randomized order, because of our
research questions it was not possible to randomize the fourth and final exercise condition. It was
necessary for participants to complete both exercise trials so that EPOC energy expenditure
could be determined and the difference in caloric expenditure during EPOC following LI and HI
replaced. We do not believe that the inability to randomize the re-feeding trials has bearing on
our findings, as the HI + EERM trial was identical to the first high-intensity exercise session
completed, and caloric expenditure between the 3 exercise conditions was statistically similar.
In conclusion, we found that continuous exercise at 39 and 69-70% of VO2peak significantly
and similarly lowers postprandial triglycerides following a high fat meal in sedentary,
overweight men. Our results indicate that EPOC does not make a primary contribution to the
favorable effects of exercise on reducing postprandial lipemia. Low- or high- intensity exercise
can be recommended to sedentary individuals for reducing postprandial triglycerides.
Disclaimer
The authors report no conflicts of interest associated with this manuscript.
Page 19 of 34
https://mc06.manuscriptcentral.com/apnm-pubs
Applied Physiology, Nutrition, and Metabolism

Draft
Exercise Intensity and Postprandial Lipemia 20
REFERENCES
Al-Shayji, I. A., Caslake, M. J. and Gill, J. M. 2012. Effects of moderate exercise on VLDL(1)
and Intralipid kinetics in overweight/obese middle-aged men. Am. J. Physiol. Endocrinol.
Metab, 302 (3): E349-55. 10.1152/ajpendo.00498.2011.
Aldred, H. E., Perry, I. C. and Hardman, A. E. 1994. The effect of a single bout of brisk walking
on postprandial lipemia in normolipidemic young adults. Metabolism, 43 (7): 836-41.
Bansal, S., Buring, J. E., Rifai, N., Mora, S., Sacks, F. M. and Ridker, P. M. 2007. Fasting
compared with nonfasting triglycerides and risk of cardiovascular events in women.
JAMA, 298 (3): 309-16. 10.1001/jama.298.3.309.
Bellou, E., Siopi, A., Galani, M., Maraki, M., Tsekouras, Y. E., Panagiotakos, D. B., Kavouras,
S. A., Magkos, F. and Sidossis, L. S. 2012. Acute Effects of Exercise and Calorie
Restriction on Triglyceride Metabolism in Women. Med. Sci. Sports. Exerc,
10.1249/MSS.0b013e318278183e.
Borsheim, E. and Bahr, R. 2003. Effect of exercise intensity, duration and mode on post-exercise
oxygen consumption. Sports Med, 33 (14): 1037-60.
Bruce, R. A., Cooper, M. N., Gey, G. O., Fisher, L. D. and Peterson, D. R. 1973. Variations in
responses to maximal exercise in health and in cardiovascular disease. Angiology, 24
(11): 691-702.
Burton, F. L., Malkova, D., Caslake, M. J. and Gill, J. M. 2008. Energy replacement attenuates
the effects of prior moderate exercise on postprandial metabolism in overweight/obese
men. Int. J. Obes. (Lond), 32 (3): 481-9. 10.1038/sj.ijo.0803754.
Page 20 of 34
https://mc06.manuscriptcentral.com/apnm-pubs
Applied Physiology, Nutrition, and Metabolism

Draft
Exercise Intensity and Postprandial Lipemia 21
Dekker, M. J., Graham, T. E., Ooi, T. C. and Robinson, L. E. 2010. Exercise prior to fat
ingestion lowers fasting and postprandial VLDL and decreases adipose tissue IL-6 and
GIP receptor mRNA in hypertriacylglycerolemic men. J. Nutr. Biochem, 21 (10): 983-90.
10.1016/j.jnutbio.2009.08.004.
Freese, E. C., Levine, A. S., Chapman, D. P., Hausman, D. B. and Cureton, K. J. 2011. Effects of
acute sprint interval cycling and energy replacement on postprandial lipemia. J. Appl.
Physiol, 111 (6): 1584-9. 10.1152/japplphysiol.00416.2011.
Gill, J. M., Herd, S. L. and Hardman, A. E. 2002. Moderate exercise and post-prandial
metabolism: issues of dose-response. J. Sports Sci, 20 (12): 961-7.
10.1080/026404102321011715.
Gill, J. M. and Hardman, A. E. 2000. Postprandial lipemia: effects of exercise and restriction of
energy intake compared. Am. J. Clin. Nutr, 71 (2): 465-71.
Gill, J. M., Murphy, M. H. and Hardman, A. E. 1998. Postprandial lipemia: effects of
intermittent versus continuous exercise. Med. Sci. Sports Exerc, 30 (10): 1515-20.
Gore, C. J. and Withers, R. T. 1990. The effect of exercise intensity and duration on the oxygen
deficit and excess post-exercise oxygen consumption. Eur. J. Appl. Physiol. Occup.
Physiol, 60 (3): 169-74.
Greiwe, J. S., Holloszy, J. O. and Semenkovich, C. F. 2000. Exercise induces lipoprotein lipase
and GLUT-4 protein in muscle independent of adrenergic-receptor signaling. J. Appl.
Physiol, 89 (1): 176-81.
Page 21 of 34
https://mc06.manuscriptcentral.com/apnm-pubs
Applied Physiology, Nutrition, and Metabolism

Draft
Exercise Intensity and Postprandial Lipemia 22
Harrison, M., O'Gorman, D. J., McCaffrey, N., Hamilton, M. T., Zderic, T. W., Carson, B. P. and
Moyna, N. M. 2009. Influence of acute exercise with and without carbohydrate
replacement on postprandial lipid metabolism. J. Appl. Physiol, 106 (3): 943-9.
10.1152/japplphysiol.91367.2008.
Herd, S. L., Kiens, B., Boobis, L. H. and Hardman, A. E. 2001. Moderate exercise, postprandial
lipemia, and skeletal muscle lipoprotein lipase activity. Metabolism, 50 (7): 756-62.
10.1053/meta.2001.24199.
Karpe, F., Hellenius, M. L. and Hamsten, A. 1999. Differences in postprandial concentrations of
very-low-density lipoprotein and chylomicron remnants between normotriglyceridemic
and hypertriglyceridemic men with and without coronary heart disease. Metabolism, 48
(3): 301-7.
Karvonen, M. J., Kentala, E. and Mustala, O. 1957. The effects of training on heart rate; a
longitudinal study. Ann. Med. Exp. Biol. Fenn, 35 (3): 307-15.
Kathiresan, S., Otvos, J. D., Sullivan, L. M., Keyes, M. J., Schaefer, E. J., Wilson, P. W.,
D'Agostino, R. B., Vasan, R. S. and Robins, S. J. 2006. Increased small low-density
lipoprotein particle number: a prominent feature of the metabolic syndrome in the
Framingham Heart Study. Circulation, 113 (1): 20-9.
10.1161/CIRCULATIONAHA.105.567107.
Katsanos, C. S., Grandjean, P. W. and Moffatt, R. J. 2004. Effects of low and moderate exercise
intensity on postprandial lipemia and postheparin plasma lipoprotein lipase activity in
physically active men. J. Appl. Physiol, 96 (1): 181-8. 10.1152/japplphysiol.00243.2003.
Page 22 of 34
https://mc06.manuscriptcentral.com/apnm-pubs
Applied Physiology, Nutrition, and Metabolism

Draft
Exercise Intensity and Postprandial Lipemia 23
Kiens, B., Lithell, H., Mikines, K. J. and Richter, E. A. 1989. Effects of insulin and exercise on
muscle lipoprotein lipase activity in man and its relation to insulin action. J. Clin. Invest,
84 (4): 1124-9. 10.1172/JCI114275.
Kolovou, G. D., Daskalova, D., Iraklianou, S. A., Adamopoulou, E. N., Pilatis, N. D.,
Hatzigeorgiou, G. C. and Cokkinos, D. V. 2003. Postprandial lipemia in hypertension. J.
Am. Coll. Nutr, 22 (1): 80-7.
Kolovou, G. D., Mikhailidis, D. P., Kovar, J., Lairon, D., Nordestgaard, B. G., Ooi, T. C., Perez-
Martinez, P., Bilianou, H., Anagnostopoulou, K. and Panotopoulos, G. 2011. Assessment
and clinical relevance of non-fasting and postprandial triglycerides: an expert panel
statement. Curr. Vasc. Pharmacol, 9 (3): 258-70.
Kolovou, G. D., Mikhailidis, D. P., Nordestgaard, B. G., Bilianou, H. and Panotopoulos, G.
2011. Definition of postprandial lipaemia. Curr Vasc Pharmacol. 9 (3): 292-301.
Maraki, M. and Sidossis, L. S. 2010. Effects of energy balance on postprandial triacylglycerol
metabolism. Curr. Opin. Clin. Nutr. Metab. Care, 13 (6): 608-17.
10.1097/MCO.0b013e32833f1aae.
Maraki, M. I. and Sidossis, L. S. 2013. The latest on the effect of prior exercise on postprandial
lipaemia. Sports Med, 43 (6): 463-81. 10.1007/s40279-013-0046-9.
Matthews, D. R., Hosker, J. P., Rudenski, A. S., Naylor, B. A., Treacher, D. F. and Turner, R. C.
1985. Homeostasis model assessment: insulin resistance and beta-cell function from
fasting plasma glucose and insulin concentrations in man. Diabetologia, 28 (7): 412-9.
Matthews, J. N., Altman, D. G., Campbell, M. J. and Royston, P. 1990. Analysis of serial
measurements in medical research. BMJ, 300 (6719): 230-5.
Page 23 of 34
https://mc06.manuscriptcentral.com/apnm-pubs
Applied Physiology, Nutrition, and Metabolism

Draft
Exercise Intensity and Postprandial Lipemia 24
Mestek, M. L., Plaisance, E. P., Ratcliff, L. A., Taylor, J. K., Wee, S. O. and Grandjean, P. W.
2008. Aerobic exercise and postprandial lipemia in men with the metabolic syndrome.
Med. Sci. Sports. Exerc, 40 (12): 2105-11. 10.1249/MSS.0b013e3181822ebd.
Nilsson-Ehle, P., Garfinkel, A. S. and Schotz, M. C. 1980. Lipolytic enzymes and plasma
lipoprotein metabolism. Annu. Rev. Biochem, 49 667-93.
10.1146/annurev.bi.49.070180.003315.
Nordestgaard, B. G., Benn, M., Schnohr, P. and Tybjaerg-Hansen, A. 2007. Nonfasting
triglycerides and risk of myocardial infarction, ischemic heart disease, and death in men
and women. JAMA, 298 (3): 299-308. 10.1001/jama.298.3.299.
Park, S. H., Kim, J. Y., Lee, J. H. and Park, H. Y. 2011. Elevated oxidized low-density
lipoprotein concentrations in postmenopausal women with the metabolic syndrome. Clin.
Chim. Acta, 412 (5-6): 435-40. 10.1016/j.cca.2010.11.017.
Patsch, J. R., Miesenbock, G., Hopferwieser, T., Muhlberger, V., Knapp, E., Dunn, J. K., Gotto,
A. M., Jr. and Patsch, W. 1992. Relation of triglyceride metabolism and coronary artery
disease. Studies in the postprandial state. Arterioscler. Thromb, 12 (11): 1336-45.
Pescatello, L. S., Arena, R., Reibe, D., Thompson, P.D. 2013. ACSM's Guidelines for Exercise
Testing & Prescription. Lippincott, Williams and Wilkins, Champaign, Il.
Petitt, D. S. and Cureton, K. J. 2003. Effects of prior exercise on postprandial lipemia: a
quantitative review. Metabolism, 52 (4): 418-24. 10.1053/meta.2003.50071.
Phelain, J. F., Reinke, E., Harris, M. A. and Melby, C. L. 1997. Postexercise energy expenditure
and substrate oxidation in young women resulting from exercise bouts of different
intensity. J. Am. Coll. Nutr, 16 (2): 140-6.
Page 24 of 34
https://mc06.manuscriptcentral.com/apnm-pubs
Applied Physiology, Nutrition, and Metabolism

Draft
Exercise Intensity and Postprandial Lipemia 25
Plaisance, E. P., Mestek, M. L., Mahurin, A. J., Taylor, J. K., Moncada-Jimenez, J. and
Grandjean, P. W. 2008. Postprandial triglyceride responses to aerobic exercise and
extended-release niacin. Am. J. Clin. Nutr, 88 (1): 30-7.
Trombold, J. R., Christmas, K. M., Machin, D. R., Kim, I. Y. and Coyle, E. F. 2013. Acute high-
intensity endurance exercise is more effective than moderate-intensity exercise for
attenuation of postprandial triglyceride elevation. J. Appl. Physiol, (1985). 114 (6): 792-
800. 10.1152/japplphysiol.01028.2012.
Tsetsonis, N. V. and Hardman, A. E. 1996. Reduction in postprandial lipemia after walking:
influence of exercise intensity. Med. Sci. Sports. Exerc, 28 (10): 1235-42.
Van Beaumont, W. 1973. Red cell volume with changes in plasma osmolarity during maximal
exercise. J. Appl. Physiol, 35 (1): 47-50.
Zhang, J. Q., Ji, L. L., Nunez, G., Feathers, S., Hart, C. L. and Yao, W. X. 2004. Effect of
exercise timing on postprandial lipemia in hypertriglyceridemic men. Can. J. Appl.
Physiol, 29 (5): 590-603.
Zhang, J. Q., Thomas, T. R. and Ball, S. D. 1998. Effect of exercise timing on postprandial
lipemia and HDL cholesterol subfractions. J. Appl. Physiol, 85 (4): 1516-22.
Zilversmit, D. B. 1995. Atherogenic nature of triglycerides, postprandial lipidemia, and
triglyceride-rich remnant lipoproteins. Clin. Chem, 41 (1): 153-8.
Page 25 of 34
https://mc06.manuscriptcentral.com/apnm-pubs
Applied Physiology, Nutrition, and Metabolism
Draft
Exercise Intensity and Postprandial Lipemia 1
Table 1. Baseline anthropometric and physiological characteristics
Variable Mean + SD Minimum Maximum
Age (yrs) 43 + 10 28 55
Height (m) 1.77 + 0.06 1.70 1.87
Weight (kg) 100.6 + 17.7 78.2 118.7
BMI (kg/m2) 31.8 + 4.5 25.6 36.6
Body Fat (%) 30 + 6 24 41
Waist (cm) 107.2 + 14.9 81.3 120.7
SBP (mmHg) 128 + 15 114 158
DBP (mmHg) 81 + 9 70 100
VO2peak (L/min) 2.9 + 0.3 2.52 3.16
VO2peak (ml/kg/min) 31.1 + 7.5 21.4 40.4
Glucose (mmol/L) 5.44 + 0.28 4.94 5.88
Triglycerides (mmol/L) 1.81 + 0.95 0.70 3.29
Total Cholesterol (mmol/L) 4.38 + 0.88 3.50 5.67
HDLC (mmol/L) 1.04 + 0.34 0.62 1.48
LDLC (mmol/L) 2.51 + 0.60 1.86 3.44
NHDLC (mmol/L) 3.34 + 0.80 2.38 4.45
Note: Values are presented as means + SEM along with minimum and maximum values. BMI,
body mass index; SBP, systolic blood pressure; DBP, diastolic blood pressure; HDLC, high-
density lipoprotein cholesterol; LDLC, low-density lipoprotein cholesterol; NHDLC, non-high-
density lipoprotein cholesterol.
Page 26 of 34
https://mc06.manuscriptcentral.com/apnm-pubs
Applied Physiology, Nutrition, and Metabolism

Draft
Exercise Intensity and Postprandial Lipemia 2
Table 2. Physiologic Variables Across Conditions
Variable CON LI HI HI + EERM
Weight (kg) 97.7 + 7.1 100.1 + 6.5 100.3 + 6.5 100.5 + 6.7
REE (L/min) 0.235 + 0.02 0.232 + 0.02 0.262 + 0.01 0.251 + 0.02
Glucose (mmol/L) 5.38 + 0.17 5.88 + 0.06 5.77 + 0.11 5.77 + 0.11
Insulin (mU/L) 15.2 + 3.6 16.0 + 4.4 17.4 + 4.4 15.9 + 4.1
TG (mmol/L) 1.86 + 0.34 1.71 + 0.25 1.92 + 0.24 1.85 + 0.42
NEFA (mEq/L) 0.377 + 0.05 0.469 + 0.08 0.450 + 0.07 0.446 + 0.05
NHDLC (mmol/L) 3.24 + 0.26 3.29 + 0.31 3.32 + 0.26 3.21 + 0.28
HOMA 3.86 + 0.90 4.18 + 1.13 4.49 + 1.11 4.09 + 1.08
G/I ratio 8.46 + 1.62 9.56 + 2.55 8.03 + 1.51 8.91 + 1.73
Note: Values are presented as means + SEM. REE, resting energy expenditure; HOMA,
homeostatic model assessment, fasting glucose (mg/dl)/fasting insulin (mU/mL) * 22.5; G/I
ratio; GIR, glucose/insulin ratio, fasting glucose (mg/dl)/fasting insulin concentration (mU/mL).
Page 27 of 34
https://mc06.manuscriptcentral.com/apnm-pubs
Applied Physiology, Nutrition, and Metabolism

Draft
Exercise Intensity and Postprandial Lipemia 3
Table 3. Exercise Session Data
Variable LI HI HI + EERM
Energy Expenditure (Kcal) 500.8 + 0.6 500.4 + 0.6 502.4 + 11.5
Time (min) 74 + 2 47 + 2* 47 + 2
*
Avg VO2 (ml/kg/min) 13.8 + 1.0 21.6 + 1.6* 22.0 + 2.0
*
% of VO2peak 39.1 + 0.6 69.3 + 1.5* 70.3 + 2.9
*
Avg HR (bpm) 112.1 + 5.3 148.9 + 5.5* 140.4 + 5.2
*†
Avg RER 0.83 + 0.02 0.89 + 0.01* 0.88 + 0.02
*
Note: Values are presented as means + SEM. Values with similar superscripts are statistically
similar. * Significantly different from LI. † Significantly different from HI.
Page 28 of 34
https://mc06.manuscriptcentral.com/apnm-pubs
Applied Physiology, Nutrition, and Metabolism
Draft
Exercise Intensity and Postprandial Lipemia 4
Table 4. Characteristics of EPOC Measures
Mean Min Max Range
Low-Intensity
EPTM (min) 24 + 17 1 120 119
EPOC (L) 4.4 + 2.0 1.4 16.3 14.9
EPOC Kcals 22.1 + 10.0 7.2 81.4 74.2
High-Intensity
EPTM (min) 27 + 16 3 120 117
EPOC (L) 9.1 + 4.3 3.4 35.1 31.7
EPOC Kcals 45.3 + 21.7 16.9 175.4 158.5
Note: Values are presented as mean + SEM along with minimum and maximum values. Max,
maximum value; Min, minimum value; EPTM, EPOC time; EPOC Kcals, EPOC energy
expenditure above rest.
Page 29 of 34
https://mc06.manuscriptcentral.com/apnm-pubs
Applied Physiology, Nutrition, and Metabolism

Draft
Exercise Intensity and Postprandial Lipemia 5
Table 5. Temporal changes in blood lipid variables
Variable 0-hr 2-hr 4-hr 6-hr
TC (mmol/L) 4.22 + 0.13 4.20 + 0.13 4.14 + 0.13 4.22 + 0.13
HDLC (mmol/L) 0.98 + 0.05a 0.93 + 0.05
b 0.88 + 0.05
c 0.88 + 0.05
c
ApoB (g/L) 0.88 + 0.03a 0.96 + 0.4
a,b 0.99 + 0.04
c 0.98 + 0.04
c
ApoA1 (g/L) 1.32 + 0.04a 1.33 + 0.4
a 1.36 + 0.04
b 1.36 + 0.04
b
ApoB/A 0.70 + 0.03a 0.73 + 0.03
b 0.74 + 0.04
b 0.74 + 0.04
b
Note: Values are presented as means + SEM. Means with similar letters are statistically similar.
TC, total cholesterol; HDLC, high-density lipoprotein cholesterol; ApoB/A ratio, ratio of Apo B/
Apo A1.
Page 30 of 34
https://mc06.manuscriptcentral.com/apnm-pubs
Applied Physiology, Nutrition, and Metabolism

Draft
Exercise Intensity and Postprandial Lipemia
FIGURE LEGENDS
Fig. 1. Means + SEM for the temporal triglyceride response for control (♦), low-intensity (█),
high-intensity (●), and high-intensity + EERM (▲). * = low condition is significantly lower
than control. † = high condition is significantly lower than control. All values were increased
significantly at 2-hr when compared to baseline.
Fig. 2. Means + SEM for the incremental triglyceride area under the curve response for control
(grey), low-intensity (black), high-intensity (diagonal hatch) and high-intensity + EERM
(striped). * = significantly different from control.
Fig. 3. Means + SEM are presented for the temporal NEFA response control (♦), low-intensity
(█), high-intensity (●), and high-intensity + EERM (▲). * indicates significantly difference from
control, p < 0.001.
Page 31 of 34
https://mc06.manuscriptcentral.com/apnm-pubs
Applied Physiology, Nutrition, and Metabolism

Draft
Exercise Intensity and Postprandial Lipemia
FIGURES
Fig. 1.
1.00
1.50
2.00
2.50
3.00
3.50
4.00
4.50
0 - hr 2 - hr 4 - hr 6 - hr
Tri
gly
ceri
des
(m
mol/
L)
CON
LI
HI
HI + EERM
*
†
*† *
Page 32 of 34
https://mc06.manuscriptcentral.com/apnm-pubs
Applied Physiology, Nutrition, and Metabolism

Draft
Exercise Intensity and Postprandial Lipemia
Fig. 2.
0.00
2.00
4.00
6.00
8.00
10.00
12.00
CON LI HI HI + EERM
Tri
gly
ceri
de
AU
CI
* **
Page 33 of 34
https://mc06.manuscriptcentral.com/apnm-pubs
Applied Physiology, Nutrition, and Metabolism

Draft
Exercise Intensity and Postprandial Lipemia
Fig. 3.
0
0.1
0.2
0.3
0.4
0.5
0.6
0.7
0.8
0.9
1
0-hr 2-hr 4-hr 6-hr
NE
FA
(m
Eq
/L)
CON
LI
HI
HI+EERM
**
Page 34 of 34
https://mc06.manuscriptcentral.com/apnm-pubs
Applied Physiology, Nutrition, and Metabolism