draft - static1.1.sqspcdn.com
TRANSCRIPT

NYSE American: URG • TSX: URE
June 2020
NYSE American: URG • TSX: URE
This presentation contains “forward-looking statements,” within the meaning of applicable securities laws, regarding events or conditions that may occur in thefuture. Such statements include without limitation the Company’s maintaining controlled-level production operations and the ability to ramp up as planned,including maintaining experienced operational staff; the continued technical and economic viability of Lost Creek; whether current projections of supply anddemand will be recognized and sustained; ability to timely and cost-efficiently ramp up in response to changing market conditions, including time to developand permit Lost Soldier project for operations; ability to complete additional favorable uranium sales agreements; ability to further expand resources at the LostCreek Property; the further exploration, development and permitting of Company projects, including in the Great Divide Basin and Shirley Basin; the technicaland economic viability of Shirley Basin (including the production and cost projections contained in the preliminary economic analysis of the project); completionof (and timing for) regulatory approvals and development at Shirley Basin and Lost Creek; the continuing impact of foreign state-subsidized imports of uranium;the timing and specifics of implementation of the U.S. Nuclear Fuel Working Group’s recommendations for the nuclear fuel cycle, including funding theproposed budget for a national uranium reserve; the long-term effects on the uranium market of supply and demand projections, including the duration of thepandemic-related production suspensions and the impact of the expiry of RSA; realization of anticipated revenues for 2020; whether ramp-up may becompleted at current projected costs and low levels of dilution; how much of the SBA loans will be forgiven; and whether certain prospective catalysts will occurand/or the affect(s) each may have on the market. These statements are based on current expectations that, while considered reasonable by management atthis time, inherently involve a number of significant business, economic and competitive risks, uncertainties and contingencies. Numerous factors could causeactual events to differ materially from those in the forward-looking statements. Factors that could cause such differences, without limiting the generality of thefollowing, include: risks inherent in exploration activities; volatility and sensitivity to market prices for uranium; volatility and sensitivity to capital marketfluctuations; the impact of competition in the uranium sector; the ability to raise funds through private or public equity financings; imprecision in resource andreserve estimates; environmental and safety risks including increased regulatory burdens; unexpected geological or hydrological conditions; a possibledeterioration in support for nuclear energy; changes in government regulations and policies, including trade laws and policies; demand for nuclear power;weather and other natural phenomena; delays in obtaining or failures to obtain required governmental, environmental or other project approvals; and otherexploration, development, operating, financial market and regulatory risks. Although Ur-Energy Inc. believes that the assumptions inherent in the forward-looking statements are reasonable, undue reliance should not be placed on these statements, which only apply as of the date of this presentation. Ur-EnergyInc. disclaims any intention or obligation to update or revise any forward-looking statement, whether as a result of new information, future events or otherwise.
Cautionary Note Regarding Projections: Similarly, this presentation also may contain projections relating to an extended future period and, accordingly, theestimates and assumptions underlying the projections are inherently highly uncertain, based on events that have not taken place, and are subject to significanteconomic, financial, regulatory, competitive and other uncertainties and contingencies beyond the control of Ur-Energy Inc. Further, given the nature of theCompany's business and industry that is subject to a number of significant risk factors, there can be no assurance that the projections can be or will berealized. It is probable that the actual results and outcomes will differ, possibly materially, from those projected.
The attention of investors is drawn to the Risk Factors set out in the Company's Annual Report on Form 10-K, filed February 28, 2020, which is filed with theU.S. Securities and Exchange Commission on EDGAR (http://www.sec.gov/edgar.shtml) and the regulatory authorities in Canada on SEDAR(www.sedar.com).
Cautionary Note to U.S. Investors Concerning Estimates of Measured, Indicated or Inferred Resources: the information presented uses the terms"measured", "indicated" and "inferred" mineral resources. United States investors are advised that while such terms are recognized and required by Canadianregulations, the United States Securities and Exchange Commission does not recognize these terms. United States investors are cautioned not to assume thatall or any part of measured or indicated mineral resources will ever be converted into mineral reserves. United States investors are also cautioned not toassume that all or any part of an inferred mineral resource exists, or is economically or legally minable.
Michael Mellin, Ur-Energy Lost Creek Mine Geologist, P.Geo., and Qualified Person as defined by NI 43-101, reviewed and approved the technicalinformation contained in this presentation.
2

NYSE American: URG • TSX: URE 3
*Excluding NRV adjustmentsSee Disclaimer re Forward-looking Statements and Projections (slide 2)
Lost Creek ISR Uranium Facility• 6+ years of consistent production
• Produced ~2.7Mlbs. U3O8 through 2020 Q1
• Controlled production at market-appropriate levels
• Lowest-cost producer outside Kazakhstan
Flexibility and value realized through higher-priced term contracts• 2013-2020 delivered to customers: 2.4Mlbs Lost Creek production + 1.8Mlbs purchased product
• Consistency of cashflow - best profit margins (2019: $12.2M in gross profits*)
• Substantial inventory – recent spot market pricing up ~35%
• Term contracts de-risk Company – 2020 deliveries completed
Forging a path forward for the U.S. domestic uranium industry• U.S. Nuclear Fuel Working Group Report: U.S. to take immediate and bold action
• Direct purchases of up to 17-19Mlbs U3O8, to begin in 2020
• Federal budget item for establishment of national uranium reserve $150M/annually FY2021 – 2030
• Maintaining critical operational staff at Lost Creek to support operations and prospective ramp-up

NYSE American: URG • TSX: URE
U.S. nuclear • ~20% of nation’s electricity
• ~55% carbon-free electricity
Worldwide: 11% electrical energy; ~1/3 carbon-free electricity
451 operable reactors; 54 under construction – more than half of which will come online in next two years
Global U3O8 demand projected to increase 3.1% annually through 2025
4
Source: UxC uranium market outlook Q4 2017, UPC
See Disclaimer re Forward-looking Statements and Projections (slide 2)
*Sources: Nuclear Energy Institute; World Nuclear Association, UxC Consulting, IAEA
2019 – 187Mlbs total global demand Cameco’s presence as buyer – upwards of 26Mlbs in 2020
NYSE American: URG • TSX: URE 5
See Disclaimer re Forward-looking Statements and Projections (slide 2)
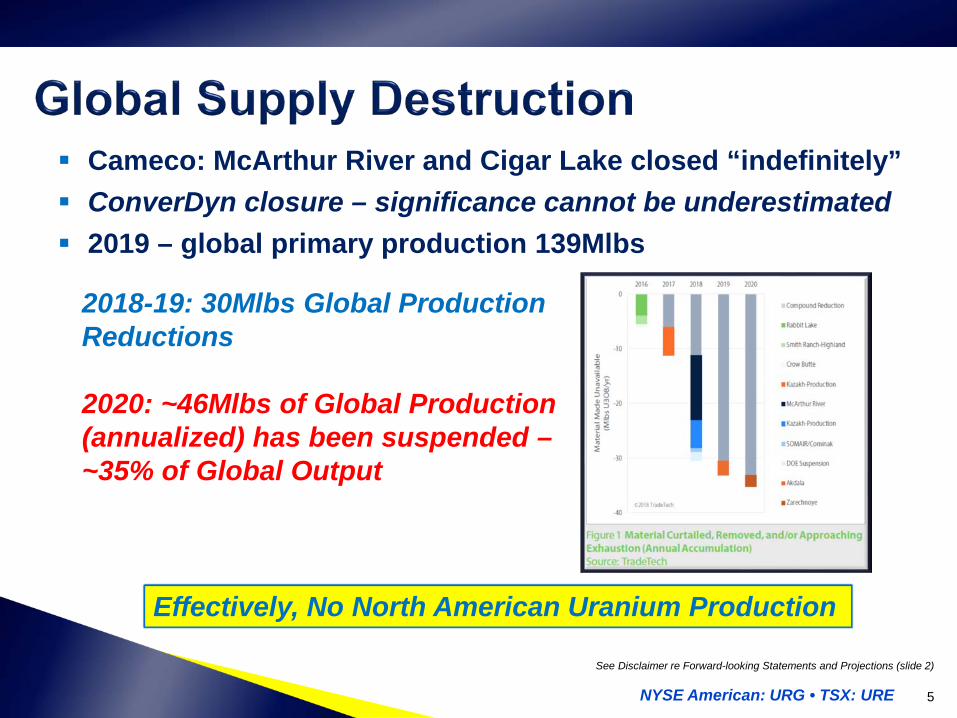
Cameco: McArthur River and Cigar Lake closed “indefinitely” ConverDyn closure – significance cannot be underestimated 2019 – global primary production 139Mlbs
Effectively, No North American Uranium Production
2018-19: 30Mlbs Global Production Reductions
2020: ~46Mlbs of Global Production (annualized) has been suspended –~35% of Global Output

NYSE American: URG • TSX: URE
• Recent annual import levels commonly ~50Mlbs• 2019 U.S. mined production ~174Klbs U3O8 89% lower than 2018 – lowest in U.S. history
• 2020 U.S. mined production anticipated to be negligible
6
See Disclaimer re Forward-looking Statements and Projections (slide 2)
Source: Industry guidance; U.S. EIA Information 2020
Nuclear cannot be allowed to go the way of rare earths
2020Q1 8,098lbs

NYSE American: URG • TSX: URE 7
• Nuclear Fuel Working Group Report (4/23/20)• Direct purchases to establish national uranium reserve • 10-year $150M annual DOE budget item • Support DOC efforts to extend RSA
• Russian Suspension Agreement• Expires 12/31/2020 • What next: extension / legislation / trade action?
• 2020 Supply Destruction due to Pandemic• Additional suspensions possible?• Duration of suspensions of 35% of current production?
See Disclaimer re Forward-looking Statements and Projections (slide 2)

NYSE American: URG • TSX: URE
Direct purchases to establish national uranium reserve• 17 to 19 million total pounds of U3O8
• 10-year $150M annual DOE budget item
• Expected the reserve would directly support the operation of at least two U.S. uranium mines and the re-establishment of active domestic conversion capabilities
Restart ConverDyn conversion not later than 2022 • 6,000 to 7,500 tons of UF6
Restart domestic enrichment in ~ 2023 - at least 25% unobligated material (i.e., must be sourced domestically)
Support DOC efforts to extend the RSA; lower cap Create level playing field for all energy sources; encourage FERC
to improve competition in the wholesale energy markets Enable NRC to deny imports of Russian/Chinese nuclear fuel
8
See Disclaimer re Forward-looking Statements and Projections (slide 2)

NYSE American: URG • TSX: URE
RSA signed in 1992 to settle anti-dumping action
Limits imports of Russian material to 20% of projected U.S. demand (8 to 10Mlbs U3O8/year)
2017 ITC sunset review concluded that Russian dumping will likely resume when the RSA terminates
Imports of Kazakh material into the U.S. are unfettered by the RSA even though Russia controls ~50%
RSA expires December 31, 2020
The battle lines are drawn – what comes next?
9
See Disclaimer re Forward-looking Statements and Projections (slide 2)

NYSE American: URG • TSX: URE 10
See Disclaimer re Forward-looking Statements and Projections (slide 2)
Based on grade cutoff of 0.02% eU3O8 and GT cutoffs of 0.2 and 0.31Measured resources not reduced by production since inception of operations (2.7Mlbs)
*Amended Preliminary Economic Assessment for the Lost Creek Property, Sweetwater County, Wyoming, 2.6.2016 (filed on SEDAR)
Resource Growth . . . . . . . . . . .250% . . . . . . . . Demonstrates Lost Creek Scalability
• 6+ Years Production: ~92% recovery ofunder pattern resources in MU1
• Additional resources can all bepipelined into the Lost Creek plantdirectly
~37,500 acresSix project areas
March 2011 February 2012 April 2012 December 2013 June 2015 February 2016
5,230,000 5,765,300
8,348,200 8,655,000
11,084,000
14,609,000
780,0002,017,800 2,869,100
4,740,000 5,040,0006,439,000
Res
ourc
es
Measured & Indicated Inferred

NYSE American: URG • TSX: URE
Measured Indicated Inferred
ProjectAVG
GRADE % eU3O8
SHORT TONS
(X 1000)
POUNDS(X 1000)
AVG GRADE% eU3O8
SHORT TONS
(X 1000)
POUNDS(X 1000)
AVG GRADE% eU3O8
SHORT TONS
(X 1000)
POUNDS(X 1000)
*LOST CREEK(1) 0.048 9,731 9,386 0.044 5,942 5,223 0.044 7,368 6,439
**SHIRLEY BASIN 0.275 1,367 7,521 0.118 549 1,295
***LOST SOLDIER 0.064 3,900 5,000 0.065 5,500 7,200 0.055 1,600 1,800
GRAND TOTAL MEASURED + INDICATED = 35,625,000 pounds INFERRED
8,239,000 pounds
11
(1)Measured resources not reduced by production since inception of operations (2.7Mlbs)
*Amended Preliminary Economic Assessment for the Lost Creek Property, Sweetwater County, Wyoming, 2.6.2016 (filed on SEDAR)**Preliminary Economic Assessment Shirley Basin Uranium Project, Carbon County, Wyoming 1.27.2015 (filed on SEDAR).
***NI 43-101 Technical Report on the Lost Soldier Project, Wyoming 7.10.2006 (filed on SEDAR)
See Disclaimer re Forward-looking Statements and Projections (slide 2)
Real pounds = Real production Not just pounds in the ground

NYSE American: URG • TSX: URE 12
Unit 2014 2015 2016 2017 2018 2019
Captured lbs 596K 784K 538K 265K 302K 48K
Drummed lbs 548K 727K 561K 254K 286K 51K
Pounds Sold lbs 518K 925K 562K 780K 480K 665K
Sold From Produced Purchased
lbs 518K--
725K200K
562K--
261K519K
10K 470K
214K451K
Avg Sales Price $/lb $51.22 $45.20 $39.49 $49.09 $48.86 $48.50
Avg Cash Cost* $/lb $19.73 $16.27 $17.15 $24.41 $25.37 $23.93
Revenues $ $26.5Million $41.8Million $22.2Million $38.3Million $23.5Million $32.3Million
Uranium Production, Costs and Revenues
*Per Pound Sold, excludes severance and ad valorem taxes and non-cash costs**Excluding NRV adjustments
See Disclaimer re Forward-looking Statements and Projections (slide 2)
2019: 665,000lbs sold to contracts, $12.2M gross profits**2020 deliveries made with purchased pounds – preserves our inventory

NYSE American: URG • TSX: URE 13
*Assumes 2020 initiation of ramp-up
Future production to be supported through exploration anddevelopment of Ur-Energy’s portfolio of properties
See Disclaimer re Forward-looking Statements and Projections (slide 2)
Planning Ramp-up Production Est. 4.5Mlbs remaining in
MUs1&2 (fully permitted)
Capture remaining MU1 pounds not currently under pattern
10 remaining mining areas at Lost Creek (2016 PEA)
Core operational staff in place at Lost Creek

NYSE American: URG • TSX: URE
Lost Creek $15.4 million for mine development ($14.9M) and CapEx
($0.5M) to reach initial 1.0 million pound rate (6-9 months) Revenues should cover further development activities
Shirley Basin $26.2 million for mine development ($9.1M) and CapEx
($17.1M) to reach 0.5 million pound rate (15-18 months) Revenues should cover further development activities
14
See Disclaimer re Forward-looking Statements and Projections (slide 2)

NYSE American: URG • TSX: URE 15
The best predictor of future behavior. . .*Estimates based upon public filings to Q1 2020See Disclaimer re Forward-looking Statements and Projections (slide 2)
55%
161%
504%
4,645%[Off Chart]
36%
62%
83%
98%
0%
20%
40%
60%
80%
100%
0%
200%
400%
600%
800%
1000%
URE UEC PEN UUUU
Dilution %Share Growth %
HISTORIC DILUTION BY COMPANY(Since 2011 Q1)
Share Growth Dilution

NYSE American: URG • TSX: URE 16
Share Price (6/5/2020) US$0.5652 Week Range US$0.27 - $.99Avg. Daily Volume ~693,000(3-mo URG & URE 6/5/2020)
Member of S&P/TSX SmallCap Index
Share Capital & Cash Position
As of 3/31/2020Shares Outstanding 160.5MStock Options & RSUs 12.2MShares Reserved on Warrants 6.5MFully Diluted 179.2M
Cash (5/6/2020) US$7.0MMarket Cap (6/5/2020) US$89.9M
NYSE American: URG
CanadaVIII CapitalCantor Fitzgerald
United StatesFBR Capital MarketsROTH Capital PartnersH.C. Wainwright
Analyst Coverage:
URG is followed by the analysts above. Any opinions, estimates, forecasts, conclusions orrecommendations regarding URG performance made by these analysts are theirs alone and do notrepresent opinions, estimates, forecasts, conclusions, recommendations or predictions of URG. URG doesimply its endorsement of or concurrence with such information, conclusions or recommendations.
See Disclaimer re Forward-looking Statements and Projections (slide 2)
3/31/2020: finished, ready-for-sale product in inventory at converter
~269,000 lbs U3O8

NYSE American: URG • TSX: URE
Supply / Demand: Destruction and Growth Rates are Both Real • WNA Biennial Report – nuclear and uranium demand rise in all scenarios
• Global new starts - and - small modular reactors and micro-reactors
• ~35% (46Mlbs) annualized global supply destruction in last ~90 days
Current Market Forces• Pandemic-related closures globally - spot price ~35% higher• Cameco in market as buyer
• U.S. Nuclear Fuel Working Group - 10-year $150M annual DOE budget item
• Expiration of Russian Suspension Agreement – Extension? Legislation?
Geopolitical Risks• U.S. facing conflicts and uncertainty in multiple regions around the globe
• Heavy dependence upon low-cost imports from geostrategic rivals Russia and Kazakhstan
17
See Disclaimer re Forward-looking Statements and Projections (slide 2)

NYSE American: URG • TSX: URE
• Well financed for 2020 - solid “runway” $32.3M gross revenues in 2019 - $12.2M gross profits*
Cash resources $7.0M (as at 5/6/20)
Restructured State Bond Loan
~269,000lbs of ready-to-sell inventory at conversion facility
SBA PPP Loan funded April 2020
• Low ramp-up costs to attain 2Mlb run rate from large, scalable resources Operating leverage with core operational staff retained
Better positioned with lower ramp-up costs – and less dilution – than other operators or build-out stories
Numerous funding alternatives (revenues, strategic investment partner)
18
*Excluding NRV adjustmentsSee Disclaimer re Forward-looking Statements and Projections (slide 2)

NYSE American: URG • TSX: URE
For more information, please contact:
Jeff Klenda, Chairman, President & CEO
By Mail:Ur-Energy Inc.10758 W. Centennial Rd., Suite 200Littleton, CO 80127 USA
By Phone:Office 720.981.4588Toll-Free 866.981.4588Fax 720.981.5643
By E-mail:[email protected]
19