draft - revision 0, 2011 ballard bio-reactor pilot test
TRANSCRIPT

DRAFT – REVISION 0
2011 Ballard Bio-Reactor Pilot Test Results
Spring - Fall 2011
January 11th, 2011
Prepared by:
P4 Production LLC
1853 Hwy 34 N.
P.O. Box 886
Soda Springs, ID 83276
2
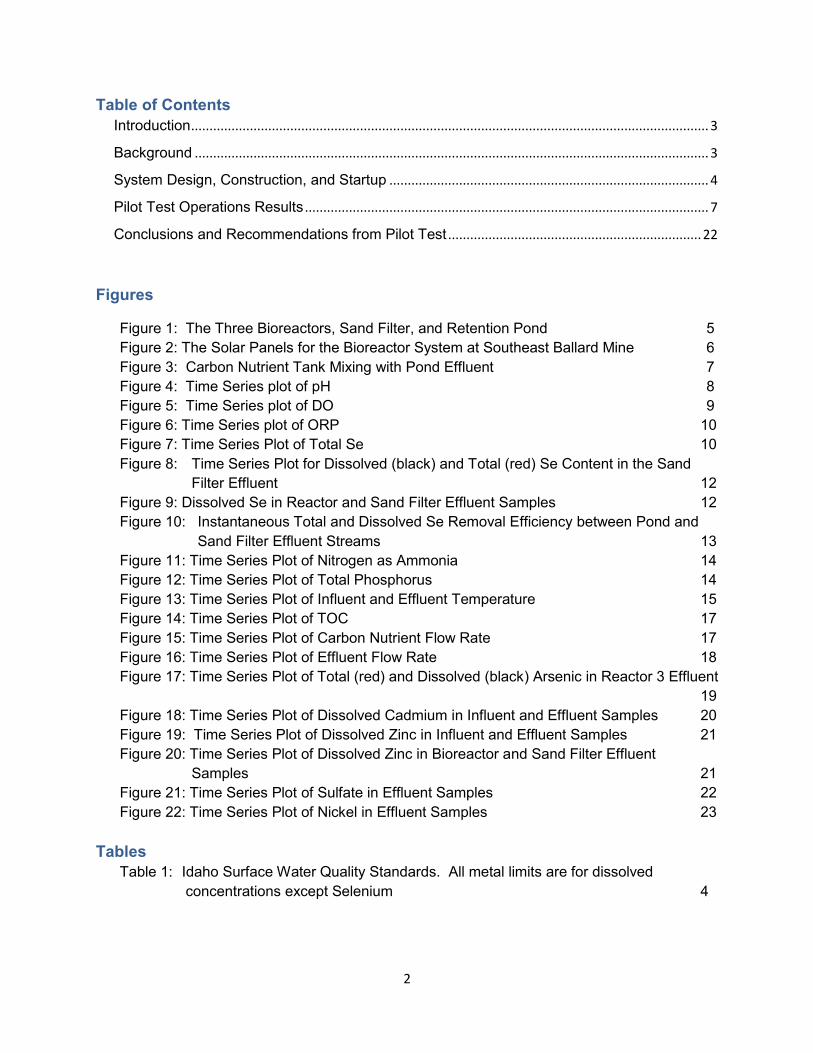
Table of Contents
Introduction ............................................................................................................................................. 3
Background ............................................................................................................................................ 3
System Design, Construction, and Startup ....................................................................................... 4
Pilot Test Operations Results .............................................................................................................. 7
Conclusions and Recommendations from Pilot Test ..................................................................... 22
Figures
Figure 1: The Three Bioreactors, Sand Filter, and Retention Pond 5
Figure 2: The Solar Panels for the Bioreactor System at Southeast Ballard Mine 6
Figure 3: Carbon Nutrient Tank Mixing with Pond Effluent 7
Figure 4: Time Series plot of pH 8
Figure 5: Time Series plot of DO 9
Figure 6: Time Series plot of ORP 10
Figure 7: Time Series Plot of Total Se 10
Figure 8: Time Series Plot for Dissolved (black) and Total (red) Se Content in the Sand
Filter Effluent 12
Figure 9: Dissolved Se in Reactor and Sand Filter Effluent Samples 12
Figure 10: Instantaneous Total and Dissolved Se Removal Efficiency between Pond and
Sand Filter Effluent Streams 13
Figure 11: Time Series Plot of Nitrogen as Ammonia 14
Figure 12: Time Series Plot of Total Phosphorus 14
Figure 13: Time Series Plot of Influent and Effluent Temperature 15
Figure 14: Time Series Plot of TOC 17
Figure 15: Time Series Plot of Carbon Nutrient Flow Rate 17
Figure 16: Time Series Plot of Effluent Flow Rate 18
Figure 17: Time Series Plot of Total (red) and Dissolved (black) Arsenic in Reactor 3 Effluent
19
Figure 18: Time Series Plot of Dissolved Cadmium in Influent and Effluent Samples 20
Figure 19: Time Series Plot of Dissolved Zinc in Influent and Effluent Samples 21
Figure 20: Time Series Plot of Dissolved Zinc in Bioreactor and Sand Filter Effluent
Samples 21
Figure 21: Time Series Plot of Sulfate in Effluent Samples 22
Figure 22: Time Series Plot of Nickel in Effluent Samples 23
Tables
Table 1: Idaho Surface Water Quality Standards. All metal limits are for dissolved
concentrations except Selenium 4

3
Introduction
This mine water treatment summary report was prepared to evaluate the performance of the selenium-reducing biological pilot treatment system installed and operated at the historic Monsanto Ballard Mine site northeast of Soda Springs, Idaho. The implementation of this treatment study supports the requirements of the Administrative Settlement Agreement and Order on Consent/Consent Order for Remedial Investigation/Feasibility Study (2009 CO/AOC). The 2009 CO/AOC is a voluntary agreement between P4, the United States Environmental Protection Agency (USEPA), the Idaho Department of Environmental Quality (IDEQ), the United States Department of Agriculture, Forest Service (USFS), the U.S. Department of the Interior (DOI), Bureau of Land Management (BLM), and the Shoshone-Bannock Tribes. The 2009 CO/AOC is being implemented under the USEPA’s Comprehensive Environmental Response, Compensation, and Liability Act of 1980 (CERCLA) authority. A fixed-bed, up-flow anaerobic biological treatment system was selected for full scale field testing following a comprehensive survey of available selenium control technologies based on a variety of project parameters and selection criteria, including: (i) the ability to meet Idaho surface water quality standards, (ii) complexity, (iii) previously demonstrated, (iv) low quantities of waste generated, (v) cost, and (vi) flexibility for treating varying concentrations of multiple metallic species. This decision was supported by the small scale treatability test conducted at the Horseshoe Overburden area (HOA) at the South Rasmussen Mine between June and September 2008 which consistently demonstrated efficient removal of Se and other metals (AMEC, 2008) The primary objectives of this study are to operate a Se treatment system on the seepage stream emanating from an overburden stockpile located within the inactive Ballard Mine site to reduce the release of Se from this area while simultaneously providing information to determine the compatibility of this remediation technology to meet Idaho surface water quality standards (IDSWQS) within the phosphate mining area (IDAPA, 2011).
Background
Approximately 20 million cubic yards of overburden rock were removed from the Ballard Mine pits between 1952 and 1969, which allowed the removal of 11 million tons of phosphate ore to be trucked to the mining company’s elemental phosphorus plant near Soda Springs. The majority of the overburden material was stockpiled in 317 acres of waste rock dumps and the remaining backfilled into the pits. Many of these waste dumps were partially reclaimed, including experimental plantings by the USFS out of Logan, Utah. Today, the Ballard pits remain largely open (partially backfilled or not backfilled) and waste rock dump material predominately exposed and uncovered (Lee, 2000). A surface stream emanating from the toe of waste rock stockpile, MWD082, flows away from the toe towards the north and was found to contain Se concentrations measured at 380 μg/L (ppb) and levels of Cd, Zn, and Ni above IDSWQS. Pertinent IDSWQS data is presented in Table 1. The stream flow begins during the spring run-off period with a duration of three to five months depending on annual precipitation levels.
4
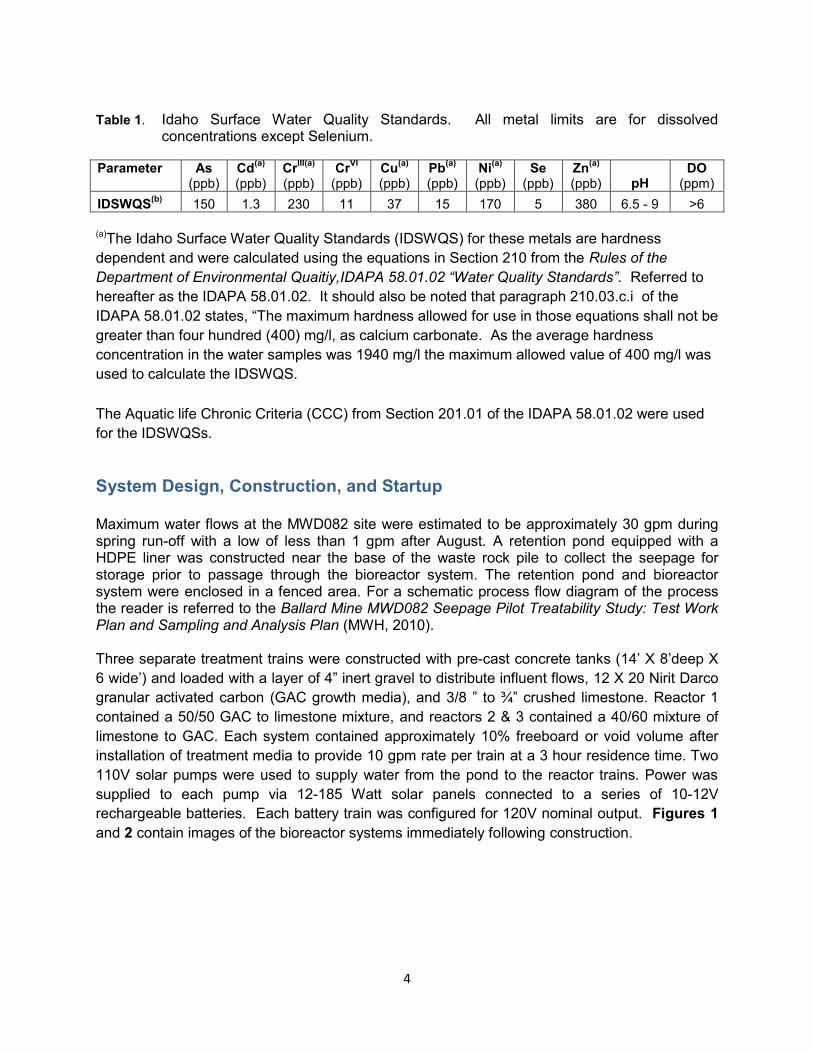
Table 1. Idaho Surface Water Quality Standards. All metal limits are for dissolved concentrations except Selenium.
Parameter
As (ppb)
Cd(a)
(ppb)
CrIII(a)
(ppb) Cr
VI
(ppb) Cu
(a)
(ppb) Pb
(a)
(ppb) Ni
(a)
(ppb) Se
(ppb) Zn
(a)
(ppb) pH DO
(ppm)
IDSWQS(b)
150 1.3 230 11 37 15 170 5 380 6.5 - 9 >6
(a)The Idaho Surface Water Quality Standards (IDSWQS) for these metals are hardness
dependent and were calculated using the equations in Section 210 from the Rules of the
Department of Environmental Quaitiy,IDAPA 58.01.02 “Water Quality Standards”. Referred to
hereafter as the IDAPA 58.01.02. It should also be noted that paragraph 210.03.c.i of the
IDAPA 58.01.02 states, “The maximum hardness allowed for use in those equations shall not be
greater than four hundred (400) mg/l, as calcium carbonate. As the average hardness
concentration in the water samples was 1940 mg/l the maximum allowed value of 400 mg/l was
used to calculate the IDSWQS.
The Aquatic life Chronic Criteria (CCC) from Section 201.01 of the IDAPA 58.01.02 were used
for the IDSWQSs.
System Design, Construction, and Startup
Maximum water flows at the MWD082 site were estimated to be approximately 30 gpm during spring run-off with a low of less than 1 gpm after August. A retention pond equipped with a HDPE liner was constructed near the base of the waste rock pile to collect the seepage for storage prior to passage through the bioreactor system. The retention pond and bioreactor system were enclosed in a fenced area. For a schematic process flow diagram of the process the reader is referred to the Ballard Mine MWD082 Seepage Pilot Treatability Study: Test Work Plan and Sampling and Analysis Plan (MWH, 2010). Three separate treatment trains were constructed with pre-cast concrete tanks (14’ X 8’deep X
6 wide’) and loaded with a layer of 4” inert gravel to distribute influent flows, 12 X 20 Nirit Darco
granular activated carbon (GAC growth media), and 3/8 ” to ¾” crushed limestone. Reactor 1
contained a 50/50 GAC to limestone mixture, and reactors 2 & 3 contained a 40/60 mixture of
limestone to GAC. Each system contained approximately 10% freeboard or void volume after
installation of treatment media to provide 10 gpm rate per train at a 3 hour residence time. Two
110V solar pumps were used to supply water from the pond to the reactor trains. Power was
supplied to each pump via 12-185 Watt solar panels connected to a series of 10-12V
rechargeable batteries. Each battery train was configured for 120V nominal output. Figures 1
and 2 contain images of the bioreactor systems immediately following construction.

5
Figure 1. The Three Bioreactors, Sand Filter, and Retention Pond.
Figure 2. The Solar Panels for the Bioreactor System at Southeast Ballard Mine.
Reactor influent was dosed with 1 to 2 gallons per hour (gph) carbon nutrient consisting of
MicroCg™ as a source of dissolved respirable organic carbon diluted in pond water. The target
total organic carbon (TOC) influent concentration was 10 ppm to minimize the reduction of
sulfate and the formation of biofilm and carbonate precipitates that could plug the system.
Figure 3 shows the carbon dose tank inside the conex box. The system influent was then split
and delivered to the base of each reactor and allowed to flow up through the gravel and reactive
12-185 W
Solar Panels

6
media layers prior to discharging to a common header that delivered the combined reactor
effluent to a sand filter to remove suspended particulate matter. Effluent from the sand filter was
then discharged to the seepage or re-circulated to the pond to maintain water levels for the test.
Figure 3. Carbon Nutrient Tank Mixing with Pond Effluent.
On May 12, 2011, each reactor was inoculated by dumping 15 gallons of fine-grained sediment
on top of each reactor’s media bed and washed down into the media with water from the
adjacent pond. The sediment was collected from the nearby drainage. It was assumed this
sediment had the propensity to contain an active microbial population capable of reducing
soluble selenate (SeO42-) and selenite (SeO3
2-) to immobile elemental selenium. Each reactor
was then filled with water from the pond and 5 gallons of methanol and 2 gallons of molasses
was added and washed into the reactor as well.
Every three days the tanks were re-circulated by turning over approximately three pore volumes
over a six hour period, after which the power was disconnected to begin a three day static
growth period. The recirculation and static growth cycle continued until Se levels were below 5
ppb on May 26th then continuous flow through process began.
Samples were acquired as outlined in the Ballard Mine MWD082 Seepage Pilot Treatability
Study Test Work plan and Sampling and Analysis Plan, section 6.0. Samples were acquired
throughout the test from the pond effluent (PE), reactor 1 effluent (R1), reactor 2 effluent (R2),
reactor 3 effluent (R3), combined reactor effluent (CBE), and sand filter effluent (SF) streams.
Samples were measured in the field for dissolved oxygen (DO), oxidation-reduction-potential
(ORP), temperature, conductivity, pH, and total dissolved solids (TDS).
Carbon Nutrient Tank
Pond Effluent
(raw water)
7
All samples were submitted to Microbac laboratories for analysis for arsenic (total and
dissolved), biological oxygen demand (BOD), cadmium, chloride, copper, fluoride, iron,
magnesium, manganese, nickel, nitrate, ammonia, total phosphorus, potassium, selenium (total
and dissolved), sodium, sulfate, total dissolved solids, total suspended solids, TOC, vanadium,
zinc, calcium. Filtered samples were passed through a 45 μm pore size filter media. All field and
lab data is available in Appendix 1.
Pilot Test Operations Results
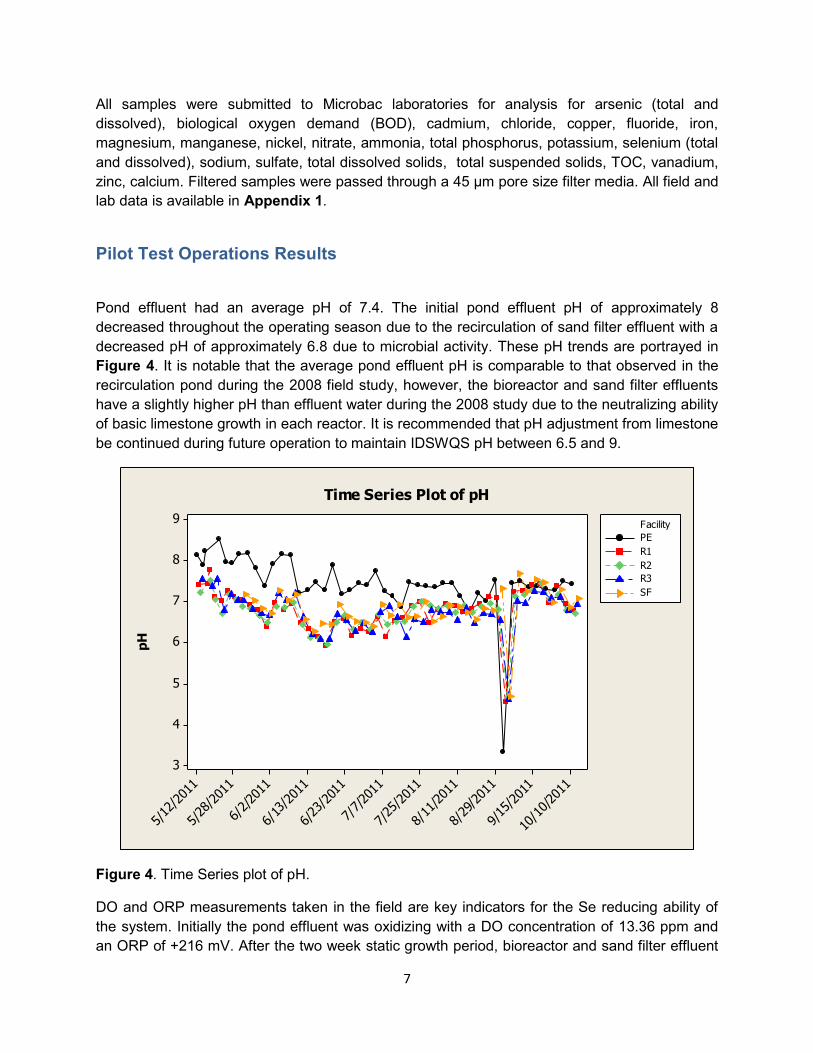
Pond effluent had an average pH of 7.4. The initial pond effluent pH of approximately 8
decreased throughout the operating season due to the recirculation of sand filter effluent with a
decreased pH of approximately 6.8 due to microbial activity. These pH trends are portrayed in
Figure 4. It is notable that the average pond effluent pH is comparable to that observed in the
recirculation pond during the 2008 field study, however, the bioreactor and sand filter effluents
have a slightly higher pH than effluent water during the 2008 study due to the neutralizing ability
of basic limestone growth in each reactor. It is recommended that pH adjustment from limestone
be continued during future operation to maintain IDSWQS pH between 6.5 and 9.
10/1
0/20
11
9/15
/201
1
8/29
/201
1
8/11
/201
1
7/25
/201
1
7/7/20
11
6/23
/201
1
6/13
/201
1
6/2/20
11
5/28
/201
1
5/12
/201
1
9
8
7
6
5
4
3
pH
PE
R1
R2
R3
SF
Facility
Time Series Plot of pH
Figure 4. Time Series plot of pH.
DO and ORP measurements taken in the field are key indicators for the Se reducing ability of
the system. Initially the pond effluent was oxidizing with a DO concentration of 13.36 ppm and
an ORP of +216 mV. After the two week static growth period, bioreactor and sand filter effluent

8
DO concentrations decreased significantly indicating that microbial respiration removed DO and
established reducing conditions as shown in Figure 5 and Figure 6. Similar to the pH trend, DO
and ORP levels in the pond effluent material decreased slightly during the test due to
intermittent recirculation to the pond. It is notable that bioreactor and sand effluent contained
less than 6 ppm DO required by IDSWQS to support aquatic life. Although it is likely that the DO
increases above 6 ppm a few moments after discharge, a simple re-oxygenation process will be
required for system effluent prior to discharge to the natural outfall.
The original project premise was to treat water containing approximately 400 ppb Se, however,
the bioreactor treatment systems offer flexibility to remove Se at various levels. Over the course
of the test the Se concentration in the retention pond decreased 85% from a high of 2410 ppb in
May to a low of 354 ppb on October 13th when the last samples were obtained prior to system
shutdown as shown in Figure 7. The marked decrease in Se content in the pond was partially
due to intermittent recirculation from the sand filter discharge to maintain a pond water level
high enough to support process flow rates. History has shown the initial run-off period during the
spring contain the highest metals values being flushed out of waste rock piles. The system had
to be operated by alternating from discharge to the original drainage and recirculation to the
pond on a semi-weekly basis in order to maintain enough water to treat at desired flow rates.
There was no Se speciation data acquired during the course of the test to determine selenate
and selenite species distribution, however, previous data suggests selenate was the
predominate form and the bioreactor system does not preferentially reduce one form over the
other.
10/13/
2011
9/19
/201
1
9/1/
2011
8/18
/201
1
8/1/
2011
7/11
/201
1
6/27
/201
1
6/13
/201
1
6/6/20
11
5/28
/201
1
5/12
/201
1
18
16
14
12
10
8
6
4
2
0
PP
M
6
PE
R1
R2
R3
SF
Facility
Time Series Plot of DO
Figure 5. Time Series plot of DO.

9
10/13/
2011
9/19
/201
1
9/1/
2011
8/18
/201
1
8/1/
2011
7/11
/201
1
6/27
/201
1
6/13
/201
1
6/6/20
11
5/28
/201
1
5/12
/201
1
300
200
100
0
-100
-200
-300
-400
mV
PE
R1
R2
R3
SF
Facility
Time Series Plot of ORP
Figure 6. Time Series plot of ORP.
10/3
/201
1
9/12
/201
1
9/1/20
11
8/22
/201
1
8/11
/201
1
8/1/20
11
7/18
/201
1
7/7/20
11
6/27
/201
1
6/16
/201
1
6/6/20
11
2500
2000
1500
1000
500
0
PP
B
5
PE
R1
R2
R3
SF
CBE
Variable
Total Selenium
Figure 7. Time Series Plot of Total Se.
10
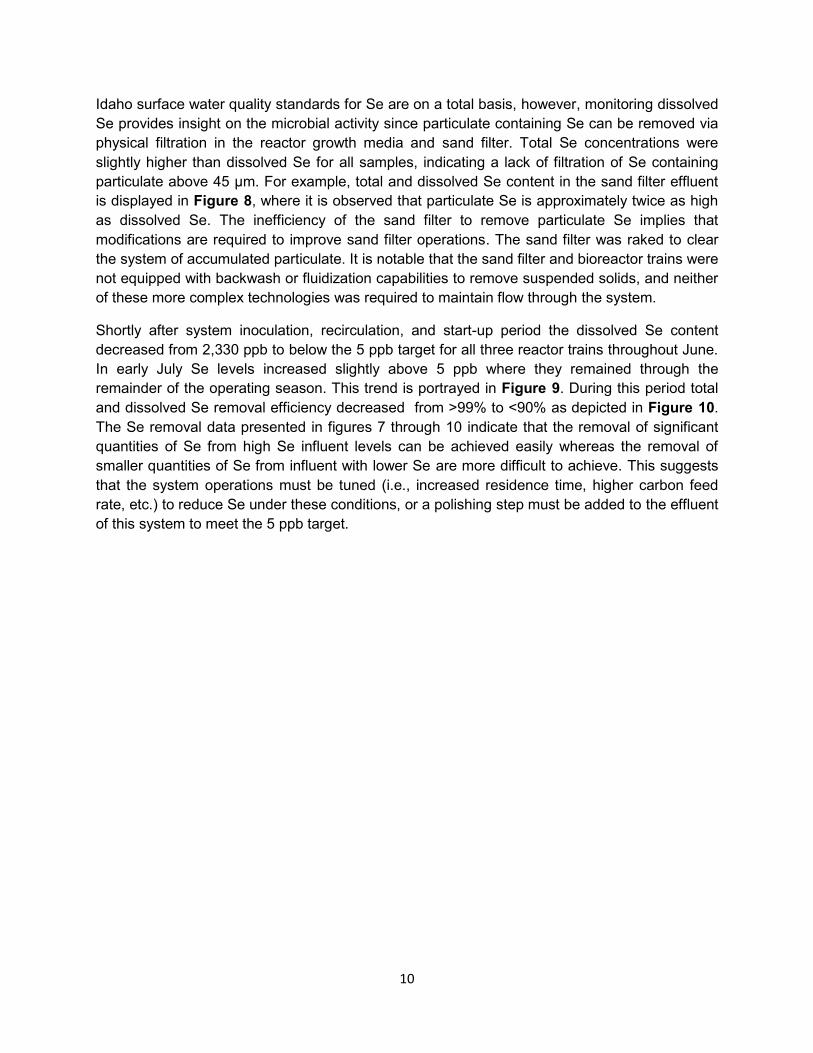
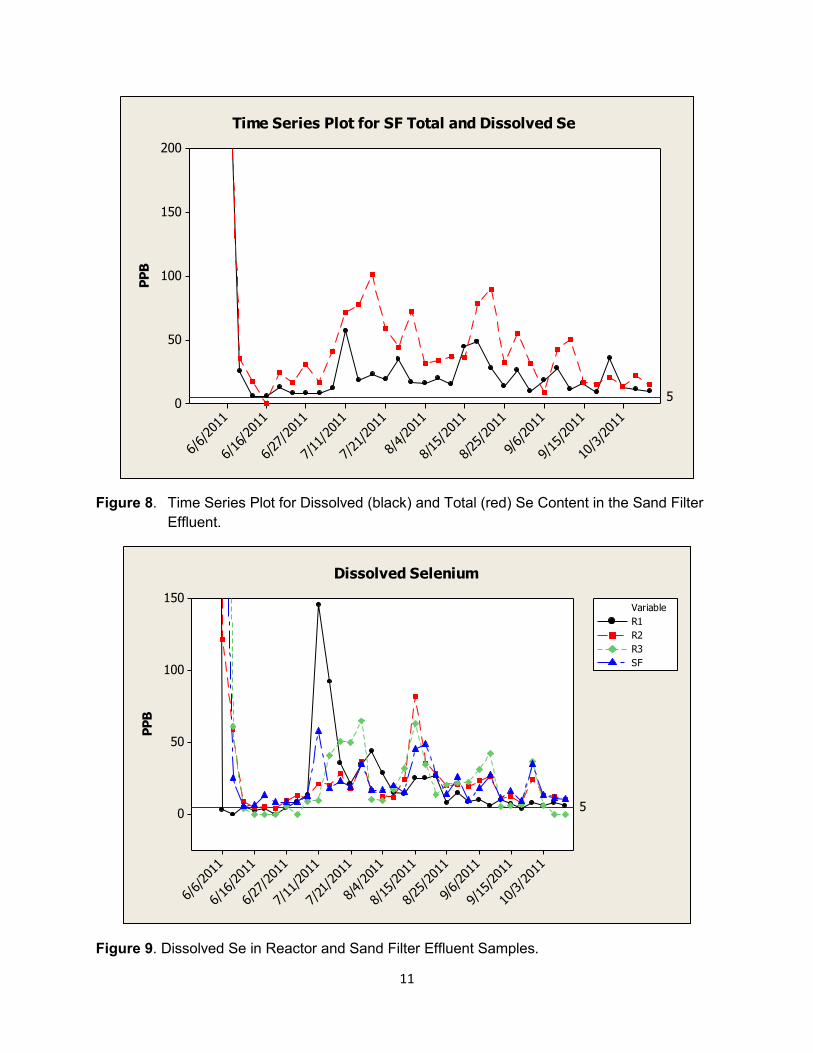
Idaho surface water quality standards for Se are on a total basis, however, monitoring dissolved
Se provides insight on the microbial activity since particulate containing Se can be removed via
physical filtration in the reactor growth media and sand filter. Total Se concentrations were
slightly higher than dissolved Se for all samples, indicating a lack of filtration of Se containing
particulate above 45 μm. For example, total and dissolved Se content in the sand filter effluent
is displayed in Figure 8, where it is observed that particulate Se is approximately twice as high
as dissolved Se. The inefficiency of the sand filter to remove particulate Se implies that
modifications are required to improve sand filter operations. The sand filter was raked to clear
the system of accumulated particulate. It is notable that the sand filter and bioreactor trains were
not equipped with backwash or fluidization capabilities to remove suspended solids, and neither
of these more complex technologies was required to maintain flow through the system.
Shortly after system inoculation, recirculation, and start-up period the dissolved Se content
decreased from 2,330 ppb to below the 5 ppb target for all three reactor trains throughout June.
In early July Se levels increased slightly above 5 ppb where they remained through the
remainder of the operating season. This trend is portrayed in Figure 9. During this period total
and dissolved Se removal efficiency decreased from >99% to <90% as depicted in Figure 10.
The Se removal data presented in figures 7 through 10 indicate that the removal of significant
quantities of Se from high Se influent levels can be achieved easily whereas the removal of
smaller quantities of Se from influent with lower Se are more difficult to achieve. This suggests
that the system operations must be tuned (i.e., increased residence time, higher carbon feed
rate, etc.) to reduce Se under these conditions, or a polishing step must be added to the effluent
of this system to meet the 5 ppb target.
11
10/3
/201
1
9/15
/201
1
9/6/20
11
8/25
/201
1
8/15
/201
1
8/4/20
11
7/21
/201
1
7/11
/201
1
6/27
/201
1
6/16
/201
1
6/6/20
11
200
150
100
50
0
PP
B
5
Time Series Plot for SF Total and Dissolved Se
Figure 8. Time Series Plot for Dissolved (black) and Total (red) Se Content in the Sand Filter
Effluent.
10/3/2
011
9/15
/201
1
9/6/20
11
8/25
/201
1
8/15
/201
1
8/4/
2011
7/21
/201
1
7/11
/201
1
6/27
/201
1
6/16
/201
1
6/6/20
11
150
100
50
0
PP
B
5
R1
R2
R3
SF
Variable
Dissolved Selenium
Figure 9. Dissolved Se in Reactor and Sand Filter Effluent Samples.

12
10/3/2
011
9/12
/201
1
9/1/
2011
8/22
/201
1
8/11
/201
1
8/1/20
11
7/18
/201
1
7/7/
2011
6/27
/201
1
6/16
/201
1
6/6/20
11
100
80
60
40
20
0
Pe
rce
nta
ge
Total Se
Dissolved Se
Variable
Se Removal Efficiency
Figure 10. Instantaneous Total and Dissolved Se Removal Efficiency between Pond and Sand
Filter Effluent Streams.
A variety of operating variables were altered in an attempt to reduce Se below 5 ppb, including:
decreasing system flow rates, adding ammonia and phosphate macronutrients from liquid
ammonium phosphate (10-34-0 fertilizer), switching carbon nutrient sources (microbial food)
from MicrocG® to a methanol/molasses mixture, changing the level of carbon nutrient addition.
However, none of these modifications were able to consistently reduce Se to below the 5 ppb
target, likely due to the sluggish biological response time. Figure 11 and Figure 12 display
ammonia and total phosphorus content, respectively, above the native pond effluent from
macronutrient addition. It should be noted that seepage from this phosphate mining waste pile
did not leach significant amounts of bio-available phosphate to support microbial growth, thus
the decision to add the liquid fertilizer, 10-34-0. On two occasions the system was shut-down to
fix pump problems and in the mean time was dosed with carbon nutrient for a three day static
growth period in an attempt to improve microbial activity. Following the static growth period Se
removal was below 5 ppb due to the long retention time, however, when returned to normal flow
through the effluent Se levels returned to >5 ppb.

13
10/10/
2011
9/29
/201
1
9/12
/201
1
8/29
/201
1
8/15
/201
1
8/1/
2011
7/18
/201
1
7/5/20
11
6/20
/201
1
6/6/20
11
1800
1600
1400
1200
1000
800
600
400
200
0
PP
B
PE
R1
R2
R3
SF
CBE
Variable
Ammonia Nitrogen (Nitrate is negligable)
Figure 11. Time Series Plot of Nitrogen as Ammonia.
10/10/
2011
9/29
/201
1
9/12
/201
1
8/29
/201
1
8/15
/201
1
8/1/
2011
7/18
/201
1
7/5/20
11
6/20
/201
1
6/6/20
11
2000
1500
1000
500
0
PP
B
PE
R1
R2
R3
R4
CBE
Variable
Total Phosphorus
Figure 12. Time Series Plot of Total Phosphorus.

14
No attempt was made to increase the temperature of water input to the system since the
temperature of pond effluent samples was stabilized near the average of 10.5 °C throughout the
entire operating period as shown in Figure 13. These water temperatures are significantly
higher than those observed during a brief operation in September through November 2010 at
the South Rasmussen mine, where little Se removal was primarily attributed to cold weather
coupled with the lack of an established Se reducing population. Beginning in early July, the
temperature of bioreactor and sand filter effluent was 50% higher than the pond effluent. This
increase in water temperature through the system is indicative of potentially an expenditure of
excess energy from microbial activity, and it is observed that the onset of this marked
temperature increase corresponds with reactor and pond effluent Se levels above 5 ppb.
10/13/
2011
9/19
/201
1
9/1/20
11
8/18
/201
1
8/1/20
11
7/11
/201
1
6/27
/201
1
6/13
/201
1
6/6/20
11
5/28
/201
1
5/12
/201
1
20.0
17.5
15.0
12.5
10.0
7.5
5.0
de
g C
PE
R1
R2
R3
SF
Facility
Time Series Plot of Temperature
Figure 13. Time Series Plot of Influent and Effluent Temperature.
TOC concentration in bioreactor and sand filter effluents were higher than pond effluent as
shown in Figure 14, indicating excess carbon nutrient was used to drive microbial respiration of
dissolved selenium. Irregardless of the excess carbon fed to the system, there were no
instances of severe pluggage due to the accumulation of biomass or other particulate matter
similar to that experienced during the 2008 pilot study. Lower carbon substrate addition was
intentionally used to prevent these operational issues that typically require fluidization and/or
backwashing operations. Figure During periods when the system effluent was being re-
circulated to the pond, the residual TOC in the system effluent was likely causing Se removal
within the pond due to the presence of selenium-reducing bacteria in the pond coupled with the
long residence time.
15
The target carbon nutrient concentration input to the process was set at 10 ppm TOC to mitigate
potential fouling and pluggage issues from excessive microbial growth. However, the residual
TOC measured in system effluent samples was consistently above 10 ppm. This showed more
carbon was being fed to the system than was being consumed. During these studies biological
oxygen demand (BOD) was also measured (data not shown). In the future it is proposed to
eliminate BOD from the analyte list. In complex waste water streams there is some advantage
to measuring both TOC and BOD as not all organic carbon is readily available for
biodegradation. However, in a relatively clean system that is being dosed with a labile carbon
source, TOC and BOD are essentially equivalent. The measurement of BOD is cumbersome, is
plagued by many complicating factors, and is poorly reproducible. In contrast, TOC
measurement is straight forward and highly reproducible, and thus measurement of only TOC in
the future will provide the data required for bioreactor operation and optimization.
The carbon nutrient source was changed from MicrocG® to a mixture of methanol and
molasses on July 26th, and shortly thereafter TOC levels in bioreactor and pond effluent
dropped significantly due to decreased carbon nutrient flow as shown in Figure 15. The new
carbon nutrient source, methanol and molasses, was diluted with pond water to reduce the flash
point because the mixture is stored in a 250 gallon tank in an enclosure where fumes could
buildup if it was not diluted. (See Figure 3). The carbon nutrient source is added to the pond
effluent (raw water feed) through an eductor installed on a small bypass stream that is
recombined to the common raw water feed immediately upstream from the bioreactor influent
header. Due to issues maintaining control over accurate and consistent carbon addition and
potential air infiltration through the eductor, improved carbon addition equipment should be
considered for future operation.

16
10/1
0/20
11
9/29
/201
1
9/12
/201
1
8/29
/201
1
8/15
/201
1
8/1/
2011
7/18
/201
1
7/5/
2011
6/20
/201
1
6/6/
2011
300
250
200
150
100
50
0
PP
M
PE
R1
R2
R3
SF
CBE
Variable
TOC
Figure 14. Time Series Plot of TOC.
10/1
3/20
11
9/15
/201
1
9/1/20
11
8/11
/201
1
7/22
/201
1
7/7/20
11
6/21
/201
1
6/9/20
11
6/3/20
11
5/29
/201
1
5/26
/201
1
5
4
3
2
1
0
GP
H
Time Series Plot of Carbon Feed
Figure 15. Time Series Plot of Carbon Nutrient Flow Rate.
17
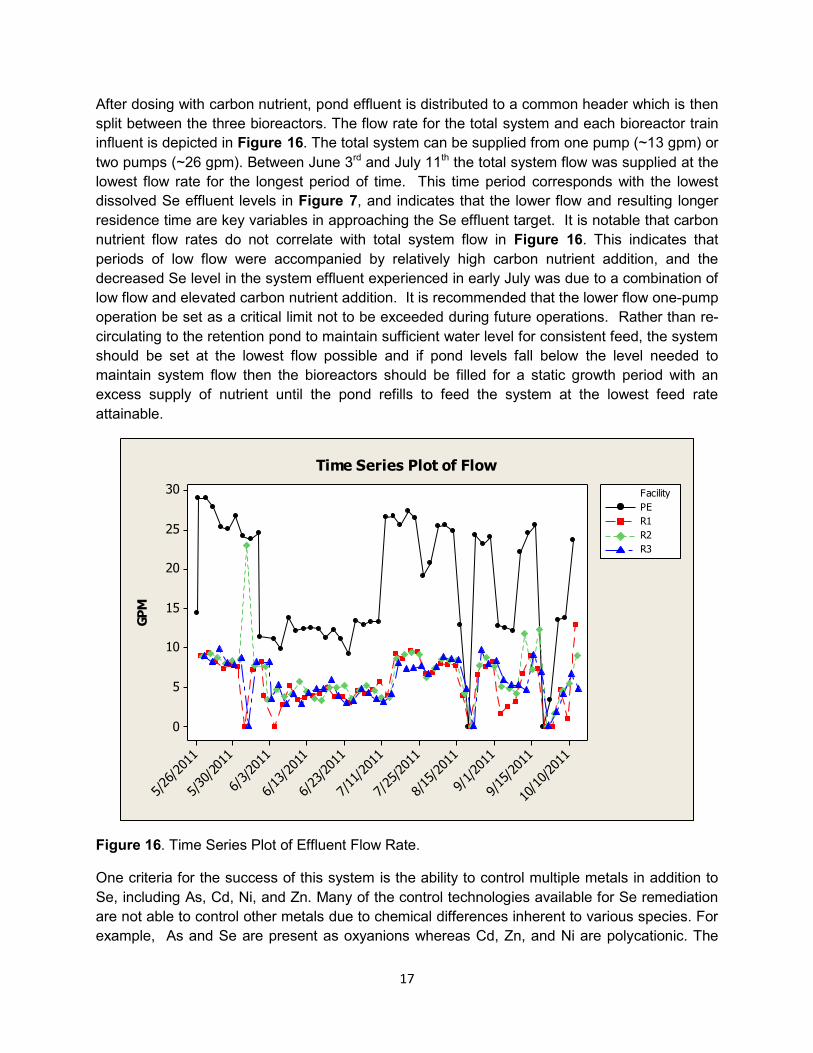
After dosing with carbon nutrient, pond effluent is distributed to a common header which is then
split between the three bioreactors. The flow rate for the total system and each bioreactor train
influent is depicted in Figure 16. The total system can be supplied from one pump (~13 gpm) or
two pumps (~26 gpm). Between June 3rd and July 11th the total system flow was supplied at the
lowest flow rate for the longest period of time. This time period corresponds with the lowest
dissolved Se effluent levels in Figure 7, and indicates that the lower flow and resulting longer
residence time are key variables in approaching the Se effluent target. It is notable that carbon
nutrient flow rates do not correlate with total system flow in Figure 16. This indicates that
periods of low flow were accompanied by relatively high carbon nutrient addition, and the
decreased Se level in the system effluent experienced in early July was due to a combination of
low flow and elevated carbon nutrient addition. It is recommended that the lower flow one-pump
operation be set as a critical limit not to be exceeded during future operations. Rather than re-
circulating to the retention pond to maintain sufficient water level for consistent feed, the system
should be set at the lowest flow possible and if pond levels fall below the level needed to
maintain system flow then the bioreactors should be filled for a static growth period with an
excess supply of nutrient until the pond refills to feed the system at the lowest feed rate
attainable.
10/1
0/20
11
9/15
/201
1
9/1/20
11
8/15
/201
1
7/25
/201
1
7/11
/201
1
6/23
/201
1
6/13
/201
1
6/3/20
11
5/30
/201
1
5/26
/201
1
30
25
20
15
10
5
0
GP
M
PE
R1
R2
R3
Facility
Time Series Plot of Flow
Figure 16. Time Series Plot of Effluent Flow Rate.
One criteria for the success of this system is the ability to control multiple metals in addition to
Se, including As, Cd, Ni, and Zn. Many of the control technologies available for Se remediation
are not able to control other metals due to chemical differences inherent to various species. For
example, As and Se are present as oxyanions whereas Cd, Zn, and Ni are polycationic. The

18
anaerobic bioreactor system offers two mechanisms to remove metals, including direct
enzymatic reduction to insoluble elemental forms, and reduction of sulfate to form sulfide anions
to precipitate cationic metal ions as insoluble metal-sulfide species. This system demonstrated
the ability to reduce levels of these metals in bioreactor effluent samples throughout operations
presumably utilizing both mechanisms.
Although the total As level in the retention pond is below IDSWQS for dissolved As (150 ppb),
the bioreactors consistently reduced As below 5 ppb. Figure 17 provides an example of total
and dissolved As in reactor 3 effluent, which is representative of the other trains and the sand
filter. The difference between total and dissolved As levels is not as significant as the difference
between total and dissolved Se observed in Figure 6. This suggests that either As particulate
are larger than Se particulate and are more able to be captured by the system, or As particulate
are below 45 μm and cannot be filtered prior to analytical characterization.
9/29
/201
1
8/1/
2011
7/18
/201
1
7/11
/201
1
7/5/20
11
6/23
/201
1
6/16
/201
1
6/9/
2011
6/2/20
11
35
30
25
20
15
10
5
0
PP
B
Arsenic, Dissolved
Arsenic, Total
Figure 17. Time Series Plot of Total (red) and Dissolved (black) Arsenic in Reactor 3 Effluent.
The IDSWQS for dissolved Cd is considerably lower than other metals at 1.3 ppb (See Table 1
with footnotes) and has been calculated based on hardness. Cd concentrations in the retention
pond varied above this level between 2 and 14 ppb, and the bioreactor system was able to
reduce dissolved Cd below the analytical method detection limit (MDL) of 1.5 ppb) as shown in
Figure 18. Every attempt will be made for future Cd analyses to ensure that the MDL is below
the IDSWQS to confirm that the level of Cd removal is consistent with IDSWQS. However, it
should be noted that because of the high concentration of calcium and magnesium in the
samples, this may not be possible. The MDL established by the laboratory is 0.3 ppb but
because of interferences due to the high concentrations of calcium and magnesium in the

19
sample, all sample had to be diluted fivefold, thus raising the MDL above the IDSWQS for
cadmium.
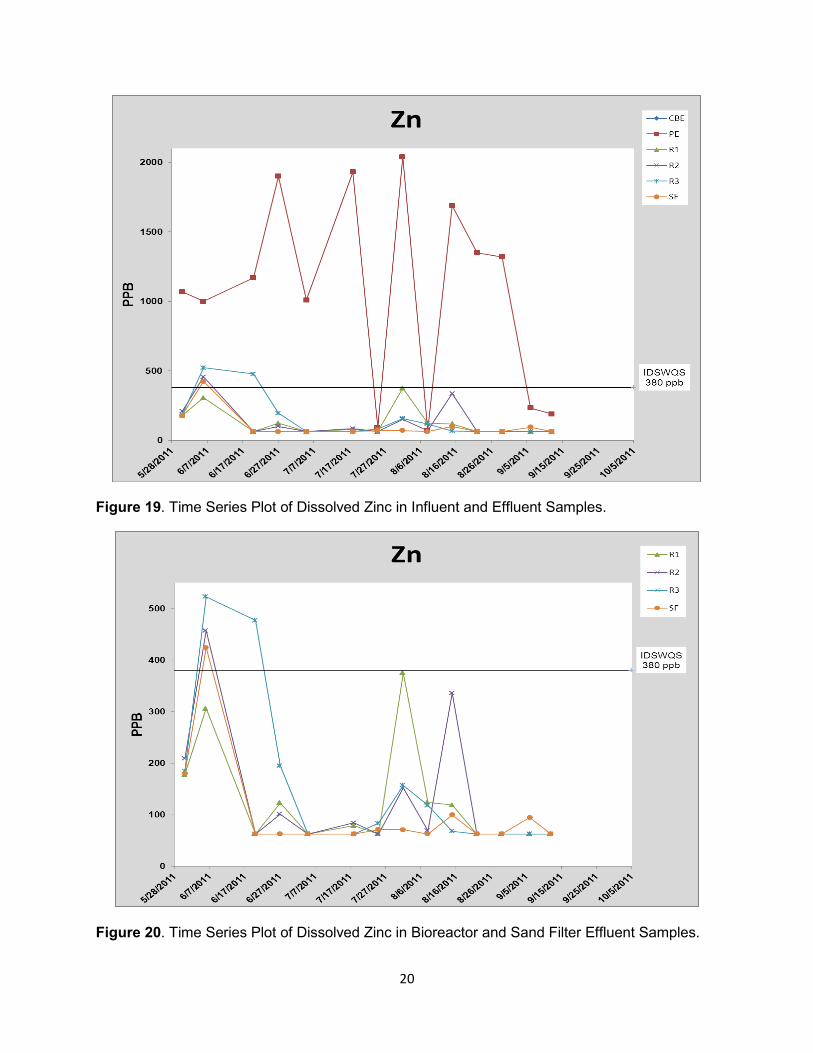
As shown in Figure 19 and Figure 20, zinc levels were consistently between 1 and 2 ppm in the
Pond. As water treatment progressed, the Zn levels in bioreactor and sand filter effluent
dropped below the MDL of 62.5 ppb..
Figure 18. Time Series Plot of Dissolved Cadmium in Influent and Effluent Samples.
20
Figure 19. Time Series Plot of Dissolved Zinc in Influent and Effluent Samples.
Figure 20. Time Series Plot of Dissolved Zinc in Bioreactor and Sand Filter Effluent Samples.
21
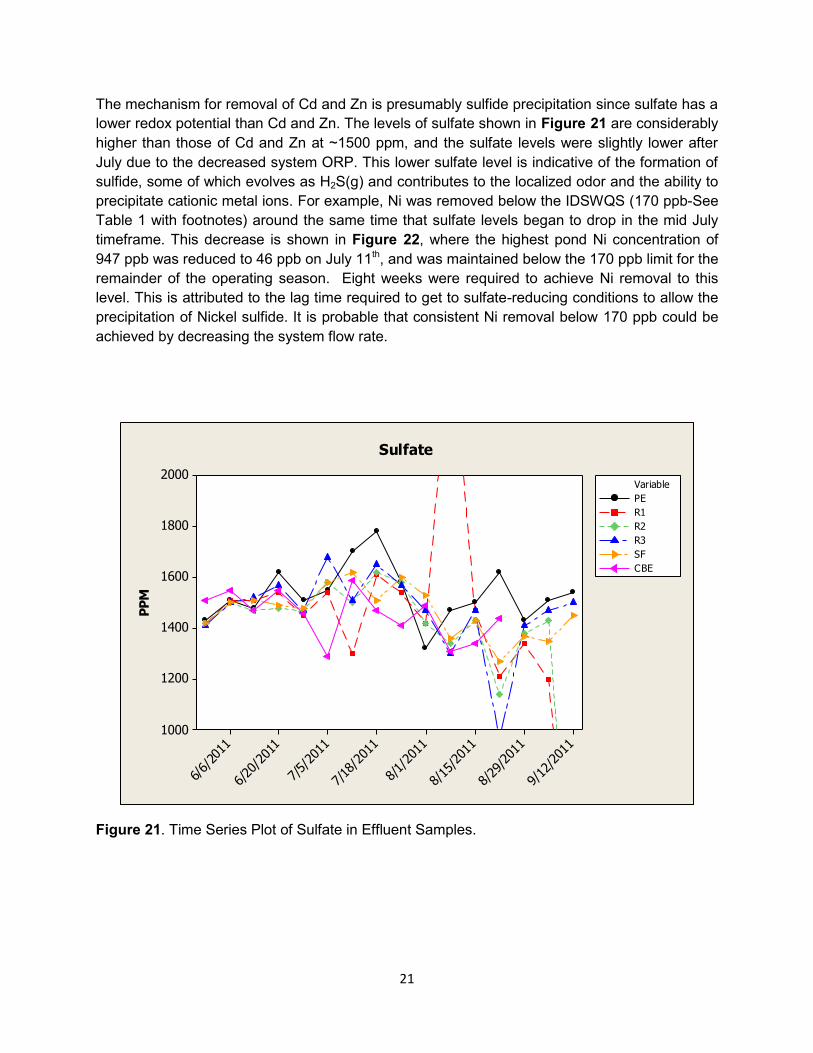
The mechanism for removal of Cd and Zn is presumably sulfide precipitation since sulfate has a
lower redox potential than Cd and Zn. The levels of sulfate shown in Figure 21 are considerably
higher than those of Cd and Zn at ~1500 ppm, and the sulfate levels were slightly lower after
July due to the decreased system ORP. This lower sulfate level is indicative of the formation of
sulfide, some of which evolves as H2S(g) and contributes to the localized odor and the ability to
precipitate cationic metal ions. For example, Ni was removed below the IDSWQS (170 ppb-See
Table 1 with footnotes) around the same time that sulfate levels began to drop in the mid July
timeframe. This decrease is shown in Figure 22, where the highest pond Ni concentration of
947 ppb was reduced to 46 ppb on July 11th, and was maintained below the 170 ppb limit for the
remainder of the operating season. Eight weeks were required to achieve Ni removal to this
level. This is attributed to the lag time required to get to sulfate-reducing conditions to allow the
precipitation of Nickel sulfide. It is probable that consistent Ni removal below 170 ppb could be
achieved by decreasing the system flow rate.
9/12
/201
1
8/29
/201
1
8/15
/201
1
8/1/
2011
7/18
/201
1
7/5/
2011
6/20
/201
1
6/6/
2011
2000
1800
1600
1400
1200
1000
PP
M
PE
R1
R2
R3
SF
CBE
Variable
Sulfate
Figure 21. Time Series Plot of Sulfate in Effluent Samples.

22
Figure 22. Time Series Plot of Nickel in Effluent Samples.
Conclusions and Recommendations from Pilot Test
In summary, the three train bioreactor system treated a combined volume of over 3 million
gallons over the course of the pilot study. Although selenium was not consistently removed
below 5 ppb, the system removed approximately 12.5 pounds of a total of 16 pounds of Se that
passed through the system for a 70% efficiency for removal of total Se. For the majority of the
operating season, total and dissolved Se concentrations were between 99% and 80%. Neither
of the three trains demonstrated greater Se removal or consistency which suggests negligible
impacts from the growth media composed of limestone and activated carbon. The system also
demonstrated good ability to control Cd, Zn, As, and Ni, and total metals control could be
improved by utilizing a lower system flow rate.
In order to utilize the learnings from the bioreactor trends discussed herein to optimize
bioreactor performance to consistently meet Idaho surface water quality standards, a number of
recommendations are made for consideration prior to startup next season.
1. Test the minimum total system flow to allow longer residence time to effectively reach 5
ppb total Se , or run two of the trains in sequence to increase hydraulic residence time.
2. Do not re-circulate system effluent to the pond to mitigate the influence of treated water
on the pond water chemistry. This could be difficult as the some pond water needs to
me maintained to run the system.

23
3. Install an alternative carbon dosing system that will allow consistent and accurate dosing
without introducing additional air infiltration. Peristaltic and piston based pump systems
should be investigated further improve sand filtration to increase removal of particulate
Se.
4. Cap the secondary influent distribution system for each train to force the influent to pass
through the reactive media. Ensure that the access ports on the top of each train are in
place to mitigate the infiltration of leakage oxygen.
5. Continue to use methanol/molasses mixture as a reparable carbon substrate rather than
more costly MicrocG®.
6. Possibly conduct a tracer study utilizing Li or Br species to identify the flow paths and
retention times for each train.
7. Consider utilizing alternative carbon microbial growth mediums.
8. Eliminate the analytes that weren’t present in the dump seep during the 2011 campaign.
and focus on key analytes, including: total and dissolved Se, dissolved Ni, Cd, Zn, TOC,
DO, ORP, pH, Temperature,
9. Conduct laboratory support studies to identify operating trends and flexibilities to
consistently meet target Se concentrations

24
References:
AMEC Geomatrix, 2008 - Preliminary Draft Treatability Summary Report, Horseshoe Overburden Area, South Rasmussen Mine, Prepared for P4 Production, December 2008.
Idaho Administrative Procedures Act (IDAPA) 58.01.02 - Water Quality Standards IAC 2011. Lee, W. H. 2000 - A History of Phosphate Mining in Southeast Idaho, U.S. Geological Survey
Open-File Report 00-425, 2000. MWH, 2010 - Ballard Mine MWD082 Seepage Pilot Treatability Study, Test Work Plan and
Sampling and Analysis Plan – Rev 3, Prepared for P4 Production, June 2010.