draft conceptual design report for hall a compton...
TRANSCRIPT

DRAFTConceptual Design Report
forHall A Compton Polarimeter
Upgrade
Sirish NandaJefferson Laboratory
andDavid LhuillierCEA-Saclay
February 12, 2004
1

Contents
1 Motivation 6
2 Conceptual Design 82.1 Photon Beam . . . . . . . . . . . . . . . . . . . . . . . . . . . . . . 8
2.1.1 Fabry-Perot Cavity . . . . . . . . . . . . . . . . . . . . . . . 92.1.2 Laser . . . . . . . . . . . . . . . . . . . . . . . . . . . . . . . 132.1.3 Transport Optics . . . . . . . . . . . . . . . . . . . . . . . . 192.1.4 Cavity Lock . . . . . . . . . . . . . . . . . . . . . . . . . . . 19
2.2 Electron Detector . . . . . . . . . . . . . . . . . . . . . . . . . . . . 242.2.1 Present Setup . . . . . . . . . . . . . . . . . . . . . . . . . . 242.2.2 Microstrip Upgrade . . . . . . . . . . . . . . . . . . . . . . . 24
2.3 Photon Calorimeter . . . . . . . . . . . . . . . . . . . . . . . . . . . 252.3.1 Limitations of the present setup . . . . . . . . . . . . . . . . 252.3.2 Semi-integrated method . . . . . . . . . . . . . . . . . . . . 272.3.3 Integrated and energy weighted method . . . . . . . . . . . 272.3.4 Calorimeter Upgrade . . . . . . . . . . . . . . . . . . . . . . 32
2.4 Data Acquisition . . . . . . . . . . . . . . . . . . . . . . . . . . . . 33
3 Expected Performances 333.1 Coincidence Analysis . . . . . . . . . . . . . . . . . . . . . . . . . . 333.2 Integrated and energy weighted photon detection . . . . . . . . . . 38
4 Cost and Schedule 414.0.1 Milestone Schedule . . . . . . . . . . . . . . . . . . . . . . . 44
2

List of Figures
1 Layout of the detection of the hall A Compton polarimeter. . . . . . 72 Relative gain of the cavity as a function of the laser frequency in
multiples of of the free spectral range (ν/∆νFSR for different mirrorfinesse . . . . . . . . . . . . . . . . . . . . . . . . . . . . . . . . . . 11
3 The Gain, Reflectivity and Phase of the reflected light as a functionof the deviation of frequency ν − ν0 from the nearest resonance. . . 12
4 Heterodyne beat signal of two identical Prometheus lasers. . . . . . . 155 Frequency tuning behavior of the Prometheus laser with Nd:YAG
crystal temperature. . . . . . . . . . . . . . . . . . . . . . . . . . . . 166 Spectral distribution of the residual intensity noise for the Prometheus
laser . . . . . . . . . . . . . . . . . . . . . . . . . . . . . . . . . . . 177 Optics table of the green Compton polarimeter. . . . . . . . . . . . . 208 Schematic view of the PDH cavity locking . . . . . . . . . . . . . . 219 The reflected light intensity in the PDH cavity lock scheme with the
incident laser beam modulated at 500 kHz . . . . . . . . . . . . . . . 2210 The PDH error signal near the resonance for small detune frequency 2311 Fit of the experimental response to a photon flux of 125 ± 7MeV ,
tagged by the 10th strip of the electron detector. The parametriza-tion uses two Gaussian curves of different width on both sides ofthe maximum and a polynomial tail at low energy. Units on thehorizontal axis are ADC channels. . . . . . . . . . . . . . . . . . . . 26
12 Simulated response of a 6×6cm BaF2 crystal to 12.5 MeV photons.a):Spectrum of energy deposited as predicted by GEANT3.21. b):Same spectrum smeared by typical PbWO4 resolution at that energy. 28
13 Mean analyzing power of the semi-integrated method (ρ = 0.5) ver-sus statistical resolution of the photon calorimeter. The vertical axisis in % change relative to the ”perfect” resolution case. . . . . . . . 29
14 Top picture: Compton asymmetry (dotted curve) and energy weightedasymmetry (dash-dotted curve) versus photon energy for a greenlaser and Ebeam = 850 MeV. On the same plot the mean (dashedcurve) and mean energy weighted (solid curve) analyzing powers canbe red with the horizontal axis standing for the detection threshold.Bottom picture: relative variation of the mean analyzing power inthe low threshold region. The energy weighting reduces of lot thesensitivity to the position of the detection threshold. . . . . . . . . . 30
15 Percentage of events depositing more than 250keV (circles), 500keV(squares) and 750keV (triangles) versus incident energy in a BaF2crystal. . . . . . . . . . . . . . . . . . . . . . . . . . . . . . . . . . . 31
3

16 δA = (AEi − AEdet)/AEi versus detection threshold for a 1.2 GeVbeam and green laser (Compton edge at 49 MeV). AEi is the meananalyzing power weighted by the incident photon energy and AEdet
is weighted by the energy deposited in the detector. Left: PbWO4
crystal of 1 RM , Right: 2 RM . The blue curves include the statisticalsmearing of the light yield of the detector. . . . . . . . . . . . . . . . 32
17 Total relative error on the beam polarization for the semi-integratedmethod with the existing setup. The reference running conditionsare taken from table 4 and evolution with beam energy follows theprocedure described in the text. The monitoring error includes onlythe error not correlated from one run to another. The energy cut at2.5 GeV is due to the limited operating range of the electron detector. 35
18 Expected performances of the semi-integrated method with the up-graded polarimeter. Solid curves are for a 40 minutes run, dashedcurves are for 1 day. The envelope defined by two curves of the sametype comes from the two different ways of evolving the response func-tion error versus beam energy (see text for details). . . . . . . . . . 39
19 Expected performances of the integrated and energy weighted methodwith the upgraded polarimeter. The beam energy is fixed at 850 MeV. 42
4

List of Tables
1 Relevant quantities of the Compton kinematics for the existing andproposed polarimeter setups. YDet is the vertical gap between the pri-mary beam and Compton edge at the location of the electron detec-tor. The following parameters are used: Ibeam = 50µA, Pe = 75%,Pγ = 100%, σe = 100µm, σγ = 100µm and αcrossing = 23.5 mrad.< A > is the mean analyzing power with a detection threshold setto ρ = k
′/kmax = 0.5. < AE > is the same quantity for the low
threshold and energy weighted method. . . . . . . . . . . . . . . . . 82 Optical Cavity Specifications . . . . . . . . . . . . . . . . . . . . . . 133 Prometheus Laser Specifications . . . . . . . . . . . . . . . . . . . . 184 Typical error budget of the ”response function” analysis for a 40
minutes run with E=4.5 GeV, I=40 µA, Pγ = 1500 W and λ = 1064nm. All errors are relative and Pe ' 70%. The arrows indicate theexpected error after the upgrade of the laser and the detectors withthe same kinematics. . . . . . . . . . . . . . . . . . . . . . . . . . . 36
5 Typical error budget of a ”integrated and energy weighed” measure-ment at 850 MeV with Pγ = 3000 W and λ = 532 nm. All otherrunning conditions are identical to table 4. . . . . . . . . . . . . . . 41
6 Cost Estimate . . . . . . . . . . . . . . . . . . . . . . . . . . . . . . 43
5

Abstract
We propose a performance upgrade of the present Hall A Compton Po-larimeter by doubling the laser frequency as well as the intra-cavity powerwith commercially available components. The existing Fabry-Perot cavityoperating at 1064 nm (IR) with about 1.5 kW power will be replaced bya 532 nm (green) cavity with twice the power, resulting in a four-fold en-hancement of the Figure of Merit (σ < A >2) of the Compton polarimeter.Associated improvements to the electron detector, the photon calorimeter,and data acquisition method are likely to achieve 1% absolute accuracy ofbeam polarization measurement down to 0.85 GeV beam energy.
1 Motivation
The upgrade of the Compton polarimeter is motivated by upcoming high accuracyexperiments with very demanding requirement on the beam polarization. Defin-ing k the photon energy and E the electron beam energy, the Figure Of Merit(F.O.M.) of a Compton measurement scales with k2 × E2, making high accuracypolarimetry a real challenge at low energy. The proposed upgrades are thus drivenby the requirement of the Lead Parity experiment of 1% relative accuracy at 0.85GeV. Sub-percent accuracy can be reached at higher beam energy although somelimitations may show up from the operating energy range of the detectors. Thebest accuracy achieved so far is taken as a reference point to discuss the hardwareupgrades and the expected error.
The present Compton setup allows the detection of both the scattered electronsand photons (Fig. 1). The most accurate analysis performed so far is reached intwo steps. First we use coincidence data to determine the response function ofthe photon detector, the highly segmented electron detector being operated as anenergy tagger. Then the polarimetry measurements rely on the photon detectoronly whose signal is integrated between a software threshold and the Comptonedge. The experimental response function previously measured allows to computethe analyzing power with high precision.
A few mm safety gap must be kept between the electron detector and theprimary beam (see section 2.2) leading to a low energy cut on the Compton spec-trum. The experimental asymmetry and the analyzing power are thus extractedusing a relatively high software threshold (ρ = k′/k′max ' 0.5) above which allthe systematics from detection are well under control. This method is called the”semi-integrated” or ”response function” analysis. It has provided polarimetrymeasurements with 1.4% total error at 4.5 GeV and 40µA in a 40 minutes.[1]
6

3rd dipole
3rd dipole
4th dipolee− detector
primary beam
scattered photons
scattered e−
Dispersive axis
Figure 1: Layout of the detection of the hall A Compton polarimeter.
Table 1 shows the Compton scattering kinematics for a IR and a green laserand for 3 different beam energies. The figure of merit at λ = 1064nm is too lowto meet the requirements of future high precision parity experiments in the 1 GeVrange (PREX, Qweak). Therefore we present in the following section an upgradeof the laser setup to double the frequency and the power of the light accumulatedin the optical cavity.Two strategies are discussed for the detection of the Compton scattered particles:
- Upgrade of the semi-integrated method:Going to green doubles the separation between the scattered electrons andthe primary beam (Table 1). Thus the electron detector can still be used tocover half of the Compton spectrum at 0.85 GeV and determine the responsefunction of the photon detector.
- Integrated and energy weighted photon signal:A second method consists of weighing the photon signal by the energy de-posited in the detector and integrate it over the whole Compton spectrumfor each polarization state. Then the measured asymmetry can be written
AE =E+ − E−
E+ + E− (1)
with
E± = L±T±∫ 1
ρmin
E(ρ) ε(ρ)dσ
dρ(ρ) (1± PePγAl(ρ))
E is the energy deposited in the calorimeter, ε the detection efficiency. Usinga photon detector with a high light yield can bring the detection thresholdρmin small enough with respect to the Compton edge so that it can be as-sumed to be negligible. Then the sensitivity to the detector response, main
7

Table 1: Relevant quantities of the Compton kinematics for the existing and pro-posed polarimeter setups. YDet is the vertical gap between the primary beam andCompton edge at the location of the electron detector. The following parametersare used: Ibeam = 50µA, Pe = 75%, Pγ = 100%, σe = 100µm, σγ = 100µm andαcrossing = 23.5 mrad. < A > is the mean analyzing power with a detection thresh-old set to ρ = k
′/kmax = 0.5. < AE > is the same quantity for the low threshold
and energy weighted method.
λ = 1064 nm λ = 532 nmPL = 250 mW, G=6000 PL = 100 mW,30000
E (GeV) 6.0 4.5 0.85 6.0 4.5 0.85YDet (mm) 22.4 17.2 3.5 40.8 32.0 6.8Lumi (µbarn.s)−1 0.206 0.206 0.206 0.206 0.206 0.206k′max (MeV ) 582 335 12.7 1060 624 25.1σ (barn) 0.592 0.609 0.654 0.538 0.563 0.642Rate (kHz) 60.9 62.5 67.2 55.3 57.9 66.0
< A > (%) 6.06 4.66 0.94 10.91 8.62 1.85F.O.M. (σ × A2) 21.7 13.2 0.57 64.0 41.9 2.2
< AE > (%) 4.78 3.69 0.75 8.55 6.79 1.47F.O.M. (σ × A2
E) 6.8 4.1 0.18 19.7 13.0 0.69
source of systematic errors, is highly reduced. This method could be im-plemented via a ”HAPPEx like” acquisition system. In the case of a parityexperiment, the polarimetry data would then be part of the same data flux.Very similar cuts could then be applied to the polarimetry and physics data,allowing an average over a long period of time with very small bias. The en-ergy weighting is automatically implemented by the use of a thick calorimeterand keeps the analyzing power high, despite the low threshold. This methodappears as a good compromise between a high analyzing power, comparableto the differential method, and a low sensitivity to the detection provided bythe integration with low threshold.
2 Conceptual Design
2.1 Photon Beam
The relative merits of a single pass high power laser versus a high power Fabry-Perot cavity injected by a low power laser serving as the photon beam, has beenextensively studied.[2] With commercially available solid state lasers, a cavity offers
8

superior luminosity and better control over systematic errors compared to singlepass laser. Hence, our design choice for the photon beam is a high gain Fabry-Perot cavity. Our design goal is a green cavity with 3000 Watts of intra-cavitypower. With 200 mW injection power, a cavity gain of 1.5×10⁵ is required. Sucha cavity represents the state of the art in cavity technology in the 532 nm region.Nonetheless, recent advances in the manufacturing of high reflectivity and low lossdielectric mirrors as well as availability of narrow line width green lasers facilitatesthe feasibility of our challenging design goal. High gain cavities at 532 nm havebeen successfully demonstrated by the KEK-ATF group [3] and very high gain su-per cavities are being planned[4]. Recently, the PVLAS[5] group have successfullyconstructed a 532 nm cavity with geometry and gain comparable to our proposeddesign here.
2.1.1 Fabry-Perot Cavity
We propose to trap the laser beam in a non-confocal Fabry-Perot resonator madeof two highly reflective mirrors. The laser beam inside the cavity makes an infinitegeometrical series of reflected and transmitted electromagnetic field. Assumingthat the two mirrors are identical and are characterized by reflectivity r, transmis-sivity t, and absorption or other loss a and separated by a distance L, the cavitywill resonate at the frequencies νm = mc/2nL, where m is an integer, n is the re-fractive index of the medium, and c is the speed of light. The separation betweentwo consecutive resonant frequencies called the ”free spectral range” is then givenby
∆νFSR =c
2L(2)
If the mirrors have high reflectivity, the resonance peaks are much narrower than∆νFSR. The full-width at half-maximum of the resonance peak, referred to as thecavity-bandwidth, is given by
δνcav =∆νFSR
F(3)
where F = π√
r/1− r is defined as the cavity ”finesse.”Near resonance, the light power circulating in the cavity will be enhanced with
respect to the incident Laser by a factor G(ε) which may be expressed as a functionof the detuning parameter ε = (ν − νm)/∆νFSR as
G(ε) = G01
1 + (2Fπ
)2 sin2(πε)(4)
9

where
G0 =r
(1− r)2' F
π(5)
is the maximum gain at ε = 0. The cavity reflectivity is given by
R(ε) = R
[a2 + 4(1− a) sin2 πε
(1− r)2 + 4r sin2 πε
](6)
and the phase ΦR of the reflected field is given by
tan ΦR(ε) =t sin 2πε
1− 2r cos 2πε + r(r + t)− t cos 2πε(7)
Shown in Fig. 2 is the cavity gain as a function of the laser frequency inmultiples of of the free spectral range (ν/∆νFSR) for different values of finesse,with resonances occurring at integral values. Our design goal finesse of 49,000,requiring a mirror reflectivity of 99.9936%, is showin in solid line in the figure.
The cavity length will be 98 cm, so chosen as to be compatible with the existingCompton polarimeter setup in operation in Hall A. With this length, The freespectral range is a comfortable 153 MHz and the cavity bandwidth is 3.12 kHz.Themain design parameters of the proposed cavity are given in Table 2. The variationof the gain, reflectivity and phase of the reflected light as a function of the deviationof frequency from the nearest resonance for the present design is shown in Fig. 3.
It is important to point out that several groups[5][6][7] have demonstrated cav-ity finesse from 45,000 to 220,000 in the 532 nm band. The matured ion beamsputtering technology has enabled the optics industry to produce ultra-high re-flectivity mirrors. Research Electro Optics based in Colorado [9] has provided uswith a quotation for supplying the mirrors meeting the high reflectivity and highdamage-threshold (1 MW/cm2) needed for our design. This firm has recently sup-plied high finesse mirrors to the PVLAS cavities and a number of other cavityprojects. Measurements[5] indicate reflectivity exceeding 99.9997% and abosorp-tion losses less than 2 parts per million in REO mirrors have been achieved.
The design goal of 3.12 kHz cavity bandwidth is narrower than the existingIR cavity which has a 4.9 kHz bandwidth. In order to maintain resonance in aconsistent and reliable manner with such narrow bandwidths, a laser with narrowspectral line width and fast frequency tuning capability is necessary. In addition,a high bandwidth fast feedback servo system is required for frequency locking ofthe laser to the cavity. Both these aspects are discussed in the following sections.
10

0.5 1 1.5 2 2.50
0.5
1
1.5
2
2.5
3
3.5
4x 10⁻⁶
F = 1000F = 5000F = 8000F = 49000
Figure 2: Relative gain of the cavity as a function of the laser frequency in multiplesof of the free spectral range (ν/∆νFSR for different mirror finesse
11

=3.12 kHzcavνδ=152.96 MHz, FSRν∆=14989.5, 0L=0.98 m, G
(kHz)oν-ν-100 -50 0 50 100
Gai
n (G
)
0
2000
4000
6000
8000
10000
12000
14000
16000
(kHz)oν-ν-100 -50 0 50 100
Ref
lect
ivity
(R)
0
0.2
0.4
0.6
0.8
1
(kHz)oν-ν-100 -50 0 50 100
)Rφ
Pha
se (
-1
-0.5
0
0.5
1
Figure 3: The Gain, Reflectivity and Phase of the reflected light as a function ofthe deviation of frequency ν − ν0 from the nearest resonance.
12

Finally, the mechanical design of the cavity will be nearly identical to that of theexisting infrared cavity. The cavity will be made from an Invar tube with staticmirror mounts and ultra-high vacuum compatibility. Details of the mechanicaldesign may be found in Ref.[2].
Table 2: Optical Cavity Specifications
Parameter Symbol Specification
Fabry-Perot ResonatorFinesse F 49,000Power Gain G 14,990Q-factor Q 1.8×10¹¹
Length L 0.98 mFree Spectral Range ∆νFSR 153 MHzCavity Bandwidth δνcav 3.12 kHzBeam Waist Size σ 60 µm
MirrorsType Plano-ConcaveSubstrate BK7Radius of curvature ρ 0.5 mDiameter d 7.75 mmThickness t 4 mmCoating HR @532 nm 0o concave face
AR for planar faceReflectivity r 99.9936%Loss a < 5 ppmDamage Threshold 10 kW/mm2, CW
2.1.2 Laser
We propose to use a Innolight Prometheus[10] laser which is a compact solid statediode-pumped, frequency-doubled Nd:YAG laser that provides single-frequencygreen (532 nm) continuous wave (CW) output of 100 mW. It offers superb spectralline with (1 kHz) of the green output and fast frequency tuning capability via apiezo-electric transducer (PZT). These features, essential for locking the laser beamto a high-finesse cavity, make the Prometheus an ideal choice for our design.
The Prometheus consists of a laser head and a power controller unit, con-nected by an umbilical cord. The laser head has three essential components: two
13

809 nm diode lasers providing the primary pump power, a Neodymium doped Yt-trium Aluminum Garnet (Nd:YAG) crystal for 1064 nm infra-red generation, anda periodically-poled Potassium Titanium-oxide Phosphate (PPKTP) non-linearwave guide for second harmonic generation (SHG). The output of the pump diodesis coupled to the Nd:YAG crystal with focusing and mode-matching optics to ex-cite the characteristic 1064 nm lasing wavelength of the Neodymium atoms. TheNd:YAG gain medium is a monolithic system forming a non-planar ring oscillator(NPRO). The high reflective mirrors of the resonator are directly coated to thepolished faces of the NPRO crystal providing excellent stability of the infraredbeam. A magnetic field is applied to the crystal to facilitate single unidirectionallongitudinal mode (TEM00) excitation. The pump diodes and the Nd:YAG crystalare temperature stabilized with thermoelectric coolers and precision temperaturecontrollers in order to maximize the conversion efficiency to 1064 nm. Typicallyabout 30% pump power is converted into infrared.
Since SHG coefficient in non-linear crystals tend be rather small, in order tohave reasonable SHG output commercially available solid-state green lasers tra-ditionally use a secondary resonating cavity with an intra-cavity frequency dou-bling crystal. The secondary cavity mirrors typically require internal feedback tomaintain resonance, which tends to degrade the spectral line width and noise char-acteristics of the laser. In addition, such a scheme sacrifices the fast fast tuningcapability of the laser frequency. In contrast, the Prometheus accomplishes SHGin a single pass through a quasi-phase matched PPKTP wave guide. Althoughconversion efficiencies are lower than a multi-pass doubling cavity, the spectralline width of the harmonic is virtually the same as the fundamental. Illustratedin Fig. 4 spectral line width of the Prometheus, measured by the heterodyning oftwo identical lasers. The non-linear PPKTP medium is also temperature stabi-lized to optimize SHG efficiency. The Prometheus can provide simultaneous dualfrequency output, 1064 and 532 nm, phase-locked to each other.
The Prometheus offers two, slow and fast, modes of frequency tuning capabil-ities. Slow tuning is accomplished by changing the temperature of the Nd:YAGcrystal. Shown in Fig. 5 is the thermal tuning behavior of the laser. The solidcircles represent operation on a single frequency, while the open circles indicatemode-hops. The thermal tuning range at 532 nm is more than 60 GHz with a tun-ing coefficient of -6 GHz/C. However, due the large time constant of a thermalprocess, the response bandwidth is less than a hertz.
Fast tuning of the Prometheus frequency is achieved by applying an externalvoltage to a PZT element attached to the Nd:YAG crystal. The PZT element cansustain response bandwidth more than 100 kHz while providing 20 MHz of tuningrange. The PZT tuning input can, thus, be used in a fast feedback servo loop tolock the laser to an external high-finesse cavity. In addition, the same input canbe utilized for modulating the frequency of the laser.
14

Prometheus Product Line / User’s Manual _______________________________________________________________________________________________
15
4.4 Spectral Linewidth
Another important feature of the Prometheus Product Line is the extremely small spectral linewidth of the laser due to the monolithic cavity. An upper limit for the intrinsic spectral linewidth of such a laser can be obtained by optically heterodyning two identical lasers and analyzing the beat signal with a spectrum analyzer as illustrated in the following Figure 4.5:
-10000 -5000 0 5000 10000-110
-100
-90
-80
-70
-60
-50
-40
-30
-20
FWHM < 1 kHz
Bea
t sig
nal [
dBm
]
Frequency [Hz]
Figure 4.5: Heterodyne beat signal of two identical Prometheus lasers,
using the fundamental light at 1064 nm
The typical full width at half maximum (FWHM) or –3 dB linewidth derived from such a measurement is about 1 kHz, giving an upper limit for the intrinsic spectral linewidth of the two individual lasers, limited by the spectral resolution bandwidth of the measurement system. The combination of reliable single longitudinal frequency operation at nearly 600 THz with an extremely small linewidth of less than 1 kHz is the key feature for using lasers of the Prometheus Product Line as optical length and frequency standards.
Figure 4: Heterodyne beat signal of two identical Prometheus lasers.
15

20 25 30 35 40 45563,21
563,22
563,23
563,24
563,25
563,26
563,27
563,28
563,29
Frequency [THz]
Tem perature [°C]
Figure 5: Frequency tuning behavior of the Prometheus laser with Nd:YAG crystaltemperature.
16

0,0 0,5 1,0 1,5 2,0 2,5−170
−160
−150
−140
−130
−120
−110
−100
DetectorNoise
Noise Eateractive
Free running
RIN
[dB/Hz]
Frequency [M H z]
Figure 6: Spectral distribution of the residual intensity noise for the Prometheuslaser
17

The Prometheus offers excellent noise characteristics. Illustrated in Fig. 6 isthe spectral distribution of the residual intensity noise (RIN) of the laser. In freerunning mode the, the spike in the noise spectrum occurring at about 600 kHzis due to the relaxation oscillations of the NPRO crystal. This noise can be sup-pressed with a noise reduction mechanism that samples a fraction of the outputbeam and feeds an error signal back to the pump diode current. With this ”noiseeater” option the RIN of the Prometheus is close to the shot noise limit of mostphoto diode detectors.
Table 3: Prometheus Laser Specifications
Wavelength 532 nmOutput Power 100* mWMode TEM00
Beam roundness (M2) < 1.1Beam diameter 0.38 mmBeam divergence 2.8 mradPolarization > 100:1Thermal tuning coefficient -6 GHz/KThermal tuning range 60 GHzThermal response bandwidth 1 HzPZT tuning coefficient 2 MHz/VPZT tuning range ±200 MHzPZT response bandwidth 100 kHzSpectral line width 1 kHz/100 msCoherence length >1 kmFrequency drift 2 MHz/minRelative Intensity Noise (RIN) > -90 dB/HzNoise eater option RIN > -140 dB/Hz
*Initial power. Power will be upgraded to 200 mW
The specifications of the Prometheus laser are shown in Table.3. The Prometheusis presently offered at 100 mW power in the green. However, although not com-mercially offered yet, it can be upgraded in the near future to 200 mW. We plan tostart with the 100 mW version for bench tests and prototype development of thecavity system. The injection power requrement for the final design will be decidedbased on the actual gain achieved in the prototype cavity.
18

2.1.3 Transport Optics
Details of the transport optics will be fixed by the study of the cavity in test setup.In this section we give a tentative list of the optical elements based on the existingsetup. Figure 7 illustrates the main blocks required along the laser line:
- Linear polarization: A set of polarizers purifies the linear polarization of thelaser.
- Remote laser intensity control: A half wave plate and an extra polarizer canprovide a remote intensity control, useful for the study of the systematicsassociated with dead time and pile up.
- Remote polarization reversal: The reversal of the photon polarization isdriven by a rotatable quarter-wave plate. A Pockels cell could be used fora higher reversal frequency depending on the feedback stability and lockingtime.
- Focusing and steering control: The laser beam waist at the C.I.P. is fixed bya set of lenses. The coupling of the laser beam to the cavity optical axis isoptimized by remote controlled mirrors. Effect of birefringence is reduce bythe couples of mirrors rotating around perpendicular axis.
- Remote polarization monitoring: A polarization analyzing line similar to theexisting one is proposed to monitor the polarization of the laser.
2.1.4 Cavity Lock
The cavity in our design has fixed mirrors in a stable enclosure. Nonetheless,thermal and acoustic noise will introduce fluctuations in the cavity length far inexcess of the cavity bandwidth. Hence, a dynamic feedback loop is necessaryto constantly adjust the laser frequency to follow changes in cavity length. Weplan to implement the well proven Pound-Drever-Hall[11] (PDH) method to lockthe laser to the cavity. As shown in Fig. 3 the phase of the reflected light ΦR,near resonance, is proportional to the detune frequency and goes through a zerocrossing on resonance. Hence, ΦR can be used as an error signal in a feedbackloop. The PDH scheme provides a method of determining ΦR by measuring thephase difference between frequency modulated sidebands and the main carrier inthe power reflected by the cavity. A schematic view of the proposed PDH lockset up is shown in Figure 8. The formalism of reflection of phase modulatedlight from a cavity have been discussed extensively elsewhere.[11][8][2] Here wecover the essential features. Before injection to the cavity the laser light is phase
19

/4λ
/2λ
/4λPo
lari
zatio
nco
ntro
l
L1 L2
Cav
ityex
it m
irro
rF
ocus
ing
cont
rol
Cal
cite
Pris
m
Lef
t
CC
D
Bea
m S
plit.
Las
er
Pol.
Pola
rize
rs
Inte
grat
ing
Sphe
res
Rig
ht
Bea
m S
plitt
er
PD3
piez
o m
irro
rC
avity
Osc
illat
or Loc
k−In
Am
pPD
1
Fee
dbac
k
Mot
oriz
ed m
irro
rsM
2M
1
PD2
Pola
riza
tion
mon
itori
ngPu
re li
near
Inte
nsity
con
trol
Figure 7: Optics table of the green Compton polarimeter.
20

Σ
Error signal
Cavity
splitterBeam
Laser
Amplifier
low passfilter
Mixer
Photodiode
Dephaser
Oscillator
Figure 8: Schematic view of the PDH cavity locking
modulated by a local oscillator at a frequency Ω with a modulation amplitude m.The modulated light field is then given by
EI = Eoeiωteim cos(Ωt+ΦΩ) (8)
where ω = 2πν. Alternatively, the incident field can be expanded as a series ofBessel functions:
EI = Eo
[Jo(m)eiωt + [
∞∑k=1
Jk(m)(eik(π2+ΦΩ)eiω+t
k + eik(π2−ΦΩ)eiω−t
k )]
](9)
which gives the reflective field as
Er = Eoeiωt[J0(m)
√R(ω)eiΦR(ω)
+(i)J1(m)√
R(ω + Ω)eiΦR(ω+Ω)e+i(Ωt+ΦΩ)
+(i)J1(m)√
R(ω − Ω)eiΦR(ω−Ω)e−i(Ωt+ΦΩ)] (10)
A fraction of the intensity of the reflected field is sent to a photo-diode via a beamsplitter as shown in Fig. 8. After amplification the photo-diode voltage is mixed
21

with the local oscillator frequency. The voltage output from the mixer is then sentto a low pass filter. This cuts all frequencies above Ω and results in DC voltageoutput as follows:
Verr ∝ EoJo(m)J1(m)√
R(ω)
[√
R(ω + Ω)sin(ΦR(ω + Ω)− ΦR(ω) + (ΦΩ − ΦΩM))
+√
R(ω − Ω)sin(ΦR(ω − Ω)− ΦR(ω)− (ΦΩ − ΦΩM))] (11)
= 500 kHzΩ=3.12 kHz, cavνδ=14989.5, 0L=0.98 m, G
(kHz)oν-ν-800 -600 -400 -200 0 200 400 600 800
err
V
-1
-0.5
0
0.5
1
Figure 9: The reflected light intensity in the PDH cavity lock scheme with theincident laser beam modulated at 500 kHz
If Ω is chosen so that
∆νFSR Ω/2π δνcav
22
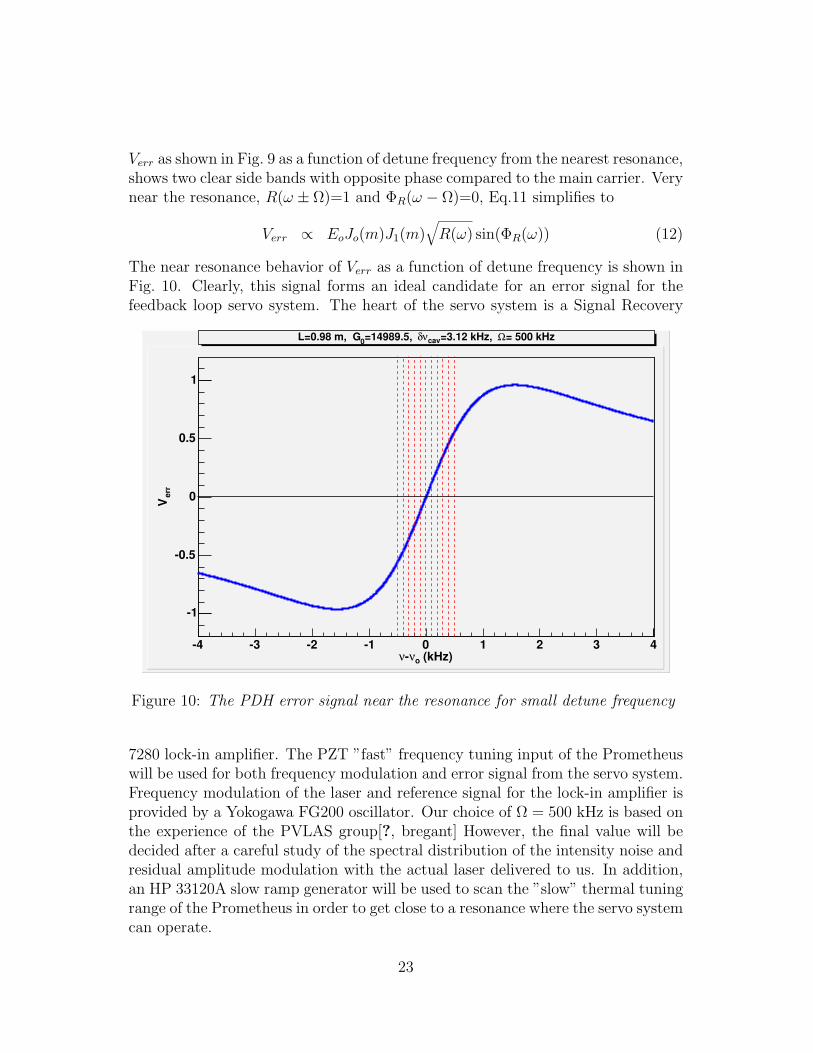
Verr as shown in Fig. 9 as a function of detune frequency from the nearest resonance,shows two clear side bands with opposite phase compared to the main carrier. Verynear the resonance, R(ω ± Ω)=1 and ΦR(ω − Ω)=0, Eq.11 simplifies to
Verr ∝ EoJo(m)J1(m)√
R(ω) sin(ΦR(ω)) (12)
The near resonance behavior of Verr as a function of detune frequency is shown inFig. 10. Clearly, this signal forms an ideal candidate for an error signal for thefeedback loop servo system. The heart of the servo system is a Signal Recovery
= 500 kHzΩ=3.12 kHz, cavνδ=14989.5, 0L=0.98 m, G
(kHz)oν-ν-4 -3 -2 -1 0 1 2 3 4
err
V
-1
-0.5
0
0.5
1
Figure 10: The PDH error signal near the resonance for small detune frequency
7280 lock-in amplifier. The PZT ”fast” frequency tuning input of the Prometheuswill be used for both frequency modulation and error signal from the servo system.Frequency modulation of the laser and reference signal for the lock-in amplifier isprovided by a Yokogawa FG200 oscillator. Our choice of Ω = 500 kHz is based onthe experience of the PVLAS group[?, bregant] However, the final value will bedecided after a careful study of the spectral distribution of the intensity noise andresidual amplitude modulation with the actual laser delivered to us. In addition,an HP 33120A slow ramp generator will be used to scan the ”slow” thermal tuningrange of the Prometheus in order to get close to a resonance where the servo systemcan operate.
23

2.2 Electron Detector
2.2.1 Present Setup
The electron detector is located a few mm above the primary beam between the3rd and the 4th dipoles of the magnetic chicane (Fig. 1). The active part consistsof 4 planes of 48 silicon micro-strips, segmented along the dipole dispersive axis inbins of 650µm. The energy of the Compton scattered electron is directly relatedto its measured position in the detector. Thus the high segmentation gives a verygood energy resolution of the order of 0.2% of the beam energy. The absence ofdead zone and the redundancy of the 4 planes make the detection efficiency closeto 100%.The main systematic error comes from the energy calibration which is directlyconnected to the error on the position along the dispersive axis. When using theelectron data only, the effect on the polarization measurement is enhanced by afactor 2 due to the quadratic dependence of the Compton edge on the beam energy
∆Pe/Pe = 2×∆Y/Y (13)
where Y is the distance between the Compton edge and the primary beam.From data taken with 3 active planes the uncertainty on the vertical position is200 microns.
2.2.2 Microstrip Upgrade
To first order, reducing the strip size, ∆Pe/Pe can be reduced in proportion to thestrip size and micro-strips as narrow as 20µm are available on the market. However,experimental constraints prevent the error on the position to simply scale with thestrip size. The main limitation comes from the fact that the laser and electronbeam spot sizes can’t be made arbitrarily small at the Compton Interaction Point(≥ 100µm). In addition we want to keep 48 channels per plane with the samefront end electronics in order to reduce the cost of the upgrade. Going to verysmall strip size would then shrink the active area of the detector and define a toonarrow operating range in beam energy. Therefore our goal is to achieve a 150 µmresolution on the vertical position of the scattered electrons using 300 µm widemicro-strips.At 850 MeV, the edge of the Compton spectrum is expected to stand at 6.8 mmabove the primary beam (see table 1). From Eq.13 the calibration induces a 4.5%relative error on the beam polarization which is way above the required accuracy forthe lead parity experiment. As already mentioned the way to reduce our sensitivityto energy calibration is to use the so-called ”response function” analysis which hasprovided the best accuracy so far. This method consists of measuring the responsefunction of the calorimeter using the electron detector as a photon energy tagger.
24

Since the parameters of this response function vary slowly with the incident photonenergy the calibration error from the electron detector has a much smaller effecton the mean analyzing power.In order to optimize the statistical and systematic errors, a software thresholdclose to ρ = k′/kmax ' 0.5 is applied on the data. Measuring the responsefunction with such a threshold at 850 MeV requires detection of Compton scatteredelectrons between 6.8 and 3.4 mm away from the primary beam (Table 1). This isequivalent to a Compton photon energy range of 12 to 25 MeV. The issue of theparametrization of the response function in this energy range is discussed in thenext section.Another issue is the sensitivity to the beam halo which has to be below 10−10
of the beam intensity to be smaller than the Compton rate. Data taken in May2003 with the electron detector at 3mm only above the primary beam showed abeam-halo at the 10−9 level at 3mm and 10−10 at 6mm. We believe the majorpart of this halo comes from the fact that the diode laser at the source doesn’tturn off completely between two beam pulses, leading to leakage from one hallto another. From extrapolation of data taken in 2001 with a Ti-Saphire laser webelieve this background can be reduced by an order of magnitude thus meetingour requirements.A remote control of the vertical position of the electron detector would be ofgreat help for the measurements at low beam energy. It could be implemented byrotating the electron detector setup by 90 degrees around the beam axis. This waythe step motor could be used to move the strip vertically instead of horizontallyin the present setup. Aside the optimization of the safety gap the vertical motionwould also expand the maximum operating beam energy (Compton edge in thelast strip) from 2.5 to around 5 GeV.
2.3 Photon Calorimeter
2.3.1 Limitations of the present setup
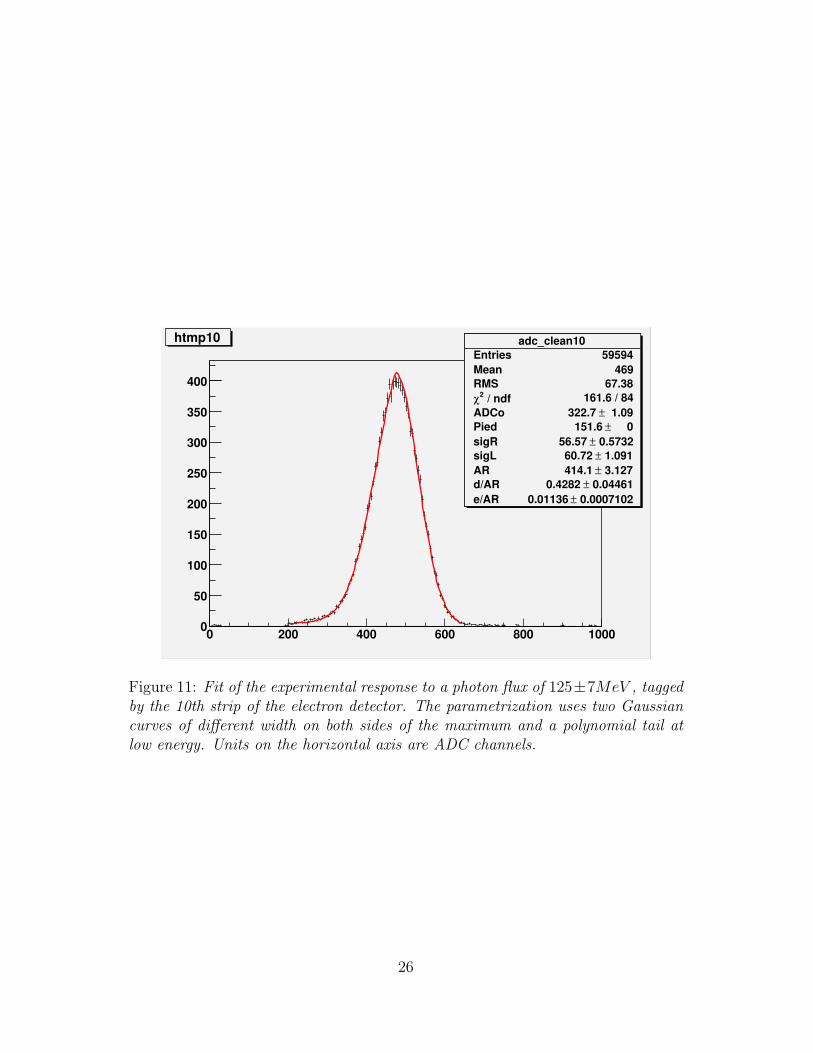
The present photon calorimeter has shown good performances at photon energiesof 50 MeV or higher. With a green laser this correspond to beam energies ≥2GeV.In that range, the interactions of the photons with a dense detector are dominatedby the e+e− pair creation process. The high multiplicity of the secondary particlesleads to a Gaussian distribution of the deposited energy with a tail at lower energydue to leakage of the electromagnetic showers in the back and on the side of thecalorimeter (Fig. 11).
The main systematic errors of the semi-integrated method are from the cali-bration of the electron detector, the parametrization of the response function and
25
0 200 400 600 800 10000
50
100
150
200
250
300
350
400
adc_clean10Entries 59594Mean 469RMS 67.38
/ ndf 2χ 161.6 / 84ADCo 1.09± 322.7 Pied 0± 151.6 sigR 0.5732± 56.57 sigL 1.091± 60.72 AR 3.127± 414.1 d/AR 0.04461± 0.4282 e/AR 0.0007102± 0.01136
htmp10 adc_clean10Entries 59594Mean 469RMS 67.38
/ ndf 2χ 161.6 / 84ADCo 1.09± 322.7 Pied 0± 151.6 sigR 0.5732± 56.57 sigL 1.091± 60.72 AR 3.127± 414.1 d/AR 0.04461± 0.4282 e/AR 0.0007102± 0.01136
Figure 11: Fit of the experimental response to a photon flux of 125±7MeV , taggedby the 10th strip of the electron detector. The parametrization uses two Gaussiancurves of different width on both sides of the maximum and a polynomial tail atlow energy. Units on the horizontal axis are ADC channels.
26

the pile up (table 4). The calibration is improved by the upgrade proposed in theprevious section. A better control of the parametrization of the response functioncan be achieved by using a calorimeter of larger transverse dimensions as com-pared to the existing 2 × 2 × 23 cm3 PbWO4 crystal. The scale is given by theMoliere radius (RM = 2.2 cm for PbWO4) and large means ≥ 2RM . This wouldsignificantly reduce the low energy tail which at present is parametrized by an adhoc polynomial. This way the response function would be closer to a Gaussianproviding physical constraints on the kind of parametrization to be used. Finallythe effect of pile up is directly proportional to the laser power and beam current.The F.O.M. of Compton polarimetry with a green laser and Ebeam ≥ 2GeV is goodenough so that studies or measurements can be performed at reduced luminosity.
2.3.2 Semi-integrated method
At beam energy as low as 850 MeV and with a green laser, the Compton edgeof the photon spectrum is at 25MeV only. In this energy range the responsefunction of the calorimeter is expected to be much more complex because Comp-ton scattering inside the detector starts to play an important role. This is illus-trated in figure 12-a. In the limit of perfect resolution several peaks spaced outby E = mec
2 = 0.511MeV appear in the spectrum of deposited energy. Theycorrespond to the full-energy peak, single escape peak, double escape peak,... Therest of the spectrum is populated by multiple Compton scattering. Taking intoaccount the observed PbWO4 resolution smears out this peak structure (Fig. 12-b)but then the mean analyzing power above ρ ' 0.5 decreases and is much moresensitive to the accuracy with which the resolution is known (Fig. 13).
Thus the semi-integrated method is still possible at low energy with the up-grades of the laser and the electron detector but the systematic errors are poten-tially high, depending on the compromise between the resolution of the calorimeterand the parametrization of the response function. The pile up may also becomean issue since the very slow statistical convergence at low energy will require themaximum luminosity.
2.3.3 Integrated and energy weighted method
Another option is the integrated and energy weighted method (Eq.1). In that casethe main requirements for the photon detector are:
- A large light yield to allow small detection threshold: Figure 14 shows thatfor the integrated and energy weighted method the slope at the origin of the
27

0
200
400
600
800
1000
1200
0 5 10
IDEntriesMeanRMS
200 10000
10.97 2.054
E (MeV)
Cou
nts ID
EntriesMeanRMS
100 10000
10.89 4.490
E (MeV)
Cou
nts
0
25
50
75
100
125
150
175
200
225
-10 0 10 20 30
Figure 12: Simulated response of a 6 × 6cm BaF2 crystal to 12.5 MeV photons.a):Spectrum of energy deposited as predicted by GEANT3.21. b): Same spectrumsmeared by typical PbWO4 resolution at that energy.
28

σ/srqt(E) (%)
δA/A
(%)
0
1
2
3
4
5
6
7
8
0 1 2 3 4 5
Figure 13: Mean analyzing power of the semi-integrated method (ρ = 0.5) versusstatistical resolution of the photon calorimeter. The vertical axis is in % changerelative to the ”perfect” resolution case.
mean analyzing power versus threshold is very flat. At Ebeam = 850MeV thedetection threshold can be anywhere between 0 and 1MeV and still have anegligible effect on the analyzing power (δA/A = 0.25% for 1MeV whereasit corresponds to 4% of the compton edge). Such a detection threshold istoo low for the PbWO4 but is definitely in the range of numerous inorganicscintillators (BGO, NaI, CsI, BaF2,...).
- A good detection efficiency. Figure 15 shows that with a dynamic rangeof 100 (0.25 to 25 MeV), the detection efficiency can be kept high and flatfrom 1 MeV until the Compton edge thus reducing the associated systematicerrors. Measurements with radioactive sources can be performed in the lowenergy region, where the efficiency starts decreasing.
- A large fiducial volume. The detector should have many radiation lengths indepth and 2 RM in the transverse dimension to contain the maximum of theshower.
Because of the typical integration gate of 33ms, no stringent constraint on thetime response is required. From preliminary simulations it also turns out that theintegrated method is little sensitive to the response function of the photon detector
29

-1
-0.5
0
0.5
1
1.5
2
2.5
3
0 2.5 5 7.5 10 12.5 15 17.5 20 22.5 25Eγ (MeV)
Asy
m (%
)
< AE> from thr. to Kmax<A> from thr. to Kmax
AE(E)
A(E)
Eγ (MeV)
<Α>(
Ε)−<
Α>(
0)/<
A>(
0) (%
)
0
0.5
1
1.5
2
2.5
3
3.5
4
4.5
5
0 0.5 1 1.5 2 2.5 3 3.5 4 4.5 5
Figure 14: Top picture: Compton asymmetry (dotted curve) and energy weightedasymmetry (dash-dotted curve) versus photon energy for a green laser and Ebeam =850 MeV. On the same plot the mean (dashed curve) and mean energy weighted(solid curve) analyzing powers can be red with the horizontal axis standing for thedetection threshold. Bottom picture: relative variation of the mean analyzing powerin the low threshold region. The energy weighting reduces of lot the sensitivity tothe position of the detection threshold.
30

0.25 MeV
0.5 MeV
0.75 MeV
E (MeV)
ε(%
)
0
0.2
0.4
0.6
0.8
1
1 10 102
Figure 15: Percentage of events depositing more than 250keV (circles), 500keV(squares) and 750keV (triangles) versus incident energy in a BaF2 crystal.
31

(Fig. 16). Even a rough parametrization of the response function should be ableto keep the systematic error well below the percent level. The same requirementfor the non-linearity of the detection chain over the whole dynamic range gives alimit of 3%.
Figure 16: δA = (AEi−AEdet)/AEi versus detection threshold for a 1.2 GeV beamand green laser (Compton edge at 49 MeV). AEi is the mean analyzing powerweighted by the incident photon energy and AEdet is weighted by the energy de-posited in the detector. Left: PbWO4 crystal of 1 RM , Right: 2 RM . The bluecurves include the statistical smearing of the light yield of the detector.
2.3.4 Calorimeter Upgrade
Assuming the upgrade to a green laser we conclude the following about the photondetector for a 2% (or better) polarimetry:
• The semi-integrated method can be used at beam energies ≥ 2 GeV withthe present setup. Increasing the transverse size of the active part of thedetector from the central crystal to the 3× 3 inner matrix would help. Thisrequires either an accurate inter-calibration of the 9 crystals or a readout ofthe whole matrix by one bigger PMT.
32

• Below 2 GeV the use of the semi-integrated method requires the upgrade toa photon detector with a better resolution than PbWO4 and a time responseof few 100ns to reduce the pile up. The depth should be around 20 radiationlengths and the transverse size 2 RM . We are investigating the possibility ofusing new materials like LSO or YAP which have very high light yield andshort time response. Unfortunately the volume required for the calorime-ter is large compared with the usual setups for lower energy gammas. Atpresent, LSO crystals remain prohibitively expensive. Our preliminary de-sign is based on a 9-cell YAP calorimeter with individual PMT’s. Tentativecost estimate is $k3.1 per channel. The new calorimeter will use the existingdata acquisition electronics.
• The integrated and energy weighted method is the most promising (see nextsection). The requirements are met by standard inorganic scintillators likeBGO. The integrating ADC should be based on the HAPPEx technology.Some electronic components need to be optimized to allow for lower fre-quency of the signal. This method could be implemented for all beam ener-gies. Cost estimate for a new crystal and its readout is below $k10.
2.4 Data Acquisition
The upgrade will use the existing data acquisition electronics and software to alarge extent. Additional acquisition and analysis software are necessary for theintegrating method at low energies. The control system for prototyping and benchtests will be LabView. The final setup in Hall A beamline will be controlled withEPICS. While much of the existing EPICS package will be reused, EPICS interfacefor the laser and cavity lock servo system need to be developed. In addition, aVME/Linux based test set up for detector tests and development of EPICS controlsoftware will be necessary.
3 Expected Performances
The expected performances at low energy of the two complementary polarimetrymethods are discussed in this section.
3.1 Coincidence Analysis
The results achieved with the response function analysis at 4.5 GeV for the N −∆and Gp
E experiments [1] are taken as a reference point to evolve the performancesof the Compton polarimeter at different beam energy and laser wave length. Thereference running conditions are: 40 minutes run duration, E=4.5 GeV, I=40 µA,
33
Pe = 70%, Pγ = 1500 W and λ = 1064 nm.The error budget of these measurements is summarized in Table 4. All errors are
relative errors. The column labeled ”Correl” refers to errors correlated from onerun to another. They can be seen as normalization errors and don’t depend on therun duration T . The ”Uncorrel” column refers to errors non-correlated from onerun to another. They behave like statistical errors and scale with 1/
√T . They
are the only contribution to the total error when considering the monitoring of Pe,with no absolute reference. Figure 17 illustrates the expected error versus beamenergy for the current setup, according the following procedure:
• The normalization error from laser polarization is constant over the wholeenergy range: δAlaser = 0.45%.
• Beam current asymmetry can be kept negligible with respect to the Comptonanalyzing power.
• All other errors scale with the analyzing power for the same run durationand same beam current
δA = δAref × AnaP ref
AnaP (E)= δAref × 4.5
E(14)
This is justified by the following arguments for each error of table 4:
– False asymmetries Ax from position and angles differences correlatedwith the helicity reversals only depend on beam properties. Then rel-ative error scale with the analyzing power. The mean value of thedistribution of Ax for all runs of N −∆ and Gp
E experiments is found tobe compatible with zero. The width of this distribution is taken as thesystematic error. It comes from the time limited accuracy of the BPMsmeasurements. Hence when averaging over a longer period of time thiserror will scale down as the statistical one. This convergence will beused at low energy to compensate the small analyzing power.
– The total counting rate doesn’t depend on the beam energy. Thereforedead time is expected to remain a the same level and the relative errorto scale with the analyzing power.
– The background level in the compton detectors is very sensitive to thebeam tune. Signal over background ratio of 20 were already achievedin an energy range of 3.3 to 5.7 GeV. The need of a safety gap of ' 4mm between the electron detector and the primary beam leads to aminimum operating energy of 2.5 GeV.
34

0
0.25
0.5
0.75
1
1.25
1.5
1.75
2
2.25
2.5
2 3 4 5 6 7 8
Semi-int. method
E (GeV)
δPe/
Pe (
%)
40 min. run2 hours run
E (GeV)
δPe/
Pe (
%)
0
0.25
0.5
0.75
1
1.25
1.5
1.75
2
2.25
2.5
2 3 4 5 6 7 8
Figure 17: Total relative error on the beam polarization for the semi-integratedmethod with the existing setup. The reference running conditions are taken fromtable 4 and evolution with beam energy follows the procedure described in the text.The monitoring error includes only the error not correlated from one run to an-other. The energy cut at 2.5 GeV is due to the limited operating range of theelectron detector.
35

– Evolving the error on the analyzing power versus beam energy is nontrivial and requires a detailed simulation which is being developed. Therelative errors coming from the parametrization and pile up might varyslower than linearly with the analyzing power. Therefore we believethat scaling with 1/Ebeam as in eq.(14) is a safe estimate.
– The statistical error is proportional to the inverse square root of therunning time. Because the integrated rate depends very little on theCompton kinematics (table 1), the relative error scales also with theanalyzing power for a given run duration.
Table 4: Typical error budget of the ”response function” analysis for a 40 minutesrun with E=4.5 GeV, I=40 µA, Pγ = 1500 W and λ = 1064 nm. All errors arerelative and Pe ' 70%. The arrows indicate the expected error after the upgradeof the laser and the detectors with the same kinematics.
Error source Correl. (%) Uncorrel. (%)
Laser Polarization 0.45 → 0.30Aexp Pos. and Angles 0.45 → 0.25
Dead Time 0.10 → 0.10Beam current asym. 0.05 → 0.05Background 0.05 → 0.05?
Ana. Power Calibration 0.60 → 0.30Parameterization 0.45 → 0.45Pile up 0.45 → 0.25
Total Syst. 0.99 → 0.68 0.45 → 0.45Stat. 0.80 → 0.40
Total 0.99 → 0.68 1.02 → 0.65
From figure 17 the HAPPEx2 requirement at 3 GeV (2% accuracy) is met. Foraccurate measurements at lower energy, we expect the following improvementsbased on the upgrades of the laser setup and detectors previously described:
- Laser polarization:In the present stage of the analysis, the observed variations in time of thelaser polarization in the analyzing line are assumed to originate in the vari-ations of the polarization at the CIP. In fact we know they could be due toa rotation of the polarization ellipse with no significant change of the degreeof circular polarization. At the present stage of the analysis, the envelop ofthese variations is taken as a systematic error. A monitoring of the orien-
36

tation of the polarization ellipse would remove most of this uncertainty andbring the laser polarization error down to 0.3%.
- Dead time:The green laser setup is expected to double the light power accumulatedinside the cavity so that for a two times smaller wave length the total countingrate stays the same. The dead time error is thus expected to remain small.
- Beam current asymmetry:The feedback developed for the parity experiments will keep the effect of thebeam charge asymmetry negligible.
- Background:From our experience of data taking in 2000 and 2001, a signal to backgroundratio of 20 was routinely achieved over a beam energy range of 3.3 to 5.7 GeV.Data with the electron detector as close as 4.8 mm to the primary beam weretaken with no evidence of beam halo. Although the high threshold (ρ = 0.5)of the semi-integrated method is an asset to reduce the background, at 850MeV the electron detector must operate at 3.4 mm only from the primarybeam. Data collected this year at this distance show the presence of a beamhalo which could be due to an imperfect cut-off of the polarized source laserbetween two consecutive beam pulses. Assuming the beam halo can still bereduced smaller than the Compton rate at 3.4 mm from the beam centroid,then the ratio of the bremsstrahlung to Compton cross sections integratedfrom ρ = 0.5 to ρ = 1 doesn’t depend on the beam energy to first order. Wethus keep the error from the background constant and small (0.05%) withthe caveat that beam halo properties must be demonstrated at low energy.
- Response function:The combined upgrades of the laser and electron detector should provide atleast a factor 2 improvement in the calibration. Thus the relative error at4.5 GeV becomes 0.30%.Because of the transition from pair creation to multiple Compton scatteringin the photon detector, the error from the parametrization of the responsefunction is difficult to scale to lower beam energy. A complete GEANT4 sim-ulation, coupled to the ROOT based Compton analysis is being developedto address this issue. Meanwhile we keep a 0.45% relative error at 4.5 GeVdespite the upgrade to a green laser.The pile up effect is presently estimated from simulation. It is not correctedand a 100% systematic error is assigned. More detailed simulation studieswill reduce this error. The upgrade to a faster photon detector (few 100ns)will reduce the size of the effect itself. We quote a 0.25% relative error for
37

all energies since the total counting rate doesn’t depend on the kinematics.To extrapolate at different beam energies we try two scenario which we be-lieve define a reasonable envelop: the error on the analyzing power is eitherscaled with 1/Ebeam (eq.14) or kept constant from the value at 4.5 GeV.
The final error budget of the semi-integrated method with the setup upgradedfor the low energy measurements is show in table 4. The way the error evolvesfrom the reference at 4.5 GeV to lower energy is shown on figure 18. The envelopdefined by the two scenario of the error of the analyzing power becomes very largeat low energy. At the present stage of this study, this uncertainty doesn’t allowto conclude on the feasibility of an accurate measurement at 850 MeV using thesemi-integrated method.
3.2 Integrated and energy weighted photon detection
In the previous sections we have shown that integrating the signal of the photoncalorimeter between a low threshold and the Compton edge has numerous advan-tages for the reduction of the systematic errors. In the following we estimate thecontribution of the different sources of error for a measurement at 850 MeV.
• We assume the same properties of the beam positions differences than forthe measurement at 4.5 GeV (table4). The error is scaled with the ratio ofthe mean analyzing powers as taken in table 1
δAX = 0.45%×〈A〉4.5 GeV,IR
〈AE〉0.85 GeV,green
= 0.45%× 4.66
1.47= 1.40% (15)
• The background from beam halo observed in the electron detector doesn’tshow up in the photon detector. This could be explained by the fact thatin nominal running conditions a quadrupole upstream the Compton chicanefocuses the beam in the horizontal direction. Indeed the limiting aperturesfor the Compton photons are narrow in the horizontal plane (±5 mm) butquite large in the vertical plane ((±25 mm)).Therefore we assume no major contribution from the beam halo in the photondetector and start with the signal over background ratio (S/B) measured at4.5 GeV with a ρ = 0.5 threshold: S/B ' 20. Then the main contributionto the background is bremsstrahlung on the residual gas in the beam pipewhich cross section can be written as
dσ
dk=
A
X0NA
1
k
(4
3− 4
3
k
E0
+k2
E20
)
38

0
0.5
1
1.5
2
2.5
3
1 2 3 4 5 6 7 8
Upgraded semi-int. method
E (GeV)
δPe/P
e (%
)
40 min. run
12 hours run
E (GeV)
δPe/P
e (%
)
40 min. run
12 hours run
0
0.25
0.5
0.75
1
1.25
1.5
1.75
2
2.25
2.5
1 2 3 4 5 6 7 8
Figure 18: Expected performances of the semi-integrated method with the upgradedpolarimeter. Solid curves are for a 40 minutes run, dashed curves are for 1 day.The envelope defined by two curves of the same type comes from the two differ-ent ways of evolving the response function error versus beam energy (see text fordetails).
39
where E0 is the beam energy and k the energy of the radiated photon. Usingthis formula we can estimate S’/B’ for the integrated and energy weightedmethod. The integration is performed from a null threshold up to E0, theend of the bremsstrahlung spectrum
S ′
B′ =1
2
EIR
Egreen
(E
E ′
)2 k′m2
k′e(km − kt)ln
ke
kt
(16)
where the primed quantities refers to the E ′ = 850 MeV kinematics withgreen laser and the others to the reference conditions at E=4.5 GeV. km isthe compton edge, kt ' km/2 the threshold of the semi-integrated methodand ke the upper limit of the integration range. Using ke ' 2km and k′e ' E ′
one obtainS ′
B′ 'S
B× 0.042 ' 0.86
Hence we can’t afford to integrate all the bremsstrahlung spectrum in oursignal. One possibility would be to design a pre-amplifier to limit the pulseheight send to the integrating ADC to an equivalent of let’s say k′ = 2k′m (50MeV). The Compton events are not affected because this upper limit is farabove the Compton edge. Moreover the rate of high energy bremsstrahlungevents is low and pile up with a Compton event becomes very unlikely. Forc-ing the saturation at 50 MeV would bring the S’/B’ ratio back to an accept-able value
S ′
B′ ' 15
The usual data taking procedure (2/3 cavity On, 1/3 cavity OFF) is stillsuitable for this level of background. We assume the relative error scaleswith S/B leading to 0.05%× 20/15 = 0.07%.
• From preliminary simulations, the response function of the detector neverchanges the mean analyzing power by more than 1%. Assuming a control ofthis effect at the 50% level we end up with 0.5%.
• The acquisition chain will have to be linear over an energy range of 0.25 to25 MeV. Assuming a not corrected 3% non-linearity leads to a 0.30% error.Tagging the compton edge with the electron detector and using radioactivesources may be a way to check the linearity online.
• The main goal is to keep the detection threshold low enough so that wehave a detection efficiency high and flat down to 1 MeV (fig.15). Thenthe threshold can be anywhere between 0 and 250 keV with no significantcontribution to the error. We quote 0.25% which corresponds to the effectof a 1 MeV threshold.
40

Table 5: Typical error budget of a ”integrated and energy weighed” measurementat 850 MeV with Pγ = 3000 W and λ = 532 nm. All other running conditions areidentical to table 4.
Error source Correl. (%) Uncorrel. (%)
Laser Polarization 0.30Aexp Pos. and Angles 0.33
Background 0.07Ana. Power Response func. 0.50
Linearity 0.30Threshold 0.25
Total Syst. 0.72 0.33Stat. 0.82
Total 0.72 0.89
• The integrated method has no dead time. With a few 100 ns decay time ofthe detector the effect of pile up will be negligible.
• The control of the beam current asymmetry for the parity experiment is farbeyond the Compton requirements.
• The statistical error scales with the inverse square root of the figure of merit.
From table 1 we get 0.8%×√
13.2/0.69 = 3.5%.
The final error budget is show in table 5 were the uncorrelated errors has beencalculated for a 12 hours run instead of 40 minutes. The correcting factor forthese errors is thus
√40/
√12× 60 = 0.24. Figure 19 shows that this method is
promising for accurate measurements at low energy.
4 Cost and Schedule
We estimate the total equipment cost for the project to be 235 k$. An itemizedcost list of components is shown in Table 6. For key items, we have consultedwith appropriate vendors (as indicated in Table 6), who have provided us withactual quotations. The estimated cost does not include mechanical design work.Furthermore, there is no contingency built in to the cost estimate.
We estimate that the project can be completed in approximately two yearsprovided adequate manpower is available from the Hall A Collaboration for theeffort. The upgrade consists of five subsystems which can be pursued by sepa-rate groups: Fabry-Perot cavity, electron detector, photon calorimeter, DAQ, and
41

10-1
1
0 2.5 5 7.5 10 12.5 15 17.5 20 22.5
Int. and E weighted method
Time (h)
δPe/P
e (%
)
Time (h)
δPe/P
e (%
)
10-1
1
0 2.5 5 7.5 10 12.5 15 17.5 20 22.5
Figure 19: Expected performances of the integrated and energy weighted methodwith the upgraded polarimeter. The beam energy is fixed at 850 MeV.
42

Table 6: Cost Estimate
Item Source Model Qty Cost($) TotalLaser 54,200100 mW/532 nm Laser Innolight Prometheus 1 54,200
Cavity 30,790HR Mirrors Research Electro-Optics 532 nm 12 6,900Lock-in Amplifier Signal recovery 7280 1 8,000Modulator Yokogawa FG200 1 2,445Ramp Generator HP 33120A 1 1,445Mechanical Estimate 12,000
Optics 43,300Transport Mirrors Newport 10 1,500Focusing lenses Estimate 3 2,000polarizer plates Estimate 4 2,800Beam Splitter Estimate 3 2,500Photo Detectors Estimate 4 2,800Faraday Isolator LeySop FOI 5/57 1 2,500Wollaston prism LeySop BSW-10 1 1,000Integrating spheres Newport 819-IS-2 2 5,800Power Meter Newport 2930-C 1 4,200Motorized mounts PI M-100 6 8,200Motion Controller PI C848 2 10,000
Electron Detector 30,000Mask Canberra 1 10,000Microstrips Canberra 250µ 4 10,000Motion control Estimate 5,000Mechanical Estimate 5,000
Photon Detector 40,000YAP Calorimeter Estimate 30,000BGO Detector Estimate 5,000Integrating Electronics Estimate 5,000
Control System 11,300VME Crate 3,000IOC Motorola PPC2600 1 3,800Serial I/O Card estimate 2,500Computer estimate Linux 1 2,000
Test Setup 25,800Oscilloscope Tektronics TDS3054B 1 10,600Optics Bench Newport 1 4,400SHG startup kit Alphalas 1 6,600Beam Profiler Photon 21801 1 4,200
Project Total 235,390
43

EPICS. We envision the cavity development to take place at Jefferson Lab whilethe two detectors could be pursued at other institutions.
4.0.1 Milestone Schedule
• Basic Laser lab setup May 2004
• Final design complete July 2004
• Green cavity prototype February 2005
• Calorimeter prototype May 2005
• Cavity installation in Hall A Summer 2005
• First measurements at >4 GeV Fall 2005
• Electron detector Installation Winter 2005
• Photon calorimeter Installation Winter 2005
• First measurement at <1 GeV Spring 2006
44

References
[1] S. Escoffier, Mesure precise de la polarisation du faisceau d’electrons a TJNAFpar polarimetrie Compton pour les expriences Gep et N-Delta, PhD thesis,CEA-Saclay.
[2] G. Bardin et al., Conceptual Design Report of a Compton Polarimeter forCEBAF Hall A, CEA-Saclay, 1996.
[3] H. Sakai et al., Nucl. Inst. Meth.A445 (2000) 113.
[4] J. Urukawa et al., Nucl. Inst. Meth.A 445, 113 (2000)
[5] M. Bregant et al., arXIV:hep-ex/0202046 v1 28 Feb 2002.
[6] A. M. de Riva et al.Rev. Sci. Instrum. 67 (8), August 1996
[7] Optical Frequency Standard Development in Sup-port of NASA’s Gravity-Mapping Missions, W. M.Klipstein et al.http://esto.gsfc.nasa.gov/conferences/estc-2002/Papers/PS1P3(Klipstein).pdf
[8] G.C. Bjorklund et al.Appl. Phys. B 31, 145 (1983)
[9] D. Berns, Research Electro Optics, http://www.reoinc.com/
[10] I. Freitag, InnoLight GmbH, http://www.innolight.de/
[11] R. W. P. Drever et al.Appl. Phys. B 31, 145 (1983)
45