dr piketty on wealth and capital: accumulation vs. finance · piketty’s capital i rising...
TRANSCRIPT

Dr Piketty on
wealth and capital:
Accumulation vs. finance
Jo Michell1
SOAS Money and Development Seminar
10 December 2014
[email protected], Department of Accounting, Economics and Finance,
University of the West of England, Coldharbour Lane, Bristol, BS16 1QY.
1 / 39

Piketty’s Capital
2 / 39

Piketty’s Capital
“a magnificent, sweeping meditation on inequality”; “themost important economics book of the year—and maybe ofthe decade.” (Krugman)
“a new and powerful contribution to an old topic: as longas the rate of return exceeds the rate of growth, the incomeand wealth of the rich will grow faster than the typicalincome from work” (Solow)
“a modern surge in inequality has new economistswondering, as Marx and Ricardo did, which forces may bestopping the fruits of capitalism from being more widelydistributed. ‘Capital in the Twenty-First Century’ ... is anauthoritative guide to the question.” (Economist)
3 / 39

Piketty’s Capital
I Rising inequality of wealth and income in advancedeconomies since 1970s
I Piketty attributes this to rising capital/income ratio
I Implication is strong capital investment
I Piketty presents data on capital/income ratios andsaving rates
I These series mainly measure price effects
I Causality of rising wealth/income → risingprofits/income is incorrect
I Piketty confuses financial saving with capitalaccumulation
I Only financial mechanisms can generate the resultsclaimed
4 / 39

Functional distribution of income
60
64
68
72
76
80
84
60 65 70 75 80 85 90 95 00 05 10
UK US Japan
60
64
68
72
76
80
84
60 65 70 75 80 85 90 95 00 05 10
Germany (W. Germany before 1992)FranceEuropean Union (15 countries)
Figure: Adjusted wage share as % of GDP at current factorcost, 1960–2012 (2013–14 predicted)
Source: AMECO
5 / 39

Personal income distribution
6
8
10
12
14
16
18
20
1920 1930 1940 1950 1960 1970 1980 1990 2000 2010
United States-Top 5-1% income share
United States-Top 1% income share
United States-Top 10-5% income share
Source: Alvaredo, Atkinson, Piketty & Saez (2013)
6 / 39

Piketty’s Laws of Capitalism
First Law of Capitalism: capital income equals rate ofprofit times capital/output ratio
α = r · β
Second Law of Capitalism: capital/output ratio determinedby saving rate and growth rate (both exogenous)
β = s/g
Fundamental force for divergence: rate of profit exceedsgrowth of output
r > g
7 / 39

Piketty’s Laws of Capitalism
First Law of Capitalism: capital income equals rate ofprofit times capital/output ratio
Π
Y= r · K
Y
Second Law of Capitalism: capital/output ratio determinedby saving rate and growth rate (both exogenous)
K
Y= s/g
Fundamental force for divergence: rate of profit exceedsgrowth of output
r > g
8 / 39

Piketty’s Laws of Capitalism
First Law of Capitalism: rate of profit equals ratio ofprofits to capital expenditure
r =Π
K
Second Law of Capitalism: capital/output ratio determinedby saving rate and growth rate (both exogenous)
K
Y= s/g
Fundamental force for divergence: rate of profit exceedsgrowth of output
r > g
9 / 39

Piketty’s Laws of Capitalism
First Law of Capitalism: rate of profit equals ratio ofprofits to capital expenditure
r =Π
K
Second Law of Capitalism: Harrod-Domar-Solow equation
g =sY
K
Fundamental force for divergence: rate of profit exceedsgrowth of output
r > g
10 / 39

Piketty’s Laws of Capitalism
I Assume growth g is determined by exogenouspopulation growth and technological change
I Saving rate s and depreciation rate determine capitalaccumulation, thus K/Y ratio and K/L ratio
I Aggregate CES production function with σ > 1determines return on capital r
I “First Law of Capitalism” determines division ofincome between wages and profits
I When r > g, personal wealth distribution will becomemore unequal
I Growing inequality caused by high s and low g→ rising K/Y and Π/Y
I A crisis of overaccumulation?
11 / 39

Piketty on Marx
Marx totally neglected the possibility of durabletechnical progress and steadily increasingproductivity
– (Piketty, 2014, p. 10)
Marx . . . uses the books of a textile factory [that]seem to show an extremely high ratio of the totalamount of fixed and variable capital used in theproduction process to the value of a years’output—apparently greater than ten.A capital/income ratio of this level is indeedrather frightening.
– (Piketty, 2014, p. 228)
12 / 39
Second Law: Solow growth model
When the formula β = s/g was explicitlyintroduced for the first time by the economists RoyHarrod and Evsey Domar in the late 1930s, it wascommon to invert it as g = s/β
Even more important was Solow’s introduction in1956 of a production function withsubstitutable factors, which made it possible toinvert the formula and write β = s/g.
– Piketty (2014)
13 / 39
Elasticity of K/L substitution
The interesting question is not whether themarginal productivity of capital decreases when thestock of capital increases (this is obvious) but howfast it decreases (p. 216)
Over a very long period of time, the elasticity ofsubstition between capital and labour seems tohave been greater than one . . . Intuitively thiscorresponds to a situation in which thereare many different uses for capital in thelong run. . . . On the basis of historical data, onecan estimate an elasticity between 1.3 and 1.6. . . on the basis of historical experience the mostlikely outcome is . . . that the accumulationeffect will outweigh the decrease in the return oncapital (p. 221)
14 / 39

Fundamental force for
divergence: r > g
This fundamental inequality . . . will play a crucialrole in this book. In a sense it sums up the overalllogic of my conclusions. When the rate of returnon capital significantly exceeds the growth rate ofthe economy . . . then it logically follows thatinherited wealth grows faster than output andincome. People with inherited wealth onlyneed save a portion of their income fromcapital to that capital grow more quicklythan the economy as a whole.
15 / 39

Piketty’s Laws of Capitalism
Personal
distributionTechnology
Rate of inter−
temporal discount
Depreciation
rate
Population
Growth
between K and L
Endogenous Endogenous
micro variables
Exogenous
variables
Source: Michell (2014)
Piketty in a nutshell
Elasticity of substitution
macro variables
Functionaldistribution α
Rate of returnon capital r
Capital-outputratio β
Growthrate g
Savingrate s
16 / 39

Private capital/income ratios
17 / 39

Definition of capital
I Two definitions of capital (Hodgson, 2014)I A physical factor of productionI ‘ . . . a fund of money to be invested by a person or
firm in some enterprise. It can also refer to the moneyvalue of tangible and intangible assets owned by theperson or firm’ (Hodgson, p. 1070)
I Piketty: ‘I use the words “capital” and “wealth”interchangeably as if they were prefectly synonymous’(p. 47)
I ‘no need for the c-word if the w-word means the same’(Hodgson, p. 1064)
18 / 39

Digression: the capital
controversies
I No way to ‘measure’ physical quantity of heterogenouscapital other than at market prices
I In Solow aggregate production function, quantity ofcapital determines price—equals marginal productivity
I ‘the problem is not the measurement of “capital” butits meaning . . . capital hires labour but labour does nothire capital.’ (Harcourt 1976, p. 29)
19 / 39

Capital controversiesControversy continued, however, in the 1950s and1960s between economists based primarily inCambridge, Massachusetts (including Solow andSamuelson, who defended the production functionwith substitutable factors) and economists workingin Cambridge, England (including Joan Robinson,Nicholas Kaldor, and Luigi Pasinetti), who (notwithout a certain confusion at times) saw inSolow’s model a claim that growth is alwaysperfectly balanced, thus negating the importanceKeynes had attributed to short-term fluctuations.It was not until the 1970s that Solow’sso-called neoclassical growth modeldefinitively carried the day.
– Piketty (2014)20 / 39

Three definitions of capital
I Physical quantity of factor of production.
I Market value of factor of production.
I Financial wealth—claims on other agents.I Measured at current pricesI In flow terms: accumulation of financial claims,
matched by issuance of liabilities elsewhereI Not equivalent to macroeconomic saving
Financial investment is a transfer of assets, not ause of income. Buying [financial assets] transfersliquidity from one economic agent to another. . . macroeconomically, financial investment cannotsubstitute for physical investment
– Stockhammer (2000)
21 / 39

Fundamental force for
divergence: r > g
People with inherited wealth only needsave a portion of their income from capitalto that capital grow more quickly than theeconomy as a whole.
22 / 39

Fundamental force r > gI Fallacy of composition: in SSBG, r > g requires
consumption out of capital income (or dis-saving out ofwages).
I In SSBG: g = sY/K = I/KI Assume a closed economy without government.
Y = Π +W = I + C
Π = I + Cc + (Cw −W )
Π
K=
I
K+Cc − Sw
K
r = g +Cc − Sw
K
I r > g requires Cc > Sw.I If workers consume income and ‘people with inherited
wealth’ save all income, then r=g.23 / 39

Fundamental force r > g
I Can be extended to open economy with governmentsector: r > g → Cc + (G− T ) + (X −M) > Sw.
I Rate of profit can be maintained by export surplus,government deficit or borrowing for consumption byworkers
I Rosa Luxemburg’s profit realisation through externalsurplus
I Kalecki’s ‘internal exports’
24 / 39

Fundamental force r > g
Outside steady-state growth:
˙(K
Y
)> 0→ K̇
Y>K
Yg
Π > Kg
r > g
I if rising K/Y ratio then r > g possible.
I Is K/Y rising? (crisis of overaccumulation?)
Difficult to measure!
25 / 39

��
�
�
��
��
��
����
����
����
����
���
���
���
���
���
��
����
����
����
����
���
����
����
����
����
���
����
����
�� ������������������� �������������������
���
������
�����
����� �!��" �
����� �#����$
%�&��
Figure: Net saving, per cent of GDP
26 / 39

Definition of wealth and capital
I National wealth can be measured at market value orbook value
I ‘market value national wealth’, . . . Thecapital stock of corporations is included innational wealth through the equity holdingsof households and the government.
I ‘book-value national wealth’, sums allthe nonfinancial assets . . . of all domesticsectors and adds the net foreign assetposition.
I Piketty uses market value national wealth
The main reason is that corporate tangibleassets seem to be systematicallyover-estimated in national balance sheets.
27 / 39

Measuring K/Y : Macroeconomic
balance sheet
Households Non-fin Firms Fin Firms Row TotalA L A L A L A L
Cptl H.ph K.pk H.ph + K.pkFin Ah.pa Lh.pl Af .pa Lf .pl Ab.pa Lb.pl Ab.pa Lb.pl 0Eq e.pe enf .penf ef .pef 0Tot NWh NWf 0 0 H.ph + K.pk
−(Ab.pa − Lb.pl)
Table: Macroeconomic balance sheet.
Capitalpiketty = H.ph + Ah.pa − Lh.pl + e.pe
Capitalmichell = H.ph +K.pk − Ab.pa − Lb.pl
28 / 39

Consolidated balance sheet of US
corporate sector
�����
�����
�����
�����
��
����
����
����
����
����
����
���
��
���
����
����
���
���
���
���
���
����
���
����
����
����
���
����
����
����
����
� ������������������
����������������
����������������������������
���������������������������������
�����
��������������������������������
�����
Figure: Net saving, per cent of GDP
29 / 39

Time
100
* l_
fnc_
bs/g
dp.a
1950 1960 1970 1980 1990 2000 2010
−20
0−
100
010
0
real assetsfinancial assetsliabilitiesdebtequitynet worth
Consolidated balance sheet of corporate non−financial sector
Figure: Non-financial firms’ balance sheet – US
30 / 39

Time
100
* nf
_flo
ws2
/gdp
.q
1950 1960 1970 1980 1990 2000 2010
−5
05
10
debtequityfinancial usesfinancial balance
Non−financial Business Flows 1 − 3−year smoothed
Figure: Non-financial flow transactions – US
31 / 39

Share buybacks
When a firm buys its own shares, it enables itsshareholders to realize capital gains, which willgenerally be taxed less heavily than if the firm hadused the same sum of money to distributedividends.
Under these conditions, it is better to treatretained earnings as savings realized on behalfof the firms’ owners and therefore as acomponent of private saving.
— Piketty (2014)
32 / 39

Time
100
* fiv
e_le
vs_e
/gdp
.a
1950 1960 1970 1980 1990 2000 2010
−20
0−
100
010
020
030
0 householdnon−financial corpsfinancial corpsgovernmentROWdiscrepancy
All sectors: assets−liabilities inc equity
Figure: Aggregate net financial positions (stock) – US
33 / 39

Private vs. public wealth - US
����
����
����
����
����
����
����
����
����
����
����
����
����
���
���
���
��
���
���
���
���
����
����
���
����
����
���
����
�� ��������
��� ����������
34 / 39

US private sector wealth
accumulation
I House prices.
I Equity prices.
I Statistical discrepancy.
I Transfer of net assets from public to private sector.
35 / 39
Time
100
* ad
j_w
ealth
_jm
/gdp
.a
1950 1960 1970 1980 1990 2000 2010
010
020
030
040
050
0
Michell national wealthPiketty national wealthreal assets held by non−fin corpsreal assets held by fin corpsreal assets held by householdsreal assets held in public sectornet foreign position
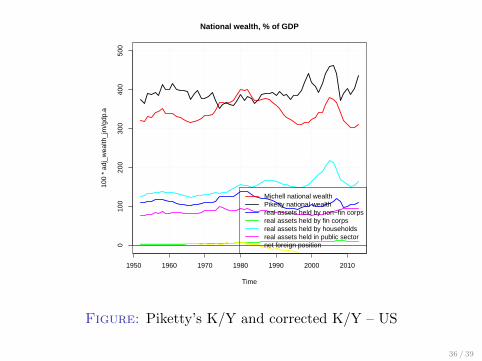
National wealth, % of GDP
Figure: Piketty’s K/Y and corrected K/Y – US
36 / 39

Consolidated balance sheet of
UK corporate sector
������
������
������
�����
��
����
�����
�����
�����
����
����
����
���
���
���
���
���
��
��
����
����
����
���
���
����
����
����
���
���
����
�� ��� � ���������������
�� � ���������������
�� � ������� � ��������������������� ��!
"�#$���%�������������������������
���
Figure: Net saving, per cent of GDP
37 / 39

Time
100
* ad
j_w
ealth
_jm
/gdp
.a
1990 1995 2000 2005 2010
010
020
030
040
050
0
adj dom wealthpiketty dom wealth
Adjusted national wealth, % of GDP
Figure: Piketty’s K/Y and corrected K/Y – UK
38 / 39

Summary and ConclusionI Piketty claims inequality (functional and personal)
driven by accumulation of real assets — positive sumgame
I Measure of private wealth is faulty—driven by pricechanges accumlation of financial claims andredistribution from public to private sector.
I Net saving falling since 1970s, now negative in manycountries
I K/Y falling (US) or flat (UK) since 70s.
I ‘Fundamental force’ r > g based on fallacy ofcomposition
I Rise in private wealth zero-sum game—requiresfinancial mechanism.
I Piketty cannot explanation falling wage share.
39 / 39