dr nicholas burke – occupational physician
TRANSCRIPT

Application of the Thermal Work Limit Model for Effective Workplace Heat Stress
Management
Dr Nicholas Burke – Occupational PhysicianMr Neil Hokins – Paramedic Consultant
4cRisk Pty Ltd

Background to the Development of the Thermal Work Limit
• Around 1920 the “Short Shift” with the Wet Bulb indicator model was introduced into Broken Hill mines from Germany.
• This same model was introduced to Mount Isa Mines during World War 2 and was used until the mid 1990’s,with workers being limited to 6hr shifts when working in thermally stressful situations.
• Wet Bulb model resulted in a marked decrease in productivity.
• Exposed workers to higher rates of metabolic burn and did little to decrease the reduction of exposure to Heat Stress events.
• Thermal Work Limit was developed by Dr. Graham Bates and Dr. Derrick Brake in 1997.
• These inputs allowed for the calculation of a metabolic rate of burn off, measured in Watts per metre squared of energy that can be burnt off in that given environment.
• To provide a base reference point, when you sleep you are burning off around 60-70 Watts/m2 of energy.

So What is Thermal Work Limit (TWL)
• Thermal Work Limit (TWL) is a heat stress index designed primarily for self-paced workers.
• Represents the sustainable metabolic rate that a well hydrated, acclimatised worker can maintain in a specific thermal environment within safe limits of core body temperature and sweat rate.
• TWL is an integrated measure of the dry bulb temperature, wet bulb temperature, wind speed and radiant heat.
• The TWL predicts the maximum level of work that can be carried out in a given environment, without workers exceeding a safe core body temperature (38.20C or 100.8F) and sweat rate (<1.2kg or 2.6lb per hour).
• The TWL is developed from published studies of human heat transfer and moisture equations through clothing. In excessively hot conditions, the index can determine the safe work duration, thus preventing heat-related illness and providing guidelines for work/rest cycling.
• The TWL guidelines have been implemented throughout the middle east and Australian mines and have produced a substantial decrease in the number of heat related illness cases.

TWL Zones
Unrestricted Work Zone TWL Zone ≥ 220 Watts/m2
No restriction on work/rest cycles or requirement for acclimatisation
Acclimatisation Zone TWL Zone 140 – 219 Watts/m2
Unacclimatised workers not to work alone
Buffer Zone TWL Zone 116 – 139 Watts/m2
Introduction of controls to increase TWL >ventilation, cooling ambient air temperature, providing shade and work/rest cycles
Withdrawal Zone TWL Zone ≤ 115 Watts/m2
Only Emergency Work 20 minutes work/40 minutes rest cycle

How to Apply the Thermal Work Limit model as a part of a Heat Stress Management Plan
Involves a process of:
• Awareness Training
• Physiological Testing
• Environmental Monitoring
• Environmental Engineering changes

Education
Involves all personnel working on site participating in education sessions covering:
• Signs and symptoms of heat related illnesses that have an immediate effect on the bodyeg. Heat rash, Heat Exhaustion, Heat Stroke
• Long term effects on health associated with working in hot environments.eg. Impact on Kidney function
• Awareness in regards to types of medications that may increase exposure to risk of heat related health events.eg. impacts on metabolism, heart rate and heat tolerance
• The importance of presenting to work correctly hydrated, and maintaining hydration during the shift.
• The importance of healthy diet and the impact on hydration of various foods and drinks
• The usage of electrolyte replacement products and volumes of water required during the dayToo much vs not enough

Physiological Testing
Effects on the body of working in hot environments can be measured in a number of physiological ways:
• Urine Specific Gravity testing pre and post shift
• Weight monitoring pre and post shift
• Heart rate monitoring

Using Urine Specific Gravity testing
Hydration status is assessed by measuring urine specific gravity (SG).
• SG is measured through the use of a refractometer (generally done by an onsite medic). SG measurements are similar to urine colour – the higher the SG the darker the colour.
Implementation of pre-shift testing which may be random.
• Workers must present to work with a SG reading of ≤1.022 before they can proceed to work.
• Failure of a pre-shift test requires counseling on water and electrolyte replacement and retest in an hour.
Those workers who work through a Buffer or Withdrawal period during shift are tested post-shift and the SG reading must be below 1.030.
• Failure of the post-shift test results in counseling on the amount of water and electrolyte replacement they require and that they must present at pre-shift the next day to ensure that they are adequately hydrated to start work.

Use of Electrolytes and Water
It is important to educate workers on the need for correct use of electrolyte replacements during the shift.
Incorrect use of electrolytes can have detrimental effects on the body. The job role, physical demands and climate indicates how much water and electrolytes need to be taken during shift.
As a guide:
• Sedentary Workers – 400ml of plain water per hour, a maximum of 2 litres per day of Electrolyte replacement.
Sedentary workers can still lose 50-100ml of sweat per hour
• Mobile Plant Operators – 600ml of water per hour, maximum of 2 litres per day of Electrolyte replacement
• Manual Labour Workers – 1 litre of water per hour, maximum of 2 litres per day Electrolyte replacement

What Happens with incorrect Rehydration
Too little or no replacement fluids during the shift can lead to Hyponatremia (the flushing of Sodium and Potassium from the body caused by excess fluid loss during sweating, exacerbated by Diarrhea or vomiting)
Consuming >1 litre of water per hour with no Electrolyte replacement can lead to severe dilution of soduim and potassium which is a life threatening situation
To much Electrolyte can lead to the development of Hypernatremia (too much Sodium) and Hyperkalemia (too much Potassium).
High potassium levels can effect the electrical cells in the heart, leading to arrhythmias.
Severe cases of Hypernatremia can cause neurological damage due to shrinkage of brain cells. Symptoms can include confusion, coma, paralysis of the lung muscles, with the potential to lead to death.

So Where Has the Model Been Applied?
The application of the Thermal Work Limit, in conjunction with thorough education and testing management plans has now been rolled out across a number of varying locations and operations including:
• Ethiopia – Danakil Depression – Exploration program
• Queensland - Bowen Basin – Open Cut Coal Mine
• South Australia – Gawler Craton – Underground Metalliferous Mine
• Queensland – Surat Basin – LNG Construction Project
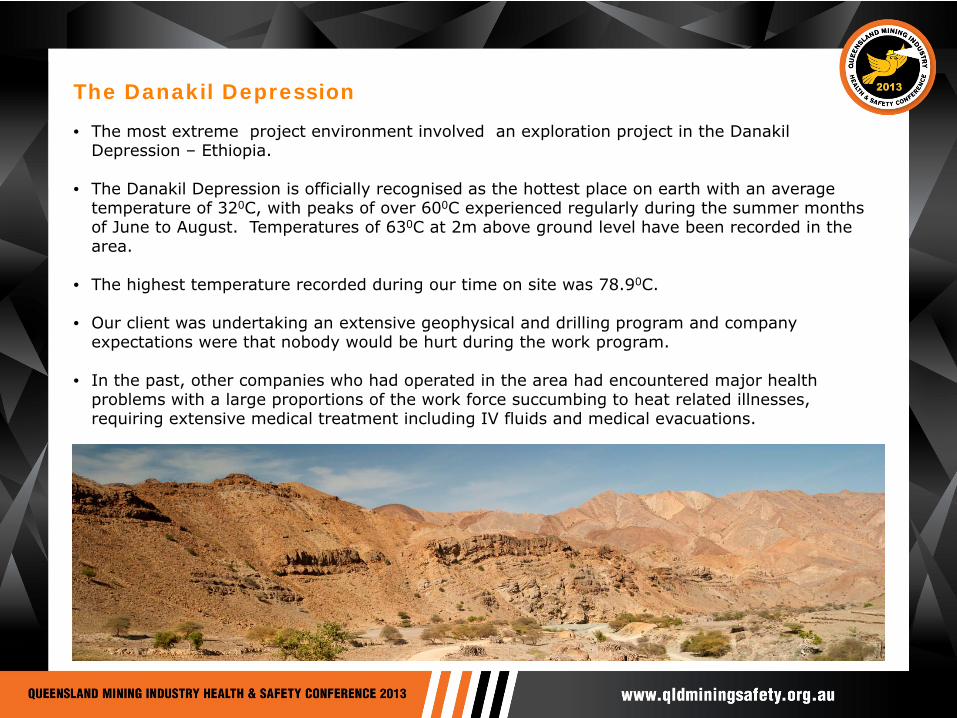
The Danakil Depression
• The most extreme project environment involved an exploration project in the Danakil Depression – Ethiopia.
• The Danakil Depression is officially recognised as the hottest place on earth with an average temperature of 320C, with peaks of over 600C experienced regularly during the summer months of June to August. Temperatures of 630C at 2m above ground level have been recorded in the area.
• The highest temperature recorded during our time on site was 78.90C.
• Our client was undertaking an extensive geophysical and drilling program and company expectations were that nobody would be hurt during the work program.
• In the past, other companies who had operated in the area had encountered major health problems with a large proportions of the work force succumbing to heat related illnesses, requiring extensive medical treatment including IV fluids and medical evacuations.

The Danakil Depression continued.
• During our work on site, our program included monitoring of the environmental conditions using the TWL monitor and a number of physiological monitoring programs.
• The TWL monitoring provided real time data as to the conditions, with the lowest (highest risk) reading recorded of 10 Watts/m2. 90% of the time readings were in the Buffer or Withdrawal zone, even at 4am.
• For the drillers to continue operations without a 40/20 work/rest cycle for the Buffer Zone or a 20/40 work/rest cycle for the Withdrawal Zone, controls were developed to provide protection for the workers, included increasing air cooling, decreasing ambient temperatures and reducing thermal load.
• Another challenge was hydrating the local workforce. Locals rarely drank water (only goats milk) due to water shortages in The Danakil. Significant work was put in to ensuring that the water vs electrolyte balance was appropriate and regularly reviewed to ensure adequate hydration.
• Physiological monitoring (core body temperature, heart rate) was normal throughout - emphasising the effectiveness of the program.
• The program ensured that issues previously experienced working in the area were minimised with nil reportable heat stress events occurring post rollout. This compared to a nearby exploration site run by another company with no Heat Stress Management Plan in place with >5 reportable Heat Stress events per month, with reports of workers presenting at the medical centre unconscious and fitting.

Example TWL Readings in W/m2 from the Danakil

Example Aural Temp vs SG Urine

Example TWL Distribution during a week in the DanakilTWL Ranges

Open Cut Coal Mine Bowen Basin
• High numbers of minor sprains and strains occurring on site. Heat Stress Management looked at as a part of an injury reduction program, with regards to the impact of hydration on muscle fatigue.
• Initial baseline testing indicated that TWL readings were reasonably consistent in areas of work in the open cut.
• TWL readings taken during work associated with breakdown maintenance on mining equipment was of concern. Readings taken in the engine bay areas were down to TWL of 114 W/m2, indicating the need for 20 min work/ 40 min rest cycles being required for safe work to be maintained.
• Hydration testing was introduced. Initial testing found of those personnel tested prior to commencing shift, 50% of both operational and maintenance personnel failed the pre-shift test. Counseling at pre-shift test in regards to hydration requirements provided improvement in the post-shift test result across both work groups. Testing over subsequent months showed improvement in hydration levels during pre-shift testing.
• Hydration awareness training provided during subsequent visits to assist in general awareness throughout the workforce.
• Engineering controls were put in place to assist with breakdown maintenance situations to allow for improvement in the TWL and remove the requirement for work rest cycles during production critical maintenance work. Controls such as ventilation improvement and radiant heat reduction were recommended to improve the work conditions.

LNG Construction Project Surat Basin
• Project was reporting in excess of more than 3 workers per week presenting at the onsite medical centre with Heat Illness symptoms.
• Implementation of Heat Stress Management Plan during September/October 2012, including the use of Scarlet TWL Monitors, hydration testing and temporal thermometers in high risk areas, and education programs.
• Provided additional onsite support during heat wave conditions throughout January 2013.
• TWL testing was carried out on all high risk work sites, including steel fixer’s, concreters and infield workers.
• SG testing pre-shift and post-shift because the workers were working into Buffer and Withdrawal zones.
• Engineering controls were implemented to provide improvement in the TWL readings (reduction in ambient air temperature by up to 120C achieved with misting fans).
• Nil reportable Heat related illness during the Heat Wave nor since the rollout of the program.
• At end of shift, particularly during the heat wave conditions, workers reported improved wellness/energy levels post shift

LNG Project TWL Readings on Hottest Day During January 2013 Heatwave
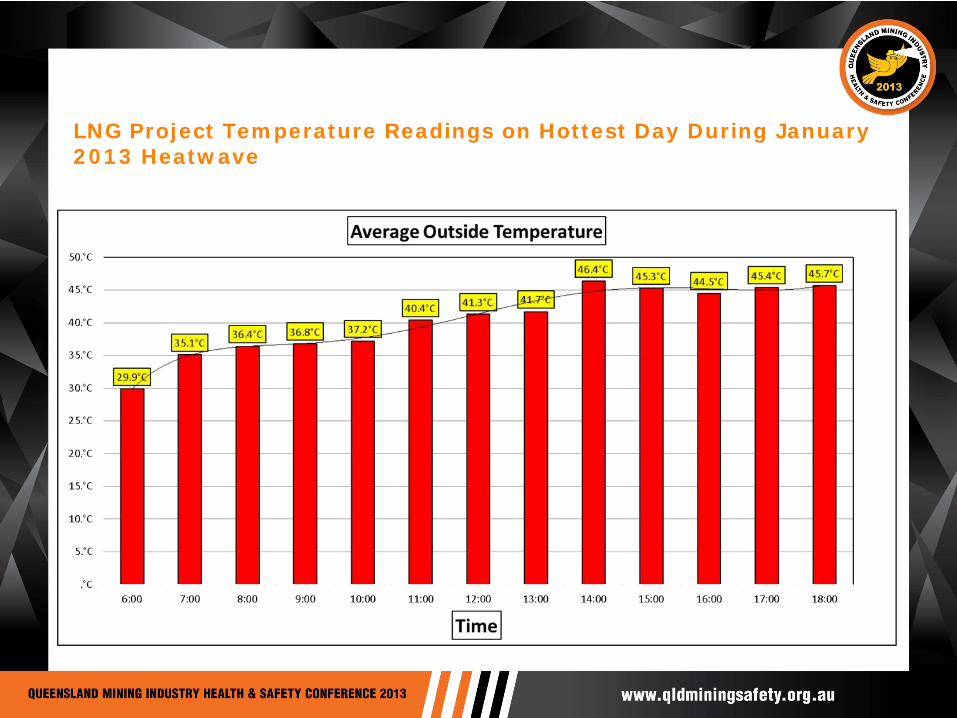
LNG Project Temperature Readings on Hottest Day During January 2013 Heatwave

The Next Location Challenge
• We are about to start the rollout of a Heat Stress Management Plan on to one of the larger coastal LNG projects.
The Challenge?
• Large number of fly-in/fly-out workers (acclimatisation every time returning from extended break)
• Impact of build up to the wet season – morning conditions vs evening conditions, expected impact of high humidity levels, minimal wind speed, high ambient temperature
Followed by:
Working with a sea freight company to introduce Heat Stress Management across their vessels.
Why will this be challenging?
• Cultural diversity in the workforce – provides a challenge in understanding importance of hydration and drinking water
• Again, impact of the wet season – morning conditions vs evening conditions, we are expecting an impact of high humidity levels, highly varied wind speed, high ambient temperature

Questions?
Thank you for your time