
25 YMFG Annual Report 2015
1. BASIS OF PRESENTATION
Yamaguchi Financial Group, Inc. (“YMFG”) was established
on October 2, 2006 as a holding company for The
Yamaguchi Bank, Ltd. (“Yamaguchi Bank”) and Momiji
Holdings, Inc. (“Momiji Holdings”) through a statutory
share transfer (kabushiki iten). Upon formation of YMFG
and completion of the statutory share transfer, Yamaguchi
Bank and Momiji Holdings became wholly owned
subsidiaries of YMFG.
Furthermore, in September 2011 Kitakyushu Financial
Project Co., Ltd., received a transfer of approval to handle
business split off from Yamaguchi Bank in the Kyushu
region and commenced operations on October 3, 2011.
YMFG and its consolidated subsidiaries (“the Group”)
maintain their accounts and records in accordance with
the provisions set forth in the Financial Instruments and
Exchange Law and its related accounting regulation and
in conformity with accounting principles and practices
generally accepted in Japan (“Japanese GAAP”). Japanese
GAAP are different in certain respects as to application and
disclosure requirements of International Financial Reporting
Standards.
The accompanying consolidated fi nancial statements
are a translation of the audited consolidated fi nancial
statements of YMFG which were prepared in accordance
with Japanese GAAP and were fi led with the appropriate
Local Finance Bureau of the Ministry of Finance as required
by the Financial Instruments and Exchange Law.
In preparing the accompanying consolidated fi nancial
statements, certain restructuring and reclassifi cations have
been made in the consolidated fi nancial statements issued
domestically in order to present them in a form which is
more familiar to readers outside Japan.
The consolidated fi nancial statements are stated in
Japanese yen. The translations of the Japanese yen
amounts into U.S. dollars are included solely for the
convenience of readers, using the prevailing exchange rate
at March 31, 2015, which was ¥120.17 to U.S.$1.00. Such
translations should not be construed as representations
that the Japanese yen amounts have been, could have
been, or could in the future be, converted into U.S. dollars
at this or any other rate of exchange.
2. SIGNIFICANT ACCOUNTING POLICIES
Consolidation and equity method(1) Scope of consolidation
Japanese accounting standards on consolidated
fi nancial statements require a company to consolidate
any subsidiaries of which the company substantially
controls the operations, even if it is not a majority
owned subsidiary. Control is defi ned as the power to
govern the decision making body of an enterprise.
(i) 13 consolidated subsidiaries at March 31, 2015
and 12 at March 31, 2014.
The names of the consolidated subsidiaries are
listed on page 1.
YM Lease Co., Ltd., formerly accounted for
by the equity method, was excluded from the
scope of application of equity-method affi liates
and included in the scope of consolidation from
the fi scal year ended March 31, 2015, as YMFG
acquired additional shares in YM Lease, increasing
its percentage of voting rights.
(ii) Five unconsolidated subsidiaries at March 31,
2015, and six at March 31, 2014.
Name of major subsidiary:
Yamaguchi Capital 2nd Investment Business
Limited Liability Association
The unconsolidated subsidiaries are excluded
from the scope of consolidation because their total
assets, ordinary income, net income (in proportion
to ownership), retained earnings (in proportion to
ownership) and accumulated other comprehensive
income are so immaterial that they do not hinder a
rational judgment of YMFG’s consolidated fi nancial
position and results of operations.
(2) Application of the equity methodJapanese accounting standards also require any
unconsolidated subsidiaries and affi liates with fi nancial
and operating policies over which YMFG is able to
exercise material infl uence to be accounted for by the
equity method.
(i) No unconsolidated subsidiaries were accounted
for by the equity method at March 31, 2015 and
2014.
(ii) As at March 31, 2015, three affi liates accounted
for by the equity method and four at March
31, 2014. Affi liates accounted for by the equity
method at March 31, 2015 were as follows:
Years ended March 31, 2015 and 2014
YMFG Notes to Consolidated Financial Statements

YMFG Annual Report 2015 26
YM Saison Co., Ltd.
Yamaguchi Capital Co., Ltd.
Momiji Card Co., Ltd.
YM Lease Co., Ltd., formerly accounted for by
the equity method, was included in the scope
of consolidation and excluded from the scope
of application of equity-method affi liates from
the fi scal year ended March 31, 2015, as YMFG
acquired additional shares in YM Lease, increasing
its percentage of voting rights.
(iii) As at March 31, 2015, fi ve unconsolidated
subsidiaries were not accounted for by the equity
method, and six at March 31, 2014.
Name of major subsidiary:
Yamaguchi Capital 2nd Investment Business
Limited Liability Association
The unconsolidated subsidiaries that are not
accounted for by the equity method are also
excluded from the scope of application of equity
method because their net income (in proportion
to ownership), retained earnings (in proportion to
ownership) and accumulated other comprehensive
income (in proportion to ownership) are so
immaterial that they do not hinder a rational
judgment of YMFG’s consolidated fi nancial
position and results of operations.
(iv) There were no affi liates that were not accounted
for by the equity method as at March 31, 2015 and
2014.
(3) The balance sheet dates of consolidated subsidiaries The balance sheet date of consolidated subsidiaries is
as follows:
March 31, 2015 13 companies
March 31, 2014 12 companies
(4) Accounting PoliciesTrading assets, trading liabilities and transactions for trading purposesThe valuation method of “Trading assets” and “Trading
liabilities” is as follows:
Balances incurred by transactions of which the purpose
is to earn a profi t by taking advantage of short-term
fl uctuations in a market or discrepancies in different
markets of interest rates, currency exchange rates, share
prices or other indices (hereinafter referred to as “trading
purposes”) are included in “Trading assets” or “Trading
liabilities” in the consolidated balance sheets as of the
date on which the transactions have been contracted.
The income or losses on these transactions are recorded
as “Trading income” and “Trading expenses” on the
consolidated statements of income.
Trading assets and trading liabilities are valued, in the
case of securities and commercial paper, at the market
value as of the date of the balance sheet and, in the case
of derivatives, including swaps, futures and options, at the
amount due if the transactions were to be settled as of the
date of the balance sheet. “Trading income” and “Trading
expenses” include interest income and interest expense,
respectively, and gains and losses, respectively, resulting
from the valuation of securities, commercial paper,
derivatives, etc., which are included in “Trading assets” or
“Trading liabilities.”
SecuritiesWith regard to the valuation of securities, held-to-maturity
debt securities are stated at amortized cost (straight-line
method) using the moving-average method. Investments
in unconsolidated subsidiaries that are not accounted for
by the equity method are stated at cost determined by the
moving-average method. Available-for-sale securities are in
general stated at fair value (cost of sale calculated primarily
according to the moving-average method) indicated
according to market price at the consolidated balance
sheet date (for equity securities, the average market price
during the one-month period ending on the consolidated
balance sheet date). Available-for-sale securities having no
readily available market value are valued at cost using the
moving-average method.
Unrealized gains (losses) on available-for-sale securities
are reported as a component of net assets.
Securities constituting trust assets within money held in
trust are valued using the same methods as those for the
above-mentioned trading assets, liabilities and securities.
DerivativesDerivatives other than those for specifi c trading purpose or
those for which certain exceptional accounting treatment is
applied are stated at fair value.
Method of hedge accountingThe subsidiaries that conduct banking business (“the
Banks”) apply deferred hedge accounting in accordance
with “Treatments of Accounting and Audit on Application
of Accounting Standard for Financial Instruments in
Banking Industry”(The Japanese Institute of Certifi ed Public
Accountants (“JICPA”) Industry Audit Committee Report
27 YMFG Annual Report 2015
No.24). As for the hedge to offset market fl uctuation, the
Banks assess the effectiveness of the hedge by grouping the
hedged items such as deposits and loans and the hedging
instruments such as interest rate swaps by their maturity.
Also, the Banks apply deferred hedge accounting to
hedge foreign exchange risks associated with various
foreign currency denominated monetary assets and
liabilities as stipulated in “Treatment of Accounting and
Auditing Concerning Accounting for Foreign Currency
Transactions in Banking Industry” (JICPA Industry Audit
Committee Report No. 25). The effectiveness of the
currency swap transactions, exchange swap transactions
and similar transactions hedging the foreign exchange risks
of monetary assets and liabilities denominated in foreign
currencies is assessed based on comparison of the foreign
currency position of the hedged monetary assets and
liabilities and the hedging instruments.
The Banks apply exceptional treatments permitted for
interest rate swaps to certain assets.
Allowance for loan lossesThe Banks provide allowance for loan losses according to
the following write-off and provisioning standards.
For loans to borrowers who are legally bankrupt (due
to bankruptcy, composition, suspension of transactions
with banks by the rules of clearinghouses, etc.) or
substantially bankrupt, an allowance is provided in the
amount of loans, net of amounts expected to be collected
through disposition of collateral or through execution of
guarantees.
For loans to borrowers in danger of bankruptcy,
an allowance is provided in the amount considered
uncollectible based on the amount of loans, net of amounts
expected to be collected through disposition of collateral or
through execution of guarantees, and other sources.
Loans to normal borrowers and borrowers requiring
caution are classifi ed into certain groups, and an allowance
is provided for each group using the rate of loan losses
experienced for the Group during certain reference periods
in the past.
Each branch as well as the credit supervision department
evaluates all loans in accordance with the self-assessment rule.
Other consolidated subsidiaries provide an allowance for
an amount calculated using the rate of collection losses in the
past for loans of normal borrowers in addition to amounts
estimated based on collectibility analysis for borrowers in
danger of bankruptcy and certain other borrowers.
Tangible fi xed assets (excluding lease assets)Tangible fi xed assets are stated at cost less accumulated
depreciation, except for certain revalued land.
Depreciation of tangible fi xed assets of the Banks is
computed by using the declining-balance method except
for buildings (excluding fi xtures) acquired after March
31, 1998, which are depreciated using the straight-line
method.
The estimated useful lives of the assets are primarily as
follows:
Buildings: 7 to 50 years
Others: 3 to 15 years
Other consolidated subsidiaries depreciate their tangible
fi xed assets using mainly the declining-balance method
over the useful lives of the respective assets provided by
the tax act in Japan.
Intangible fi xed assets (excluding lease assets)Amortization of intangible fi xed assets is computed by
using the straight-line method. Software costs for internal
uses are amortized over the estimated useful life (5 years).
Lease assetsLease assets included within tangible and intangible fi xed
assets related to fi nance lease transactions that do not
transfer ownership are depreciated over the lease term
using the straight-line method. For lease assets with a
guaranteed residual value stated in their lease agreements,
the residual value is set at the guaranteed amount.
Otherwise, the residual value is assumed to be zero.
Accounting for certain lease transactionsConsolidated subsidiaries’ fi nance lease transactions that
do not transfer ownership belonging to accounting periods
that commenced prior to April 1, 2008, are treated as
operating lease transactions.
Income taxesIncome taxes comprise corporate, enterprise and inhabitant
taxes. The Group recognizes tax effects of temporary
differences between the fi nancial statement basis and
the tax basis of assets and liabilities. The asset and liability
approach is used to recognize deferred tax assets and
liabilities for the expected future tax consequences of
temporary differences.
YMFG Annual Report 2015 28
Foreign currency translationYMFG and foreign currency assets and liabilities and the
accounts of overseas branches of consolidated subsidiaries
are translated into yen at the rates prevailing at the
consolidated balance sheet date.
Provision for bonusesProvision for bonuses is provided for payment of bonuses
to employees, in the amount of estimated bonuses that are
attributable to the fi scal year.
Method of accounting for retirement benefi tsWhen calculating retirement benefi t obligations, the
benefi t formula method is used for attributing expected
retirement benefi ts to periods through the year-end. The
methods for recognizing past service cost and actuarial
gains or losses are as follows:
Past service cost: Recognition of past service cost
is apportioned by the straight-
line method over a fi xed number
of years (2 years) within the
employees’ average remaining
service period from the time of
their occurrence
Actuarial gains or losses: Recognition of actuarial gains
or losses are apportioned by the
straight-line method over a fi xed
number of years (Mainly 10 to
11 years) within the employees’
average remaining service period
at the time of their occurrence
in each fi scal year, starting from
the following fi scal year
Some consolidated subsidiaries employ the simplifi ed
method for calculating retirement benefi t obligations
and periodic benefi t costs, stating retirement benefi t
obligations at the amounts required as if all employees
voluntarily terminate their employment as of the year-end.
Provision for directors’ retirement benefi tsThe provision for directors’ retirement benefi ts for
consolidated subsidiaries outside the banking business
is provided for the estimated amount corresponding to
accrued retirement benefi t payments to directors as of the
end of the fi scal year.
Provision for loss on interest repaymentProvision for loss on interest repayment is provided for
possible losses on reimbursements of excess interest
payments and loan losses related to consumer fi nance
loans extended at interest rates in excess of the maximum
interest rate prescribed in the Interest Rate Restriction Law.
In accordance with “Audit Guidelines on Consumer
Finance Companies’ Provisions for Possible Losses on
Reimbursements of Excess Interest Payments,” issued by
JICPA in 2006, the amount of such provision is rationally
estimated and booked based on actual historical repayment
claims by debtors.
Provision for reimbursement of depositsProvision for reimbursement of deposits is provided for in
order to meet depositor requests for reimbursement on
deposits already derecognized as liabilities, in an amount
deemed necessary by estimating the losses corresponding
to the expected requests for reimbursements in the future.
Provision for customer point servicesProvision for customer point services is provided in
conjunction with a point system to promote credit card
use. The reserve is recorded for the expected cost to be
incurred when credit card members use points they have
received as of the balance sheet date.
Reserves under special lawsReserves under special laws consist of the fi nancial
instruments transaction responsibility reserve posted by YM
Securities Co., Ltd., which were calculated according to the
specifi cations of Article 46-5 of the Financial Instruments
and Exchange Act and Article 175 of the Cabinet Offi ce
Order Related to the Financial Instruments Business, to
prepare for losses originating from incidents relating to the
purchase and sale of securities or other transactions.
Amounts per share of common stockComputations of net income per share of common stock
are based on the weighted-average number of shares
outstanding during each year.
YMFG has issued potential shares, but “current term
net income per share after stock adjustment” is not shown
because these shares have no dilutive effect.
Cash dividends per share represent the cash dividends
declared as applicable to each year.
29 YMFG Annual Report 2015
Amortization of goodwill Goodwill is mainly amortized over a 10-year period using
the straight-line method.
Consumption tax YMFG and its consolidated subsidiaries in Japan employ
the tax exclusion method for consumption tax and local
consumption taxes, meaning that transaction amounts
and consumption tax amounts are treated separately for
accounting purposes.
However, non-deductible consumption taxes for
purchase of property, plant and equipment are recognized
as expenses for the year of the purchase.
Adoption of Consolidated Tax Payment SystemYMFG and certain of its consolidated subsidiaries adopted
the consolidated tax payment system as provided under
the Corporation Tax Act.
Changes in Accounting Principles (Changes in accounting principles due to revisions in
accounting standards)
(Adoption of the “Accounting Standard for Consolidated
Financial Statements”)
YMFG adopted the “Accounting Standard for Consolidated
Financial Statements” (ASBJ Statement No. 22, September
13, 2013) from the fi scal year ended March 31, 2014.
This adoption had no impact on the consolidated
fi nancial statements.
(Adoption of the “Accounting Standard for Retirement
Benefi ts”)
For the year ended March 31, 2014
From the year ended March 31, 2014, YMFG adopted
the “Accounting Standard for Retirement Benefi ts”
(ASBJ Statement No. 26, May 17, 2012) and the
“Implementation Guidance for the Accounting Standard
for Retirement Benefi ts” (ASBJ Guidance No. 25, May
17, 2012) (excluding the provisions found in the body of
Paragraph 35 of the Accounting Standard for Retirement
Benefi ts and Paragraph 67 of the Implementation
Guidance for the Accounting Standard for Retirement
Benefi ts). Accordingly, from March 31, 2014, YMFG
has recorded the difference between retirement benefi t
obligations and plan assets as net defi ned benefi t asset or
net defi ned benefi t liability.
With regard to the application of the Accounting
Standard for Retirement Benefi ts, in accordance with the
transitional treatment stipulated in Paragraph 37 of the
Accounting Standard for Retirement Benefi ts, the impact
of these changes is included in remeasurements of defi ned
benefi t plans within accumulated other comprehensive
income as of March 31, 2014.
As a result, as of March 31, 2014, YMFG recorded net
defi ned benefi t asset of ¥22,882 million and net defi ned
benefi t liability of ¥4,479 million. Furthermore, deferred tax
assets increased by ¥1,897 million and accumulated other
comprehensive income decreased by ¥3,465 million.
For the year ended March 31, 2015
YMFG adopted the “Accounting Standard for Retirement
Benefi ts” (ASBJ Statement No. 26, May 17, 2012) and the
“Implementation Guidance for the Accounting Standard
for Retirement Benefi ts” (ASBJ Guidance No. 25, March
26, 2015), applying the provisions found in the body of
Paragraph 35 of the Accounting Standard for Retirement
Benefi ts and Paragraph 67 of the Implementation
Guidance for the Accounting Standard for Retirement
Benefi ts from the fi scal year ended March 31, 2015.
Accordingly, the Company reviewed the method for
calculating retirement benefi t obligations and current
service costs, and changed a method of attributing
expected benefi t to periods from the straight-line method
to the benefi t formula method. In addition, YMFG has
changed its method of determining discount rates from
a method of using a single discount rate based on the
average remaining service period and average benefi t
period to a method of using multiple discount rates for
each expected retirement benefi t period.
With regard to the application of the Accounting
Standard for Retirement Benefi ts, in accordance with
the transitional treatment stipulated in Paragraph 37
of the Accounting Standard for Retirement Benefi ts,
from the beginning of the fi scal year ended March 31,
2015, changes in amounts resulting from the method of
calculating retirement benefi t obligations and past services
costs were recorded in retained earnings.
As a result, at the beginning of the fi scal year ended
March 31, 2015, retirement benefi t liabilities increased
¥3,086 million ($26 million), and retained earnings
decreased ¥1,994 million ($17 million). Also, the income
before income taxes for the fi scal year ended March 31,
2015 increased by ¥368 million ($3 million).

YMFG Annual Report 2015 30
(Adoption of the “Practical Solution on Transactions of
Delivering the Company’s Own Stock to Employees etc.
through Trusts”)
YMFG adopted the “Practical Solution on Transactions of
Delivering the Company’s Own Stock to Employees etc.
through Trusts” (Practical Issues Task Force No. 30, issued
March 26, 2015) from the fi scal year ended March 31,
2015. Accordingly, the Company recognized at the time of
disposal the difference arising from the disposal of treasury
shares by the Company to the trust, and posts as liabilities
the differences arising from the net amount of gain or loss
from sales of shares sold by the trust to the employee stock
ownership plan (ESOP), dividends paid by the Company for
the shares held by the trust and miscellaneous expenses
related to the trust.
These accounting policies have been applied
retroactively, and the consolidated fi nancial statements
for the fi scal year ended March 31, 2014, refl ect this
retroactive application.
Compared with the fi gures before retroactive
application, as of March 31, 2014, other liabilities
increased ¥92 million, and treasury stock, capital surplus
and retained earnings decreased by ¥301 million, ¥351
million and ¥42 million, respectively.
Due to the refl ection of the cumulative effect on net
assets as of April 1, 2013, after retroactive adjustment to the
consolidated statements of changes in net assets, treasury
stock, capital surplus and retained earnings decreased by
¥398 million, ¥367 million and ¥27 million, respectively.
Accounting Standards Not Applied “Accounting Standard for Retirement Benefi ts” (ASBJ
Statement, May 17, 2012)
(i) Overview
With the view of fi nancial reporting improvements and
trends in international convergence, this accounting
standard mainly focuses on, how unrealized actuarial gains
and losses and past service costs should be accounted
for and how retirement benefi t obligations and current
service costs should be determined for the enhancement of
disclosures.
(ii) Effective Dates
The revised method of calculation of retirement benefi t
obligations and current service costs will be effective on the
Banks’ consolidated fi nancial statements at the beginning
of the fi scal year commencing April 1, 2014.
(iii) Effects of Adoption of the Accounting Standard
The expected effect of adopting this accounting standard is
to reduce retained earnings by ¥1,994 million ($19 million)
in the fi scal year beginning on April 1, 2014.
“Accounting Standard for Business Combinations” (ASBJ
Statement, Sep. 13, 2013)
(i) Overview
This accounting standard revises primarily the following
areas of the current standard: (1) the treatment of changes
in the parent company’s ownership interest in a subsidiary
in case where additional shares of the subsidiary are
acquired and the controlling ownership remains in the
parent company, (2) the treatment of acquisition-related
expenses, (3) the treatment of the transitional accounting
and (4) the presentation of net income and changes from
minority interest to noncontrolling shareholder interest.
(ii) Effective Dates
The accounting standard will be applied to the Group’s
consolidated fi nancial statements from the beginning of
the fi scal year commencing April 1, 2015.
(iii) Effects of Adoption of the Accounting Standard
The Group is currently evaluating the effects.
“Practical Solution on Transactions of Delivering the
Company’s Own Stock to Employees etc. through Trusts”
(Dec. 25, 2013)
(i) Overview
This standard clarifi es the practical treatment of
transactions of delivering the company stock to employees
or employee stock ownership plans through trusts.
(ii) Effective Dates
The accounting standard will be applied to the Group’s
consolidated fi nancial statements from the beginning of
the fi scal year commencing April 1, 2014.
(iii) Effects of Adoption of the Accounting Standard
The Group is currently evaluating the effects.
Additional Information(ESOP Trust)
To enhance its welfare benefi ts, YMFG has introduced the
ESOP Trust for Group employees (hereinafter, “Employees”)
(1) Overview of Transactions
Of those Employees enrolled in the Yamaguchi Financial
Group Employee Stock Ownership Plan (hereinafter, the
“Company’s ESOP”), the Company has established the
trust for those benefi ciaries satisfying certain conditions.

31 YMFG Annual Report 2015
This trust acquired as a lump sum a number of shares in
the Company corresponding to the number expected to be
acquired by the Company’s ESOP over the fi ve-year period
beginning in September 2011. Thereafter, the trust has
sold the Company’s shares to the Company’s ESOP each
month on a specifi c date.
(2) Company Shares Residing in the Trust
Company shares residing in the trust are recorded in
treasury stock in the net assets section according to the
book value of the trust (excluding ancillary expenses). The
book value and the number of shares of this treasury stock
amounted to ¥1,050 million and 1,400 thousand shares on
March 31, 2014, and ¥785 million ($7 million) and 1,047
thousand shares on March 31, 2015.
(3) Book Value of Borrowings Recorded by Applying the
Gross Price Method
The book value of borrowings recorded by applying the
gross price method was ¥1,050 million on March 31, 2014,
and ¥630 million ($5 million) on March 31, 2015.
3. CONSOLIDATED STATEMENTS OF CASH FLOWS AND CASH EQUIVALENTS
In preparing the consolidated statements of cash fl ows, the
Group considers cash and due from THE BANK OF JAPAN
as cash and cash equivalents.
The reconciliation of cash and due from banks in the
consolidated balance sheets and cash and cash equivalents
in the consolidated statements of cash fl ows at March 31,
2015 and 2014 were as follows:
Millions of yenThousands of U.S. dollars
2015 2014 2015Cash and due from banks ¥965,275 ¥915,056 $8,032,579Time deposits in other banks (13,393) (7,497) (111,450)Other (8,900) (33,354) (74,062)Cash and cash equivalents ¥942,982 ¥874,205 $7,847,067
4. FINANCIAL INSTRUMENTS
Items pertaining to the status of fi nancial instruments(1) Policies on fi nancial instrumentsYMFG provides community-based integrated fi nancial
services centered on the banking business and including
the securities and credit card businesses. Accordingly,
the Group is subject to a variety of risks, including credit
risk, market risk and liquidity risk. Due to changes in
economic, social and fi nancial conditions, these risks have
grown more diverse and complex. Under these conditions,
the Group considers strengthening its risk management
structure as a priority issue. To maintain and enhance the
soundness of its operations, YMFG has created groupwide
risk management regulations, which clarify the Group’s
fundamental stance on risk management.
(2) Content and risks of fi nancial instrumentsOf fi nancial assets held by the Group, principally loans and
bills discounted extended to business partners are subject
to the credit risk of breach of contract. The Group holds
securities, principally debt securities, equity securities and
investment trusts, for trading purposes, for holding to
maturity, for purely investment purposes and to promote
positive business relations. These securities are subject to
issuer credit risk, interest rate fl uctuation risk and market
price fl uctuation risk.
The Group’s fi nancial liabilities center on deposits and
negotiable certifi cates of deposit, and call money that it
raises in the market. However, the Group is subject to
the liquidity risk of becoming unable to secure necessary
funding. The Group is also subject to interest rate risk arising
from fl uctuations in fi nancial and economic conditions.
The Group employs derivative transactions to hedge
underlying market risks on its assets and liabilities. The
Group also provides derivatives as fi nancial products to
meet customers’ needs. Interest-related and securities-
related derivative transactions are employed to limit the
impact on income of future interest rate fl uctuations and
price fl uctuations for loans and bills discounted, deposits,
securities and other instruments bearing long-term interest
at fi xed rates. Currency-related derivative transactions are
used primarily to avoid fl uctuations in income stemming
from future exchange rate fl uctuations, stabilize funding
denominated in foreign currencies, as well as offered as
products to clients. With regard to transactions to secure
income through changes in market rates, which are
conducted on a limited basis, the Group has established
stringent standards that include risk limits and loss limits.
As market risk factors, interest rate related and
securities-related derivative transactions are subject to
the risk of fl uctuations in interest rates and prices, and
currency-related derivative transactions are subject to
exchange rate fl uctuations. For transactions that are
not conducted on exchanges, the Group is subject to

YMFG Annual Report 2015 32
credit risk, the risk of loss in the event a counterparty
becomes unable to fulfi ll its contractual obligations due to
deteriorating fi nancial conditions.
With regard to use of hedge accounting, the Group applies
deferred hedge accounting after it ensured in advance that
the established conditions are satisfi ed. As for hedging
methods, the Group employs the portfolio hedge where
certain group of assets with similar risk is identifi ed and
such risk is hedged comprehensively. In addition, for certain
interest swap contracts, exceptional treatments are applied.
(3) Risk management structure related to fi nancial instruments
(i) Management of credit risk
Through the appropriate operation of a credit rating
system, the Group endeavors to determine the fi nancial
conditions of business partners and accurately evaluate
their credit risk. The Group has enhanced the precision
of its credit evaluations, reviewing business partner credit
ratings swiftly and appropriately for each fi nancial period
and each time their credit conditions change.
The Group conducts self assessments according to
stringent standards that are consistent throughout the
Group. YMFG performs write-off and provisions based
on the results of its self assessments. The Group’s
authentication departments verify the content of such
inspections. Independence is maintained through internal
audits conducted by audit departments. In addition,
the Group undergoes external audits conducted by its
independent external auditors.
With regard to the screening of individual transactions,
the Group employs a screening system suited to each
subsidiary bank’s size of the business and characteristics
to conduct detailed screenings that take individual sector
and regional characteristics into consideration. In terms of
portfolio management, the Group strives to enhance its
risk management by fi rst measuring credit risk, and then
managing risk by category, sector and geographic area.
Risk management departments periodically obtain
credit information and fair value as a part of managing
credit risks on securities issuers and counterparty risks on
derivative transactions.
(ii) Management of market risk
Qualitative information on the management of market risk
The Group has formulated a market risk management
process that identifi es and quantitatively measures inherent
market risks. An asset-liability management (ALM) system is
employed to control market risk within allowable limits, and
the Group ALM Committee is periodically held to respond
to such risks.
YMFG periodically evaluates market risk conditions and
verifi es the appropriateness of risk controls.
Quantitative information on the management of market risk
The market risk (estimated loss amount) of the loans,
securities, deposits and derivatives transactions of Yamaguchi
Bank, Momiji Bank and Kitakyushu Bank of the Group are
calculated according to value at risk (VaR). Furthermore, the
covariance method is used to calculate VaR.
As of March 31, 2015, the market risk (estimated loss
amount) of Yamaguchi Bank was ¥73,513 million ($612
million), the market risk (estimated loss amount) of Momiji
Bank was ¥21,416 million ($178 million) and the maket
risk (estimated loss amount) of Kitakyushu Bank was
¥12,536 million ($104 million). Also, as of March 31, 2014,
the market risk (estimated loss amount) of Yamaguchi
Bank was ¥63,526 million, the market risk (estimated loss
amount) of Momiji Bank was ¥18,079 million and the
market risk (estimated loss amount) of Kitakyushu Bank was
¥11,439 million.
Assumptions used in calculating VaR include a holding
period of three months (however, one year for a holding
period for shares held for the purpose of strategic
investment), a confi dence interval of 99.9% and an
observation period of fi ve years.
Yamaguchi Bank, Momiji Bank and Kitakyushu Bank
conduct back-testing to compare the VaR calculated by the
model with the actual losses. Based on the results for the year
ended March 31, 2015 and 2014, the measurement model
is considered to have captured market risk to an acceptable
degree of accuracy. However, as measurements of market risk
employ certain probabilities of occurrence which is statistically
calculated on the basis of historical market fl uctuations, it
is possible that this method may not adequately capture
market risk in the event of sudden changes in the market
environment outside the normally expected scope.
(iii) Management of liquidity risk related to fundraising
The majority of funds is raised through deposits, which
constitute a stable base for procuring funds. The Group
manages funds on the basis of elaborate forecasts,
confi rming cash fl ows primarily through cash controls in
fi nancial markets.
For cash fl ow management, the Group strives to
maintain the liquidity risk by reducing liquidity risk,
ensuring stability, preparing for unexpected events, and
maintaining highly liquid assets.

33 YMFG Annual Report 2015
(4) Supplementary explanation of items pertaining to the fair value of fi nancial instruments
The fair values of some fi nancial instruments are based
on market prices. The fair values of other instruments, for
which market prices are not readily available, are based
on rational calculation. However, as assumptions are
used in these calculations, different assumptions can yield
different values.
Items pertaining to the fair value of fi nancial instrumentsThe table below indicates the consolidated balance sheet
amounts of fi nancial instruments, as well as their fair values
and the differences between the two. Line items with little
signifi cance to balance sheet amounts have been omitted.
Unlisted equity securities and other instruments for which
fair value is not easily determinable are not included in the
table below. (Refer to (Note 2).)Millions of yen
2015Consolidated balance sheet
amountFair value Difference
(1) Cash and due from banks ¥ 965,275 ¥ 965,275 ¥ —(2) Call loans and bills purchased 283,251 283,251 —(3) Money held in trust 48,096 48,096 —(4) Securities Held-to-maturity debt securities 4,447 4,519 72 Available-for-sale securities 2,310,718 2,310,718 —(5) Loans and bills discounted 6,228,014 Allowance for loan losses (* 1) (71,801)
6,156,213 6,210,677 54,464Total assets ¥9,768,000 ¥9,822,536 ¥54,536(1) Deposits ¥8,441,552 ¥8,443,962 ¥ 2,410(2) Negotiable certifi cates of
deposit767,528 767,528 —
Total liabilities ¥9,209,080 ¥9,211,490 ¥ 2,410Derivative transactions (* 2) Hedge accounting not applied ¥ (8,761) ¥ (8,761) ¥ —Hedge accounting applied (1,326) (1,326) —Total derivative transactions ¥ (10,087) ¥ (10,087) ¥ —
Millions of yen2014
Consolidated balance sheet
amountFair value Difference
(1) Cash and due from banks ¥ 915,056 ¥ 915,056 ¥ —(2) Call loans and bills purchased 315,198 315,198 —(3) Money held in trust 49,996 49,996 —(4) Securities Held-to-maturity debt securities 3,171 3,187 16 Available-for-sale securities 2,061,118 2,061,118 —(5) Loans and bills discounted 5,964,133 Allowance for loan losses (* 1) (85,152)
5,878,981 5,910,384 31,403Total assets ¥9,223,520 ¥9,254,939 ¥31,419(1) Deposits ¥8,147,033 ¥8,149,311 ¥ 2,278(2) Negotiable certifi cates of
deposit617,933 617,933 —
(3) Bonds payable 45,000 45,251 251Total liabilities ¥8,809,966 ¥8,812,495 ¥ 2,529Derivative transactions (* 2) Hedge accounting not applied ¥ (2,145) ¥ (2,145) ¥ —Hedge accounting applied (974) (974) —Total derivative transactions ¥ (3,119) ¥ (3,119) ¥ —
Thousands of U.S. dollars2015
Consolidated balance sheet
amountFair value Difference
(1) Cash and due from banks $ 8,032,579 $ 8,032,579 $ —(2) Call loans and bills purchased 2,357,086 2,357,086 —(3) Money held in trust 400,233 400,233 —(4) Securities Held-to-maturity debt securities 37,006 37,605 599 Available-for-sale securities 19,228,743 19,228,743 —(5) Loans and bills discounted 51,826,696 Allowance for loan losses (* 1) (597,497)
51,229,199 51,682,425 453,226Total assets $81,284,846 $81,738,671 $453,825(1) Deposits $70,246,751 $70,266,806 $ 20,055(2) Negotiable certifi cates of
deposit6,387,018 6,387,018
Total liabilities $76,633,769 $76,653,824 $ 20,055Derivative transactions (* 2) Hedge accounting not applied $ (72,905) $ (72,905) $ —Hedge accounting applied (11,034) (11,034) —Total derivative transactions $ (83,939) $ (83,939) $ —
(* 1) The general allowance for loan losses and specifi c allowance for loan losses are deducted.(* 2) The amount collectively represents derivative transactions that are recorded as trading
assets and liabilities, and other trading assets and liabilities. This indicates the net amount of rights and obligations under derivative transactions. Parentheses, ( ), indicate that the net amount is negative.
(Note 1) Methods of calculating the fair value of fi nancial
instruments
(1) Assets
(i) Cash and due from banks
As the settlement term of these instruments is short
(within one year) and their fair values and book values are

YMFG Annual Report 2015 34
approximately the same, their book values are taken as
their fair values.
(ii) Call loans and bills purchased
As the settlement term of these instruments is short
(within one year) and their fair values and book values are
approximately the same, their book values are taken as
their fair values.
(iii) Money held in trust
As for the securities held as trusted assets in money held
in trust established independently for the purpose of
investing mainly in the securities of the Group, the value
on stock exchanges is taken as fair value for the equity
securities, and either the value on exchanges or a price
indicated by other fi nancial institutions dealing with the
specifi c instruments is taken as fair value.
Notes pertaining to money held in trust exchanges for
the purpose of holding are indicated within “Money held
in trust.”
(iv) Securities
For equity securities, fair value is determined by stock
exchange prices; the fair value of debt securities is
determined by exchange prices or prices received from
information vendors. Fair values of investment trusts are
determined by exchange prices or standard prices disclosed
by investment trust management companies.
The fair value of private placement bonds guaranteed
by Yamaguchi Bank and Momiji Bank is determined for
each internal rating category and period by discounting to
present value the total amount of interest and principal,
using as the discount rate the risk-free rate plus the
credit cost determined for each internal rating category.
However, fair value of bonds of legally bankrupt debtors,
substantially bankrupt debtors and debtors in danger
of bankruptcy is determined by deducting the expected
amount of loss on the bond by using the same method
applied to loans from the bond’s face value.
(v) Loans and bills discounted
For loans and bills discounted with fl oating interest rates,
as in the short term their values refl ect market interest
rates, unless the credit status of the obligor has changed
signifi cantly since the loans were extended, their fair value
is similar to their book value, so their book value is taken as
their fair value.
For loans and bills discounted bearing fi xed interest
rates, fair value is determined for each internal rating
category and period by discounting to present value
the total amount of interest and principal, using as the
discount rate the risk-free rate for operating loans and
bills discounted plus the credit cost for each internal
rating category. For consumer loans and bills discounted,
fair value is determined by discounting the total amount
of interest and principal to their present value using the
assumed interest rate on new loans of the same type. For
instruments having a short settlement period (within one
year), as their fair values and book values are approximately
the same, their book value is taken as their fair value.
With regard to loans to legally bankrupt obligors,
substantially bankrupt obligors or obligors who are in
danger of bankruptcy, the estimated collectible amount
is based on either the present value of estimated future
cash fl ows or the expected amounts recoverable from
the disposal of collateral and/or under guarantees. As
the fair value is essentially equivalent to the amount after
deducting the allowance for possible loan losses from the
book value as of the consolidated balance sheet date, this
amount is taken as fair value.
For loans that have no specifi c repayment period, as the
fair value is assumed to be equivalent with the book value
according to the expected payment dates and interest
rates, book value is taken as the fair value.
(2) Liabilities
(i) Deposits and (ii) Negotiable certifi cates of deposit
The fair value of demand deposits is determined as
the payment amount if payment were required on the
consolidated balance sheet date (book value). The fair
value of time deposits is determined by discounting future
cash fl ows to their present value by certain time periods.
The discount rate employed is the interest rate required for
newly accepted deposits. For deposits having a short period
(within one year), as their fair values and book values are
approximately the same, their book value is taken as their
fair value.
(iii) Bonds payable
The fair value of bonds issued by the Group is determined
by using prices publicly quoted by third-party institutions.
(3)Derivative transactions
The fair value of derivative transactions, comprising
interest-rate-related transactions (such as interest rate
futures, interest rate options and interest rate swaps)
currency-related transactions (such as currency futures,
currency options and currency swaps), bond-related
transactions (such as bond futures and bond options) is
taken as their value on exchanges, discounted present

35 YMFG Annual Report 2015
value or price as calculated using option pricing models.
Interest rates swaps that employ exceptional accounting
treatment are accounted for as part of the loans and bills
discounted that are hedged. Therefore, their fair value is
included in the fair value of loans and bills discounted.
(Note 2) The consolidated balance sheet amounts of
fi nancial instruments for which market prices are not
readily available
Financial instruments for which market prices are not
readily available are not included in “Assets (4) Available-
for-sale securities.”
Millions of yenThousands of U.S. dollars
2015 2014 2015Category Consolidated balance sheet amount(1) Unlisted equity securities
(*1, *2)¥6,057 ¥6,090 $50,404
(2) Investments in partnerships, etc. (*3)
2,762 1,611 22,984
Total ¥8,819 ¥7,701 $73,388
(*1) As unlisted equity securities have no market prices and their fair value is not readily available, they are not included in the scope of fair value disclosures.
(*2) During the fi scal year ended March 31, 2014 and 2015, impairment losses of ¥22 million and ¥15 million ($125 thousand) were recorded on unlisted equity securities.
(*3) Of investments in partnerships, those partnership assets comprising unlisted equity securities, which have no readily available fair value, are not included in the scope of fair value disclosure.
(Note 3) Expected maturity amount of monetary claims and
securities with maturities after the consolidated balance
sheet dateMillions of yen
2015
Within one year
More than one year
and within three years
More than three years and within fi ve years
More than fi ve years
and within seven years
More than seven years
(1) Due from banks
¥869,860 ¥ — ¥ — ¥ — ¥ —
(2) Call loans and bills purchased
283,251 — — — —
(3) Securities 242,598 564,180 531,630 338,247 376,982Held-to-maturity debt securities
546 885 723 30 2,263
Local government bond
— — — — 900
Corporate bond
110 570 723 30 1,363
Others 436 315 — — —Available-for-sale securities with maturities
242,052 563,295 530,907 338,217 374,719
Japanese government bond
80,170 151,197 237,361 170,809 96,770
Local government bond
16,418 4,163 4,273 9,676 4,961
Corporate bond
131,735 353,197 253,978 135,888 226,843
Others 13,729 54,738 35,295 21,844 46,145(4) Loans and
bills dis-counted (*)
2,146,945 1,126,783 808,102 555,296 1,590,889
Total ¥3,542,654 ¥1,690,963 ¥1,339,732 ¥893,543 ¥1,967,871

YMFG Annual Report 2015 36
Millions of yen2014
Within one year
More than one year
and within three years
More than three years and within fi ve years
More than fi ve years
and within seven years
More than seven years
(1) Due from banks
¥819,863 ¥ — ¥ — ¥ — ¥ —
(2) Call loans and bills purchased
315,198 — — — —
(3) Securities 102,685 522,639 644,212 189,964 411,702Held-to-maturity debt securities
260 1,139 692 — 1,080
Local government bond
— — — — 500
Corporate bond
260 470 692 — 580
Others — 669 — — —Available-for-sale securities with maturities
102,425 521,500 643,520 189,964 410,622
Japanese government bond
26,716 139,128 216,876 64,575 126,004
Local government bond
7,976 19,262 3,345 3,631 10,157
Corporate bond
58,230 335,503 328,065 100,976 260,711
Others 9,503 27,607 95,234 20,782 13,750(4) Loans and
bills dis-counted (*)
2,040,816 1,148,253 819,357 502,276 1,453,431
Total ¥3,278,562 ¥1,670,892 ¥1,463,569 ¥692,240 ¥1,865,133
Thousands of U.S. dollars2015
Within one year
More than one year
and within three years
More than three years and within fi ve years
More than fi ve years
and within seven years
More than seven years
(1) Due from banks
$ 7,238,579 $ — $ — $ — $ —
(2) Call loans and bills purchased
2,357,086 — — — —
(3) Securities 2,018,789 4,694,850 4,423,982 2,814,738 3,137,072Held-to-maturity debt securities
4,543 7,364 6,016 250 18,831
Local government bond
— — — — 7,489
Corporate bond
915 4,743 6,016 250 11,342
Others 3,628 2,621 — — —Available-for-sale securities with maturities
2,014,246 4,687,486 4,417,966 2,814,488 3,118,241
Japanese government bond
667,138 1,258,193 1,975,210 1,421,395 805,276
Local government bond
136,623 34,643 35,558 80,519 41,283
Corporate bond
1,096,239 2,939,145 2,113,489 1,130,798 1,887,684
Others 114,246 455,505 293,709 181,776 383,998(4) Loans and
bills dis-counted (*)
17,865,898 9,376,575 6,724,657 4,620,920 13,238,654
Total $29,480,352 $14,071,425 $11,148,639 $7,435,658 $16,375,726
(*) Loans and bills discounted for which no period is specifi ed are included in “within one year.”
(Note 4) Estimated repayment amounts of deposits, negotiable
certifi cates of deposit and other interest-bearing liabilities to be
repaid after the consolidated balance sheet dateMillions of yen
2015
Within one year
More than one year
and within two years
More than two years and within three years
Three years or
more
Deposits (*) ¥7,359,032 ¥563,053 ¥484,617 ¥34,850Negotiable certifi cates of deposit
766,740 788 — —
Total ¥8,125,772 ¥563,841 ¥484,617 ¥34,850
Millions of yen2014
Within one year
More than one year
and within two years
More than two years and within three years
Three years or
more
Deposits (*) ¥7,476,391 ¥464,376 ¥165,186 ¥41,080Negotiable certifi cates of deposit
617,582 350 — —
Bonds payable 20,000 — — 25,000Total ¥8,113,973 ¥464,726 ¥165,186 ¥66,080

37 YMFG Annual Report 2015
Thousands of U.S. dollars2015
Within one year
More than one year
and within two years
More than two years and within three years
Three years or
more
Deposits (*) $61,238,512 $4,685,471 $4,032,762 $290,006Negotiable certifi cates of deposit
6,380,461 6,557 — —
Total $67,618,973 $4,692,028 $4,032,762 $290,006
(*) Within deposits, demand deposits are included in “within one year.”
5. SECURITIES
Securities held at March 31, 2015 include shares of
unconsolidated subsidiaries and affi liates amounting to
¥86 million ($1 million) and investments of ¥853 million
($7 million). Corresponding fi gures at March 31, 2014,
were ¥355 million and ¥700 million.
The amount of guarantee obligations for private
placement bonds (Financial Instruments and Exchange
Law, Article 2, Item 3), out of bonds included in securities,
amounted to ¥4,785 million ($40 million) and ¥3,301 million
as of March 31, 2015 and March 31, 2014 respectively.
Bonds included in securities also include securities
lent through unsecured loan agreements (bond lending
transactions) of ¥18,561 million ($154 million) and
¥15,015 million, at March 31, 2015 and March 31,
2014 respectively.
6. FAIR VALUE INFORMATION
SecuritiesThe following tables summarize book values, fair value and
acquisition cost of securities with available fair values as of
March 31, 2015 and 2014:
(a) Trading securities
Amount of unrealized gain (loss) on trading securities
included in the consolidated statement of income
— ¥14 million ($117 thousand) and ¥(73) million as at
March 31, 2015 and 2014, respectively.
(b) Held-to-maturity debt securities:Millions of yen
2015Type Book value Fair value Difference
Securities with fair value exceeding book value
Local government bonds
¥ 900 ¥ 915 ¥15
Corporate bonds 2,686 2,727 41
Others 751 767 16Subtotal 4,337 4,409 72
Securities with fair value not exceeding book value
Local government bonds
— — —
Corporate bonds 110 110 (0)
Others — — —Subtotal 110 110 (0)Total ¥4,447 ¥4,519 ¥72
Millions of yen2014
Type Book value Fair value DifferenceSecurities with fair value exceeding book value
Local government bonds
¥ 500 ¥ 502 ¥ 2
Corporate bonds 1,713 1,717 4
Others 670 680 10Subtotal 2,883 2,899 16
Securities with fair value not exceeding book value
Local government bonds
— — —
Corporate bonds 288 288 —
Others — — —Subtotal 288 288 —Total ¥3,171 ¥3,187 ¥16
Thousands of U.S. dollars2015
Type Book value Fair value DifferenceSecurities with fair value exceeding book value
Local government bonds
$ 7,489 $ 7,614 $125
Corporate bonds 22,352 22,693 341
Others 6,250 6,383 133Subtotal 36,091 36,690 599
Securities with fair value not exceeding book value
Local government bonds
— — —
Corporate bonds 915 915 (0)
Others — — —Subtotal 915 915 (0)Total $37,006 $37,605 $599

YMFG Annual Report 2015 38
(c) Available-for-sale securitiesMillions of yen
2015
Type Book value Acquisition cost Difference
Securities with book value exceeding acquisition cost
Shares ¥ 133,436 ¥ 56,513 ¥ 76,923Japanese government bonds
678,753 674,788 3,965
Local government bonds
35,752 35,088 664
Corporate bonds 1,054,576 1,041,975 12,601
Others 223,373 210,685 12,688Subtotal 2,125,890 2,019,049 106,841
Securities with book value not exceeding acquisition cost
Shares 5,695 6,355 (660)Japanese government bonds
57,556 57,858 (302)
Local government bonds
3,739 3,759 (20)
Corporate bonds 47,056 47,346 (290)
Others 70,782 72,682 (1,900)Subtotal 184,828 188,000 (3,172)Total ¥2,310,718 ¥2,207,049 ¥103,669
Millions of yen2014
Type Book value Acquisition cost Difference
Securities with book value exceeding acquisition cost
Shares ¥ 106,333 ¥ 54,479 ¥51,854Japanese government bonds
438,638 436,586 2,052
Local government bonds
40,687 39,909 778
Corporate bonds 931,557 922,097 9,460
Others 68,976 68,197 779Subtotal 1,586,191 1,521,268 64,923
Securities with book value not exceeding acquisition cost
Shares 8,996 10,506 (1,510)Japanese government bonds
134,662 135,042 (380)
Local government bonds
3,685 3,693 (8)
Corporate bonds 151,919 152,730 (811)
Others 175,664 182,847 (7,183)Subtotal 474,926 484,818 (9,892)Total ¥2,061,117 ¥2,006,086 ¥55,031
Thousands of U.S. dollars2015
Type Book value Acquisition cost Difference
Securities with book value exceeding acquisition cost
Shares $ 1,110,394 $ 470,275 $640,119Japanese government bonds
5,648,273 5,615,278 32,995
Local government bonds
297,512 291,986 5,526
Corporate bonds 8,775,701 8,670,841 104,860
Others 1,858,809 1,753,226 105,583Subtotal 17,690,689 16,801,606 889,083
Securities with book value not exceeding acquisition cost
Shares 47,391 52,883 (5,492)Japanese government bonds
478,955 481,468 (2,513)
Local government bonds
31,114 31,281 (167)
Corporate bonds 391,579 393,992 (2,413)
Others 589,015 604,826 (15,811)Subtotal 1,538,054 1,564,450 (26,396)Total $19,228,743 $18,366,056 $862,687
(d) Held-to-maturity debt securities sold during the fi scal yearThere were no held-to-maturity securities sold during the
fi scal year ended March 31, 2015 and 2014.
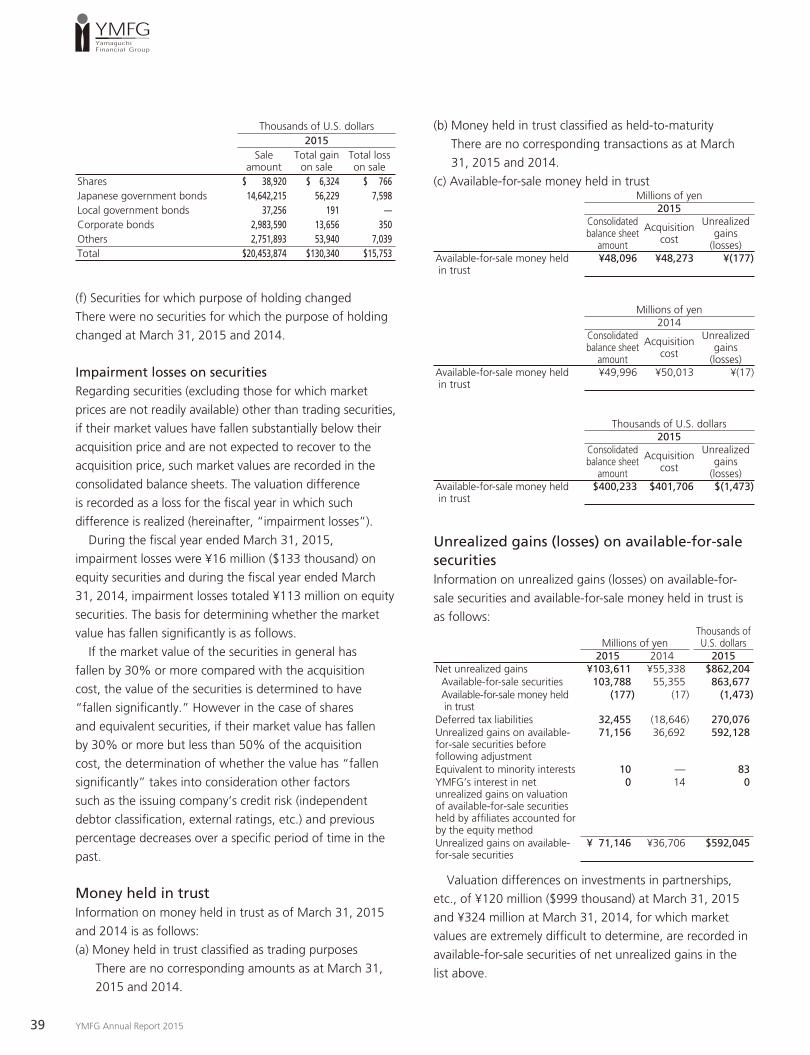
(e) Available-for-sale securities sold during the fi scal year Millions of yen
2015Sale
amountTotal gain
on saleTotal loss on sale
Shares ¥ 4,677 ¥ 760 ¥ 92Japanese government bonds 1,759,555 6,757 913Local government bonds 4,477 23 —Corporate bonds 358,538 1,641 42Others 330,695 6,482 846Total ¥2,457,942 ¥15,663 ¥1,893
Millions of yen2014
Sale amount
Total gain on sale
Total loss on sale
Shares ¥ 5,273 ¥ 1,998 ¥ 31Japanese government bonds 1,725,598 5,972 1,941Local government bonds 10,179 242 —Corporate bonds 533,328 2,449 159Others 288,129 7,731 1,376Total ¥2,562,507 ¥18,392 ¥3,507
39 YMFG Annual Report 2015
Thousands of U.S. dollars2015
Sale amount
Total gain on sale
Total loss on sale
Shares $ 38,920 $ 6,324 $ 766Japanese government bonds 14,642,215 56,229 7,598Local government bonds 37,256 191 —Corporate bonds 2,983,590 13,656 350Others 2,751,893 53,940 7,039Total $20,453,874 $130,340 $15,753
(f) Securities for which purpose of holding changed
There were no securities for which the purpose of holding
changed at March 31, 2015 and 2014.
Impairment losses on securitiesRegarding securities (excluding those for which market
prices are not readily available) other than trading securities,
if their market values have fallen substantially below their
acquisition price and are not expected to recover to the
acquisition price, such market values are recorded in the
consolidated balance sheets. The valuation difference
is recorded as a loss for the fi scal year in which such
difference is realized (hereinafter, “impairment losses”).
During the fi scal year ended March 31, 2015,
impairment losses were ¥16 million ($133 thousand) on
equity securities and during the fi scal year ended March
31, 2014, impairment losses totaled ¥113 million on equity
securities. The basis for determining whether the market
value has fallen signifi cantly is as follows.
If the market value of the securities in general has
fallen by 30% or more compared with the acquisition
cost, the value of the securities is determined to have
“fallen signifi cantly.” However in the case of shares
and equivalent securities, if their market value has fallen
by 30% or more but less than 50% of the acquisition
cost, the determination of whether the value has “fallen
signifi cantly” takes into consideration other factors
such as the issuing company’s credit risk (independent
debtor classifi cation, external ratings, etc.) and previous
percentage decreases over a specifi c period of time in the
past.
Money held in trust Information on money held in trust as of March 31, 2015
and 2014 is as follows:
(a) Money held in trust classifi ed as trading purposes
There are no corresponding amounts as at March 31,
2015 and 2014.
(b) Money held in trust classifi ed as held-to-maturity
There are no corresponding transactions as at March
31, 2015 and 2014.
(c) Available-for-sale money held in trustMillions of yen
2015Consolidated balance sheet
amount
Acquisition cost
Unrealizedgains
(losses)Available-for-sale money held in trust
¥48,096 ¥48,273 ¥(177)
Millions of yen2014
Consolidated balance sheet
amount
Acquisition cost
Unrealizedgains
(losses)Available-for-sale money held in trust
¥49,996 ¥50,013 ¥(17)
Thousands of U.S. dollars2015
Consolidated balance sheet
amount
Acquisition cost
Unrealizedgains
(losses)Available-for-sale money held in trust
$400,233 $401,706 $(1,473)
Unrealized gains (losses) on available-for-sale securitiesInformation on unrealized gains (losses) on available-for-
sale securities and available-for-sale money held in trust is
as follows:
Millions of yenThousands of U.S. dollars
2015 2014 2015Net unrealized gains ¥103,611 ¥55,338 $862,204 Available-for-sale securities 103,788 55,355 863,677 Available-for-sale money held in trust
(177) (17) (1,473)
Deferred tax liabilities 32,455 (18,646) 270,076Unrealized gains on available-for-sale securities before following adjustment
71,156 36,692 592,128
Equivalent to minority interests 10 — 83YMFG’s interest in net unrealized gains on valuation of available-for-sale securities held by affi liates accounted for by the equity method
0 14 0
Unrealized gains on available-for-sale securities
¥ 71,146 ¥36,706 $592,045
Valuation differences on investments in partnerships,
etc., of ¥120 million ($999 thousand) at March 31, 2015
and ¥324 million at March 31, 2014, for which market
values are extremely diffi cult to determine, are recorded in
available-for-sale securities of net unrealized gains in the
list above.

YMFG Annual Report 2015 40
Derivatives (1) Derivative transactions at March 31, 2015 and 2014, to
which hedge accounting is not applied
(a) Interest-rate-related:Millions of yen
2015
Type
Contract amounts
Over one year Fair value
Realizedgains
(losses)Over-the-counter:Interest rate swaps:Receivable fi xed, payable fl oating
¥50,546 ¥37,556 ¥ 582 ¥ 582
Receivable fl oating, payable fi xed
50,637 37,648 (466) (466)
Interest rate cap Sold 96 96 (0) 4Total ¥ — ¥ — ¥ 116 ¥ 120
Millions of yen2014
Type
Contract amounts
Over one year Fair value
Realizedgains
(losses)Over-the-counter:Interest rate swaps:Receivable fi xed, payable fl oating
¥59,080 ¥55,080 ¥ 763 ¥ 762
Receivable fl oating, payable fi xed
59,204 55,204 (622) (622)
Interest rate cap Sold 128 128 (0) 4Total ¥ — ¥ — ¥ 141 ¥ 144
Thousands of U.S. dollars2015
Type
Contract amounts
Over one year Fair value
Realizedgains
(losses)Over-the-counter:Interest rate swaps:Receivable fi xed, payable fl oating
$420,621 $312,524 $ 4,843 $ 4,843
Receivable fl oating, payable fi xed
421,378 313,290 (3,878) (3,878)
Interest rate cap Sold 799 799 (0) 33Total $ — $ — $ 965 $ 998
(b) Currency-related:Millions of yen
2015
Type
Contract amounts
Over one year Fair value
Realizedgains
(losses)Over-the-counter:Currency swaps ¥261,656 ¥141,121 ¥(10,093) ¥ (1,732)Foreign exchange forward contracts: Sold 158,367 7,268 (929) (929) Bought 25,690 3,059 774 774Currency options Sold 174,828 130,634 (4,767) 6,847 Bought 174,828 130,634 6,413 (3,169)Total ¥ — ¥ — ¥(8,602) ¥ 1,791
Millions of yen2014
Type
Contract amounts
Over one year Fair value
Realizedgains
(losses)Over-the-counter:Currency swaps ¥145,534 ¥83,213 ¥(3,022) ¥ (1,295)Foreign exchange forward contracts: Sold 119,873 615 (694) (694) Bought 14,229 — 83 83Currency options Sold 203,186 146,722 (5,833) 10,551 Bought 203,186 146,722 7,120 (6,706)Total ¥ — ¥ — ¥(2,346) ¥ 1,939
Thousands of U.S. dollars2015
Type
Contract amounts
Over one year Fair value
Realizedgains
(losses)Over-the-counter:Currency swaps $2,177,382 $1,174,345 $(83,989) $(14,413)Foreign exchange forward contracts: Sold 1,317,858 60,481 (7,731) (7,731) Bought 213,780 25,456 6,441 6,441Currency options Sold 1,454,839 1,087,077 (39,669) 56,978 Bought 1,454,839 1,087,077 53,366 (26,371)Total $ — $ — $(71,582) $ 14,904

41 YMFG Annual Report 2015
(c) Stock-related:
There were no stock-related transactions as at March 31,
2015 and 2014.
(d) Bond-related:Millions of yen
2015
Type
Contract amounts
Over one year Fair value
Realizedgains
(losses)Listed:Bond futures Sold ¥111,318 ¥— ¥(275) ¥(275)Total ¥ — ¥— ¥(275) ¥(275)
Millions of yen2014
Type
Contract amounts
Over one year Fair value
Realizedgains
(losses)Listed:Bond futures Sold ¥62,247 ¥— ¥60 ¥60Total ¥ — ¥— ¥60 ¥60
Thousands of U.S. dollars2015
Type
Contract amounts
Over one year Fair value
Realizedgains
(losses)Listed:Bond futures Sold $926,338 $— $(2,288) $(2,288)Total $ — $— $(2,288) $(2,288)
(e) Commodity-related:
There were no commodity-related transactions as at March
31, 2015 and 2014.
(f) Credit-derivatives:
There were no credit related transactions as at March 31,
2015 and 2014.
(2) Derivative transactions as at March 31, 2015 and 2014,
to which hedge accounting is applied
(a) Interest-rate-related:Millions of yen
2015
TypeContract amounts
Over one year Fair value
Principal accounting procedure:Interest rate swapsReceive fl oating, payable fi xed ¥13,710 ¥13,710 ¥(499)Interest rate swaps employing exceptional accounting:Interest rate swapsReceive fl oating, payable fi xed 275 242 *Total ¥ — ¥ — ¥(499)
Millions of yen2014
TypeContract amounts
Over one year Fair value
Principal accounting procedure:Interest rate swapsReceive fl oating, payable fi xed ¥16,054 ¥15,346 ¥(615)Interest rate swaps employing exceptional accounting:Interest rate swapsReceive fl oating, payable fi xed 308 275 *Total ¥ — ¥ — ¥(615)
Thousands of U.S. dollars2015
TypeContract amounts
Over one year Fair value
Principal accounting procedure:Interest rate swapsReceive fl oating, payable fi xed $114,088 $114,088 $(4,152)Interest rate swaps employing exceptional accounting:Interest rate swapsReceive fl oating, payable fi xed 2,288 2,014 *Total $ — $ — $(4,152)
(*) Of interest rate swaps employing exceptional accounting, as these instruments are accounted for together with the hedged loans and bills discounted, their fair value is included in the fair value of said loans and bills discounted within “Financial instruments.”
(b) Currency-related:Millions of yen
2015
TypeContract amounts
Over one year Fair value
Principal accounting procedure:Currency swaps ¥32,730 ¥— ¥(828)Total ¥ — ¥— ¥(828)
Millions of yen2014
TypeContract amounts
Over one year Fair value
Principal accounting procedure:Currency swaps ¥29,267 ¥— ¥(360)Total ¥ — ¥— ¥(360)
YMFG Annual Report 2015 42
Thousands of U.S. dollars2015
TypeContract amounts
Over one year Fair value
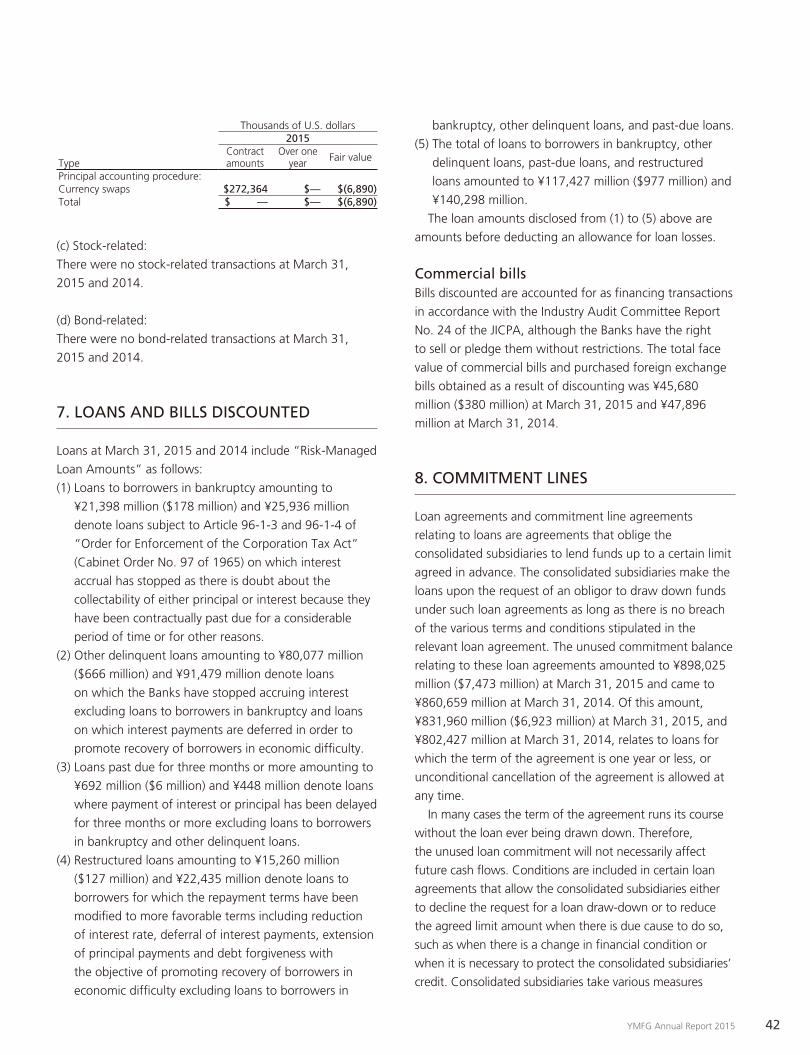
Principal accounting procedure:Currency swaps $272,364 $— $(6,890)Total $ — $— $(6,890)
(c) Stock-related:
There were no stock-related transactions at March 31,
2015 and 2014.
(d) Bond-related:
There were no bond-related transactions at March 31,
2015 and 2014.
7. LOANS AND BILLS DISCOUNTED
Loans at March 31, 2015 and 2014 include “Risk-Managed
Loan Amounts” as follows:
(1) Loans to borrowers in bankruptcy amounting to
¥21,398 million ($178 million) and ¥25,936 million
denote loans subject to Article 96-1-3 and 96-1-4 of
“Order for Enforcement of the Corporation Tax Act”
(Cabinet Order No. 97 of 1965) on which interest
accrual has stopped as there is doubt about the
collectability of either principal or interest because they
have been contractually past due for a considerable
period of time or for other reasons.
(2) Other delinquent loans amounting to ¥80,077 million
($666 million) and ¥91,479 million denote loans
on which the Banks have stopped accruing interest
excluding loans to borrowers in bankruptcy and loans
on which interest payments are deferred in order to
promote recovery of borrowers in economic diffi culty.
(3) Loans past due for three months or more amounting to
¥692 million ($6 million) and ¥448 million denote loans
where payment of interest or principal has been delayed
for three months or more excluding loans to borrowers
in bankruptcy and other delinquent loans.
(4) Restructured loans amounting to ¥15,260 million
($127 million) and ¥22,435 million denote loans to
borrowers for which the repayment terms have been
modifi ed to more favorable terms including reduction
of interest rate, deferral of interest payments, extension
of principal payments and debt forgiveness with
the objective of promoting recovery of borrowers in
economic diffi culty excluding loans to borrowers in
bankruptcy, other delinquent loans, and past-due loans.
(5) The total of loans to borrowers in bankruptcy, other
delinquent loans, past-due loans, and restructured
loans amounted to ¥117,427 million ($977 million) and
¥140,298 million.
The loan amounts disclosed from (1) to (5) above are
amounts before deducting an allowance for loan losses.
Commercial bills Bills discounted are accounted for as fi nancing transactions
in accordance with the Industry Audit Committee Report
No. 24 of the JICPA, although the Banks have the right
to sell or pledge them without restrictions. The total face
value of commercial bills and purchased foreign exchange
bills obtained as a result of discounting was ¥45,680
million ($380 million) at March 31, 2015 and ¥47,896
million at March 31, 2014.
8. COMMITMENT LINES
Loan agreements and commitment line agreements
relating to loans are agreements that oblige the
consolidated subsidiaries to lend funds up to a certain limit
agreed in advance. The consolidated subsidiaries make the
loans upon the request of an obligor to draw down funds
under such loan agreements as long as there is no breach
of the various terms and conditions stipulated in the
relevant loan agreement. The unused commitment balance
relating to these loan agreements amounted to ¥898,025
million ($7,473 million) at March 31, 2015 and came to
¥860,659 million at March 31, 2014. Of this amount,
¥831,960 million ($6,923 million) at March 31, 2015, and
¥802,427 million at March 31, 2014, relates to loans for
which the term of the agreement is one year or less, or
unconditional cancellation of the agreement is allowed at
any time.
In many cases the term of the agreement runs its course
without the loan ever being drawn down. Therefore,
the unused loan commitment will not necessarily affect
future cash fl ows. Conditions are included in certain loan
agreements that allow the consolidated subsidiaries either
to decline the request for a loan draw-down or to reduce
the agreed limit amount when there is due cause to do so,
such as when there is a change in fi nancial condition or
when it is necessary to protect the consolidated subsidiaries’
credit. Consolidated subsidiaries take various measures
43 YMFG Annual Report 2015
to protect their credit. Such measures include having the
obligor pledge collateral to the consolidated subsidiaries
in the form of real estate, securities, etc., at entering into
a loan agreement or in accordance with the consolidated
subsidiaries’ established internal procedures for confi rming
the obligor’s fi nancial condition, etc., at regular intervals.
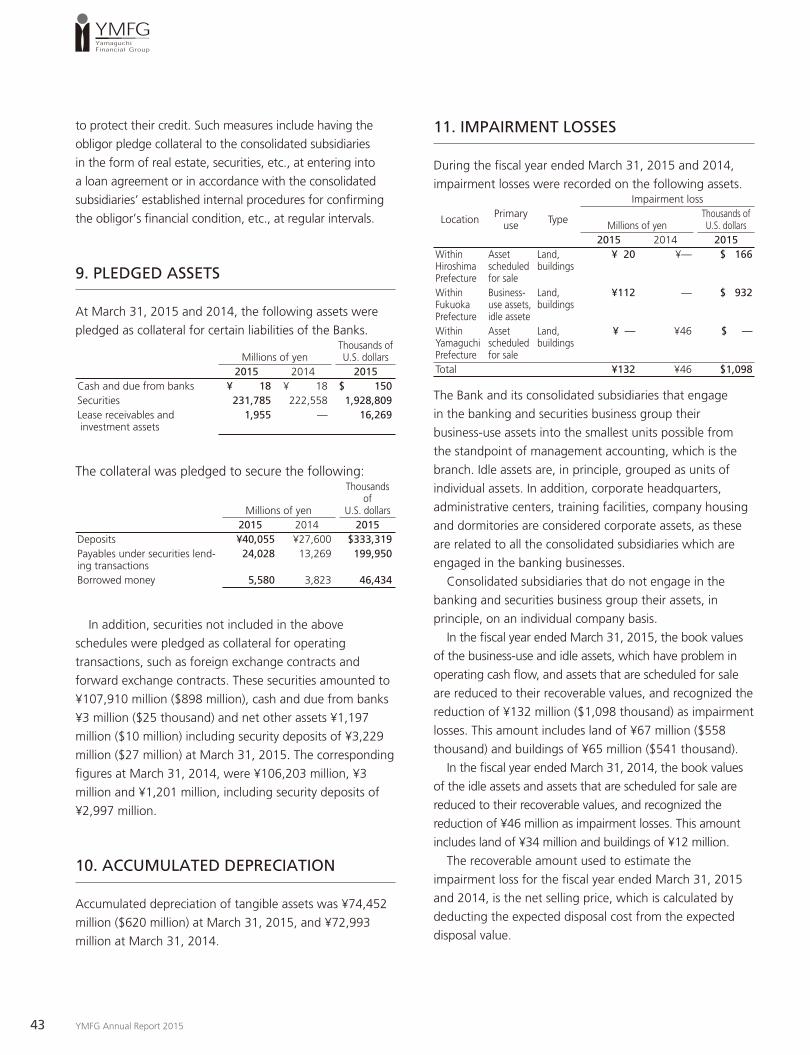
9. PLEDGED ASSETS
At March 31, 2015 and 2014, the following assets were
pledged as collateral for certain liabilities of the Banks.
Millions of yenThousands of U.S. dollars
2015 2014 2015Cash and due from banks ¥ 18 ¥ 18 $ 150Securities 231,785 222,558 1,928,809Lease receivables and investment assets
1,955 — 16,269
The collateral was pledged to secure the following:
Millions of yen
Thousands of
U.S. dollars2015 2014 2015
Deposits ¥40,055 ¥27,600 $333,319Payables under securities lend-ing transactions
24,028 13,269 199,950
Borrowed money 5,580 3,823 46,434
In addition, securities not included in the above
schedules were pledged as collateral for operating
transactions, such as foreign exchange contracts and
forward exchange contracts. These securities amounted to
¥107,910 million ($898 million), cash and due from banks
¥3 million ($25 thousand) and net other assets ¥1,197
million ($10 million) including security deposits of ¥3,229
million ($27 million) at March 31, 2015. The corresponding
fi gures at March 31, 2014, were ¥106,203 million, ¥3
million and ¥1,201 million, including security deposits of
¥2,997 million.
10. ACCUMULATED DEPRECIATION
Accumulated depreciation of tangible assets was ¥74,452
million ($620 million) at March 31, 2015, and ¥72,993
million at March 31, 2014.
11. IMPAIRMENT LOSSES
During the fi scal year ended March 31, 2015 and 2014,
impairment losses were recorded on the following assets.
Location Primary use Type
Impairment loss
Millions of yenThousands of U.S. dollars
2015 2014 2015Within Hiroshima Prefecture
Asset scheduled for sale
Land, buildings
¥ 20 ¥— $ 166
Within Fukuoka Prefecture
Business-use assets, idle assete
Land, buildings
¥112 — $ 932
Within Yamaguchi Prefecture
Asset scheduled for sale
Land, buildings
¥ — ¥46 $ —
Total ¥132 ¥46 $1,098
The Bank and its consolidated subsidiaries that engage
in the banking and securities business group their
business-use assets into the smallest units possible from
the standpoint of management accounting, which is the
branch. Idle assets are, in principle, grouped as units of
individual assets. In addition, corporate headquarters,
administrative centers, training facilities, company housing
and dormitories are considered corporate assets, as these
are related to all the consolidated subsidiaries which are
engaged in the banking businesses.
Consolidated subsidiaries that do not engage in the
banking and securities business group their assets, in
principle, on an individual company basis.
In the fi scal year ended March 31, 2015, the book values
of the business-use and idle assets, which have problem in
operating cash fl ow, and assets that are scheduled for sale
are reduced to their recoverable values, and recognized the
reduction of ¥132 million ($1,098 thousand) as impairment
losses. This amount includes land of ¥67 million ($558
thousand) and buildings of ¥65 million ($541 thousand).
In the fi scal year ended March 31, 2014, the book values
of the idle assets and assets that are scheduled for sale are
reduced to their recoverable values, and recognized the
reduction of ¥46 million as impairment losses. This amount
includes land of ¥34 million and buildings of ¥12 million.
The recoverable amount used to estimate the
impairment loss for the fi scal year ended March 31, 2015
and 2014, is the net selling price, which is calculated by
deducting the expected disposal cost from the expected
disposal value.

YMFG Annual Report 2015 44
12. BORROWED MONEY
Payment schedule of borrowed money as of March 31, 2015 is as follows:
Millions of yenThousands of U.S. dollars
2015 ¥19,599 $163,0942016 6,027 50,1542017 4,651 38,7042018 3,199 26,6212019 1,767 14,704Thereafter 4,579 38,104Total ¥39,822 $331,381
13. BONDS PAYABLE
Bonds payable include subordinated bonds of ¥25,000
million ($208 million) as of March 31, 2015 and ¥25,000
million as of March 31, 2014.
14. PROVISION FOR EMPLOYEE RETIREMENT BENEFITS
Overview of severance payments and pension plans
Some consolidated subsidiaries employ funded and
unfunded defi ned benefi t and defi ned contribution plans as
employee retirement benefi ts.
Defi ned benefi t plans include defi ned benefi t corporate
pension plans and lump-sum retirement plans. Also, some
are established as retirement benefi t trusts.
Some consolidated subsidiaries employ the simplifi ed
method for calculating retirement benefi t obligations.
Defi ned benefi t plans(1) Reconciliation of retirement benefi t obligation
balances at the beginning and the end of the fi scal year ended March 31, 2015 and 2014
Millions of yenThousands of U.S. dollars
2015 2014 2015Retirement benefi t obligations at the beginning of the fi scal year
¥57,979 ¥58,375 $482,475
Cumulative effects of changes in accounting policies
3,086 — 25,680
Restated balance 61,065 58,347 508,155 Service cost 1,555 1,556 12,940 Interest cost 634 1,042 5,276 Actuarial differences 627 645 5,218 Retirement benefi t payments (3,742) (3,878) (31,139) Others 242 239 2,013Retirement benefi t obligations at the end of the fi scal year
¥60,381 ¥57,979 $502,463
(2) Reconciliation of plan asset balances at the beginning and the end of the fi scal year ended March 31, 2015 and 2014
Millions of yenThousands of U.S. dollars
2015 2014 2015Balance of plan assets at the beginning of the fi scal year
¥76,382 ¥67,200 $635,616
Expected return on plan assets 2,805 1,919 23,342Actuarial differences 11,714 7,480 97,479Contribution from employer 1,629 1,941 13,556Retirement benefi t payments (2,368) (2,396) (19,705)Others 228 238 1,896Balance of plan assets at the end of the fi scal year
¥90,390 ¥76,382 $752,184
(3) Reconciliation of the balances of retirement benefi t obligations and plan assets at the end of the fi scal year ended March 31, 2015 and 2014, and the carrying amounts of net defi ned benefi t liability and net defi ned benefi t asset
Millions of yenThousands of U.S. dollars
2015 2014 2015Retirement benefi t obligations of funded plans
¥ 60,328 ¥ 57,935 $502,022
Plan assets (90,390) (76,382) (752,184)(30,062) (18,447) (250,162)
Retirement benefi t obligations of unfunded plans
53 44 441
Net carrying amount of obligations and assets
¥(30,009) ¥(18,403) $(249,721)
Millions of yenThousands of U.S. dollars
2015 2014 2015Net retirement benefi t liability ¥ 3,467 ¥ 4,479 $ 28,851Net retirement benefi t asset (33,476) (22,882) (278,572)Net carrying amount of obligations and assets
¥(30,009) ¥(18,403) $(249,721)
(4) Retirement benefi t costs and their breakdowns
Millions of yenThousands of U.S. dollars
2015 2014 2015Service cost* ¥ 1,555 ¥ 1,556 $ 12,940Interest cost 634 1,042 5,276Expected return on plan assets (2,805) (1,919) (23,342)Recognized actuarial loss 1,637 1,840 13,622Amortization of past service cost
0 1 0
Others 57 64 475Retirement benefi t costs on defi ned benefi t plans
¥ 1,078 ¥ 2,584 $ 8,971
* Excludes employee contribution portion of defi ned benefi t corporate pensions

45 YMFG Annual Report 2015
(5) Remeasurements of defi ned benefi t plansItems posted as remeasurements of defi ned benefi t plans
(before tax-effect exclusions) break down as follows.
Millions of yenThousands of U.S. dollars
2015 2014 2015Past service cost ¥ 0 ¥— $ 0Actuarial gain (loss) 12,723 — 105,875Total ¥12,723 ¥— $105,875
(6) Cumulative remeasurements of defi ned benefi t plans
Items posted as cumulative remeasurements of defi ned
benefi t plans (before tax-effect exclusions) break down
as follows.
Millions of yenThousands of U.S. dollars
2015 2014 2015Unrecognized past service cost ¥ — ¥ 0 $ —Unrecognized actuarial gain (loss)
(7,361) 5,362 (61,255)
Total ¥(7,361) ¥5,362 $(61,255)
(7) Plan assets(i) Percentages of major asset categories to total plan assets
are as follows.2015 2014
Bonds 20% 25%Shares 64% 59%Others 16% 16%Total 100% 100%
(Note) Plan assets include 30% of corporate pension plans established as retirement benefi t trusts at the end of the fi scal year ended March 31, 2015, and 28% at March 31, 2014.
(ii) Method of establishing expected long-term return on
plan assets
(Corporate pensions)
Based on the expected rate of return for individual
investment fi duciary institutions, deducting investment cost
from the weighted average rate for the policy asset mix
(medium- to long-term portfolio)
(Retirement benefi t trusts)
Past dividend performance is converted to yield.
(8) Basis of actuarial calculationThe basis of actuarial calculations as of March 31, 2015 and
20142015 2014
Discount rate 0.03%—1.64% 1.50%—2.00%
Expected long-term rate of return on plan assets
1.50%—6.20% 1.60%—3.80%
Expected rate of salary increase 0.80%—4.65% 0.94%—4.65%
Defi ned contribution plansThe required contribution to the consolidated subsidiaries’
defi ned contribution plans at the end of the fi scal year
ended March 31, 2015 and 2014 were ¥153 million
($1,273 million) and ¥157 million, respectively.
15. REVALUATION RESERVE FOR LAND
Pursuant to the Law concerning Revaluation of Land (Law
No. 34, promulgated March 31, 1998, the “Law”), YMFG
revalued certain land used for banking operations by
consolidated subsidiaries. The tax-equivalent portion of
this revaluation amount was recorded in liabilities under
“deferred tax liabilities for revaluation reserve for land,”
and the reminder under net assets as “revaluation reserve
for land.”
Revaluation date: March 31, 1998
Item 3, Article 3, of the Law establishes the evaluation
method as that prescribed by Article 2-4 of the Order for
Enforcement of Law on Revaluation of Land (Enforcement
Order No. 119, promulgated March 31, 1998), and the
amount of land tax is calculated on the basis of the land
tax amount specifi ed under Article 16 of the Land-holding
Tax Act, adjusted rationally in accordance with the basis of
calculation announced offi cially by the Director General of
the National Tax Administration Agency.
Total difference between market value of land for
business use revalued in accordance with Article 10 of the
Law and the total post-revaluation book value of land at
March 31, 2015 and 2014 were ¥23,409 million ($195
million) and ¥23,419 million, respectively.
16. CONTINGENT LIABILITIES — ACCEPTANCES AND GUARANTEES
All contingent liabilities, including letters of credit,
acceptances and guarantees are refl ected in acceptances
and guarantees. As a contra account, customers’ liabilities
for acceptances and guarantees are shown on the asset side,
which represent the Banks’ right of indemnity from customers.
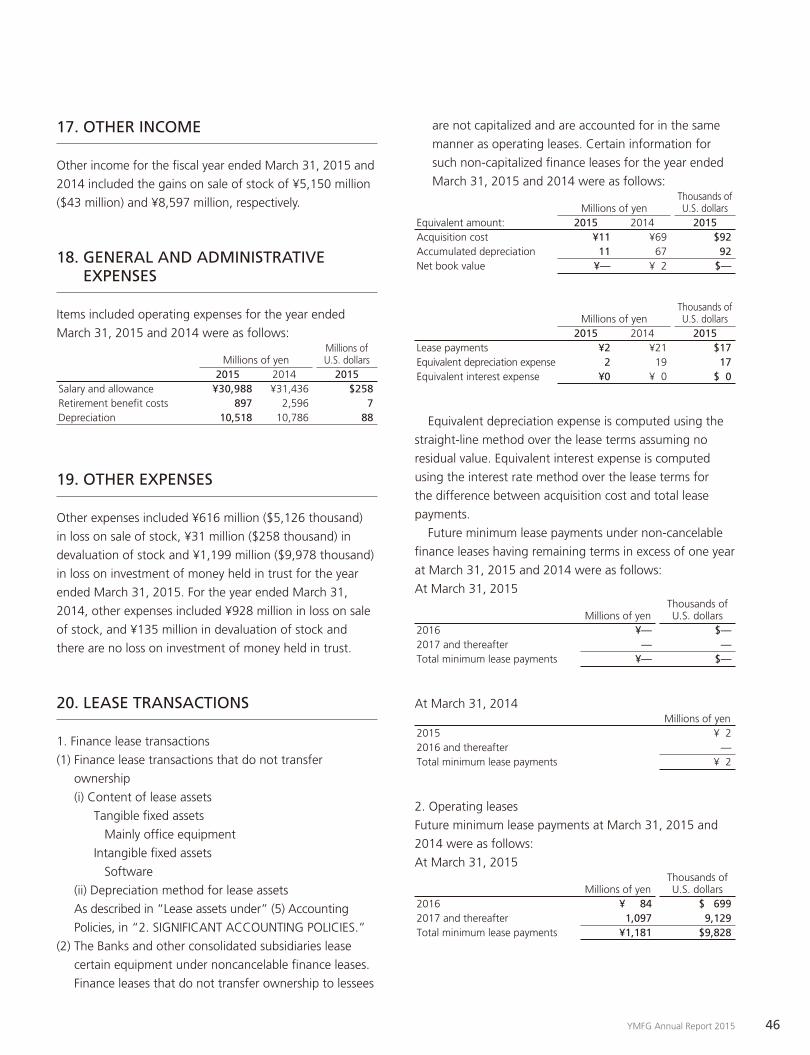
YMFG Annual Report 2015 46
17. OTHER INCOME
Other income for the fi scal year ended March 31, 2015 and
2014 included the gains on sale of stock of ¥5,150 million
($43 million) and ¥8,597 million, respectively.
18. GENERAL AND ADMINISTRATIVE EXPENSES
Items included operating expenses for the year ended
March 31, 2015 and 2014 were as follows:
Millions of yenMillions of U.S. dollars
2015 2014 2015Salary and allowance ¥30,988 ¥31,436 $258Retirement benefi t costs 897 2,596 7Depreciation 10,518 10,786 88
19. OTHER EXPENSES
Other expenses included ¥616 million ($5,126 thousand)
in loss on sale of stock, ¥31 million ($258 thousand) in
devaluation of stock and ¥1,199 million ($9,978 thousand)
in loss on investment of money held in trust for the year
ended March 31, 2015. For the year ended March 31,
2014, other expenses included ¥928 million in loss on sale
of stock, and ¥135 million in devaluation of stock and
there are no loss on investment of money held in trust.
20. LEASE TRANSACTIONS
1. Finance lease transactions
(1) Finance lease transactions that do not transfer
ownership
(i) Content of lease assets
Tangible fi xed assets
Mainly offi ce equipment
Intangible fi xed assets
Software
(ii) Depreciation method for lease assets
As described in “Lease assets under” (5) Accounting
Policies, in “2. SIGNIFICANT ACCOUNTING POLICIES.”
(2) The Banks and other consolidated subsidiaries lease
certain equipment under noncancelable fi nance leases.
Finance leases that do not transfer ownership to lessees
are not capitalized and are accounted for in the same
manner as operating leases. Certain information for
such non-capitalized fi nance leases for the year ended
March 31, 2015 and 2014 were as follows:
Millions of yenThousands of U.S. dollars
Equivalent amount: 2015 2014 2015Acquisition cost ¥11 ¥69 $92Accumulated depreciation 11 67 92Net book value ¥— ¥ 2 $—
Millions of yenThousands of U.S. dollars
2015 2014 2015Lease payments ¥2 ¥21 $17Equivalent depreciation expense 2 19 17Equivalent interest expense ¥0 ¥ 0 $ 0
Equivalent depreciation expense is computed using the
straight-line method over the lease terms assuming no
residual value. Equivalent interest expense is computed
using the interest rate method over the lease terms for
the difference between acquisition cost and total lease
payments.
Future minimum lease payments under non-cancelable
fi nance leases having remaining terms in excess of one year
at March 31, 2015 and 2014 were as follows:
At March 31, 2015
Millions of yenThousands of U.S. dollars
2016 ¥— $—2017 and thereafter — —Total minimum lease payments ¥— $—
At March 31, 2014Millions of yen
2015 ¥ 22016 and thereafter —Total minimum lease payments ¥ 2
2. Operating leases
Future minimum lease payments at March 31, 2015 and
2014 were as follows:
At March 31, 2015
Millions of yenThousands of U.S. dollars
2016 ¥ 84 $ 6992017 and thereafter 1,097 9,129Total minimum lease payments ¥1,181 $9,828

47 YMFG Annual Report 2015
At March 31, 2014Millions of yen
2015 ¥ 522016 and thereafter 747Total minimum lease payments ¥799
21. INCOME TAXES
1. Signifi cant components of the deferred tax assets and
liabilities as of March 31, 2015 and 2014 were as follows:
Millions of yenThousands of U.S. dollars
2015 2014 2015
Deferred tax assets: Allowance for loan losses ¥ 19,703 ¥ 24,891 $ 163,959 Provision for bonuses 1,035 1,148 8,613 Net defi ned benefi t liability 4,357 7,252 36,257 Depreciation 941 951 7,831 Losses on devaluation of securities
2,775 3,542 23,092
Net operating losses carryforwards
406 2,555 3,379
Other 4,374 4,605 36,398 Deferred tax assets 33,591 44,944 279,529 Valuation allowance (3,873) (5,995) (32,229) Total deferred tax assets 29,718 38,949 247,300Deferred tax liabilities: Unrealized gains on available-for-sale securities
(32,447) (18,646) (270,009)
Securities contributed to retirement benefi t trusts
(4,676) (5,160) (38,912)
Other (2,706) (1,421) (22,518) Total deferred tax liabilities (39,829) (25,227) (331,439)Net deferred tax assets (liabilities)
¥(10,111) ¥ 13,722 $ (84,139)
2. Signifi cant differences between the statutory effective
tax rate and the actual income tax rate after application
of deferred income tax accounting for the year ended
March 31, 2015 and 2014 were as follows:
%2015 2014
Effective statutory tax rate — 37.75(Adjustments) Revision of valuation allowances — (10.39)Items permanently exempted from income such as dividend income
— (1.60)
Non-deductable goodwill amortization — 3.73Inhabitant tax on per capita basis — 0.27Items permanently excluded from expense such as entertainment expenses
— 0.31
Stated difference of tax rates on special reconstruction surtax
— 1.46
Expiration of losses carried forward — 5.69Consolidation adjustment — (1.40)Others — (0.39)Actual tax rate after application of deferred income tax accounting
— 35.43
(Note) Information for the year ended March 31, 2015 is omitted, as the difference between the effective statutory tax rate and the actual tax rate after application of deferred income tax accounting is 5% or less.
3. Revisions in amounts of deferred taxes assets and liabilities due to changes in the corporate tax rate
For the year ended March 31, 2014
The “Act on Partial revision of Income Tax Act” (Law
No. 10 of 2014) was promulgated on March 31, 2014,
repealing the special reconstruction surtax from the fi scal
years beginning on or after April 1, 2014. Accordingly, the
statutory effective tax rate used for calculating deferred tax
assets and liabilities was reduced from 37.75% to 35.38%,
applied for temporary differences that are expected to be
deductible in the fi scal year beginning April 1, 2014. This
change in the tax rate had the effect of reducing deferred
tax assets by ¥547 million and increasing income tax
adjustments by ¥547 million.
For the year ended March 31, 2015
The “Act on Partial revision of Income Tax Act” (Law No.
9 of 2015) and the “Act on Partial Revision of the Local
Tax Act” (Law No. 2 of 2015) were promulgated on March
31, 2015, lowering the corporate tax rate from the fi scal
years beginning on or after April 1, 2015. Accordingly, the
statutory effective tax rate used for calculating deferred tax
assets and liabilities was reduced from 35.38% to 32.38%
applied for temporary differences that are expected to be
deductible in the fi scal year beginning April 1, 2015, and
further to 32.06% applied for temporary differences that
are expected to be deductible in the fi scal year beginning
April 1, 2016.
This change in the tax rate had the effect of reducing
deferred tax liabilities by ¥1,358 million ($11 million),
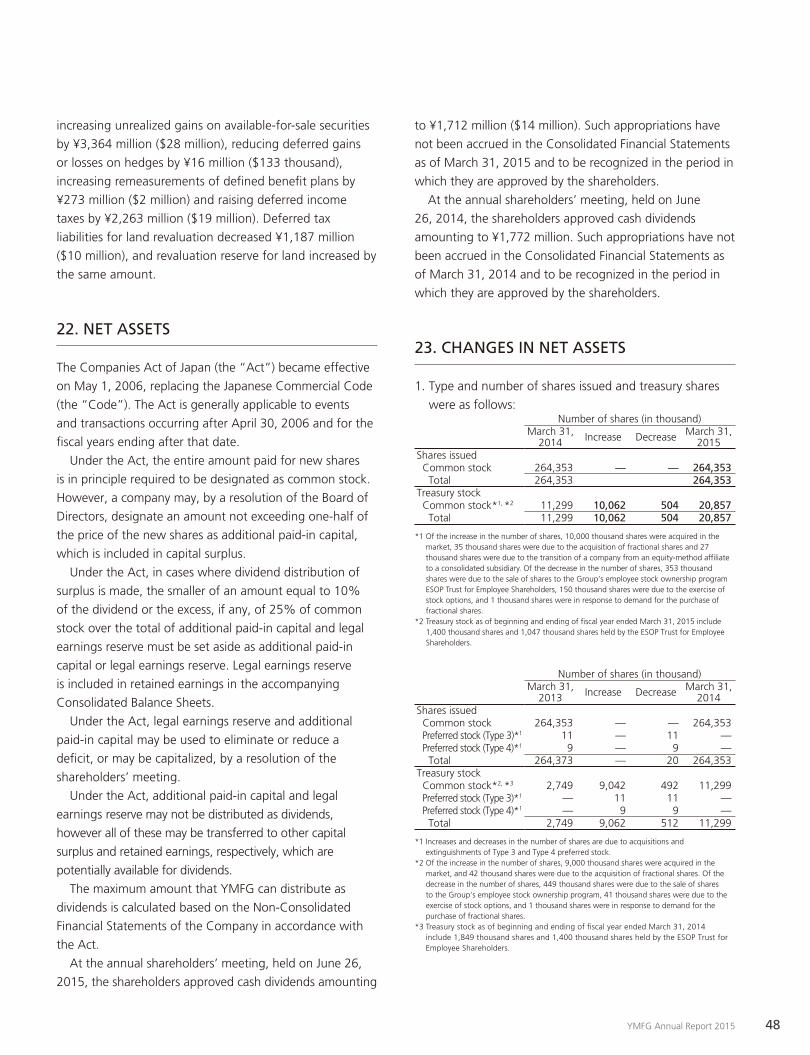
YMFG Annual Report 2015 48
increasing unrealized gains on available-for-sale securities
by ¥3,364 million ($28 million), reducing deferred gains
or losses on hedges by ¥16 million ($133 thousand),
increasing remeasurements of defi ned benefi t plans by
¥273 million ($2 million) and raising deferred income
taxes by ¥2,263 million ($19 million). Deferred tax
liabilities for land revaluation decreased ¥1,187 million
($10 million), and revaluation reserve for land increased by
the same amount.
22. NET ASSETS
The Companies Act of Japan (the “Act”) became effective
on May 1, 2006, replacing the Japanese Commercial Code
(the “Code”). The Act is generally applicable to events
and transactions occurring after April 30, 2006 and for the
fi scal years ending after that date.
Under the Act, the entire amount paid for new shares
is in principle required to be designated as common stock.
However, a company may, by a resolution of the Board of
Directors, designate an amount not exceeding one-half of
the price of the new shares as additional paid-in capital,
which is included in capital surplus.
Under the Act, in cases where dividend distribution of
surplus is made, the smaller of an amount equal to 10%
of the dividend or the excess, if any, of 25% of common
stock over the total of additional paid-in capital and legal
earnings reserve must be set aside as additional paid-in
capital or legal earnings reserve. Legal earnings reserve
is included in retained earnings in the accompanying
Consolidated Balance Sheets.
Under the Act, legal earnings reserve and additional
paid-in capital may be used to eliminate or reduce a
defi cit, or may be capitalized, by a resolution of the
shareholders’ meeting.
Under the Act, additional paid-in capital and legal
earnings reserve may not be distributed as dividends,
however all of these may be transferred to other capital
surplus and retained earnings, respectively, which are
potentially available for dividends.
The maximum amount that YMFG can distribute as
dividends is calculated based on the Non-Consolidated
Financial Statements of the Company in accordance with
the Act.
At the annual shareholders’ meeting, held on June 26,
2015, the shareholders approved cash dividends amounting
to ¥1,712 million ($14 million). Such appropriations have
not been accrued in the Consolidated Financial Statements
as of March 31, 2015 and to be recognized in the period in
which they are approved by the shareholders.
At the annual shareholders’ meeting, held on June
26, 2014, the shareholders approved cash dividends
amounting to ¥1,772 million. Such appropriations have not
been accrued in the Consolidated Financial Statements as
of March 31, 2014 and to be recognized in the period in
which they are approved by the shareholders.
23. CHANGES IN NET ASSETS
1. Type and number of shares issued and treasury shares
were as follows:Number of shares (in thousand)
March 31, 2014 Increase Decrease March 31,
2015Shares issued Common stock 264,353 — — 264,353 Total 264,353 264,353Treasury stock Common stock*1, *2 11,299 10,062 504 20,857 Total 11,299 10,062 504 20,857
*1 Of the increase in the number of shares, 10,000 thousand shares were acquired in the market, 35 thousand shares were due to the acquisition of fractional shares and 27 thousand shares were due to the transition of a company from an equity-method affi liate to a consolidated subsidiary. Of the decrease in the number of shares, 353 thousand shares were due to the sale of shares to the Group’s employee stock ownership program ESOP Trust for Employee Shareholders, 150 thousand shares were due to the exercise of stock options, and 1 thousand shares were in response to demand for the purchase of fractional shares.
*2 Treasury stock as of beginning and ending of fi scal year ended March 31, 2015 include 1,400 thousand shares and 1,047 thousand shares held by the ESOP Trust for Employee Shareholders.
Number of shares (in thousand)March 31,
2013 Increase Decrease March 31, 2014
Shares issued Common stock 264,353 — — 264,353 Preferred stock (Type 3)*1 11 — 11 — Preferred stock (Type 4)*1 9 — 9 — Total 264,373 — 20 264,353Treasury stock Common stock*2, *3 2,749 9,042 492 11,299 Preferred stock (Type 3)*1 — 11 11 — Preferred stock (Type 4)*1 — 9 9 — Total 2,749 9,062 512 11,299
*1 Increases and decreases in the number of shares are due to acquisitions and extinguishments of Type 3 and Type 4 preferred stock.
*2 Of the increase in the number of shares, 9,000 thousand shares were acquired in the market, and 42 thousand shares were due to the acquisition of fractional shares. Of the decrease in the number of shares, 449 thousand shares were due to the sale of shares to the Group’s employee stock ownership program, 41 thousand shares were due to the exercise of stock options, and 1 thousand shares were in response to demand for the purchase of fractional shares.
*3 Treasury stock as of beginning and ending of fi scal year ended March 31, 2014 include 1,849 thousand shares and 1,400 thousand shares held by the ESOP Trust for Employee Shareholders.

49 YMFG Annual Report 2015
2. Information on dividends is as follows:
(a) Dividends paid in the fi scal year ended March 31, 2015
and 2014.
Type of shares
Aggregate amount of dividends (Millions of yen)
Cash dividends per share
(Yen)
Record date
Effective date
Resolved at the board of directors meeting on May 9, 2014Common stock ¥1,781*1 ¥ 7.00 Mar. 31,
2014Jun. 27,
2014Resolved at the board of directors meeting on November 7, 2014Common stock ¥1,782*2 ¥ 7.00 Sep. 30,
2014Dec. 10,
2014
*1 The total amount of dividend on common stock includes ¥10 million in dividends to ESOP Trust for employee shareholders.
*2 The total amount of dividend on common stock includes ¥8 million in dividends to ESOP Trust for employee shareholders.
Type of shares
Aggregate amount of dividends (Millions of yen)
Cash dividends per share
(Yen)
Record date
Effective date
Resolved at the board of directors meeting on May 10, 2013Common stock ¥1,581*1 ¥ 6.00 Mar. 31,
2013Jun. 27,
2013Preferred stock (Type 3)
¥ 127 ¥11,500 Mar. 31, 2013
Jun. 27, 2013
Preferred stock (Type 4)
¥ 98 ¥11,500 Mar. 31, 2013
Jun. 27, 2013
Resolved at the board of directors meeting on November 8, 2013Common stock ¥1,581*2 ¥ 6.00 Sep. 30,
2013Dec. 10,
2013
*1 The total amount of dividend on common stock include ¥11 million in dividends to ESOP Trust for employee shareholders. This is because shares held by ESOP trust are treated as treasury stock.
*2 The total amount of dividend on common stock include ¥10 million in dividends to ESOP Trust for employee shareholders. This is because shares held by ESOP trust are treated as treasury stock.
Type of shares
Aggregate amount of dividends
(Thousands of U.S. dollars)
Cash dividends per share
(U.S. dollars)
Record date
Effective date
Resolved at the board of directors meeting on May 9, 2014Common stock $14,821*1 $0.06 Mar. 31,
2014Jun. 27,
2014Resolved at the board of directors meeting on November 7, 2014Common stock $14,829*2 $0.06 Sep. 30,
2014Dec. 10,
2014
*1 The total amount of dividend on common stock includes $83 thousand in dividends to ESOP Trust for employee shareholders.
*2 The total amount of dividend on common stock includes $67 thousand in dividends to ESOP Trust for employee shareholders.
(b) Dividends to be paid in the fi scal year ending March 31,
2016 and 2015 are as follows:(Millions of yen, except per share amount)
Type of shares
Aggregate amount of dividends
(Millions of yen)
Source of
dividends
Cashdividendsper share
(Yen)
Recorddate
Effectivedate
Resolved at the board of directors meeting on May 8, 2015Common stock ¥1,712 Retained
earnings¥ 7.00 Mar. 31,
2015Jun. 29,
2015
(Note) The total amount of dividend on common stock includes ¥7 million in dividends to ESOP Trust for employee shareholders.
(Millions of yen, except per share amount)
Type of shares
Aggregate amount of dividends
(Millions of yen)
Source of
dividends
Cashdividendsper share
(Yen)
Recorddate
Effectivedate
Resolved at the board of directors meeting on May 9, 2014Common stock ¥1,781 Retained
earnings¥ 7.00 Mar. 31,
2014Jun. 27,
2014
(Note) The total amount of dividend on common stock includes ¥10 million in dividends to ESOP Trust for employee shareholders.
(Thousands of U.S. dollars, except per share amount)
Type of shares
Aggregate amount of dividends
(Thou-sands of U.S. dol-
lars)
Source of
dividends
Cashdividendsper share(U.S. dol-
lars)
Recorddate
Effectivedate
Resolved at the board of directors meeting on May 8, 2015Common stock $14,246 Retained
earnings$0.06 Mar. 31,
2015Jun. 29,
2015
(Note) The total amount of dividend on common stock includes $58 thousand in dividends to ESOP Trust for employee shareholders.
24. STOCK OPTIONS
At a Board of Directors meeting on September 22, 2011,
a resolution was passed with regard to subscription
requirements for the allotment of stock options as
compensation to directors of YMFG’s banking subsidiaries,
Yamaguchi Bank, Momiji Bank and Kitakyushu Bank. The
details of this resolution are described below.

YMFG Annual Report 2015 50
1. Recording of expenses related to stock options and the
name of line items
Millions of yen
Thousands of
U.S. dollars2015 2014 2015
General and administrative expenses
¥194 ¥208 $1,614
2. The content of the stock options is as outlined below.2015
Category and number of persons to be granted stock options
27 directors (excluding outside directors) of YMFG’s subsidiaries, Yamaguchi Bank, Momiji Bank and Kitakyushu Bank.
Number of stock options by class of stock*
182,900 shares of YMFG’s common stock
Grant date July 29, 2014
Vesting conditions No vesting conditions set
Target length of service period
No target length of service period set
Period for exercise of rights July 30, 2014—July 29, 2044
2014
Category and number of persons to be granted stock options
27 directors (excluding outside directors) of YMFG’s subsidiaries, Yamaguchi Bank, Momiji Bank and Kitakyushu Bank.
Number of stock options by class of stock*
225,100 shares of YMFG’s common stock
Grant date July 23, 2013
Vesting conditions No vesting conditions set
Target length of service period
No target length of service period set
Period for exercise of rights July 24, 2013—July 23, 2043
2013
Category and number of persons to be granted stock options
27 directors (excluding outside directors) of YMFG’s subsidiaries, Yamaguchi Bank, Momiji Bank and Kitakyushu Bank.
Number of stock options by class of stock*
294,900 shares of YMFG’s common stock
Grant date July 30, 2012
Vesting conditions No vesting conditions set
Target length of service period
No target length of service period set
Period for exercise of rights July 31, 2012—July 30, 2042
2012
Category and number of persons to be granted stock options
27 directors (excluding outside directors) of YMFG’s subsidiaries, Yamaguchi Bank, Momiji Bank and Kitakyushu Bank.
Number of stock options by class of stock*
192,600 shares of YMFG’s common stock
Grant date October 31, 2011
Vesting conditions No vesting conditions set
Target length of service period
No target length of service period set
Period for exercise of rights November 1, 2011—October 31, 2041
Note: Stated as the equivalent number of shares.
3. The summary of stock option activity is as indicated below.
(a) Number of stock options2015 2014 2013 2012
Prior to vesting As of the end of the previous consolidated fi scal year
— 225,100 — —
Granted 182,900 — — — Expired — — — —Vested — 225,100 — —Rights not yet determined 182,900 — — —After vesting As of the end of the previous consolidated fi scal year
— — 267,500 153,400
Rights determined — — — — Rights exercised — 54,200 62,100 33,700 Expiry — — — — Amount unexercised — 170,900 205,400 119,700
(b) Price informationYen U.S. dollars
2015 2014 2013 2012 2015Exercise price ¥ 1 ¥ 1 ¥ 1 ¥ 1 $0.01Average share price at time of exercise
— 1,075 1,075 1,075 —
Fair value on date granted
1,015 973 619 660 8.45
4. Method of estimating the fair value of stock options
The method employed to estimate the fair value of stock
options granted during the consolidated fi scal year ended
March 31, 2015 and 2014 are as follows:
(a) Valuation method employed: Black-Scholes method
(b) Main base fi gures and estimation method2015
Volatility of stock price*1 24.89%Expected number of years remaining*2 3.69 yearsForecast dividend*3 ¥13/shareRisk-free interest rate*4 0.101%
*1 Calculated on the basis of stock price performance during a period (November 2010 to July 2014) corresponding to the expected number of years remaining (3.69 years).
*2 The number of remaining years in service of current directors is estimated on the basis of the average number of years of service of directors retiring, excluding the current service period.
*3 Based on the actual dividend for the fi scal year ended March 31, 2014.*4 Japanese government bond yields for the expected number of years remaining.

51 YMFG Annual Report 2015
2014Volatility of stock price*1 24.78%Expected number of years remaining*2 3.92 yearsForecast dividend*3 ¥12/shareRisk-free interest rate*4 0.197%
*1 Calculated on the basis of stock price performance during a period (August 2009 to July 2013) corresponding to the expected number of years remaining (3.92 years).
*2 The number of remaining years in service of current directors is estimated on the basis of the average number of years of service of directors retiring, excluding the current service period.
*3 Based on the actual dividend for the fi scal year ended March 31, 2013.*4 Japanese government bond yields for the expected number of years remaining.
5. Method for estimating the number of rights determined
for stock options
Due to the diffi culty of rationally estimating the future
number of rights that will expire, in general a method is
employed that refl ects only the number of rights that have
actually expired.
25. INVESTMENT AND RENTAL PROPERTY
This note is omitted, as the total amount of investment and
rental property is immaterial.
26. CONSOLIDATED STATEMENT OF COMPREHENSIVE INCOME
Amounts of reclassifi cation adjustments and tax effect
amounts related to other comprehensive income in the
consolidated fi scal year ended March 31, 2015 and 2014
were as follows.
Millions of YenThousands of U.S. dollars
2015 2014 2015Unrealized gains (losses) on available- for-sale securitiesAmount generated during the year
¥61,429 ¥17,249 $511,184
Reclassifi cation adjustments (12,951) (13,413) (107,772)Before tax effect adjustment 48,478 3,836 403,412Tax effect amount (14,024) (1,632) (116,703)Unrealized gains (losses) on available-for-sale securities
34,454 2,204 286,709
Deferred gains (losses) on hedges:Amount generated during the year
(170) (89) (1,415)
Reclassifi cation adjustments 250 235 2,080Before tax effect adjustment 80 146 665Tax effect amount (44) (52) (365)Deferred gains (losses) on hedges
36 94 300
Revaluation reserve for landAmount generated during the year
— — —
Reclassifi cation adjustment — — —Before adjustment for tax effects
— — —
Tax effect amount 1,187 — 9,878Revaluation reserve for land 1,187 — 9,878Remeasurements of defi ned benefi t plansAmount generated during the year
11,086 — 92,253
Reclassifi cation adjustment 1,637 — 13,622Before adjustment for tax effects
12,723 — 105,875
Tax effect amount (4,255) — (35,408)Remeasurements of defi ned benefi t plans
8,468 — 70,467
Share of other comprehensive income in affi liated companies accounted for using the equity method Amount generated during the year
(13) 4 (108)
Reclassifi cation adjustments — — —Before tax effect adjustment (13) 4 (108)Tax effect amount — — —Share of other comprehensive income in affi liated companies accounted for using the equity method
(13) 4 (108)
Total other comprehensive income
44,132 2,302 367,246

YMFG Annual Report 2015 52
27. SEGMENT INFORMATION
Business segment information is not presented, as the Bank
and consolidated subsidiaries operate in one segment.
Geographic segment information is not presented, as
domestic income of the Bank and consolidated subsidiaries
and their consolidated assets located substantially in Japan
represent more than 90% of the Group’s consolidated
income and assets.
Overseas sales information is not presented, as overseas
sales are less than 10% of the Group’s consolidated income.
28. RELATED PARTY TRANSACTIONS
There are no signifi cant transactions that should indicate
dealings with related parties.
29. PER SHARE DATA
Yen U.S. dollars2015 2014 2015
Net assets per share ¥2,346.56 ¥2,040.02 $19.53Net income per share 120.88 120.68 1.01Net income per share (diluted) ¥ 108.24 ¥ 116.57 $ 0.90
Net assets per share are calculated based on the following:Millions of yen
except number of shares
Thousands of U.S. dollars
2015 2014 2015Net assets ¥578,388 ¥521,470 $4,813,081Amounts excluded from net assets
¥ 7,008 ¥ 5,232 $ 58,317
stock options 512 431 4,261 minority interests 6,496 4,801 54,056Net assets attributable to common stock at the fi scal year-end
571,380 516,238 4,754,764
Number of common stock at the fi scal year-end used for the calculation of net assets per share (in thousands)*
243,497 253,055
* Shares of the Company held by the ESOP trust are shown on the balance sheets as treasury stock, so are not included in the above number of common stock at the fi scal year-end used for the calculation of net assets per share. This number of shares held by the ESOP was 1,400 thousand as of March 31, 2014, and 1,047 thousand as of March 31, 2015.
Net income per share is calculated based on the following:Millions of yen
except number of shares
Thousands of U.S. dollars
2015 2014 2015Net income ¥30,523 ¥31,242 $253,999Amount not attributable to common shareholders
— — —
Net income attributable tocommon stock
30,523 31,242 253,999
Average shares of common stock during the year* (in thousands)
252,514 258,870
* Shares of the Company held by the ESOP trust are shown on the balance sheets as treasury stock, so are not included in the above average shares of common stock during the year. The average number of shares was 1,598 thousand in the fi scal year ended March 31, 2014, and 1,193 thousand in the fi scal year ended March 31, 2015.
(Note) As previously described in Changes in Accounting Principles, YMFG adopted the “Accounting Standard for Retirement Benefi ts” (ASBJ Statement No. 26, May 17, 2012) and the “Implementation Guidance for the Accounting Standard for Retirement Benefi ts” (ASBJ Guidance No. 25, March 26, 2015), applying the provisions found in the body of Paragraph 35 of the Accounting Standard for Retirement Benefi ts and Paragraph 67 of the Implementation Guidance for the Accounting Standard for Retirement Benefi ts from the fi scal year ended March 31, 2015, and in accordance with the transitional treatment stipulated in Paragraph 37 of the Accounting Standard for Retirement Benefi ts.
As a result, at the beginning of the fi scal year ended March 31, 2015, net assets per share decreased ¥7.88 ($0.07), and net income per share and diluted net income per share increased ¥0.94 ($0.01) and ¥0.84 ($0.01) respectively.
In the fi scal year ended March 31, 2014, as previously described in Changes in Accounting Principles, YMFG adopted the “Accounting Standard for Retirement Benefi ts” and in accordance with the transitional treatment stipulated in Paragraph 37 of the Accounting Standard for Retirement Benefi ts.
As a result, net assets per share decreased ¥13.69 in the fi scal year ended March 31, 2014.
30. SUBSEQUENT EVENTS
There were no signifi cant subsequent events. Dividends
were made in June 2015 and 2014. Please refer to “21.
NET ASSETS.”
31. BUSINESS COMBINATIONS
Business combinations due to acquisition
1. Overview of business combination
(1) Name and business of acquired company
Name of acquired company YM Lease Co., Ltd.
Business Leasing
(2) Principal reasons for business combination
YM Lease Co., Ltd. has been operating as a leasing
company, and the business combination was executed to
further enhance the fi nancial services of the fi nancial group
including three banks; Yamaguchi Bank, Momiji Bank and
Kitakyushu Bank
(3) Date of corporate combination
December 5, 2014

53 YMFG Annual Report 2015
(4) Legal form of the business combination
YM Lease Co., Ltd. became a subsidiary of the Group
through the acquisition of shares in YM Lease Co., Ltd.
(5) Company name following the combination
The company’s name remains unchanged following the
combination.
(6) Percentage of voting rights acquired
Percentage of voting rights immediately prior to acquisition
21.1% (Note)
Percentage of voting rights acquired on the date of the
business combination 28.9%
Total percentage of voting rights following the acquisition
50.0% (Note) This fi gure includes shares owned by YMFG subsidiaries The Yamaguchi Bank Co., Ltd.,
and Yamagin Card Co., Ltd.
(7) Key factors leading to the corporate acquisition decision
Owning 40% or more of the shares in YM Lease Co., Ltd.,
enables YMFG to convert the company to a subsidiary on
the basis of a controlling interest.
2. Period for which acquired company’s operating
performance is included in the consolidated statements
of income for the period under review
April 1, 2014 to March 31, 2015
As the acquisition date is deemed to have been December
31, 2014, income of the acquired company for the period
from April 1, 2014, through December 31, 2014, is
recorded as equity method investment income.
3. Acquisition cost for the acquired company and its breakdown
Fair value of common stock in
YM Lease Co., Ltd., owned
immediately prior to the
business combination ¥104 million ($866 thousand)
Fair value of additional common
stock in YM Lease Co., Ltd.,
acquired on the date of the
business combination ¥94 million ($782 thousand)
Acquisition cost ¥198 million ($1,648 thousand)
4. Difference between the acquisition cost of the acquired
company and total acquisition cost for individual
transactions leading up to the transaction Loss related to
staged acquisition ¥200 million ($1,664 thousand)
5. Negative goodwill generated and reason for generation
(1) Amount of negative goodwill generated
¥2,331 million ($19,398 thousand)
(2) Reason for generation
The fair value of net assets exceeded the acquisition cost at
the time of acquisition.
6. Amount and general breakdown of assets acquired
and obligations assumed on the date of the corporate
combination
(1) Assets
Current assets ¥21,692 million ($180,511 thousand)
Noncurrent assets ¥644 million ($5,359 thousand)
Total assets ¥22,336 million ($185,870 thousand)
(2) Liabilities
Current liabilities ¥5,968 million ($49,663 thousand)
Long-term liabilities ¥12,591 million ($104,777 thousand)
Total liabilities ¥18,559 million ($154,440 thousand)
7. Impact on the consolidated statements of income for
the fi scal year under review based on the assumption
that the corporate combination was concluded on the
starting day of the fi scal year under review
This information has been omitted, as its impact is negligible.


