36 consolidated balance sheets consolidated statements of ... · 36 consolidated balance sheets 38...
TRANSCRIPT
35
Financial Section – 1/31
36 Consolidated Balance Sheets
38 Consolidated Statements of Income
39 Consolidated Statements of Comprehensive Income
40 Consolidated Statements of Changes in Net Assets
41 Consolidated Statements of Cash Flows
42 Notes to Consolidated Financial Statements
65 Independent Auditors’ Report

36
Financial Section – 2/31
Consolidated Balance SheetsNabtesco Corporation and Consolidated SubsidiariesMarch 31, 2012 and 2011
(Millions of yen)(Thousands of U.S. dollars)
(Note 1)
2012 2011 2012Assets Current assets: Cash and time deposits (Note 5) ¥ 15,505 ¥ 41,705 $ 188,648 Trade notes and accounts receivable 47,539 40,895 578,404 Less allowance for doubtful receivables (173) (71) (2,105) Short-term investment securities (Note 7) 34,999 15,000 425,830 Inventories (Note 8) 20,111 17,017 244,689 Deferred tax assets (Note 11) 2,910 3,289 35,406 Other current assets 3,038 1,168 36,964 Total current assets 123,929 119,003 1,507,836
Property, plant and equipment (Note 10) Land 14,412 14,341 175,350 Buildings and structures 43,069 41,359 524,018 Machinery and equipment 75,562 65,316 919,358 Construction in progress 1,095 497 13,322 Sub-total 134,138 121,513 1,632,048 Less accumulated depreciation (82,629) (77,071) (1,005,342) Property, plant and equipment, net 51,509 44,442 626,706
Investments and other assets Investments in affiliates 10,063 8,844 122,436 Other securities (Note 7) 4,868 5,705 59,229 Deferred tax assets (Note 11) 388 404 4,721 Goodwill (Note 24) 14,571 — 177,284 Other intangible assets (Note 10) 1,267 1,073 15,416 Other assets 1,640 1,426 19,953 Less allowance for doubtful receivables (142) (168) (1,728) Total investments and other assets 32,655 17,284 397,311Total assets ¥208,093 ¥180,729 $2,531,853
See accompanying notes to consolidated fi nancial statements.

37
Financial Section – 3/31
(Millions of yen)(Thousands of U.S. dollars)
(Note1)
2012 2011 2012Liabilities and Net assetsCurrent liabilities: Short-term loans payable (Note 9) ¥ 11,413 ¥ 9,158 $ 138,861 Current portion of bonds payable (Note 9) — 11,000 — Notes and accounts payable — Trade 34,602 33,591 421,000 Other 9,127 5,123 111,048 Accrued employees’ bonuses 3,476 3,269 42,292 Accrued expenses 2,063 1,746 25,100 Income taxes payable (Note 11) 4,471 7,094 54,398 Provision for product warranties 1,542 1,848 18,761 Provision for loss on order received 80 — 973 Deferred tax liabilities (Note 11) 510 — 6,205 Other current liabilities 3,613 2,063 43,961 Total current liabilities 70,897 74,892 862,599
Long-term liabilities: Bonds payable (Note 9) 10,000 — 121,669 Long-term loans payable 10,282 — 125,100 Accrued severance and retirement benefits: Employees (Note 14) 7,336 7,550 89,257 Directors and corporate statutory auditors 171 134 2,081 Provision for environmental measures — 321 — Deferred tax liabilities (Note 11) 916 656 11,145 Other long-term liabilities 1,024 645 12,459 Total long-term liabilities 29,729 9,306 361,711
Net assets (Note 12) Common stock: Authorized: 400,000,000 shares, Issued: 127,212,607 shares 10,000 10,000 121,669 Capital surplus 17,446 17,448 212,264 Retained earnings 74,816 64,263 910,281 Treasury stock, at cost: 837,579 shares in 2012, 783,586 shares in 2011 (754) (645) (9,174) Total shareholders’ equity 101,508 91,066 1,235,040
Accumulated other comprehensive income Net unrealized holding gains on securities 1,023 1,513 12,447 Net unrealized holding gains on derivative instruments 0 (1) 0 Foreign currency translation adjustments (3,438) (2,337) (41,830) Total accumulated other comprehensive income (2,415) (825) (29,383)
Subscription rights to shares 209 160 2,543 Minority interests 8,165 6,130 99,343 Total net assets 107,467 96,531 1,307,543Total liabilities and net assets ¥208,093 ¥180,729 $2,531,853

38
Financial Section – 4/31
(Millions of yen)(Thousands of U.S. dollars)
(Note 1)
2012 2011 2012Net sales (Note 23) ¥198,527 ¥169,304 $2,415,464Cost of sales (Notes 15 and 23) 148,184 127,712 1,802,944 Gross profit 50,343 41,592 612,520
Selling, general and administrative expenses (Notes 15 and 23) 27,484 21,380 334,396 Operating income 22,859 20,212 278,124
Other income (expenses):
Interest and dividend income 177 167 2,154 Interest expense (202) (94) (2,458) Foreign exchange loss, net (39) (491) (475) Equity in earnings of affiliates 1,787 2,218 21,742 Gain on sales of property, plant and equipment 170 80 2,068 Loss on disposal of property, plant and equipment (201) (197) (2,445) Provision for environmental measures — (65) — Loss on adjustment for changes of accounting standard
for asset retirement obligations — (27) — Compensation payment (Note 17) — (221) — Gain on transfer of business 60 — 730 Gain on revision of retirement benefit plan (Note 14) 50 — 608 Compensation income 132 — 1,606 Other, net 55 372 670 Total 1,989 1,742 24,200
Income before income taxes and minority interests 24,848 21,954 302,324
Income taxes (Note 11):
Current 7,808 8,312 94,999 Deferred 1,066 (827) 12,970
8,874 7,485 107,969Income before minority interests 15,974 14,469 194,355Minority interests (1,217) (1,081) (14,808)Net income ¥ 14,757 ¥ 13,388 $ 179,547
(Yen)(U.S. dollars)
(Note 1)
2012 2011 2012Amounts per share of common stock:
Basic net income ¥116.74 ¥105.91 $1.42 Diluted net income 116.61 105.80 1.42 Net assets 784.12 713.77 9.54 Cash dividends applicable to the year 34.00 25.00 0.41
See accompanying notes to consolidated fi nancial statements.
Consolidated Statements of IncomeNabtesco Corporation and Consolidated SubsidiariesYears ended March 31, 2012 and 2011

39
Financial Section – 5/31
(Millions of yen)(Thousands of U.S. dollars)
(Note 1)
2012 2011 2012Income before minority interests ¥15,974 ¥14,469 $194,355Other comprehensive income:
Valuation difference on other securities (494) 216 (6,011) Deferred gains or losses on hedges 0 1 0 Foreign currency translation adjustments (1,087) (1,208) (13,226) Share of other comprehensive income of associates accounted
for using equity method (38) (80) (462)Total other comprehensive income (1,619) (1,071) (19,699)Comprehensive income ¥14,355 ¥13,398 $174,656
Comprehensive income attributable to:
Owners of the parent ¥13,167 ¥12,593 $160,202 Minority interests 1,188 805 14,454
See accompanying notes to consolidated fi nancial statements.
Consolidated Statements of Comprehensive IncomeNabtesco Corporation and Consolidated SubsidiariesYears ended March 31, 2012 and 2011

40
Financial Section – 6/31
(Millions of yen)
Number of shares of
common stockCommon
stockCapital surplus
Retained earnings
Treasury stock
Total shareholders’
equity
Net unrealized
holding gains on securities
Net unrealized
holding gains on
derivative instruments
Foreign currency
translation adjustments
Total accumulated
other comprehensive
income
Subscription rights
to sharesMinority interests
Total net assets
Balance at April 1 , 2010 127,212,607 ¥ 10,000 ¥ 17,468 ¥ 52,662 ¥ (695) ¥ 79,435 ¥ 1,291 ¥ (2) ¥ (1,320) ¥ (31) ¥ 74 ¥ 5,690 ¥ 85,168
Cash dividends — — — (1,779) — (1,779) — — — — — — (1,779)
Net income — — — 13,388 — 13,388 — — — — — — 13,388
Disposal of treasury stock — — — — (31) (31) — — — — — — (31)
Purchase of treasury stock — — (20) — 81 61 — — — — — — 61
Staff and workers bonuses and welfare fund — — — (8) — (8) — — — — — — (8)
Net changes of items other than shareholders’ equity — — — — — — 222 1 (1,017) (794) 86 440 (268)
Balance at April 1, 2011 127,212,607 ¥ 10,000 ¥ 17,448 ¥ 64,263 ¥ (645) ¥ 91,066 ¥ 1,513 ¥ (1) ¥ (2,337) ¥ (825) ¥ 160 ¥ 6,130 ¥ 96,531
Cash dividends — — — (4,195) — (4,195) — — — — — — (4,195)
Net income — — — 14,757 — 14,757 — — — — — — 14,757
Disposal of treasury stock — — — — (165) (165) — — — — — — (165)
Purchase of treasury stock — — (2) — 56 54 — — — — — — 54
Staff and workers bonuses and welfare fund — — — (9) — (9) — — — — — — (9)
Net changes of items other than shareholders’ equity — — — — — — (490) 1 (1,101) (1,590) 49 2,035 494
Balance at March 31, 2012 127,212,607 ¥10,000 ¥17,446 ¥74,816 ¥(754) ¥101,508 ¥1,023 ¥(0) ¥(3,438) ¥(2,415) ¥209 ¥8,165 ¥107,467
(Thousands of U.S. dollars) (Note 1)
Common stock
Capital surplus
Retained earnings
Treasury stock
Total shareholders’
equity
Net unrealized
holding gains on securities
Net unrealized
holding gains on
derivative instruments
Foreign currency
translation adjustments
Total accumulated
other comprehensive
income
Subscription rights
to sharesMinority interests
Total net assets
Balance at April 1, 2011 $121,669 $212,289 $781,883 $(7,848) $1,107,993 $18,409 $(12) $(28,435) $(10,038) $1,947 $74,583 $1,174,485
Cash dividends — — (51,040) — (51,040) — — — — — — (51,040)
Net income — — 179,547 — 179,547 — — — — — — 179,547
Disposal of treasury stock — — — (2,008) (2,008) — — — — — — (2,008)
Purchase of treasury stock — (25) — 682 657 — — — — — — 657
Staff and workers bonuses and welfare fund — — (109) — (109) — — — — — — (109)
Net changes of items other than shareholders’ equity — — — — — (5,962) 12 (13,395) (19,345) 596 24,760 6,011
Balance at March 31, 2012 $121,669 $212,264 $910,281 $(9,174) $1,235,040 $12,447 $ (0) $(41,830) $(29,383) $2,543 $99,343 $1,307,543
See accompanying notes to consolidated fi nancial statements.
Consolidated Statements of Changes in Net AssetsNabtesco Corporation and Consolidated SubsidiariesYears ended March 31, 2012 and 2011
41
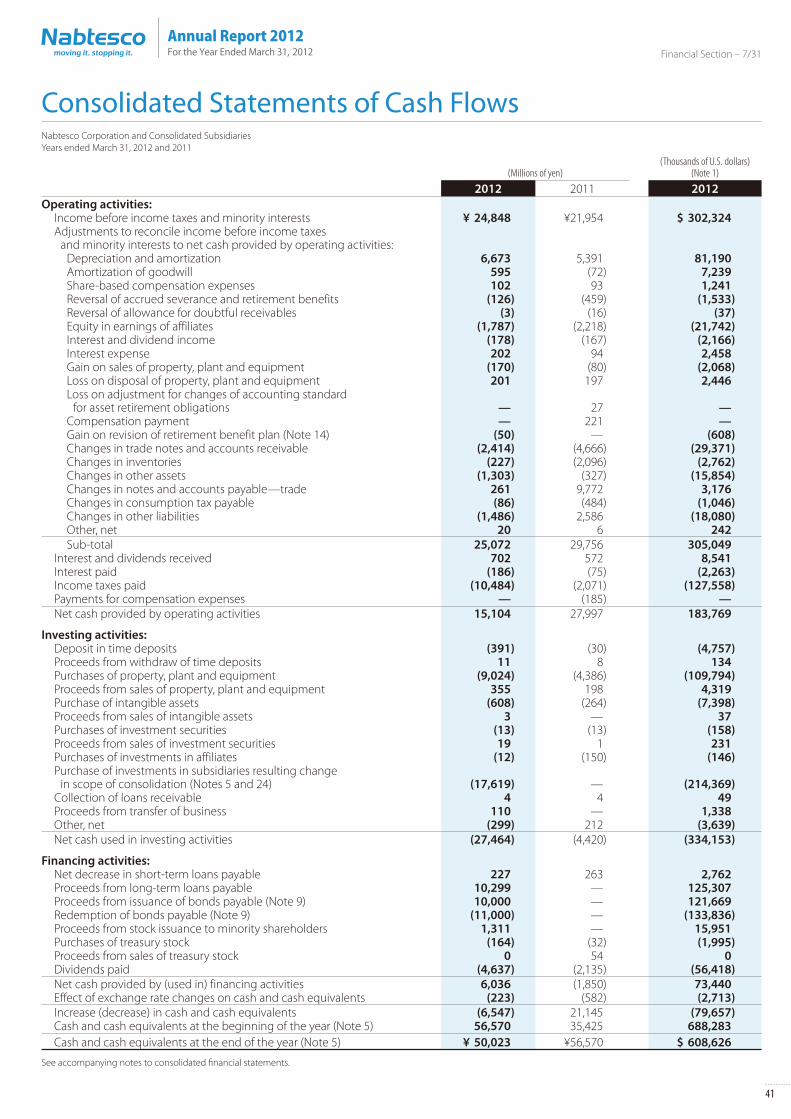
Financial Section – 7/31
(Millions of yen)(Thousands of U.S. dollars)
(Note 1)
2012 2011 2012Operating activities: Income before income taxes and minority interests ¥ 24,848 ¥21,954 $ 302,324 Adjustments to reconcile income before income taxes
and minority interests to net cash provided by operating activities: Depreciation and amortization 6,673 5,391 81,190 Amortization of goodwill 595 (72) 7,239 Share-based compensation expenses 102 93 1,241 Reversal of accrued severance and retirement benefits (126) (459) (1,533) Reversal of allowance for doubtful receivables (3) (16) (37) Equity in earnings of affiliates (1,787) (2,218) (21,742) Interest and dividend income (178) (167) (2,166) Interest expense 202 94 2,458 Gain on sales of property, plant and equipment (170) (80) (2,068) Loss on disposal of property, plant and equipment 201 197 2,446 Loss on adjustment for changes of accounting standard
for asset retirement obligations — 27 — Compensation payment — 221 — Gain on revision of retirement benefit plan (Note 14) (50) — (608) Changes in trade notes and accounts receivable (2,414) (4,666) (29,371) Changes in inventories (227) (2,096) (2,762) Changes in other assets (1,303) (327) (15,854) Changes in notes and accounts payable—trade 261 9,772 3,176 Changes in consumption tax payable (86) (484) (1,046) Changes in other liabilities (1,486) 2,586 (18,080) Other, net 20 6 242 Sub-total 25,072 29,756 305,049 Interest and dividends received 702 572 8,541 Interest paid (186) (75) (2,263) Income taxes paid (10,484) (2,071) (127,558) Payments for compensation expenses — (185) — Net cash provided by operating activities 15,104 27,997 183,769
Investing activities: Deposit in time deposits (391) (30) (4,757) Proceeds from withdraw of time deposits 11 8 134 Purchases of property, plant and equipment (9,024) (4,386) (109,794) Proceeds from sales of property, plant and equipment 355 198 4,319 Purchase of intangible assets (608) (264) (7,398) Proceeds from sales of intangible assets 3 — 37 Purchases of investment securities (13) (13) (158) Proceeds from sales of investment securities 19 1 231 Purchases of investments in affiliates (12) (150) (146) Purchase of investments in subsidiaries resulting change
in scope of consolidation (Notes 5 and 24) (17,619) — (214,369) Collection of loans receivable 4 4 49 Proceeds from transfer of business 110 — 1,338 Other, net (299) 212 (3,639) Net cash used in investing activities (27,464) (4,420) (334,153)
Financing activities: Net decrease in short-term loans payable 227 263 2,762 Proceeds from long-term loans payable 10,299 — 125,307 Proceeds from issuance of bonds payable (Note 9) 10,000 — 121,669 Redemption of bonds payable (Note 9) (11,000) — (133,836) Proceeds from stock issuance to minority shareholders 1,311 — 15,951 Purchases of treasury stock (164) (32) (1,995) Proceeds from sales of treasury stock 0 54 0 Dividends paid (4,637) (2,135) (56,418) Net cash provided by (used in) financing activities 6,036 (1,850) 73,440 Effect of exchange rate changes on cash and cash equivalents (223) (582) (2,713) Increase (decrease) in cash and cash equivalents (6,547) 21,145 (79,657) Cash and cash equivalents at the beginning of the year (Note 5) 56,570 35,425 688,283 Cash and cash equivalents at the end of the year (Note 5) ¥ 50,023 ¥56,570 $ 608,626
See accompanying notes to consolidated fi nancial statements.
Consolidated Statements of Cash FlowsNabtesco Corporation and Consolidated SubsidiariesYears ended March 31, 2012 and 2011
42
Financial Section – 8/31
1 Description of Business and Basis of Presenting Consolidated Financial Statements
(1) Description of businessNabtesco Corporation (the “Company”), a Japanese corporation, was established as a holding company on September 29, 2003, through a stock transfer process, by TS Corporation (formerly Teijin Seiki Co., Ltd.) and NABCO Ltd. As a result of the stock transfer, both TS Corporation and NABCO Ltd. became wholly owned subsidiaries of the Company. The Company completed its business integration through the acquisition of the two wholly owned subsidiaries on October 1, 2004. The main products of the Company and its consolidated subsidiaries (the “Companies”) include precision equipment, transport equipment, aircraft and oil hydraulic equipment, and industrial equipment.
(2) Basis of presenting consolidated financial statementsThe accompanying consolidated financial statements have been prepared in accordance with the provisions set forth in the Japa-nese Financial Instruments and Exchange Law and its related accounting regulations, and in conformity with accounting principles generally accepted in Japan (“Japanese GAAP”), which are different in certain respects as to application and disclosure requirements of International Financial Reporting Standards. The accounts of consolidated overseas subsidiaries are based on their accounting records maintained in conformity with gener-ally accepted principles prevailing in the respective countries of domicile. The accounts of consolidated overseas subsidiaries are prepared in accordance with either International Financial Reporting Standard or U.S. generally accepted accounting principles, with adjustment for the specific five items as applicable. The accompanying consolidated financial statements have been restructured and translated into English from the consolidated financial statements of the Company prepared in accordance with Japanese GAAP and filed with the appropriate Local Finance Bureau of the Ministry of Finance as required by the Financial Instruments and Exchange Law. Certain supplementary information included in the statutory Japanese language consolidated financial statements, but not required for fair presentation, is not pre-sented in the accompanying consolidated financial statements. The translation of the Japanese yen amounts into U.S. dollars is included solely for the convenience of readers outside Japan, using the prevailing exchange rate at March 31, 2012, which is ¥82.19 to U.S.$1. The convenience translations should not be con-strued as representations that the Japanese yen amounts have been, could have been, or could in the future be, converted into U.S. dollars at this or any other rate of exchange.
2 Summary of Significant Accounting Policies
(1) Principles of consolidationThe consolidated financial statements include the accounts of the Company and its 41 subsidiaries. All significant inter-company transactions, account balances and unrealized profits are eliminated in consolidation. In the elimination of investments in subsidiaries, the assets and liabilities of the subsidiaries, including the portion attributable to minority shareholders, are evaluated using the fair value at the time the Company acquired control of the respective subsidiaries. The difference between the cost of investments in subsidiaries and the equity in their net assets at the date of acquisition is amortized over a period within twenty years on a straight-line basis. However, if the difference is insignificant, it is charged to income as incurred. Investments in 8 affiliated companies (generally 20% to 50% owned), over which the Company has the ability to exercise significant influence over operating and financial policy, are accounted for by the equity method.
Changes in accounting policyEffective from the fiscal year ended March 31, 2011, the Company and consolidated domestic subsidiaries adopted the Accounting Standard for Equity method of accounting for Investments (Accounting Standards Board of Japan Statement No. 16 issued on March 10, 2008). This change has no effect on the consolidated financial statements for the year ended March 31, 2011.
(2) Cash and cash equivalentsFor the purpose of the consolidated statements of cash flows, cash and cash equivalents consist of cash on hand, deposits with banks withdrawable on demand and short-term investments which are readily convertible to cash subject to an insignificant risk of changes in value and which are purchased with an original maturity of three months or less. See Note 5 as to reconciliation to cash and time deposits on the balance sheets.
(3) Allowance for doubtful receivablesThe allowance for doubtful receivables is provided in amounts management considers sufficient to cover possible losses on collec-tion. The allowance is based on past collection experience and management estimate of the collectability of individual receivables.
(4) Provision for environmental measuresThe provision is made to cover the cost for character change of the land in the former Company’s factory where soil contamination was found.
Notes to Consolidated Financial StatementsNabtesco Corporation and Consolidated SubsidiariesYears ended March 31, 2012 and 2011

43
Financial Section – 9/31
(5) Provision for loss on order receivedTo cover the future loss relating to order received the provision is recorded when the future loss is anticipated and the loss at the year end is reasonable estimated.
(6) SecuritiesThe Companies are required to examine the intent of holding each security and classify those securities as (a) securities held for trading purposes (hereafter, “trading securities”), (b) debt securities intended to be held to maturity, (c) equity securities issued by subsidiaries and affiliated companies, and (d) for all other securities that are not classified in any of the above categories (hereafter, “other securities”) The Companies have no trading securities at March 31, 2012 and 2011. Held-to-maturity debt securities are expected to be held to maturity and are recognized at amortized cost computed based on the straight-line method. Other securities with available fair market values are stated at fair market value. Unrealized gains and losses on these securities are reported, net of applicable income taxes, as a separate component of Net assets. Realized gains and losses on sale of such securities are computed using the moving-average cost method. Other securities with no available fair market value are stated at moving-average cost. If the market value of equity securities issued by unconsolidated subsidiaries and affiliated companies, and other securities declines significantly, such securities are written down to their fair market value and the difference between fair market value and the carrying amount is recognized as loss in the period of the decline. For equity securities with no available fair market value, if the net asset amount of the investee declines significantly, such securities are written down to the net asset amount with a corresponding charge in the income statement in the period of decline. In these cases, such fair market value or net asset amount will be the carrying amount of the securities at the beginning of the next year.
(7) InventoriesInventories of the Company and its consolidated domestic subsidiaries are stated at the lower of the cost or net realizable value, while inventories of its consolidated foreign subsidiaries are principally stated at the lower of cost or market. The evaluation methods for the cost of inventories are as follows:
Inventories Evaluation methodFinished goods and Work in process Mainly weighted average method
(however certain finished goods and work in process are determined by the specific identification method)
Raw materials and Supplies Mainly weighted average method(however certain raw materials and supplies are determined by moving average method)
(8) Property, plant and equipmentProperty, plant and equipment are stated at cost. The Company and its consolidated domestic subsidiaries calculate depreciation principally by the declining-balance method over the estimated useful lives of the respective assets, except for the buildings ac-quired on or after April 1, 1998, and owned by the Company, which are depreciated by the straight-line method over the estimated useful lives of the respective assets. In addition, the Company and its consolidated domestic subsidiaries depreciate Machinery and equipment, whose acquisition cost is ¥100 thousand or more but less than ¥200 thousand, over a period of three years on a straight-line basis. The consolidated foreign subsidiaries calculate depreciation principally by the straight-line method over the estimated useful lives of the respective assets. Depreciation of assets acquired by the domestic companies after March 31, 2007 is computed principally by the straight-line method under the amended tax code for building, not including building fixtures and by the declining-balance method under the amended tax code for the remaining assets.
(9) Leases assetsProperty, plant and equipment capitalized under finance lease arrangements are depreciated over the lease term of the respective assets. Finance leases which do not transfer ownership of the leased property to the lessee commenced prior to April 1, 2008 and have been accounted for as operating leases, continue to be accounted for as operating leases with disclosure of certain “as if capitalized” information.
(10) Derivative financial instruments and hedging transactions The Companies use derivative financial instruments only for the purpose of mitigating fluctuation risk of interest rates with respect to loans payable and future risk of fluctuation of foreign currency exchange rates with respect to foreign currency receivables and payables. The basic policies for executing the derivative transactions are managed by the Board of Directors of the Company. Based on such policies, the finance departments of each company establish the internal regulations which prescribe the specified limits and procedures on the derivative transactions. After execution, each finance department has to report certain information on derivative transactions to the Board of Directors of the Company.
44
Financial Section – 10/31
The following summarizes hedging derivative financial instruments used by the Companies and items hedged:Hedging instruments Hedged items
Interest rate swap contracts Loans payableForward foreign exchange contracts Foreign currency trade receivables and trade payables
The Companies evaluate hedge effectiveness by comparing the cumulative changes in cash flows from or the changes in fair value of hedged items and the corresponding changes in fair value of the hedging derivative instruments. The Companies are required to state derivative financial instruments at fair value and to recognize changes in the fair value as gains or losses unless derivative financial instruments meet the criteria for hedging accounting. If derivative financial instruments are used as hedges and meet certain hedging criteria, the Companies defer recognition of gains or losses resulting from changes in fair value of derivative financial instruments until the related losses or gains on the hedged items are recognized. If interest rate swap contracts are used as hedges and meet certain hedging criteria, the net amount to be paid or received under the interest rate swap contract is added to or deducted from the interest on the assets or liabilities for which the swap contract is executed. If forward foreign exchange contracts are used as hedges and meet certain hedging criteria, hedging instruments and hedged items are accounted for in the following manner:1. When a forward foreign exchange contract is executed to hedge an existing foreign currency receivable or payable, (a) the difference, if any, between the Japanese yen amount of the hedged foreign currency receivable or payable translated
using the spot rate at the inception date of the contract and the book value of the receivable or payable is recognized in the income statement in the period which includes the inception date, and
(b) the discount or premium on the contract (that is, the difference between the Japanese yen amount of the contract translated using the contracted forward rate and that translated using the spot rate at the inception date of the contract) is recognized over the term of the contract
2. When a forward foreign exchange contract is executed to hedge a future transaction denominated in a foreign currency, the future transaction will be recorded using the contracted forward rate, and no gains or losses on the forward foreign exchange contract or the forward foreign currency options are recognized.
(11) AmortizationGoodwill is amortized using straight-line method over a period within twenty year. However, if the amount is insignificant, it is charged to income as incurred. Software is amortized using the straight-line method over the estimated useful lives (five years).
(12) Research and development costsResearch and development costs are charged to income as incurred.
(13) Income taxesThe Companies recognize tax effects of timing differences between the carrying amounts of assets and liabilities for financial reporting purposes and the amounts for tax reporting purpose. Income taxes comprise of corporation tax, enterprise tax and prefectural and municipal inhabitants taxes.
(14) Accrued employees’ bonusesAccrued employees’ bonuses are accounted for at the amount of estimated bonuses to be paid and allocated to the current fiscal year.
(15) Provision for product warrantiesProvision for product warranties is provided to cover the estimated cost for customers’ claims relating to after sales repairs.
(16) Translation of foreign currenciesMonetary assets and liabilities denominated in foreign currencies are translated into Japanese yen at the year-end rates. Financial statements of consolidated foreign subsidiaries are translated into Japanese yen at the year-end rates, except that share-holders’ equity are translated at historical rates and income statement items resulting from transactions with the Company are translated at the rates used by the Company when the transactions occurred. The Company and its domestic subsidiaries report foreign currency translation adjustments in net assets.
(17) Appropriation of retained earningsUnder the Japanese Corporate law, the appropriation of retained earnings with respect to a given financial period is made by a resolution of the shareholders at a general meeting held subsequent to the close of such financial period. The accounts for that period do not, therefore, reflect such appropriations. (See Note 26)

45
Financial Section – 11/31
(18) Retirement benefitsThe Company and certain of its consolidated subsidiaries provide two types of retirement and severance benefit plans, unfunded lump-sum payment plans and funded non-contributory pension plans, under which all eligible employees are entitled to benefits based on the level of wages and salaries at the time of retirement or termination, length of service and certain other factors. The Companies provide allowance for employees’ severance and retirement benefits at the end of year based on estimated amounts of projected benefit obligations, actuarially calculated using certain assumptions and the fair value of the plan assets at the date. Prior service costs are recognized as expense when incurred, and actuarial gains and losses are recognized as expense from the following fiscal year using the declining-balance method over a certain period (10 years) not exceeding the average of estimated remaining service period.
(19) Amounts per shareThe computation of basic net income per share is calculated based on the weighted average number of shares of common stock outstanding during the year. Diluted net income per share is calculated based on the weighted average number of shares of common stock after consider-ation of dilution that securities or other contracts to issue common stock are exercised or converted into common stock, or resulted into issuance of common stock. Amounts per share of net assets are calculated based on the number of shares of common stock outstanding at the year-end. Cash dividends per share include interim dividends of the Company proposed by the Board of Directors in addition to year-end dividends approved by shareholders at the annual meeting held subsequent to the end of fiscal year.
(20) Recognition of significant revenues and expensesAccounting for construction of completionsWhen the construction work is in progress at year end and the progress rate of construction work up to that time is deemed certain, the percentage-of-completion method is applied. The progress rate is estimated using cost-to-cost method. When the above condition is not met, the completed-contract method is applied.
3 Changes in Accounting Policy
(1) New accounting standard for asset retirement obligationsEffective April 1, 2010, the Company and its consolidated domestic subsidiaries adopted “Accounting Standards for Asset Retire-ment Obligations” (Accounting Standards Board of Japan (“ASBJ”) Statement No. 18 issued on March 31, 2008) and “Guidance on Accounting Standards for Assets Retirement Obligations” (ASBJ Guidance No. 21, issued on March 31, 2008). As a result of adopting these standards, operating income decreased by ¥18 million ($216 thousand), income before income taxes decreased by ¥45 million ($541 thousand) for the fiscal year ended March 31, 2011, respectively.
(2) New accounting standard for business combinationsEffective April 1, 2010, the Company and its consolidated domestic subsidiaries adopted “Accounting Standards for Business Combinations” (Accounting Standards Board of Japan (“ASBJ”) Statement No. 21 issued on December 26, 2008), “Revised Accounting Standard for Business Divestitures” (ASBJ Guidance No. 7, issued on December 26, 2008) and “Revised Guidance on Accounting Standard for Business Divestitures” (ASBJ Guidance No. 10, issued on December 26, 2008).
(3) New accounting standard for earnings per shareEffective April 1, 2011, the Company and its consolidated domestic subsidiaries adopted “Accounting Standards for Earnings per share” (Accounting Standards Board of Japan (“ASBJ”) Statement No. 2 issued on June 30, 2010) and “Guidance on Accounting Standards for Earnings per share” (ASBJ Guidance No. 4, revised on June 30, 2010) and “Practical Solution on Accounting for Earnings Per Share” (ASBJ PITF No. 9, revised on June 30, 2010). The effect on net income per share is insignificant.
4 Additional Information
New accounting standard for accounting changes and error correctionsEffective April 1, 2011, the Company and its consolidated domestic subsidiaries adopted “Accounting Standard for Accounting Changes and Error Corrections” (Accounting Standard Board of Japan (“ASBJ”) Statement No. 24 issued on December 4, 2009) and “Guidance on the Accounting Standard for Accounting Changes and Error Corrections” (ASBJ Guidance No. 24, issued on December 4, 2009) for accounting changes and corrections of prior period errors which are made from the fiscal year beginning on April 1,2011.

46
Financial Section – 12/31
5 Cash and Cash Equivalents
(1) A reconciliation of cash and cash equivalents to the amounts shown in the consolidated balance sheetsReconciliation of cash and time deposits shown in the consolidated balance sheets and cash and cash equivalents shown in the consolidated statements of cash flows as of March 31, 2012 and 2011 is as follows:
(Millions of yen) (Thousands of U.S. dollars)2012 2011 2012
Cash and time deposits ¥15,505 ¥41,705 $188,648Time deposits with maturities extending over three months (481) (135) (5,852)Short-term investment securities 34,999 15,000 425,830 Cash and cash equivalents ¥50,023 ¥56,570 $608,626
(2) Summary of assets and liabilities received as a result of business combination
Gilgen Door Systems AG (April 1, 2012)(Millions of yen) (Thousands of U.S. dollars)
2012 2012Current assets ¥ 7,470 $ 90,887Fixed assets 1,802 21,925Goodwill 15,707 191,106Current liabilities (6,614) (80,472)Long-term liabilities (271) (3,297)Foreign currency translation adjustments (95) (1,156)Acquisition cost 17,999 218,993Cash and cash equivalents (380) (4,624)Purchase of Gilgen Door Systems AG (Net) ¥17,619 $214,369
6 Financial Instruments
(1) Qualitative information on financial instruments� Policies for using financial instruments The Company raises fund that required under its business primarily from loans payable and bond issues. And the Company man-ages surplus capital using financial instruments that carry little or no risk. The Company uses derivatives to mitigate the risk that are described below, and as a matter of policy does not use derivatives for speculative transactions.
� Details of financial instruments used and the exposures to risk and how they arise Trade notes and accounts receivable are exposed to customer credit risk. In addition, the Company is exposed to foreign currency exchange risk arising from receivables denominated in foreign currencies. The Company use a derivative transaction including forward foreign exchange contracts to hedge the risk of exchange fluctuations associated with receivables denominated in foreign currencies. Short-term investment securities and other securities are mainly consist of held-to-maturity debt securities and securi-ties for strengthening of the relationship with counterparty and exposed to market price risk. Loans payable and bond are taken out principally for the purpose of making capital investments. The repayment dates of long term loans payable extend up to two years beyond the date of the closing of accounts. The Company employs foreign exchange forward contracts to reduce the risk of foreign exchange rate fluctuation that arise from receivables and payables denominated in foreign currencies.
� Policies and processes for managing the risk (a) Credit risk management (counterparty risk) The Company has prepared regulations for managing its credit exposure and business receivables. The Company manages
amounts and settlement dates by counterparty and works to quickly identify and mitigate payment risk that may result from situations including deterioration of the financial condition of counterparties. Consolidated subsidiaries are subject to the same risk management rules.
Held-to-maturity debts securities carry little credit risk because are intended highly-rated company under the regulation of fund management.
The Company transact only with highly credit financial institution under the regulation of risk management when using derivatives.

47
Financial Section – 13/31
(b) Market risk management The Company and some consolidated subsidiaries use a derivative transaction including forward foreign exchange contract
to hedge the risk of exchange fluctuations associated with receivables denominated in foreign currencies. For short-term investments and investments in securities, the Company examines fair value and the financial condition of
the issuing entity. In addition, for all securities other than those classified as held-to-maturity debt securities the Company regularly revises its portfolio based on its relationships with issuing entities.
For derivative transactions, the basic policies for executing the derivative transactions are managed by the Board of Directors of the Company. Based on such policies, the finance departments of each company establish the internal regula-tions which prescribe the specified limits and procedures on the derivative transactions. After execution, each finance department has to report certain information on derivative transactions to the Board of Directors of the Company.
(c) Liquidity risk management The financial and Accounting Department manages liquidity risk for the company by making and updating a capital deploy-
ment plan based on reports from each division. In addition, the Company manages liquidity risk by keeping high leveled liquidity on hand due to the unstable financial market.
� Supplemental information on fair values The fair value of financial instruments is based on market prices, or a reasonable estimate of fair value for instruments for which
market prices are not available. Estimates of fair value are subject to fluctuation because they employ variable factors and as-sumption. In addition, the contractual amounts of the derivatives transactions discussed in “Derivative Financial Instruments” below are not an indicator of the market risk associated with derivatives transactions.
(2) Fair value of financial instrumentFair value and difference compared to the book value reported in the balance sheets as of March 31, 2012 and 2011 are as follows. Please note that for those items of which obtaining an estimates fair value is deemed to be extremely difficult, such differences are not shown (Please refer to Note 2).
(Millions of yen)2012
Book value reported in
the balance sheet Fair value Difference(1) Cash and time deposits ¥15,505 ¥15,505 ¥ —(2) Trade notes and accounts receivable 47,539 47,539 —(3) Short-term and long-term investment securities � Held-to-maturity debt securities 34,999 34,999 — � Other securities 4,745 4,745 — � Securities issued by affiliates companies 3,441 12,733 9,292 Assets 106,229 115,521 9,292 (1) Trade notes and accounts payable 34,602 34,602 —(2) Short-term loans payable 11,413 11,413 —(3) Bonds payable 10,000 10,029 29 (4) Long-term loans payable 10,282 10,289 7 Liabilities 66,297 66,333 36 Derivatives (3) (3) —
(Millions of yen)2011
Book value reported in
the balance sheet Fair value Difference(1) Cash and time deposits ¥ 41,705 ¥ 41,705 ¥ —(2) Trade notes and accounts receivable 40,895 40,895 —(3) Short-term and long-term investment securities � Held-to-maturity debt securities 15,000 15,000 — � Other securities 5,557 5,557 — � Securities issued by affiliates companies 3,158 13,007 9,849 Assets 106,315 116,164 9,849(1) Trade notes and accounts payable 33,591 33,591 —(2) Short-term loans payable 9,158 9,158 —(3) Current portion of bonds 11,000 12,531 1,531 Liabilities 53,749 55,280 1,531Derivatives (1) (1) —

48
Financial Section – 14/31
(Thousands of U.S. dollars)2012
Book value reported in
the balance sheet Fair value Difference(1) Cash and time deposits $ 188,648 $ 188,648 $ —(2) Trade notes and accounts receivable 578,404 578,404 —(3) Short-term and long-term investment securities � Held-to-maturity debt securities 425,830 425,830 — � Other securities 57,732 57,732 — � Securities issued by affiliates companies 41,866 154,922 113,056 Assets 1,292,480 1,405,536 113,056(1) Trade notes and accounts payable 421,000 421,000 —(2) Short-term loans payable 138,861 138,861 —(3) Bonds payable 121,669 122,022 353(4) Long-term loans payable 125,100 125,186 86 Liabilities 806,630 807,069 439Derivatives (37) (37) —
Note: The value of assets and liabilities arising from derivatives is shown at net value.
Note 1: Methods for computing the estimated fair value of financial instruments and securities and derivative transactionsAssets(1) Cash and time deposits and (2) Trade notes and account receivable Since these items are settled in a short period of time and have estimated values that are virtually the same as book value,
the book value is used.(3) Short-term and long term investment securities Stocks are valued at the exchange trading price. Bonds are valued at the exchange trading price or at the price provided by
the financial institutions. For information on securities classified as purpose of holding, please refer to the “Securities” section of the notes to the financial statement.
Liabilities(1) Trade notes and accounts payable and (2) Short-term loans payable Since these items are settled in a short period of time and have estimated fair values that are virtually the same as the book
value, the book value is used.(3) Long-term loans payable Long-term loans payable is valued at the exchange trading price or at the price provided by the financial institutions.
DerivativesPlease refer to the “Derivatives” section of the notes to the financial statement.
Note 2: Items for which obtaining an estimated fair value is deemed to be extremely difficult(Millions of yen) (Thousands of U.S. dollars)
2012 2011 2012Items Book value Book value Book value
Unlisted stocks ¥ 123 ¥ 149 $ 1,497Securities issued by affiliate companies 6,622 5,685 80,569
These are recognized as extremely difficult to obtain fair value because these do not have any market price and it is impossible to estimate future cash flow. Therefore, their fair value is not disclosed.

49
Financial Section – 15/31
Note 3: Scheduled redemption of monetary claims and short-term and long-term investment securities at March 31, 2012 and 2011.(Millions of yen)
2012
Within 1 yearOver 1 year
but within 5 yearsOver 5 years
but within 10 years Over 10 years(1) Cash and time deposits ¥15,505 ¥— ¥— ¥ —(2) Trade notes and account receivables 47,539 — — —(3) Short-term and long-term investment securities � Held-to-maturity debt securities Certificate of deposit 20,000 — — — Commercial paper 14,999 — — — � Other securities with maturity — — — 100
(Millions of yen)2011
Within 1 yearOver 1 year
but within 5 yearsOver 5 years
but within 10 years Over 10 years(1) Cash and time deposits ¥41,705 ¥— ¥— ¥ —(2) Trade notes and account receivables 40,895 — — —(3) Short-term and long-term investment securities � Held-to-maturity debt securities Certificate of deposit 13,000 — — — Commercial paper 2,000 — — — � Other securities with maturity — — — 100
(Thousands of U.S. dollars)2012
Within 1 yearOver 1 year
but within 5 yearsOver 5 years
but within 10 years Over 10 years(1) Cash and time deposits $188,648 $— $— $ —(2) Trade notes and account receivables 578,404 — — —(3) Short-term and long-term investment securities � Held-to-maturity debt securities Certificate of deposit 243,338 — — — Commercial paper 182,492 — — — � Other securities with maturity — — — 1,217
Note 4: Maturities of bonds payable and long-term loans payable at March 31, 2012 and 2011.(Millions of yen)
2012
Within 1 yearOver 1 year
but within 2 yearsOver 2 year
but within 3 yearsOver 3 year
but within 4 yearsOver 4 year
but within 5 years Over 5 yearsBonds payable ¥— ¥— ¥ — ¥— ¥10,000 ¥—Long-term loans payable — — 10,000 — 282 — Total ¥— ¥— ¥10,000 ¥— ¥10,282 ¥—
(Millions of yen)2011
Within 1 yearOver 1 year
but within 2 yearsOver 2 year
but within 3 yearsOver 3 year
but within 4 yearsOver 4 year
but within 5 years Over 5 yearsBonds payable ¥11,000 ¥— ¥— ¥— ¥— ¥— Total ¥11,000 ¥— ¥— ¥— ¥— ¥—
(Thousands of U.S. dollars)2012
Within 1 yearOver 1 year
but within 2 yearsOver 2 year
but within 3 yearsOver 3 year
but within 4 yearsOver 4 year
but within 5 years Over 5 yearsBonds payable $— $— $ — $— $121,669 $—Long-term loans payable — — 121,669 — 3,431 — Total $— $— $121,669 $— $125,100 $—
50
Financial Section – 16/31
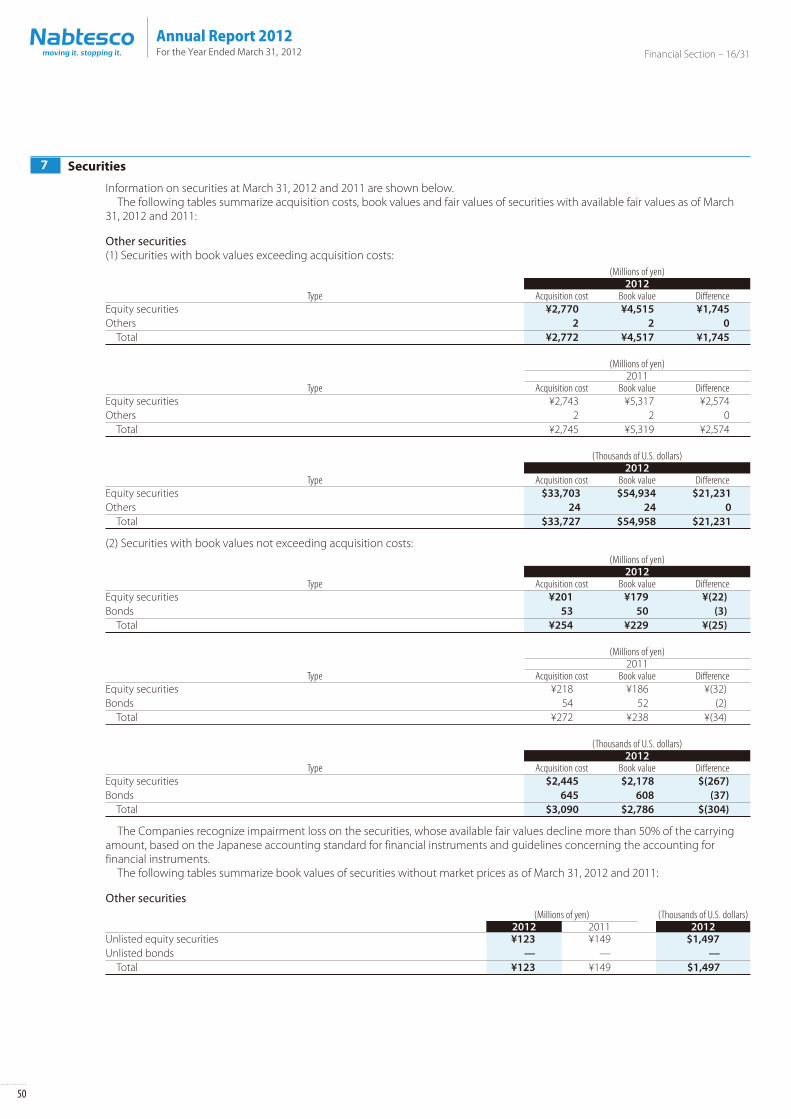
7 Securities
Information on securities at March 31, 2012 and 2011 are shown below. The following tables summarize acquisition costs, book values and fair values of securities with available fair values as of March 31, 2012 and 2011:
Other securities(1) Securities with book values exceeding acquisition costs:
(Millions of yen)2012
Type Acquisition cost Book value DifferenceEquity securities ¥2,770 ¥4,515 ¥1,745Others 2 2 0 Total ¥2,772 ¥4,517 ¥1,745
(Millions of yen)2011
Type Acquisition cost Book value DifferenceEquity securities ¥2,743 ¥5,317 ¥2,574Others 2 2 0 Total ¥2,745 ¥5,319 ¥2,574
(Thousands of U.S. dollars)2012
Type Acquisition cost Book value DifferenceEquity securities $33,703 $54,934 $21,231Others 24 24 0 Total $33,727 $54,958 $21,231
(2) Securities with book values not exceeding acquisition costs:(Millions of yen)
2012Type Acquisition cost Book value Difference
Equity securities ¥201 ¥179 ¥(22)Bonds 53 50 (3) Total ¥254 ¥229 ¥(25)
(Millions of yen)2011
Type Acquisition cost Book value DifferenceEquity securities ¥218 ¥186 ¥(32)Bonds 54 52 (2) Total ¥272 ¥238 ¥(34)
(Thousands of U.S. dollars)2012
Type Acquisition cost Book value DifferenceEquity securities $2,445 $2,178 $(267)Bonds 645 608 (37) Total $3,090 $2,786 $(304)
The Companies recognize impairment loss on the securities, whose available fair values decline more than 50% of the carrying amount, based on the Japanese accounting standard for financial instruments and guidelines concerning the accounting for financial instruments. The following tables summarize book values of securities without market prices as of March 31, 2012 and 2011:
Other securities(Millions of yen) (Thousands of U.S. dollars)
2012 2011 2012Unlisted equity securities ¥123 ¥149 $1,497Unlisted bonds — — — Total ¥123 ¥149 $1,497
51
Financial Section – 17/31
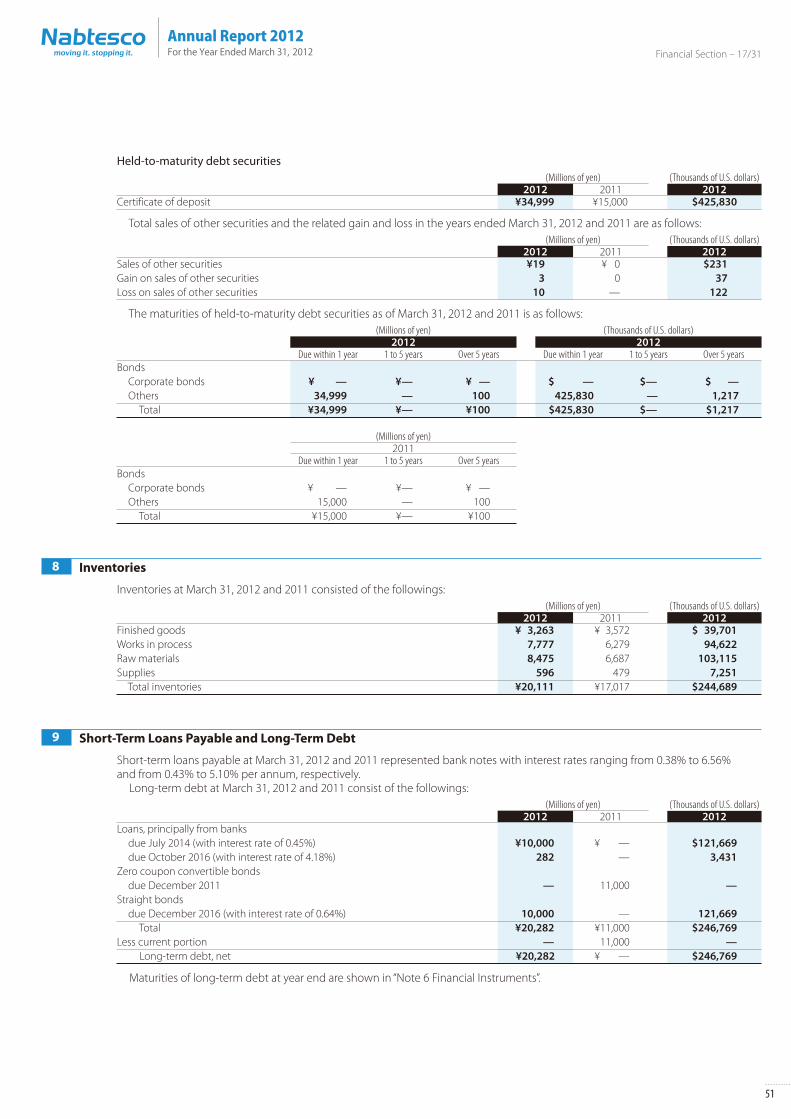
Held-to-maturity debt securities(Millions of yen) (Thousands of U.S. dollars)
2012 2011 2012Certificate of deposit ¥34,999 ¥15,000 $425,830
Total sales of other securities and the related gain and loss in the years ended March 31, 2012 and 2011 are as follows: (Millions of yen) (Thousands of U.S. dollars)
2012 2011 2012Sales of other securities ¥19 ¥ 0 $231Gain on sales of other securities 3 0 37Loss on sales of other securities 10 — 122
The maturities of held-to-maturity debt securities as of March 31, 2012 and 2011 is as follows:(Millions of yen) (Thousands of U.S. dollars)
2012 2012Due within 1 year 1 to 5 years Over 5 years Due within 1 year 1 to 5 years Over 5 years
Bonds Corporate bonds ¥ — ¥— ¥ — $ — $— $ — Others 34,999 — 100 425,830 — 1,217 Total ¥34,999 ¥— ¥100 $425,830 $— $1,217
(Millions of yen)2011
Due within 1 year 1 to 5 years Over 5 yearsBonds Corporate bonds ¥ — ¥— ¥ — Others 15,000 — 100 Total ¥15,000 ¥— ¥100
8 Inventories
Inventories at March 31, 2012 and 2011 consisted of the followings:(Millions of yen) (Thousands of U.S. dollars)
2012 2011 2012Finished goods ¥ 3,263 ¥ 3,572 $ 39,701Works in process 7,777 6,279 94,622Raw materials 8,475 6,687 103,115Supplies 596 479 7,251 Total inventories ¥20,111 ¥17,017 $244,689
9 Short-Term Loans Payable and Long-Term Debt
Short-term loans payable at March 31, 2012 and 2011 represented bank notes with interest rates ranging from 0.38% to 6.56% and from 0.43% to 5.10% per annum, respectively. Long-term debt at March 31, 2012 and 2011 consist of the followings:
(Millions of yen) (Thousands of U.S. dollars)2012 2011 2012
Loans, principally from banks due July 2014 (with interest rate of 0.45%) ¥10,000 ¥ — $121,669 due October 2016 (with interest rate of 4.18%) 282 — 3,431Zero coupon convertible bonds due December 2011 — 11,000 —Straight bonds due December 2016 (with interest rate of 0.64%) 10,000 — 121,669 Total ¥20,282 ¥11,000 $246,769Less current portion — 11,000 — Long-term debt, net ¥20,282 ¥ — $246,769
Maturities of long-term debt at year end are shown in “Note 6 Financial Instruments”.

52
Financial Section – 18/31
10 Leases
Finance leases, which do not transfer ownership of the leased property to the lessee commenced prior to April 1, 2008 and were accounted for as operating leases, continue to be accounted for as operating leases. The following pro forma amounts present the acquisition costs, accumulated depreciation and the net book value of the above operating leases as of March 31, 2012 and 2011.
(Millions of yen)2012
Acquisition costsAccumulated depreciation Net book value
Machinery and equipment ¥ 88 ¥ 80 ¥ 8Intangible assets 70 65 5 Total ¥158 ¥145 ¥13
(Millions of yen)2011
Acquisition costsAccumulated depreciation Net book value
Machinery and equipment ¥268 ¥226 ¥42Intangible assets 105 91 14 Total ¥373 ¥317 ¥56
(Thousands of U.S. dollars)2012
Acquisition costsAccumulated depreciation Net book value
Machinery and equipment $1,071 $ 973 $ 98Intangible assets 851 791 60 Total $1,922 $1,764 $158
Finance lease payments for the year ended March 31, 2012 and 2011 are as follows:(Millions of yen) (Thousands of U.S. dollars)
2012 2011 2012Lease payments ¥37 ¥104 $450
The payments above are also equivalent to depreciation expense. Pro forma depreciation expense equivalents are computed by the straight-line method over the respective lease periods assuming no residual value. Future minimum lease payments (including the interest portion thereon) subsequent to March 31, 2012 and 2011 under finance leases other than those which transfer the ownership of the leased property to the Companies and operating leases are summarized as follows:
(Millions of yen) (Thousands of U.S. dollars)2012 2011 2012
Under finance leases: Payments due within one year ¥ 12 ¥41 $ 146 Payments due after one year 1 15 12 Total ¥ 13 ¥56 $ 158Under operating leases: Payments due within one year ¥ 77 ¥ 1 $ 937 Payments due after one year 146 10 1,776 Total ¥223 ¥11 $2,713
53
Financial Section – 19/31
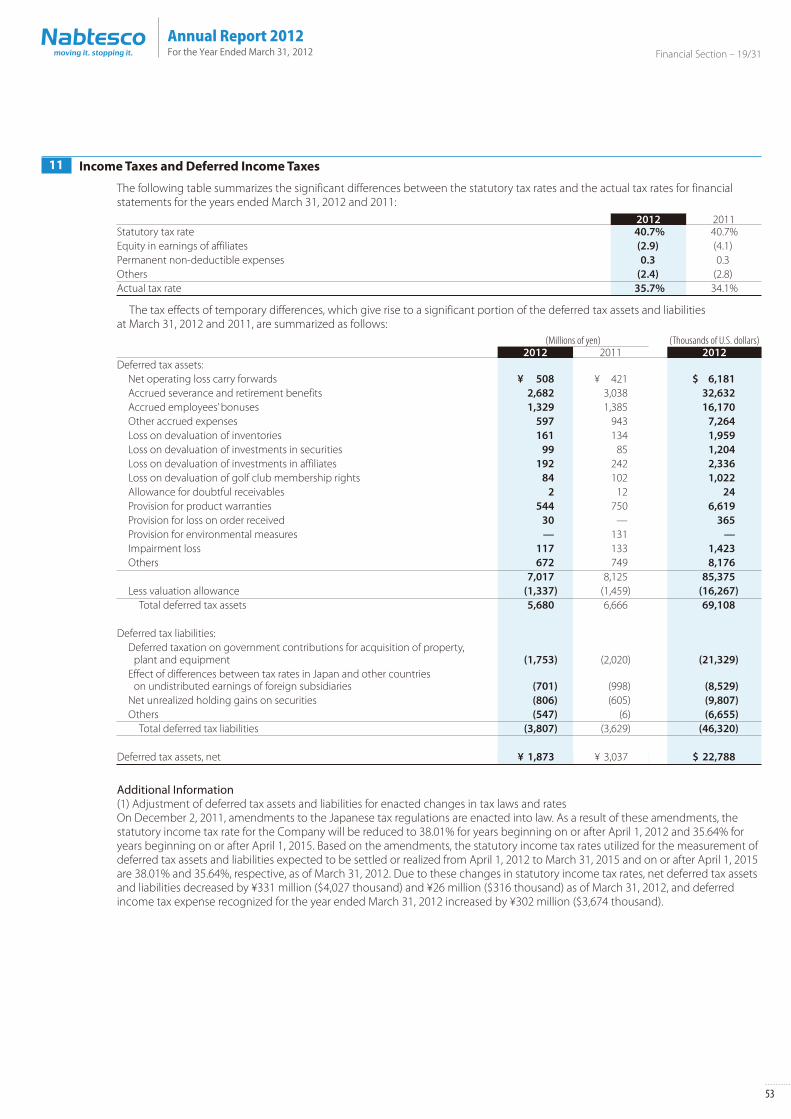
11 Income Taxes and Deferred Income Taxes
The following table summarizes the significant differences between the statutory tax rates and the actual tax rates for financial statements for the years ended March 31, 2012 and 2011:
2012 2011Statutory tax rate 40.7% 40.7%Equity in earnings of affiliates (2.9) (4.1) Permanent non-deductible expenses 0.3 0.3Others (2.4) (2.8) Actual tax rate 35.7% 34.1%
The tax effects of temporary differences, which give rise to a significant portion of the deferred tax assets and liabilities at March 31, 2012 and 2011, are summarized as follows:
(Millions of yen) (Thousands of U.S. dollars)2012 2011 2012
Deferred tax assets: Net operating loss carry forwards ¥ 508 ¥ 421 $ 6,181 Accrued severance and retirement benefits 2,682 3,038 32,632 Accrued employees’ bonuses 1,329 1,385 16,170 Other accrued expenses 597 943 7,264 Loss on devaluation of inventories 161 134 1,959 Loss on devaluation of investments in securities 99 85 1,204 Loss on devaluation of investments in affiliates 192 242 2,336 Loss on devaluation of golf club membership rights 84 102 1,022 Allowance for doubtful receivables 2 12 24 Provision for product warranties 544 750 6,619 Provision for loss on order received 30 — 365 Provision for environmental measures — 131 — Impairment loss 117 133 1,423 Others 672 749 8,176
7,017 8,125 85,375 Less valuation allowance (1,337) (1,459) (16,267) Total deferred tax assets 5,680 6,666 69,108
Deferred tax liabilities: Deferred taxation on government contributions for acquisition of property,
plant and equipment (1,753) (2,020) (21,329) Effect of differences between tax rates in Japan and other countries
on undistributed earnings of foreign subsidiaries (701) (998) (8,529) Net unrealized holding gains on securities (806) (605) (9,807) Others (547) (6) (6,655) Total deferred tax liabilities (3,807) (3,629) (46,320)
Deferred tax assets, net ¥ 1,873 ¥ 3,037 $ 22,788
Additional Information(1) Adjustment of deferred tax assets and liabilities for enacted changes in tax laws and ratesOn December 2, 2011, amendments to the Japanese tax regulations are enacted into law. As a result of these amendments, the statutory income tax rate for the Company will be reduced to 38.01% for years beginning on or after April 1, 2012 and 35.64% for years beginning on or after April 1, 2015. Based on the amendments, the statutory income tax rates utilized for the measurement of deferred tax assets and liabilities expected to be settled or realized from April 1, 2012 to March 31, 2015 and on or after April 1, 2015 are 38.01% and 35.64%, respective, as of March 31, 2012. Due to these changes in statutory income tax rates, net deferred tax assets and liabilities decreased by ¥331 million ($4,027 thousand) and ¥26 million ($316 thousand) as of March 31, 2012, and deferred income tax expense recognized for the year ended March 31, 2012 increased by ¥302 million ($3,674 thousand).

54
Financial Section – 20/31
12 Net Assets
Under the Japanese Corporate Law, upon issuance of common stock, the entire amount of the issue price is required to be accounted for as common stock, although companies may, by resolution of the Board of Directors, account for an amount not exceeding one-half of the issue price of the new shares as additional paid-in capital, which is included in capital surplus. Under the Japanese Corporate Law, in cases where a dividend distribution of surplus is made, the smaller of an amount equal to 10% of the dividend or the excess, if any, of 25% of common stock over the total of additional paid-in-capital and legal earnings reserve must be set aside as additional paid-in-capital or legal earnings reserve. Legal earnings reserve is included in retained earnings in the accompanying consolidated balance sheets. Under the Japanese Corporate Law, legal earnings reserve and additional paid-in capital could be used to eliminate or reduce a deficit by a resolution of the shareholders’ meeting. Additional paid-in capital and legal earnings reserve may not be distributed as dividends. Under the Japanese Corporate Law, however, all additional paid-in-capital and all legal earnings reserve may be transferred to other capital surplus and retained earnings, respectively, which are potentially available for dividends. The maximum amount that the Company can distribute as dividends is calculated based on the non-consolidated financial statements of the Company in accordance with the Japanese Corporate Law.
13 Contingent Liabilities
The Companies have the following contingent liabilities at March 31, 2012 and 2011:(Millions of yen) (Thousands of U.S. dollars)
2012 2011 2012As guarantor of indebtedness of affiliated companies ¥— ¥5 $— Total — ¥5 $—
14 Employee’s Severance and Retirement Benefits
The liabilities for severance and retirement benefits include in the liability section of the consolidated balance sheets as of March 31, 2012 and 2011 consisted of the followings:
(Millions of yen) (Thousands of U.S. dollars)2012 2011 2012
Projected benefit obligation ¥13,000 ¥14,002 $158,170Less fair value of plan assets (4,460) (4,838) (54,264)Less unrecognized actuarial losses (1,204) (1,614) (14,649) Accrued severance and retirement benefits for employees ¥ 7,336 ¥ 7,550 $ 89,257
Severance and retirement benefit expenses, included in the consolidated statements of income for the years ended March 31, 2012 and 2011, are comprised of the followings:
(Millions of yen) (Thousands of U.S. dollars)2012 2011 2012
Service costs ¥ 734 ¥ 736 $ 8,930Interest cost on projected benefit obligation 250 268 3,042Amortization of actuarial losses 317 398 3,857Contribution to defined contribution pension plan 247 252 3,005 Severance and retirement benefit expenses ¥1,548 ¥1,654 $18,834
Assumptions used for the years ended March 31, 2012 and 2011 are set forth as follows:2012 2011
Discount rate: Domestic companies 2.0% 2.0%Expected return on plan assets: Domestic companies 0.0% 0.0%Amortization of actuarial losses 10 years 10 yearsAmortization period of prior service cost 1 year 1 year
NABCO DOOR Ltd. (NABCO DOOR) the Company’s domestic subsidiary, abolished a tax qualified retirement pension plan and changed to a defined contribution plan at April 1, 2011. NABCO DOOR has adopted “Accounting for Transfer between Retirement Benefit Plans” (Financial Accounting Standards Implementation Guidance No. 1, issued on January 31, 2002) and recorded a gain on revision of retirement benefit plan in the amount of ¥50 million ($608 thousand) for the year ended March 31, 2012.
55
Financial Section – 21/31
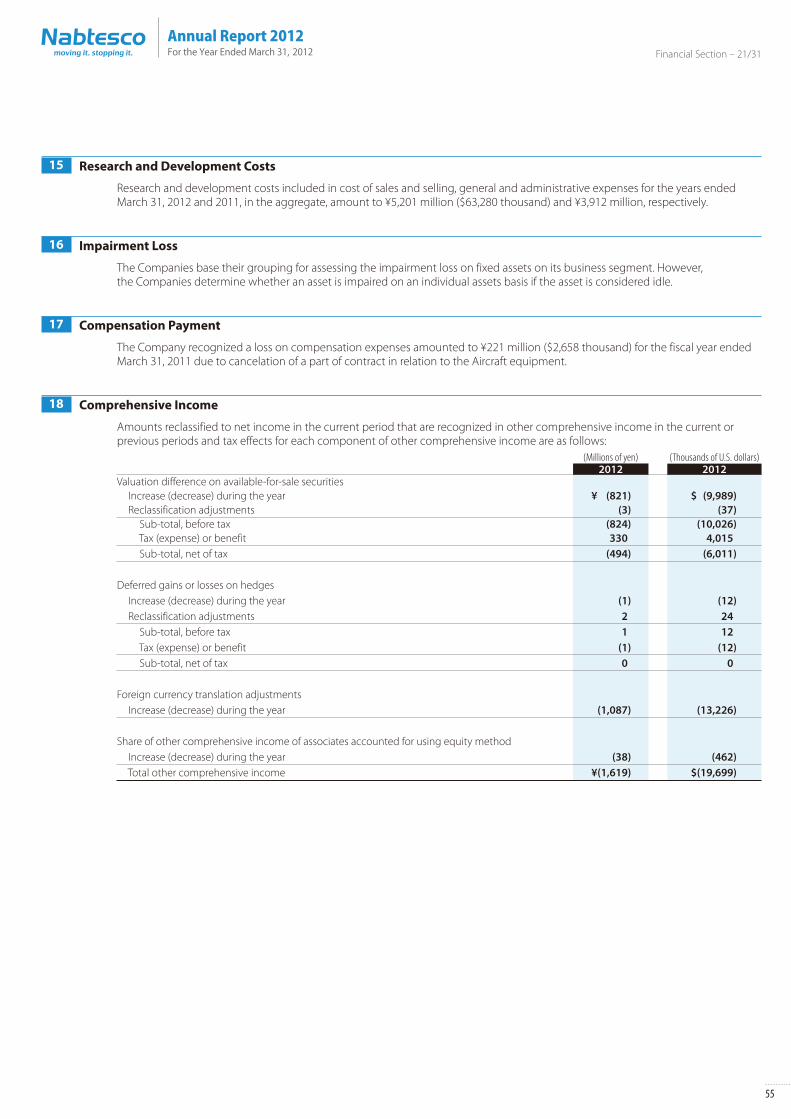
15 Research and Development Costs
Research and development costs included in cost of sales and selling, general and administrative expenses for the years ended March 31, 2012 and 2011, in the aggregate, amount to ¥5,201 million ($63,280 thousand) and ¥3,912 million, respectively.
16 Impairment Loss
The Companies base their grouping for assessing the impairment loss on fixed assets on its business segment. However, the Companies determine whether an asset is impaired on an individual assets basis if the asset is considered idle.
17 Compensation Payment
The Company recognized a loss on compensation expenses amounted to ¥221 million ($2,658 thousand) for the fiscal year ended March 31, 2011 due to cancelation of a part of contract in relation to the Aircraft equipment.
18 Comprehensive Income
Amounts reclassified to net income in the current period that are recognized in other comprehensive income in the current or previous periods and tax effects for each component of other comprehensive income are as follows:
(Millions of yen) (Thousands of U.S. dollars)2012 2012
Valuation difference on available-for-sale securities Increase (decrease) during the year ¥ (821) $ (9,989) Reclassification adjustments (3) (37) Sub-total, before tax (824) (10,026) Tax (expense) or benefit 330 4,015 Sub-total, net of tax (494) (6,011)
Deferred gains or losses on hedges Increase (decrease) during the year (1) (12) Reclassification adjustments 2 24 Sub-total, before tax 1 12 Tax (expense) or benefit (1) (12) Sub-total, net of tax 0 0
Foreign currency translation adjustments Increase (decrease) during the year (1,087) (13,226)
Share of other comprehensive income of associates accounted for using equity method Increase (decrease) during the year (38) (462) Total other comprehensive income ¥(1,619) $(19,699)

56
Financial Section – 22/31
19 Derivative Financial Instruments
According to the accounting standard for derivative financial instruments, forward foreign exchange contracts and interest rate swap contracts which qualify for hedge accounting and such amounts of which are assigned to hedged assets or liabilities and are recorded on the balance sheets at March 31, 2012 and 2011, are not subject to disclosure of market value information. There is no derivative financial instrument, for which hedge accounting is not applied, and therefore there is no derivative financial instruments subject to disclosure of market value information as of March 31, 2012 and 2011.
(1) Foreign exchange forward contractsDerivative financial instruments for which hedge accounting are applied as of March 31, 2012 are as follows:
(Millions of yen)
Hedge accounting method Type of derivative, etc. Main hedged itemsContract amount
Portion over 1 year Fair value
Deferral hedge method Foreign exchange forward contract Trade notes and account receivable ¥130 ¥— ¥(0) Sold option U.S. dollars
Allocation method Foreign exchange forward contract Trade notes and account receivable 629 — Note 2 Sold option U.S. dollars
(Thousands of U.S. dollars)
Hedge accounting method Type of derivative, etc. Main hedged itemsContract amount
Portion over 1 year Fair value
Deferral hedge method Foreign exchange forward contract Trade notes and account receivable $1,582 $— $(0) Sold option U.S. dollars
Allocation method Foreign exchange forward contract Trade notes and account receivable 7,653 — Note 2 Sold option U.S. dollars
Notes 1. Fair values are stated at the price provided by fi nancial institutions etc. 2. Since amounts in foreign currency forward contracts treated by the allocation method are handled together with accounts receivable that are subject to
hedging, the estimated fair value of such accounts receivable is shown as the estimated fair value in the table above.
Derivative financial instruments for which hedge accounting are applied as of March 31, 2011 are as follows:(Millions of yen)
Hedge accounting method Type of derivative, etc. Main hedged itemsContract amount
Portion over 1 year Fair value
Deferral hedge method Foreign exchange forward contract Trade notes and account receivable ¥206 ¥— ¥(2) Sold option U.S. dollars
Allocation method Foreign exchange forward contract Trade notes and account receivable 373 — Note 2 Sold option U.S. dollars
Notes 1. Fair values are stated at the price provided by fi nancial institutions etc. 2. Since amounts in foreign currency forward contracts treated by the allocation method are handled together with accounts receivable that are subject to
hedging, the estimated fair value of such accounts receivable is shown as the estimated fair value in the table above.
(2) Interest rate swap contractsDerivative financial instruments for which hedge accounting are applied as of March 31, 2012 are as follows:
(Millions of yen)
Hedge accounting method Type of derivative, etc. Main hedged itemsContract amount
Portion over 1 year Fair value
Interest rate swap Interest rate swap Long-term debt ¥10,000 ¥10,000 Note Receive floating, pay fixed
(Thousands of U.S. dollars)
Hedge accounting method Type of derivative, etc. Main hedged itemsContract amount
Portion over 1 year Fair value
Interest rate swap Interest rate swap Long-term debt $121,669 $121,669 Note Receive floating, pay fixed
Note: Interest rate swaps for which special treatment is applied are accounted for together with long-term debt designated as a hedged item. Therefore, their fair values are included in the fair value of long-term debt.
57
Financial Section – 23/31
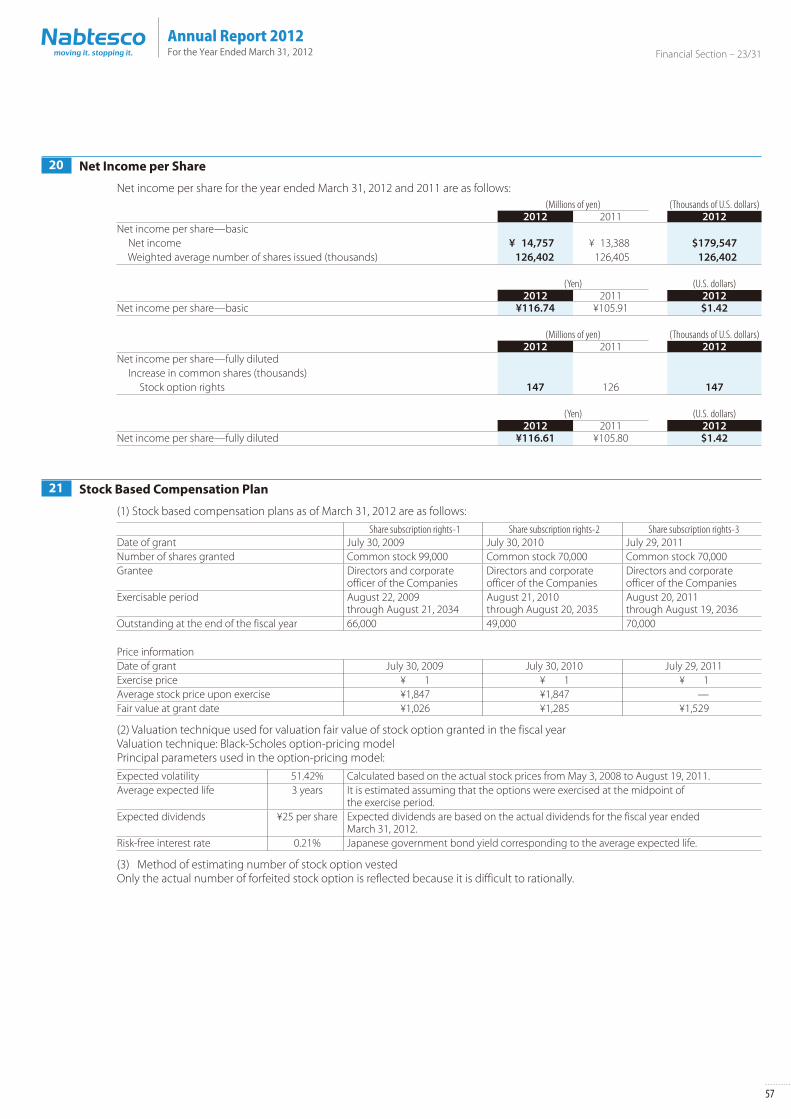
20 Net Income per Share
Net income per share for the year ended March 31, 2012 and 2011 are as follows:(Millions of yen) (Thousands of U.S. dollars)
2012 2011 2012Net income per share—basic Net income ¥ 14,757 ¥ 13,388 $179,547 Weighted average number of shares issued (thousands) 126,402 126,405 126,402
(Yen) (U.S. dollars)2012 2011 2012
Net income per share—basic ¥116.74 ¥105.91 $1.42
(Millions of yen) (Thousands of U.S. dollars)2012 2011 2012
Net income per share—fully diluted Increase in common shares (thousands) Stock option rights 147 126 147
(Yen) (U.S. dollars)2012 2011 2012
Net income per share—fully diluted ¥116.61 ¥105.80 $1.42
21 Stock Based Compensation Plan
(1) Stock based compensation plans as of March 31, 2012 are as follows:Share subscription rights-1 Share subscription rights-2 Share subscription rights-3
Date of grant July 30, 2009 July 30, 2010 July 29, 2011Number of shares granted Common stock 99,000 Common stock 70,000 Common stock 70,000Grantee Directors and corporate
officer of the CompaniesDirectors and corporate officer of the Companies
Directors and corporate officer of the Companies
Exercisable period August 22, 2009 through August 21, 2034
August 21, 2010 through August 20, 2035
August 20, 2011 through August 19, 2036
Outstanding at the end of the fiscal year 66,000 49,000 70,000
Price informationDate of grant July 30, 2009 July 30, 2010 July 29, 2011Exercise price ¥ 1 ¥ 1 ¥ 1Average stock price upon exercise ¥1,847 ¥1,847 —Fair value at grant date ¥1,026 ¥1,285 ¥1,529
(2) Valuation technique used for valuation fair value of stock option granted in the fiscal yearValuation technique: Black-Scholes option-pricing modelPrincipal parameters used in the option-pricing model:Expected volatility 51.42% Calculated based on the actual stock prices from May 3, 2008 to August 19, 2011.Average expected life 3 years It is estimated assuming that the options were exercised at the midpoint of
the exercise period.Expected dividends ¥25 per share Expected dividends are based on the actual dividends for the fiscal year ended
March 31, 2012.Risk-free interest rate 0.21% Japanese government bond yield corresponding to the average expected life.
(3) Method of estimating number of stock option vestedOnly the actual number of forfeited stock option is reflected because it is difficult to rationally.

58
Financial Section – 24/31
22 Investment and Rental Property
Information about fair value of investment and rental property included in the consolidated financial statements at March 31, 2012 and 2011 are as follows: The Company owns a portion of office building and lands in Tokyo and other area.
(Millions of yen)
Purpose of useBook value as of
April 1, 2011Increase/
(decrease)Book value as of March 31, 2012
Fair value as of March 31, 2012
Rental property ¥4,087 ¥(36) ¥4,051 ¥4,303Idle property 323 (2) 321 2,674 Total ¥4,410 ¥(38) ¥4,372 ¥6,977
(Millions of yen)
Purpose of useBook value as of
April 1, 2010Increase/
(decrease)Book value as of March 31, 2011
Fair value as of March 31, 2011
Rental property ¥4,125 ¥(38) ¥4,087 ¥4,513Idle property 324 (1) 323 2,880 Total ¥4,449 ¥(39) ¥4,410 ¥7,393
(Thousands of U.S. dollars)
Purpose of useBook value as of
April 1, 2011Increase/
(decrease)Book value as of March 31, 2012
Fair value as of March 31, 2012
Rental property $49,719 $(438) $49,281 $52,353Idle property 3,938 (27) 3,911 32,537 Total $53,657 $(465) $53,192 $84,890
Notes 1. The book value of each property on the balance sheet is its acquisition cost less cumulative depreciated expenses. 2. Main rental properties are land in Kobe, rental building in Tokyo and land and building in Ehime prefecture. 3. Main idle properties are vacant land of the old Yokosuka factory in Kanagawa prefecture, and land in Tokyo (under redevelopment). 4. Decrease is mainly depreciation. 5. Fair value of property as of March 31, 2012 and 2011 is primarily calculated based on real estate appraisal standards provided by the external licensed
appraiser. In addition, provision for environmental measures as of March 31, 2011 amounted to ¥321 million related to a vacant land of the old Yokosuka factory does not refl ect fair value.
Revenue and expense related to investment and rental property is as follows:(Millions of yen)
2012Rental revenues Rental expenses Net Other expenses
¥293 ¥94 ¥199 ¥15
(Millions of yen)2011
Rental revenues Rental expenses Net Other expenses¥292 ¥93 ¥199 ¥83
(Thousands of U.S. dollars)2012
Rental revenues Rental expenses Net Other expenses$3,570 $1,139 $2,431 $188
Notes 1. Rental expenses are mainly depreciation, repair, insurance, tax and dues related to the rental properties. 2. Other expenses are mainly depreciation, repair, insurance, tax and dues related to the idle properties and loss on provision for environmental measures.

59
Financial Section – 25/31
23 Segment Information
Effective April 1, 2010, the Company adopted “Accounting Standard for Disclosures about Segments of an Enterprise and Related Information” (Accounting Standards Board of Japan (“ASBJ”) Statement No. 17 on March 27, 2009) and “Guidance on Accounting Standard for Disclosures about Segments of an Enterprise and Related Information” (ASBJ Guidance No. 20, issued on March 21, 2008).
(1) General information about reportable segmentsReportable segments are intended to discuss periodically for the board of directors’ decision of operating resources’ allocation and evaluation of financial result and which are available of financial reports separately among constitutional units. The companies manufacture and sale products based on motion control technology and divided into four reportable segments, “Precision Equipment”, “Transport Equipment”, “Aircraft and Oil Hydraulic Equipment” and “Industrial Equipment”. Operations of the Companies are classified into four business segments as follows:
Segment Main products Main customers and industriesPrecision Equipment High precision reducers and actuators, wafer
transfer unit, vacuum pumps, vacuum valves, vacuum devices, rapid prototyping systems, heating pipes
Industrial robots, machine tools, factory automation systems, electronic devices, semiconductor manufacturing equipment, and automobiles, home electronic appliances
Transport Equipment Automatic door drive unit, automobile air brake system, automatic testing and training equip-ment, remote control systems for marine vessels.
Railway vehicle, automobile, marine vessels
Aircraft and Oil Hydraulic Equipment Flight control systems, various types of actua-tors, oil hydraulic drive motors, actuation units for wind turbine, and various types of motors for winches
Aircraft, space, construction equipment, agricultural and other vehicles
Industrial Equipment Automatic door systems, prosthetic products, automatic measuring and packing machines, multi-forming machines, constant velocity joint processing machines
Building and general industry, welfare, food, medicine, cleaning material, chemicals, precision equipment, automobiles, and home electronic appliances
(2) Basis of measurement about reported segment profit or loss, segment assets, segment liabilities and other material items
The basis of measurement about reported segment profit or loss, segment assets, segment liabilities and other material items is generally same as described in “Summary of significant accounting policies”. Intersegment transactions are based on current market prices.
(3) Information about reported segment profit or loss, segment assets, segment liabilities and other material itemsSegment information as of and for the fiscal year ended March 31, 2012 and 2011 is as follows:
(Millions of yen)2012
Precision Equipment
Transport Equipment
Aircraft and Oil Hydraulic
EquipmentIndustrial
Equipment Total Adjustment ConsolidatedSales External sales ¥44,199 ¥48,289 ¥64,240 ¥41,799 ¥198,527 ¥ — ¥198,527 Intersegment sales 26 219 709 1,507 2,461 (2,461) — Total sales 44,225 48,508 64,949 43,306 200,988 (2,461) 198,527Operating income 8,013 6,069 6,131 2,646 22,859 — 22,859Total assets 29,481 32,219 45,646 52,150 159,496 48,597 208,093Total liabilities 15,766 14,015 20,212 17,146 67,139 33,487 100,626Depreciation 1,830 1,402 2,226 668 6,126 547 6,673Amortization of goodwill — 6 — 661 667 — 667Capital expenditures 6,638 1,479 4,034 679 12,830 694 13,524
60
Financial Section – 26/31
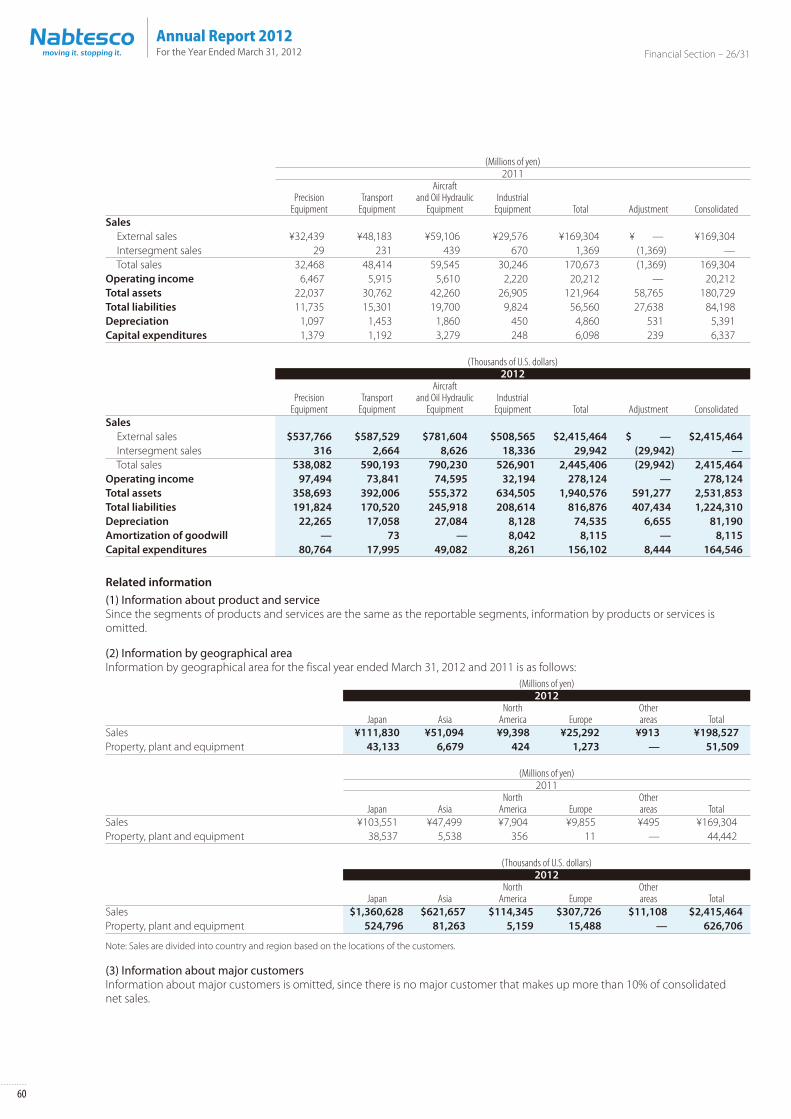
(Millions of yen)2011
Precision Equipment
Transport Equipment
Aircraft and Oil Hydraulic
EquipmentIndustrial
Equipment Total Adjustment ConsolidatedSales External sales ¥32,439 ¥48,183 ¥59,106 ¥29,576 ¥169,304 ¥ — ¥169,304 Intersegment sales 29 231 439 670 1,369 (1,369) — Total sales 32,468 48,414 59,545 30,246 170,673 (1,369) 169,304Operating income 6,467 5,915 5,610 2,220 20,212 — 20,212Total assets 22,037 30,762 42,260 26,905 121,964 58,765 180,729Total liabilities 11,735 15,301 19,700 9,824 56,560 27,638 84,198Depreciation 1,097 1,453 1,860 450 4,860 531 5,391Capital expenditures 1,379 1,192 3,279 248 6,098 239 6,337
(Thousands of U.S. dollars)2012
Precision Equipment
Transport Equipment
Aircraft and Oil Hydraulic
EquipmentIndustrial
Equipment Total Adjustment ConsolidatedSales External sales $537,766 $587,529 $781,604 $508,565 $2,415,464 $ — $2,415,464 Intersegment sales 316 2,664 8,626 18,336 29,942 (29,942) — Total sales 538,082 590,193 790,230 526,901 2,445,406 (29,942) 2,415,464Operating income 97,494 73,841 74,595 32,194 278,124 — 278,124Total assets 358,693 392,006 555,372 634,505 1,940,576 591,277 2,531,853Total liabilities 191,824 170,520 245,918 208,614 816,876 407,434 1,224,310Depreciation 22,265 17,058 27,084 8,128 74,535 6,655 81,190Amortization of goodwill — 73 — 8,042 8,115 — 8,115Capital expenditures 80,764 17,995 49,082 8,261 156,102 8,444 164,546
Related information(1) Information about product and serviceSince the segments of products and services are the same as the reportable segments, information by products or services is omitted.
(2) Information by geographical areaInformation by geographical area for the fiscal year ended March 31, 2012 and 2011 is as follows:
(Millions of yen)2012
Japan AsiaNorth
America EuropeOtherareas Total
Sales ¥111,830 ¥51,094 ¥9,398 ¥25,292 ¥913 ¥198,527Property, plant and equipment 43,133 6,679 424 1,273 — 51,509
(Millions of yen)2011
Japan AsiaNorth
America EuropeOtherareas Total
Sales ¥103,551 ¥47,499 ¥7,904 ¥9,855 ¥495 ¥169,304Property, plant and equipment 38,537 5,538 356 11 — 44,442
(Thousands of U.S. dollars)2012
Japan AsiaNorth
America EuropeOtherareas Total
Sales $1,360,628 $621,657 $114,345 $307,726 $11,108 $2,415,464Property, plant and equipment 524,796 81,263 5,159 15,488 — 626,706
Note: Sales are divided into country and region based on the locations of the customers.
(3) Information about major customersInformation about major customers is omitted, since there is no major customer that makes up more than 10% of consolidated net sales.
61
Financial Section – 27/31
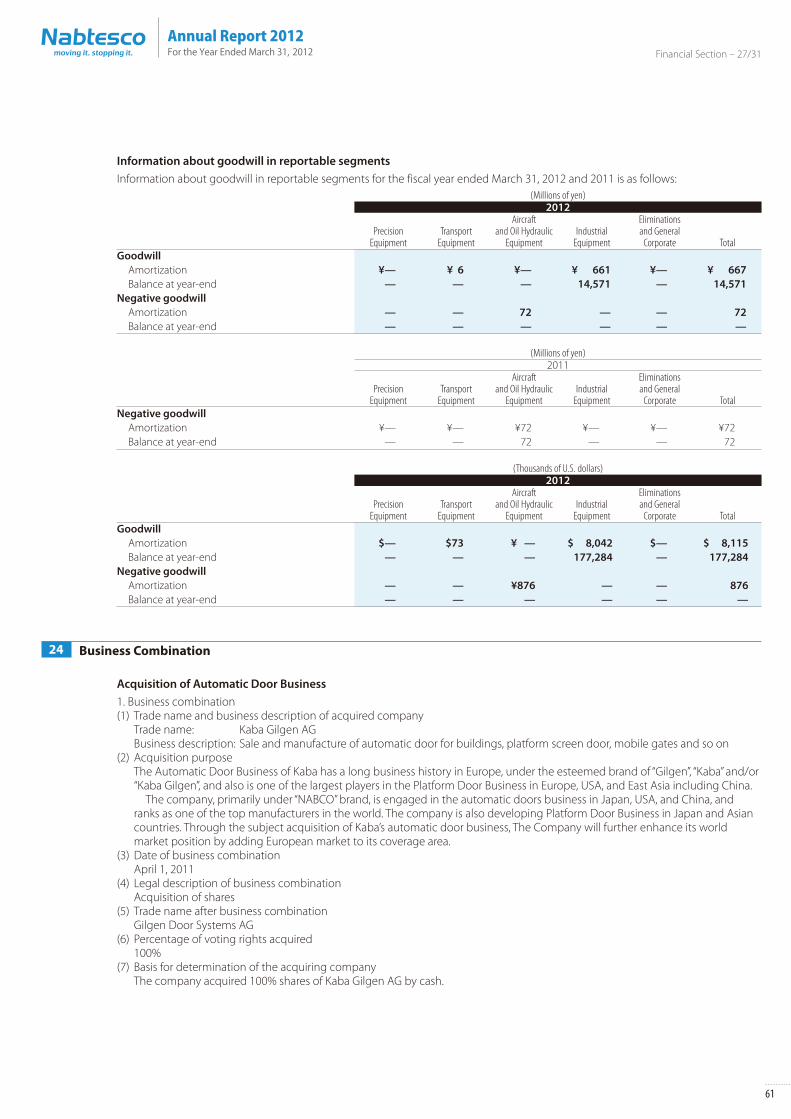
Information about goodwill in reportable segmentsInformation about goodwill in reportable segments for the fiscal year ended March 31, 2012 and 2011 is as follows:
(Millions of yen)2012
PrecisionEquipment
TransportEquipment
Aircraftand Oil Hydraulic
EquipmentIndustrial
Equipment
Eliminationsand General
Corporate TotalGoodwill Amortization ¥— ¥ 6 ¥— ¥ 661 ¥— ¥ 667 Balance at year-end — — — 14,571 — 14,571Negative goodwill Amortization — — 72 — — 72 Balance at year-end — — — — — —
(Millions of yen)2011
PrecisionEquipment
TransportEquipment
Aircraftand Oil Hydraulic
EquipmentIndustrial
Equipment
Eliminationsand General
Corporate TotalNegative goodwill Amortization ¥— ¥— ¥72 ¥— ¥— ¥72 Balance at year-end — — 72 — — 72
(Thousands of U.S. dollars)2012
PrecisionEquipment
TransportEquipment
Aircraftand Oil Hydraulic
EquipmentIndustrial
Equipment
Eliminationsand General
Corporate TotalGoodwill Amortization $— $73 ¥ — $ 8,042 $— $ 8,115 Balance at year-end — — — 177,284 — 177,284Negative goodwill Amortization — — ¥876 — — 876 Balance at year-end — — — — — —
24 Business Combination
Acquisition of Automatic Door Business1. Business combination(1) Trade name and business description of acquired company Trade name: Kaba Gilgen AG Business description: Sale and manufacture of automatic door for buildings, platform screen door, mobile gates and so on(2) Acquisition purpose The Automatic Door Business of Kaba has a long business history in Europe, under the esteemed brand of “Gilgen”, “Kaba” and/or
“Kaba Gilgen”, and also is one of the largest players in the Platform Door Business in Europe, USA, and East Asia including China. The company, primarily under “NABCO” brand, is engaged in the automatic doors business in Japan, USA, and China, and
ranks as one of the top manufacturers in the world. The company is also developing Platform Door Business in Japan and Asian countries. Through the subject acquisition of Kaba’s automatic door business, The Company will further enhance its world market position by adding European market to its coverage area.
(3) Date of business combination April 1, 2011(4) Legal description of business combination Acquisition of shares(5) Trade name after business combination Gilgen Door Systems AG(6) Percentage of voting rights acquired 100%(7) Basis for determination of the acquiring company The company acquired 100% shares of Kaba Gilgen AG by cash.
62
Financial Section – 28/31
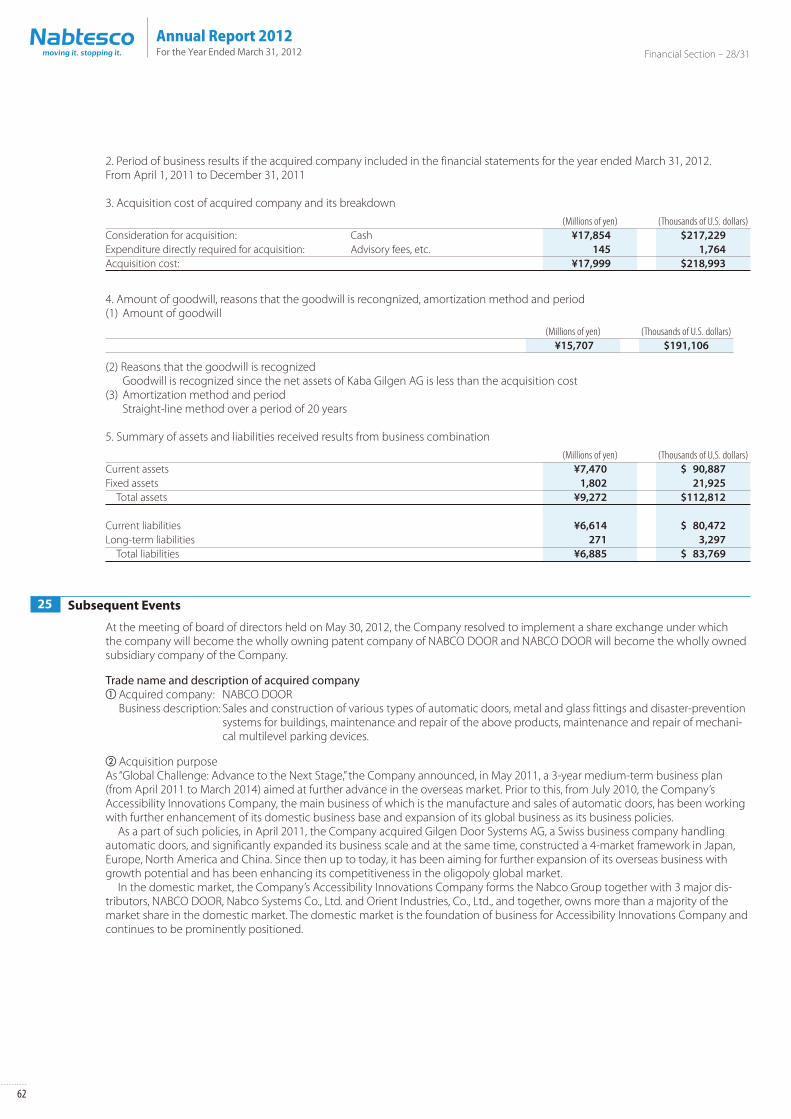
2. Period of business results if the acquired company included in the financial statements for the year ended March 31, 2012.From April 1, 2011 to December 31, 2011
3. Acquisition cost of acquired company and its breakdown(Millions of yen) (Thousands of U.S. dollars)
Consideration for acquisition: Cash ¥17,854 $217,229Expenditure directly required for acquisition: Advisory fees, etc. 145 1,764Acquisition cost: ¥17,999 $218,993
4. Amount of goodwill, reasons that the goodwill is recongnized, amortization method and period(1) Amount of goodwill
(Millions of yen) (Thousands of U.S. dollars)¥15,707 $191,106
(2) Reasons that the goodwill is recognized Goodwill is recognized since the net assets of Kaba Gilgen AG is less than the acquisition cost(3) Amortization method and period Straight-line method over a period of 20 years
5. Summary of assets and liabilities received results from business combination(Millions of yen) (Thousands of U.S. dollars)
Current assets ¥7,470 $ 90,887Fixed assets 1,802 21,925 Total assets ¥9,272 $112,812
Current liabilities ¥6,614 $ 80,472Long-term liabilities 271 3,297 Total liabilities ¥6,885 $ 83,769
25 Subsequent Events
At the meeting of board of directors held on May 30, 2012, the Company resolved to implement a share exchange under which the company will become the wholly owning patent company of NABCO DOOR and NABCO DOOR will become the wholly owned subsidiary company of the Company.
Trade name and description of acquired company� Acquired company: NABCO DOOR Business description: Sales and construction of various types of automatic doors, metal and glass fittings and disaster-prevention
systems for buildings, maintenance and repair of the above products, maintenance and repair of mechani-cal multilevel parking devices.
� Acquisition purpose As “Global Challenge: Advance to the Next Stage,” the Company announced, in May 2011, a 3-year medium-term business plan (from April 2011 to March 2014) aimed at further advance in the overseas market. Prior to this, from July 2010, the Company’s Accessibility Innovations Company, the main business of which is the manufacture and sales of automatic doors, has been working with further enhancement of its domestic business base and expansion of its global business as its business policies. As a part of such policies, in April 2011, the Company acquired Gilgen Door Systems AG, a Swiss business company handling automatic doors, and significantly expanded its business scale and at the same time, constructed a 4-market framework in Japan, Europe, North America and China. Since then up to today, it has been aiming for further expansion of its overseas business with growth potential and has been enhancing its competitiveness in the oligopoly global market. In the domestic market, the Company’s Accessibility Innovations Company forms the Nabco Group together with 3 major dis-tributors, NABCO DOOR, Nabco Systems Co., Ltd. and Orient Industries, Co., Ltd., and together, owns more than a majority of the market share in the domestic market. The domestic market is the foundation of business for Accessibility Innovations Company and continues to be prominently positioned.

63
Financial Section – 29/31
NABCO DOOR, established as the Company’s sales and Construction Company in the west Japan region, went public on the stock exchange in 1996 aimed at expanding its business credit. Based on “safety, security and comfort,” NABCO DOOR, making it its mission to contribute to society with the basic philosophy of providing the world with products and services offering satisfaction to the customers, has been working on sales and maintenance services under the theme of “creation of a comfortable environment where one can live at ease” and “coexistence with the natural environment” in consideration of the global environment. As a result, NABCO DOOR has become a distributor accounting for approximately 40% of domestic sales of automatic doors in the Nabco Group. However, the Lehman Shock in September 2008 and the economic downturn thereafter created awareness that the Japanese automatic door market environment was undergoing the following significant changes over a long period of time.• Decline in growth potential, shift from quantity to quality and demand for barrier-free environment in consideration of disadvan-
taged people, associated with declining birthrate, the aging population and gradual decrease in the working population.• From simple opening and closing functions to attachment of high value-added functions such as environmental improvement
for decreasing unnecessary opening and closing, energy-conservation (ecological) and aperture information gathering.• Shift from product oriented operations such as new installations to value chain operations such as maintenance, services and
renovation. Based on such changes in market structure, perceptive and swift grasp of the underlying needs of new markets and the provision of value-added products and services fitting such needs are the keys to enhancing competitiveness and expanding the business domestically in the future. In order to do so, it is necessary for those composing the value chain to work together and efficiently, more than ever, for understanding the market needs and for developing and providing products and high-quality services. As a result of discussions held between the two companies based on such viewpoints, we agreed that it is necessary to shift from a collaborative relation, that of manufacturer and distributor, to a single capital tie, to take a unified approach towards the value chain and to achieve a prompt decision-making and improvement of the ability of execution, by making NABCO DOOR a wholly owned subsidiary of the Company. By the Share Exchange, the Company will aim at constructing an efficient management with unified development, provision and sales of high value-added products and high-level services meeting the underlying needs of the market and improving the corporate values of both companies. By developing the results of such management into collaboration with the other two major distributors, we will aim at enforcing and expanding the business of the Nabco Group as a whole and at meeting the expectations of the Company ’s shareholders including NABCO DOOR’s shareholders who will be possessing the Company shares.
� Method of Share Exchange The Company will become the wholly owning parent company of NABCO DOOR and NABCO DOOR will become the wholly owned subsidiary company of the Company. Pursuant the “simple share exchange” procedures provided in Paragraph 3 of Article 796 of the Companies Act, the Company intends to implement the Share Exchange without obtaining the approval of the Company’s general meeting of shareholders concerning the Share Exchange Agreement. NABCO DOOR intends to implement the Share Exchange upon obtaining the approval by resolution of NABCO DOOR’s ordinary general meeting of shareholders scheduled to be held on June 27, 2012.
� Effective dateAugust 1, 2012 (scheduled)
� Details of allocation concerning Share ExchangeCompany name The Company
(wholly owning parent company)NABCO DOOR(wholly owned subsidiary company)
Details of allocation concerning Share Exchange 1 0.6Number of shares to be delivered due to Share Exchange The Company’s ordinary share: 1,053,762 shares (scheduled)
� Calculation Basis, etc. concerning allocation under the Share ExchangeIn order to secure the fairness of the share exchange ratio in the Share Exchange, each company decided to individually request the calculation of the share exchange ratio to an independent, third party valuation organization. For this purpose, the Company appointed Nomura Securities Co., Ltd. and NABCO DOOR appointed SMBC Nikko Securities Inc. as each of their third party valuation organizations concerning the calculation of the share exchange ratio. With respect to the Company, Nomura Securities Co., Ltd. conducted calculations based on the average market price method and the comparable multiple valuation method, in addition to the discounted cash flow method. With respect to NABCO DOOR, SMBC Nikko Securities Inc. conducted calculations based on the average market price method and the discounted cash flow method. The Company and NABCO DOOR considered the results of analysis and considered the financial conditions, trends of perfor-mance and trends of share values, etc. of both companies. As a result, the two companies, judging the share exchange ratio.
64
Financial Section – 30/31
26 Appropriation of Retained Earnings
The following appropriation of retained earnings on a non-consolidated basis, which has not been reflected in accompanying consolidated financial statements, is approved at the shareholders’ meeting held on June 26, 2012:
(Millions of yen) (Thousands of U.S. dollars)Cash dividends (¥17= $0.21 per share) ¥2,160 $26,281
The following appropriation of retained earnings on a non-consolidated basis, which is not reflected in accompanying consolidated financial statements, is approved at the shareholders’ meeting held on June 24, 2011:
(Millions of yen)Cash dividends (¥16) ¥2,033