
I-405 Express Toll Lanes
12 Month Performance Update
November 16, 2016
Washington State Transportation Commission
Patty Rubstello, P.E.Assistant SecretaryWSDOT Toll Division

Agenda
• Refresh on I-405 Master Plan elements and express toll lane goals
• Review data and observations from first year of operations• Discuss future improvements
2

Regional Consensus EIS Record of Decision, 2002
Roadways 2 new lanes in each direction Local arterial improvements
Transit & Transportation Choices Bus Rapid Transit system New transit centers 50% transit service increase HOV direct access ramps and flyer stops Potential managed lanes system 5000 new Park & Ride spaces 1700 new vanpools
Environmental Enhancements
I-405 Master Plan
3

I-405 Master Plan: Multimodal and making progress
Local arterial improvements50% complete
Bus Rapid Transit stations70% complete
Pedestrian/bicycle improvements25% complete
Direct Access12% complete
Park and Ride expansions80% complete or funded
Transit service increase40% complete
Vanpool service increase30% complete
Transit center expansions70% complete
Add 2 lanes in each direction 45% complete or funded
4

The Puget Sound
region is growing
Since 2000, as planning for the I-405 corridor was underway:
Population Growth:• 22 percent in King County• 27 percent in Snohomish County
Job Growth:• 12 percent in King County• 33 percent in Snohomish County
In the last year, the Puget Sound region grew by 86,000 people and 64,000 jobs.
5
Sources: U.S. Census Bureau, WA State Office of Financial Management. Puget Sound Regional Council.Job and population data covers 2000-2015.

6
Traffic volumes are increasing
across the Puget Sound region
Location SouthboundVolume
Comparison
Northbound Volume
ComparisonI-5 at
213th St SW +2% +2%
I-405 at NE 132nd St +10% +9%
SR 520 floating bridge +3% +4%
I-5 at Yesler Way +4% +1%
I-405 at SE 17th St +1% -1%
SR 167 at S 196th St +3% +1%
Volume comparisonsOct 2014 – Sept 2015 to Oct 2015 – Sept 2016
Average daily trips

Goals of express toll lanes
1. Offer drivers a choice
2. Provide a faster and more predictable trip
3. Fund future corridor improvements
7

I-405 express toll lanes
Quick facts
• Opened Sept. 27, 2015• 17 miles of express toll lanes• Operation hours: 5 a.m. to 7 p.m. Mon – Fri• Toll Rates
– Minimum Toll Rate $ 0.75– Maximum Toll Rate $ 10.00
• Carpool Policy– 3+ carpools with Flex Pass exempt at all
times – 2+ carpools exempt except 5-9 a.m. and
3-7 p.m. on weekdays
8

• Ramp-up: Drivers made a total of 14.5 million trips in the first year.
• Drivers adjusted much faster than anticipated.
9
Goal #1: Offer drivers a choice
One year performance update
What we anticipated What we’re seeing• Ramp-up: Total trips projected at 12.1
million in the first year.• National experience shows it
takes up to a year for drivers to adjust.
• Choice: Drivers may not use the express toll lanes everyday, but they offer drivers a choice when they need it most.
• Toll rates: Typical rates would range between 75 cents and $4.
• Choice:• 70 percent of express toll lane
commuters use the lanes between 1 and 5 times a month.
• Drivers value this choice. Even after one year, 50,000 new vehicles used the express toll lanes for the first time September 2016.
• Toll rates: Average peak period, peak direction toll rate is $2.50.

What we’re seeing: Ramp-up occurred faster
than on other U.S. express toll lane facilities
10One year performance update
0
500,000
1,000,000
1,500,000
2,000,000
2,500,000
3,000,000
Qua
rterly
Tol
led
Trip
sTotal Quarterly Tolled
Express Toll Lane Trips (Oct. 2015-Sept. 2016)
ForecastedActual
Oct-Dec Jan-Mar Apr-June Jul-Sep

Average monthly express toll lane travel frequency for Good To Go! pass users
(Oct. 2015 – Sept. 2016)
What we’re seeing:
Drivers use the lanes when they need them
Source: Unique Good To Go! passes on I- 405Weekdays from 5 a.m. to 7 p.m.
11One year performance update

63.7%
6.8% 5.4% 4.2% 4.7% 5.5% 4.5% 5.2%
0%
10%
20%
30%
40%
50%
60%
70%
80%
90%
100%
Perc
ent o
f All
Peak
Hou
r Trip
s
Toll Rate Paid
Percent of Peak Period 405 Toll Trips by Rate Category
$ 0.75 $ 1-2 $ 2-3 $ 3-4 $ 4-5 $ 5-6 $ 6-8 $ 8-10
Sept. 27, 2015 - Sep 30, 2016Monday - Friday
5 - 9 a.m.3 - 7 p.m.
12One year performance update
What we’re seeing:
What drivers are choosing to pay
Average Peak Period Toll Rates• July-Sept 2016 average - $2.99• May-June 2016 average - $2.33• Jan-Apr 2016 average - $2.40• Oct-Dec 2015 average - $1.75

13One year performance update
What we anticipated What we’re seeing
Goal #2: Provide a faster and more
predictable trip
• Faster Trip: Express toll lanes will provide a faster trip.
• Move More Vehicles and People: By moving traffic more efficiently, we’ll also move people.
• More Predictable: The previous HOV lane moved traffic at 45 mph on average 60 percent of the time.
• Faster Trip: Express toll lanes are saving drivers between 10-15 minutes. Speeds in the general purpose lanes have improved in most areas.
• Move More Vehicles and People: • Express toll lanes are moving more
vehicles per hour, per lane than the previous HOV lane.
• On average, depending on the location, I-405 is moving 9,000 more people in the peak hour, peak direction; or 8 percent more people than the corridor before tolling.
• More Predictable: Express toll lanes keep traffic moving at 45 mph on average 85 percent of the time.

What we’re seeing: Express toll lanes moving more
vehicles per hour than previous HOV lanes
14One year performance update
Performance of HOV (2015) vs. ETL (2016)Dual Lane Section: Northbound I-405 (north of NE 85th St) Speeds and Volumes
Northbound dual express toll lane is moving 300-700 more vehicles per hour per lane than the previous HOV lane
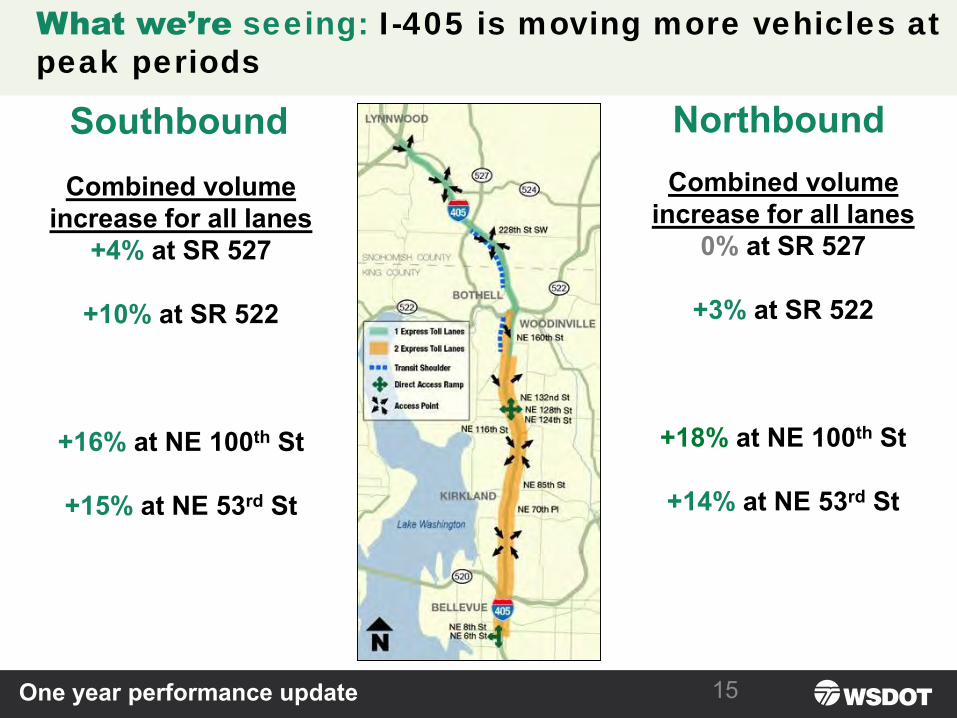
What we’re seeing: I-405 is moving more vehicles at
peak periods
15One year performance update
Combined volume increase for all lanes
+4% at SR 527
+10% at SR 522
+16% at NE 100th St
+15% at NE 53rd St
Combined volume increase for all lanes
0% at SR 527
+3% at SR 522
+18% at NE 100th St
+14% at NE 53rd St
Southbound Northbound

16One year performance update
What we’re seeing: Speeds and predictability
have improved with express toll lanes
I-405 Performance – Full Corridor Percentage of Peak Periods When Speeds are Greater Than 45 Miles Per Hour
0%
10%
20%
30%
40%
50%
60%
70%
80%
90%
100%
April - September 2015 January - June 2016 April - September 2016
Southbound Northbound
April – September 2015Before Express Toll Lanes
April – September 2016After Express Toll Lanes
January – June 2016After Express Toll Lanes

• Express toll lanes have improved the percentage of time speeds are meeting 45 mph by 25 percent compared to the HOV lane in 2015.
• In the last six months the express toll lanes have maintained speeds of 45 mph 85 percent of the time during peak periods, below the goal of 90 percent. This is due to two factors:
1) Limited capacity. Capacity was not changed between Bothell and Lynnwood on northbound I-405. The speeds in the single express toll lane dictates whether or not the express toll lanes meet the 45 mph metric.
2) Increasing demand. Significant regional growth has led to more drivers choosing to use the express toll lanes, therefore putting more strain on the single lane section.
• WSDOT is looking at a variety of operational improvements to address the capacity constraints on northbound I-405 between Bothell and Lynnwood.
What we’re seeing:
Challenges with maintaining 45 mph
17One year performance update

Drivers made 6,000 more weekday peak period trips in the express toll lanes in September 2016 compared to October 2015.
18
What we’re seeing:
Increasing demand during peak periods
One year performance update
0
2,000
4,000
6,000
8,000
10,000
12,000
14,000
16,000
18,000
Oct-15 Nov-15 Dec-15 Jan-16 Feb-16 Mar-16 Apr-16 May-16 Jun-16 Jul-16 Aug-16 Sep-16
Average Weekday Peak Period Express Toll Lane Trips by Month
Southbound 5-9 a.m., Northbound 3-7 p.m.
Southbound AM Northbound PM
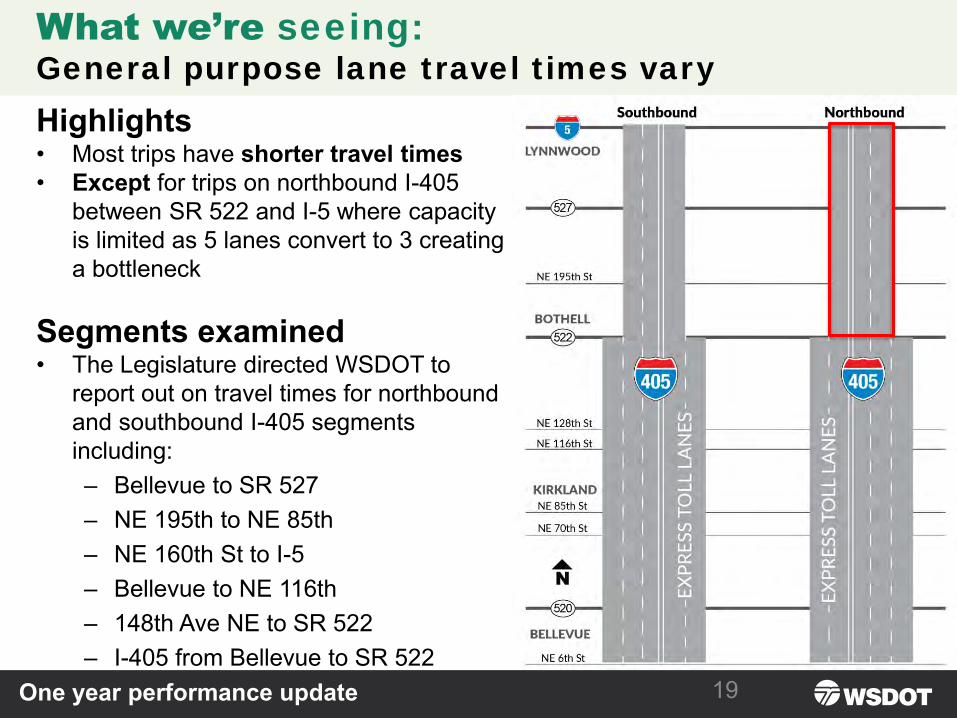
What we’re seeing:
General purpose lane travel times vary
19One year performance update
Highlights• Most trips have shorter travel times• Except for trips on northbound I-405
between SR 522 and I-5 where capacity is limited as 5 lanes convert to 3 creating a bottleneck
Segments examined• The Legislature directed WSDOT to
report out on travel times for northbound and southbound I-405 segments including:– Bellevue to SR 527 – NE 195th to NE 85th – NE 160th St to I-5 – Bellevue to NE 116th – 148th Ave NE to SR 522 – I-405 from Bellevue to SR 522
20One year performance update
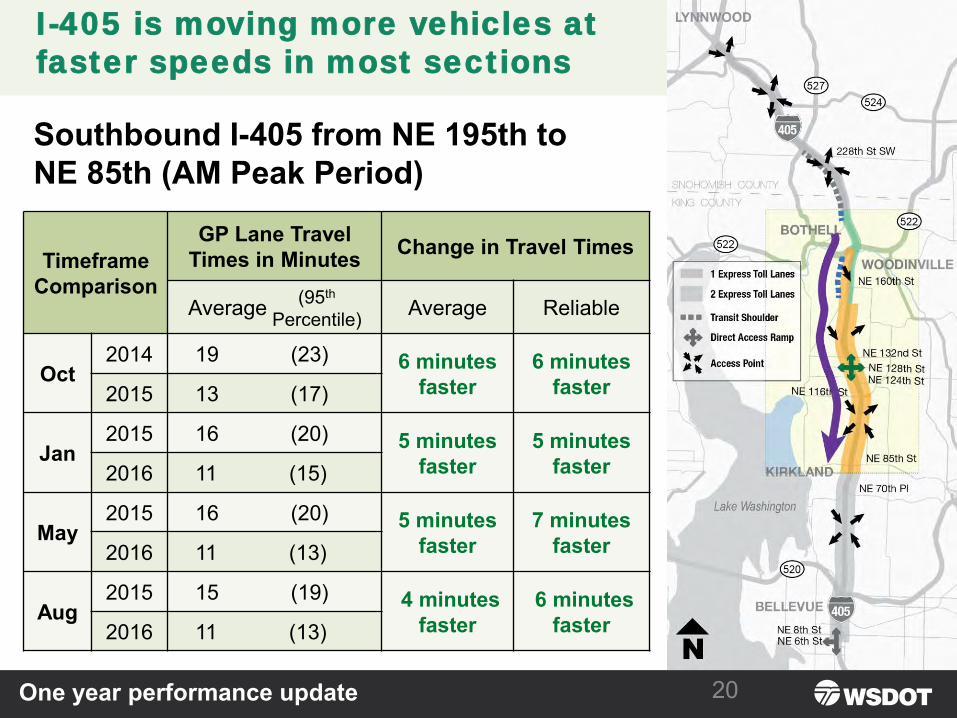
I-405 is moving more vehicles at
faster speeds in most sections
TimeframeComparison
GP Lane Travel Times in Minutes Change in Travel Times
Average Average Reliable
Oct2014 19 (23) 6 minutes
faster6 minutes
faster2015 13 (17)
Jan2015 16 (20) 5 minutes
faster5 minutes
faster2016 11 (15)
May 2015 16 (20) 5 minutes
faster7 minutes
faster2016 11 (13)
Aug2015 15 (19) 4 minutes
faster6 minutes
faster2016 11 (13)
Southbound I-405 from NE 195th to NE 85th (AM Peak Period)
(95th
Percentile)

21One year performance update
I-405 is moving more vehicles at
faster speeds in most sections
TimeframeComparison
GP Lane Travel Times in Minutes Change in Travel Times
Average Average Reliable
Oct2014 15 (18) 3 minutes
faster1 minute
faster2015 12 (17)
Jan2015 15 (19) 3 minutes
faster2 minutes
faster2016 12 (17)
May 2015 15 (19) 1 minute
faster No change2016 14 (19)
Aug2015 14 (17) No
change2 minutes
slower2016 14 (19)
Northbound I-405 from NE 85th to NE 195th (PM Peak Period)
(95th
Percentile)

22One year performance update
Limited capacity causes bottleneck
northbound at NE 160th St
TimeframeComparison
GP Lane Travel Times in Minutes Change in Travel Times
Average Average Reliable
Oct2014 13 (19) 3 minutes
slower7 minutes
slower2015 16 (26)
Jan2015 12 (20) 4 minutes
slower6 minutes
slower2016 16 (26)
May 2015 13 (19) 3 minutes
slower7 minutes
slower2016 16 (26)
Aug2015 12 (19) 5 minutes
slower6 minutes
slower2016 17 (25)
Northbound I-405 from NE 160th St toI-5 (PM Peak Period)
(95th
Percentile)

What is a peak-use shoulder lane?• Traffic management strategy that uses a
shoulder as a general purpose lane to provide additional capacity when needed (peak periods)
• Shoulder is preserved when traffic volumes are lower
• Dynamically controlled using overhead electronic signs
Peak-Use Shoulder Lane
Northbound I-405 from SR 527 to I-5
23
Timeline• November 2016: Design-build
contractor selected• Graham Contracting Ltd. • Funded with I-405 express toll
lane revenue
• Winter 2016: Construction start• Spring 2017: Open to traffic
Scope• Convert right shoulder to general purpose
peak-use shoulder lane on northbound I-405 between SR 527 and I-5
• Build new noise wall for area residents• Make other spot improvements

24
Goal #3: Fund future corridor improvements
One year performance update
What we anticipated What we’re seeing
• Fund future projects: The Connecting Washington transportation package identified $200 million in toll revenue for funding I-405 Express Toll Lanes between Bellevue and Renton.
• Fund future projects: Higher utilization during first year of operation provided sufficient revenue to fund the Peak Use Shoulder Lane project. Toll revenue generation anticipated to support Connecting Washington project funding.

– Operational hours• Mon-Fri 5 a.m. to 7 p.m.
– Toll rate algorithm adjustments– Striping and access adjustments at 9
locations– Additional pavement markings and
signage at 3 locations
What we’ve done
Completed improvements
25One year performance update

26
False. Our customer service vendor is paid for the work they are contracted and not based on how much toll revenue is generated. All of their staff are Washington state locals.In the first six months of operations, this vendor received 9 percent of the total revenue to operate the customer service center.
One year performance update
Myth Busters: “70 percent of toll revenue goes to
a company in Texas”
Future Improvements 60%
Expenses,31%
Customer Service Center 9%
Use of Funds(April – Sept. 2016)

Key takeaways
In the first year of operation, express toll lanes are:
– Moving more vehicles and more people.
– Providing more predictable travel times.
– Continuing to see express toll lane user base growth.
– With no added capacity, the single express toll lane section struggles to handle the increasing demand from regional growth.
– Generating revenue to fund improvements earlier than anticipated.
27

CONTACT
Patty Rubstello, P.E.
Assistant Secretary
WSDOT Toll Division
206-464-1299
28

I-405 is moving more vehicles at
faster speeds in most sections
29One year performance update
TimeframeComparison
GP Lane Travel Times in Minutes Change in Travel Times
Average Average Reliable
Oct2014 28 (38) 2 minutes
faster4 minutes
faster2015 26 (34)
Jan2015 28 (36) 3 minutes
faster1 minute
faster2016 25 (35)
May 2015 28 (38) 2 minutes
faster4 minutes
faster2016 26 (34)
Aug2015 27 (33) 1 minute
slower1 minute slower2016 28 (34)
(95th
Percentile)
Northbound I-405 from Bellevue to SR 527 (PM Peak Period)

I-405 is moving more vehicles at
faster speeds in most sections
30One year performance update
TimeframeComparison
GP Lane Travel Times in Minutes Change in Travel Times
Average Average Reliable
Oct2014 16 (24) 3 minutes
faster6 minutes
faster2015 13 (18)
Jan2015 16 (22) 4 minutes
faster4 minutes
faster2016 12 (18)
May 2015 16 (23) 4 minutes
faster7 minutes
faster2016 12 (16)
Aug2015 16 (21) 3 minutes
faster5 minutes
faster2016 13 (16)
(95th
Percentile)
Northbound I-405 from Bellevue to NE 116th (PM Peak Period)

I-405 is moving more vehicles at
faster speeds in most sections
31One year performance update
TimeframeComparison
GP Lane Travel Times in Minutes Change in Travel Times
Average Average Reliable
Oct2014 12 (13) 2 minutes
faster2 minutes
faster2015 10 (11)
Jan2015 11 (13) 2 minutes
faster1 minute
faster2016 9 (12)
May 2015 11 (13) 2 minutes
faster2 minutes
faster2016 9 (11)
Aug2015 10 (11) 1 minute
faster1 minute
faster2016 9 (10)
(95th
Percentile)
Southbound I-405 from NE 116th St to Bellevue (AM Peak Period)

I-405 is moving more vehicles at
faster speeds in most sections
32One year performance update
TimeframeComparison
GP Lane Travel Times in Minutes Change in Travel Times
Average Average Reliable
Oct2014 27 (38) 7 minutes
faster11 minutes
faster2015 20 (27)
Jan2015 26 (32) 6 minutes
faster3 minutes
faster2016 20 (29)
May 2015 28 (40) 6 minutes
faster11 minutes
faster2016 22 (29)
Aug2015 24 (30) 1 minute
faster1 minute
faster2016 23 (29)
(95th
Percentile)
Westbound SR 520 at 148th Ave NE to Northbound I-405 at SR 522 (PM Peak Period)

I-405 is moving more vehicles at
faster speeds in most sections
33One year performance update
TimeframeComparison
GP Lane Travel Times in Minutes Change in Travel Times
Average Average Reliable
Oct2014 23 (27) 5 minutes
faster6 minutes
faster2015 18 (21)
Jan2015 21 (25) 5 minutes
faster5 minutes
faster2016 16 (20)
May 2015 21 (24) 5 minutes
faster6 minutes
faster2016 16 (18)
Aug2015 20 (23) 5 minutes
faster6 minutes
faster2016 15 (17)
(95th
Percentile)
Southbound I-405 at SR 522 to Eastbound SR 520 at 148th Ave NE (AM Peak Period)
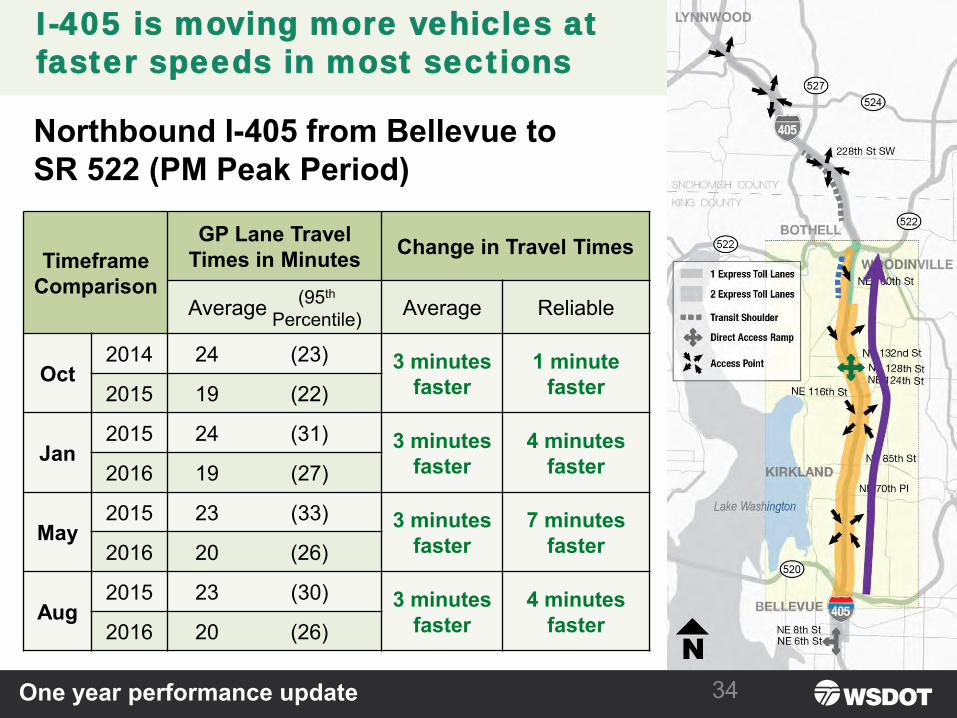
I-405 is moving more vehicles at
faster speeds in most sections
34One year performance update
TimeframeComparison
GP Lane Travel Times in Minutes Change in Travel Times
Average Average Reliable
Oct2014 24 (23) 3 minutes
faster1 minute
faster2015 19 (22)
Jan2015 24 (31) 3 minutes
faster4 minutes
faster2016 19 (27)
May 2015 23 (33) 3 minutes
faster7 minutes
faster2016 20 (26)
Aug2015 23 (30) 3 minutes
faster4 minutes
faster2016 20 (26)
(95th
Percentile)
Northbound I-405 from Bellevue to SR 522 (PM Peak Period)

I-405 is moving more vehicles at
faster speeds in most sections
35One year performance update
TimeframeComparison
GP Lane Travel Times in Minutes Change in Travel Times
Average Average Reliable
Oct2014 21 (25) 2 minutes
faster3 minutes
faster2015 19 (22)
Jan2015 19 (22) 5 minutes
faster5 minutes
faster2016 14 (17)
May 2015 19 (22) 5 minutes
faster6 minutes
faster2016 14 (16)
Aug2015 17 (20) 4 minutes
faster5 minutes
faster2016 13 (15)
(95th
Percentile)
Southbound I-405 from SR 522 to Bellevue (AM Peak Period)

I-405 is moving more vehicles at
faster speeds in most sections
36One year performance update
TimeframeComparison
GP Lane Travel Times in Minutes Change in Travel Times
Average Average Reliable
Oct2014 33 (40) 9 minutes
faster11 minutes
faster2015 24 (29)
Jan2015 27 (35) 5 minutes
faster6 minutes
faster2016 22 (29)
May 2015 28 (34) 7 minutes
faster9 minutes
faster2016 21 (25)
Aug2015 25 (33) 4 minutes
faster9 minutes
faster2016 21 (24)
(95th
Percentile)
Southbound I-405 from SR 527 to Bellevue (AM Peak Period)


