
Walking the REDD+ line: Insights from CIFOR’s REDD+ Global Comparative
Study - incentives, MRV, strategy, government reform
COP 23, 9. November 2017, Bonn Germany
1
Arild Angelsen Professor, School of Economics and Business,
Norwegian University of Life Sciences (NMBU), Ås, Norway & Senior Associate, CIFOR , Bogor, Indonesia

GCS
REDD+ Research modules
& partner-centered
knowledge-sharing
Project phases
REDD+ today
• UNFCCC Policy framework (Warsaw, Paris)
• An umbrella term for:
1. Efforts at all scales where a primary objective is to reduce
emissions from deforestation and forest degradation, and
carbon stock enhancement
2. Have some elements of result-/performance-based payment
Variations in interpretations;
1. Limit to international level (a UNFCCC mechanism)
2. Include plantations
3. REDD+ = PES ?
4. Include non-carbon objectives
5. Mitigation and adaptation
3

Q1: How can REDD+ contribute
to trans. change at national level?
4
Governance• Key aspects
– Structures: Institutions
– Agents: interests, information, ideas/discourses (4I)
• Trajectories of transformational change
– Shifts in:
• Discursive practices
• Incentive structures
• Power relations
• Methods: policy, media discourses, networks analyses
Key finding:
• Powerful discourse coalitions talk BAU
5
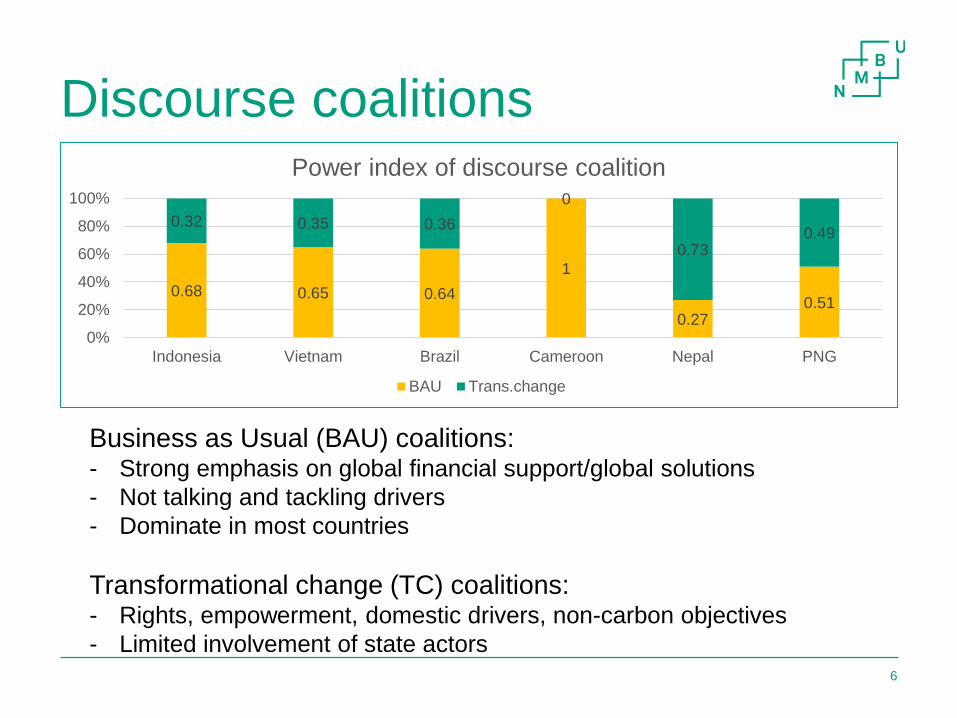
Discourse coalitions
0.68 0.65 0.64
1
0.270.51
0.32 0.35 0.36
0
0.730.49
0%
20%
40%
60%
80%
100%
Indonesia Vietnam Brazil Cameroon Nepal PNG
Power index of discourse coalition
BAU Trans.change
6
Business as Usual (BAU) coalitions: - Strong emphasis on global financial support/global solutions
- Not talking and tackling drivers
- Dominate in most countries
Transformational change (TC) coalitions:- Rights, empowerment, domestic drivers, non-carbon objectives
- Limited involvement of state actors

What brings about Trans. Change?
OUTCOME: Comprehensive policies for TC
Institutional setting
Forest scarcity (PRES)
Effective leg., policy & gov.
(EFF)
Initiated pol. change (CHA)
Policy arena
National ownership
(OWN)
Inclusive pol. process (INCL)
REDD+ perfor.-based funds
(PERFO) 7
6 of 13 countries had
successful outcomes
(2014): Brazil, DRC,
Guyana, Indonesia,
Tanzania, Vietnam
7 have not so far (2014):
Burkina Faso, Cameroon,
Ethiopia, Mozambique,
Nepal, Peru, PNG
Results:
CHA, even on its own, is
sufficient under inst.setting
PERFO can make a
difference, but only if
combined with OWN

Q2: Is REDD+ “lost in translation”
– or “improved by translation”?
• What happens when top down meets bottom up?
• Actor Network Theory
– Ideas don’t simply spread, but do so by network
• Central Kalimantan, Indonesia
– Pilot province (2010)
– Many actors & funding sources 8

STRADA – Regional Strategy
and Action Plan for REDD+
The actors:
• International actors (foreign donors)
– Viewed themselves as basic supporters of REDD+, transferring
knowledge, skills and Rupiahs
• National governments
– Sought to establish themselves in charge, in collaboration with
foreign donors
• Provincial governments
– Establish themselves as obligatory passage points (OPP)
• Local NGOs
– Partially-aligned positions: advocacy & community engagement
9

Local communities
• Seeking to redefine REDD+ as community development,
poverty reduction, welfare, dignity and local rights
• Major problems to understand and participate, in part due
to the uncertainty about REDD+:
“The principle of REDD+ is that you will be paid not to cut
down trees. We do not know how much you will be paid, when
you will be paid, or even whether you will in fact be paid, and,
if so, the money will be paid directly or if the local community
will be rewarded in other forms such as the provision of a
school, a clinic, a new road or whatever. Do you agree to
accept this scheme?” (Howell, 2014)
• Would you sell you car based on this?
• Strong hostility towards UNDP as the fund manager
– Selection of UN organizations
– Bamboo climate communication centre 10

Lessons
• Is the project addressing the drivers?
– “The STRADA document illustrates this tension; it identifies
policy and commercial causes of deforestation, but maintains
that Central Kalimantan ‘as the first pilot province for REDD+
implementation in Indonesia is based on the principle of
community’”
• “We don’t want to be a guinea pig for their tests” (villager)
– “Local actors tended to see themselves as subjects of
controlled lab experiments, or guinea pigs, rather than as
having agency and control of their options—as pioneers
chartering the local terrain of REDD+ on behalf of Indonesia and
the world.”
• REDD+ in the social context
– “Successes …are not outcomes of singular efforts, but
negotiated through ‘lengthy social processes to build linkages
and foster learning’” 11

THINKING beyond the canopy
Studies of sub-national REDD+
initiatives
1. round: 23 sub-national initiatives (projects)
2. round: 17

THINKING beyond the canopy
Comparison (Control)
REDD+ site(Intervention)
Before After
IMPACT
Intervention
After
Control
After
Intervention
Before
Control
Before
Method: BACI
Sampled 150 communities and ~4,000 households
Combined measures of tree cover change (Global Forest
Change 2000-2014) and socio-economic variables
(collected through field surveys in 2010 and 2014) using
BACI approach

Q3: Is BACI (= the gold
standard) feasible?
• Initial matching of control and intervention villages based
on Rapid Rural Appraisal
• At hindsight (with detailed household and village level
data): How good was the matching?14
Results
• Significant initial different in many respects
– Intervention villages generally poorer (assets, infrastructure),
but not in average income
– Intervention villages have more forest
• Not all everyone in interventional villages are subject to
treatments, and some in control villages
• Implications:
– Need to take those differences into account in analysis, e.g.
matching methods
– Also analysis at household level
15

The value of BACI
• The value of baseline data
– Compare initial differences, and control for them
• Reluctance among conservation org. to implement
rigorous impact assessment (BACI)
– High costs
– Work in non-intervention villages
– Risk of documenting no-success
• Impact evaluations generates knowledge that is a public
good
– Donors to sponsor explicitly
16

Q4: Did REDD+ projects
reduce forest loss?(and does the answer depend on the method?)
• Landsat/Hansen data: tree cover change
– Forest: >10% tree cover
• Change in relative, annual forest loss (percentage points)
17

18
BACI score
BA score

19

Findings
• BACI shows better results than BA
– Comforting as BACI is superior (it corrects for higher scale trends
or drivers)
• Better performance at micro (village) than at meso
(project/district) level
– Higher local treatment intensity
– Leakage
• Overall performance
– 9 (out of 16) sites with BACI at village level with positive
performance, and average BACI result good
– No obvious explanation why some more successful than others
20
Q5: What does REDD+ cost?
• Focus on opportunity costs and how it varies across
income groups (low, middle, high)
21

COST 101
• Opp.cost: best alternative use of one ha of forest
– Agric rent (profit), minus (sustainable) forest income
• Annual or NPV? Per ha, C, CO2, household … 22
Actor 1. Oppor-
tunity costs
(OC) (ag.rent)
2. Implem./
Transaction
costs (TC)
3. Transfers 4. Net direct
benefit
(1+2+3)
Forest user 1 -50 75 25
Forest user 2 -50 -50
Forest user 3 75 75
Village -40 30 -10
NGO (prop.) -60 80 20
Local govt. -60 20 -40
Nat. govt. -20 50 30
Foreign donor -10 -330 -340
Sum -100 -190 0 -290

Efficiency: Opp.costs (OC)
per tC
•𝑂𝐶 𝑝𝑒𝑟 𝑡𝐶 =𝑎𝑔𝑟𝑖𝑐 𝑖𝑛𝑐𝑜𝑚𝑒 𝑝𝑒𝑟 ℎ𝑎
𝑡𝐶 𝑝𝑒𝑟 ℎ𝑎
• OC varies considerably:
– USD 0.61 – 84.29 (6.89) (annual)
– USD 6.83 – 943.90 (77.15) (NPV)
– CO2 : x 3.67
– Highest in Tanzania due to low tC/ha
• OC below voluntary market price (USD 3.30/tCO2)
in 6 out of 17 sites
– And well below Social Costs of Carbon (SCC, USD 36/tCO2) in
all sites except one (so, REDD+ is cheap in terms of OC) 23

Equity: Opp.costs (OC) at
household level•𝑂𝐶 𝑝𝑒𝑟 ℎ𝑜𝑢𝑠𝑒ℎ𝑜𝑙𝑑= 𝑂𝐶 𝑝𝑒𝑟 ℎ𝑎 ∗ 𝑝𝑙𝑎𝑛𝑛𝑒𝑑 𝑓𝑜𝑟𝑒𝑠𝑡 𝑐𝑜𝑛𝑣𝑒𝑟𝑠𝑖𝑜𝑛 (ℎ𝑎)
How much forests will be cleared in BAU?
– Reference level or additionality
– Lower bond: recent forest clearing (historical ref.level)
– Upper bound: current agric land
24
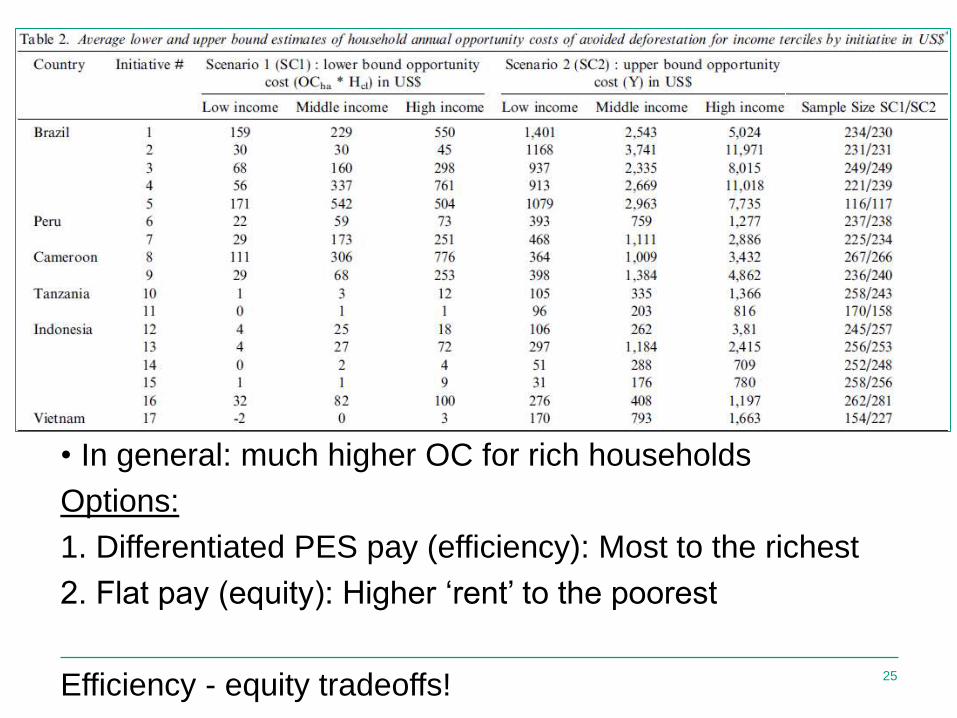
• In general: much higher OC for rich households
Options:
1. Differentiated PES pay (efficiency): Most to the richest
2. Flat pay (equity): Higher ‘rent’ to the poorest
Efficiency - equity tradeoffs! 25

Q6: Did REDD+ projects
comply with safeguards?
• Change in
3 aspects:
1. Rights (tenure security)
2. Participation (knowledge and participation)
3. Social co-benefits (SWB)
• Does the impact vary by type of intervention?
– Incentives
–Sticks
–Both +
26
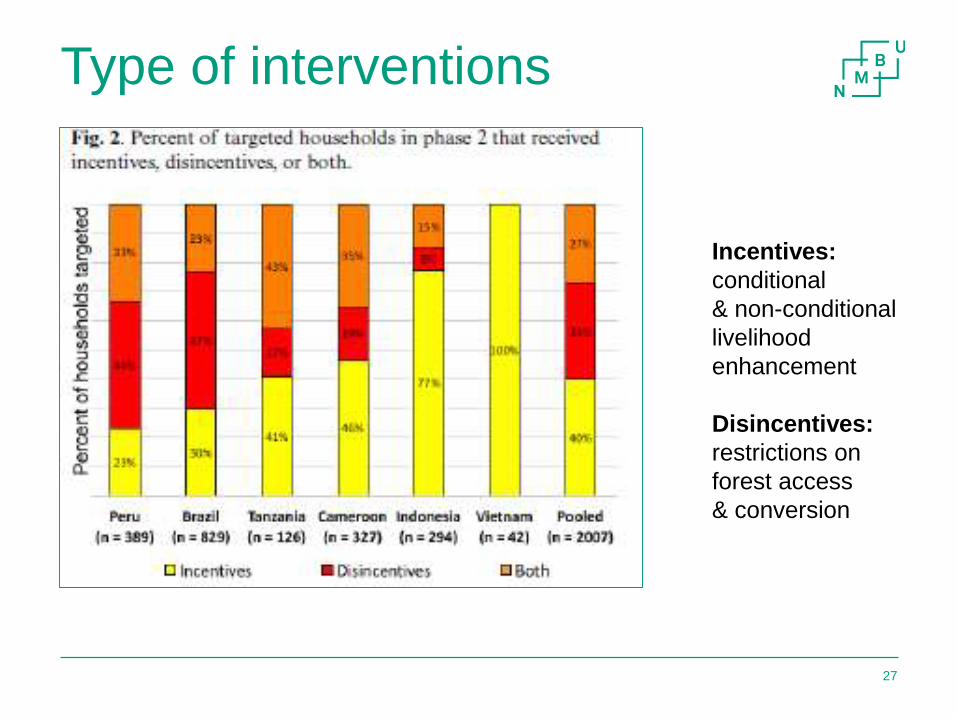
Type of interventions
27
Incentives:
conditional
& non-conditional
livelihood
enhancement
Disincentives:
restrictions on
forest access
& conversion

Tenure insecurity
17
13
17
2123
17
1113
32
22
-
5
10
15
20
25
30
35
All None Incentives Disincentives Both
Perc
en
t
Perceived tenure insequrity (%)
Phase 1 (before) Phase 2 (after)
28
- CAC measures tend to reduce tenure security
- Positive incentives tend to increase it
- Country variation:
- Tanzania: 6 -> 0 %
- Indonesia: 17 -> 11 %
- Vietnam: 12 -> 20 %
- Other 3: slightly up

Knowledge and participation
55.5
89.9
80.8
94.9
24.4
57.9
33.5
74
0
10
20
30
40
50
60
70
80
90
100
None Incentives Disincentives Both
Knowledge and participation (%)
Knowledge Participation
29
- Nearly 80 % aware of the local REDD+ initiative
- Ca. 50% participated in design and/or implementation
- Some expected variation across intervention type
- Brazil: Only 14% participation for disincentives (CAC),
while 62% for incentives
Subjective well-being (SWB)
• Q1: How has SWB changed past 2 years?
– More report (34-48%) positive change than negative change (20-
28%)
– Small difference between type of intervention (‘disincentives’ do
not report worse off)
• Q2: How has intervention affected SWB?
– Overall, weakly positive (score ca. 3.5 on Lickert scale)
– Disincentives slightly more negative; In Brazil: 3.94
30

Forest clearing
• Evidence of effectiveness of disincentives in reducing
clearing (except Indonesia)
• Trade-off carbon
effectiveness and
tenure security and
well-being
• Inherent tension
between carbon
and non-carbon
values
31

Q7: Why has REDD+ not met our
initial (optimistic) expectations?
32
0
1.0e
+06
2.0e
+06
3.0e
+06
4.0e
+06
2000 2005 2010 2015year
loss25_brazil loss25_drc
loss25_indonesia

A1: REDD+ is too small
• Not implemented at a scale needed to make a difference
• Initial proposals: USD 10-15 billion/year
• Actual international transfer: ca. USD 10 billion so far,
and declining (< 1 billion/year)
• “It will, however, be possible to achieve large-scale and sustainable
reductions in greenhouse gas emissions from deforestation and
forest degradation in developing countries only if these emissions are
included in a global post-2012 climate regime.”
(Erik Solheim, 2008 in “Moving Ahead with REDD”)
• Still waiting for that climate regime
=> Simply not enough funding to make conservation more
profitable than forest clearing!33

A2: Strong Business-as-Usual (BAU)
interests continue to dominate
• Linked to A1: not enough funding to change basic equation
– REDD was (to some) supposed to buy out BAU interests
• Powerful BAU coalitions, as seen
– Indonesia
– Brazil
• Some local successes
– Indonesia: statutory community ownership
34

A3: No national policies nor PES,
only ineffective ICDP
• Integrated Conservation and Development
Projects/Programmes (ICDPs)
– Alternative livelihoods
– Extension and education
– Enforcement
• Textbook PES with hard conditionality not common
– “Unconditional PES” – a contradiction
• Strong projectification of REDD+
– NGOs ready to relabel projects to tap into new funding
– REDD+ marginalized to “harmless” (to BAU projects?
– Projects win battles, policies win the war
35
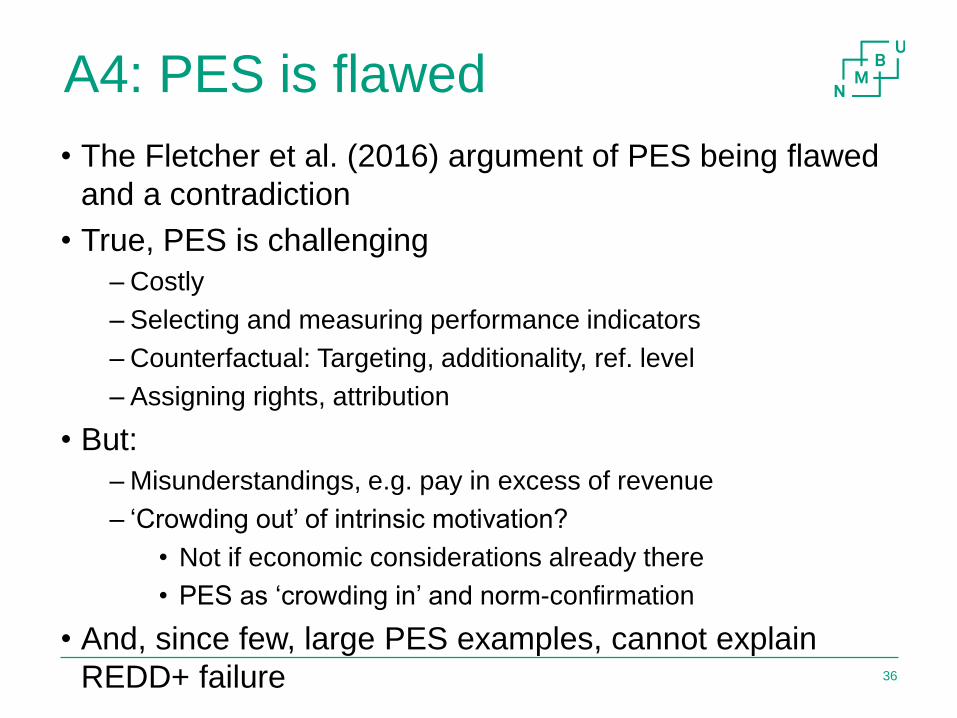
A4: PES is flawed
• The Fletcher et al. (2016) argument of PES being flawed
and a contradiction
• True, PES is challenging
– Costly
– Selecting and measuring performance indicators
– Counterfactual: Targeting, additionality, ref. level
– Assigning rights, attribution
• But:
– Misunderstandings, e.g. pay in excess of revenue
– ‘Crowding out’ of intrinsic motivation?
• Not if economic considerations already there
• PES as ‘crowding in’ and norm-confirmation
• And, since few, large PES examples, cannot explain
REDD+ failure 36
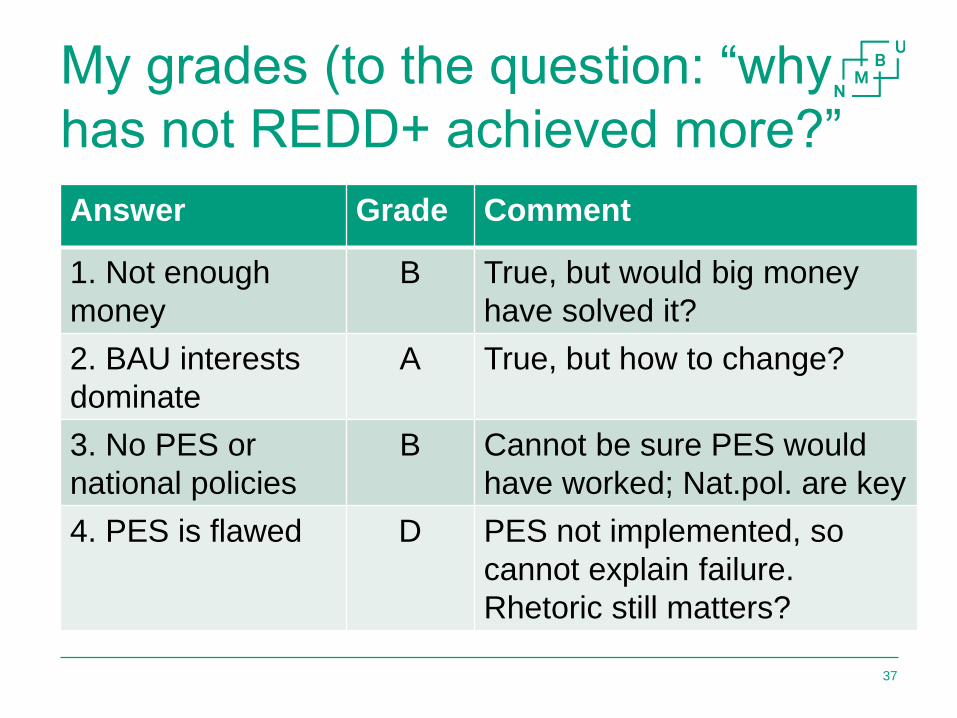
My grades (to the question: “why
has not REDD+ achieved more?”
Answer Grade Comment
1. Not enough
money
B True, but would big money
have solved it?
2. BAU interests
dominate
A True, but how to change?
3. No PES or
national policies
B Cannot be sure PES would
have worked; Nat.pol. are key
4. PES is flawed D PES not implemented, so
cannot explain failure.
Rhetoric still matters?
37
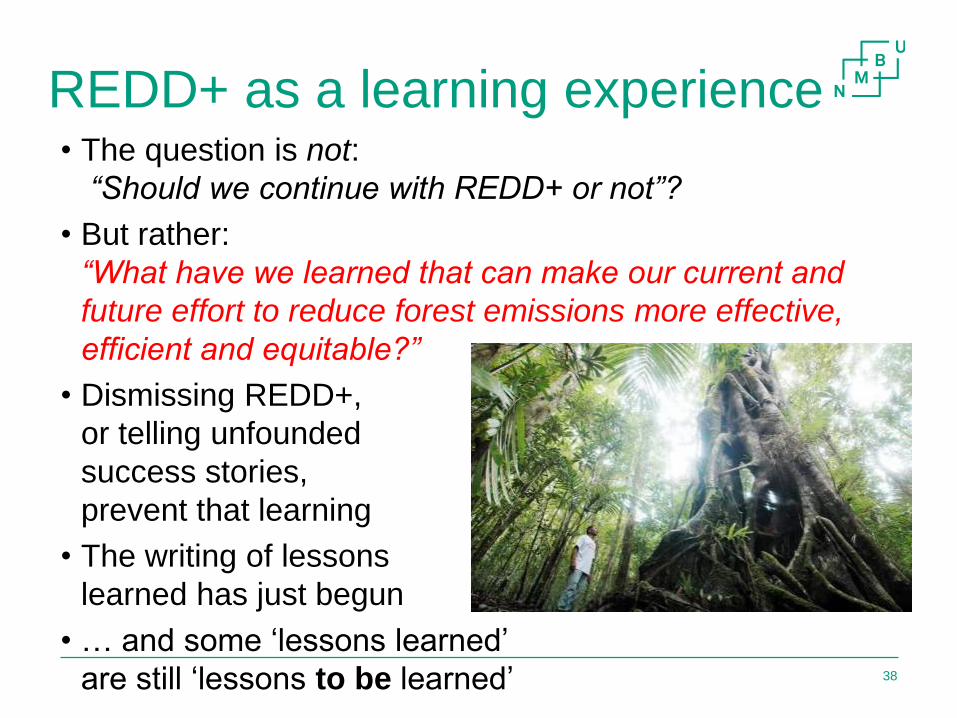
REDD+ as a learning experience • The question is not:
“Should we continue with REDD+ or not”?
• But rather:
“What have we learned that can make our current and
future effort to reduce forest emissions more effective,
efficient and equitable?”
• Dismissing REDD+,
or telling unfounded
success stories,
prevent that learning
• The writing of lessons
learned has just begun
• … and some ‘lessons learned’
are still ‘lessons to be learned’ 38

Thanks
… for valuable inputs and discussions in preparing this
presentation:
–Astrid Bos
–Maria Brockhaus
–Amy E Duchelle
–Martin Herold
–Amy Ickowitz
–Anne Larsson
–Christopher Martius
–Erin Sills
39

Principal papers• Angelsen, A., Brockhaus, M., Duchelle, A. E., Larson, A., Martius, C., Sunderlin, W. D., Verchot, L., Wong,
G., Wunder, S., 2017. Learning from REDD+: a response to Fletcher et al., Conservation Biology. 31, 718-
720.
• Bos, A. B., Duchelle, A., Angelsen, A., Avitabile, V., De Sy, V., Herold, M., Joseph, S., de Sassi, C., Sills, E.,
Sunderlin, W., 2017. Comparing methods for assessing the effectiveness of subnational REDD+
initiatives, Environmental Research Letters, 12.
• Brockhaus, M., Di Gregorio, M., Mardiah, S., 2014. Governing the design of national REDD+: An analysis
of the power of agency, Forest Policy and Economics. 49, 23-33.
• Brockhaus, M., Korhonen-Kurki, M. K., Sehring, J., Di Gregorio, M., Assembe-Mvondo, S., Babon, A.,
Bekele, M., Gebara, M. F., Khatri, D.B., Kambire, H., Kengoum, F., Kweka, D., Menton, M., Moeliono, M.,
Paudel, N. S., Pham, T.T., Resosudarmo, I. A.P., Sitoe, A., Wunder, S. & Zida, M., 2017. REDD+,
transformational change and the promise of performance-based payments: a qualitative comparative analysis,
Climate Policy. 17, 708-730.
• Duchelle, A., de Sassi, C., Jagger, P., Cromberg, M., Larson, A., Sunderlin, W., Atmadja, S., Resosudarmo, I.
A. P., Pratama, C. D., 2017. Balancing carrots and sticks in REDD+: implications for social
safeguards, Ecology and Society. 22.
• Ickowitz, A., Sills, E., de Sassi, C., 2017. Estimating Smallholder Opportunity Costs of REDD+: A
Pantropical Analysis from Households to Carbon and Back, World Development. 95, 15-26.
• Sanders, A. J., da Silva Hyldmo, H., Ford, R. M., Larson, A. M., Keenan, R. J., 2017. Guinea pig or pioneer:
Translating global environmental objectives through to local actions in Central Kalimantan, Indonesia’s
REDD+ pilot province, Global Environmental Change. 42, 68-81.
• Sills, E. O., de Sassi, C., Jagger, P., Lawlor, K., Miteva, D. A., Pattanayak, S. K., Sunderlin, W. D., 2017.
Building the evidence base for REDD+: Study design and methods for evaluating the impacts of
conservation interventions on local well-being, Global Environmental Change. 43, 148-160.
40

Financial support for GCS REDD+
www.cifor.org/gcs


