
2016 Annual Sponsored by
Co-sponsored by
US PE Middle Market
ReportIn partnership with

Take everyone’s game to the next level
Deloitte serves private equity investors extensively, applying our business and sector experience to help their portfolio companies enhance financial reporting, improve operations, and solve challenges. Visit www2.deloitte.com/us/pe.
Audit | Tax | Consulting | Advisory
Copyright © 2017 Deloitte Development LLC. All rights reserved.

Credits & ContactPitchBook Data, Inc.
JOHN GABBERT Founder, CEO
ADLEY BOWDEN Vice President,
Market Development & Analysis
Content
DYLAN E. COX Analyst
NIZAR TARHUNI Senior Analyst
GARRETT JAMES BLACK Publisher
BRYAN HANSON Data Analyst
JENNIFER SAM Senior Graphic Designer
Contact PitchBook pitchbook.com
RESEARCH
EDITORIAL
SALES
ACG GlobalGARY LABRANCHE President & CEO
KRISTIN GOMEZ Vice President,
Communications & Marketing
DEBORAH COHEN Editor-in-Chief
COPYRIGHT © 2017 by PitchBook Data, Inc. All rights reserved. No part of this publication may be reproduced in any form or by any means—graphic, electronic, or mechanical, including photocopying, recording, taping, and information storage and retrieval systems—without the express written permission of PitchBook Data, Inc. Contents are based on information from sources believed to be reliable, but accuracy and completeness cannot be guaranteed. Nothing herein should be construed as any past, current or future recommendation to buy or sell any security or an offer to sell, or a solicitation of an offer to buy any security. This material does not purport to contain all of the information that a prospective investor may wish to consider and is not to be relied upon as such or used in substitution for the exercise of independent judgment.
Methodology 4
Introduction 5
Note from ACG 6
Overview 8-9
Deloitte Q&A: How Can PE Succeed
in 2017?10
Lower Middle Market 11
Core Middle Market 12
Upper Middle Market 13
Company Inventory 15
Exits 16
Fundraising 17
League Tables 18
CONTENTS
IN PARTNERSHIP WITH
CO-SPONSOR
SPONSORED BY
3 PITCHBOOK 2016 ANNUAL US PE MIDDLE MARKET REPORT

METHODOLOGY
At Deloitte, we believe the audit is more than an obligation—it’s an opportunity to see further and deeper into the business. That is the approach we take with private equity investors’ (PEI) portfolios. It helps that Deloitte is able to bring the full power of one of the largest professional services organizations in the world to each engagement—not
to mention a deep understanding of the unique characteristics of the PEI market and business model. We know that portfolio companies look for a high level of commitment and resources, and we can access a network of seasoned individuals with M&A and IPO experience to help address their issues.
Deloitte’s Private Equity Portfolio Company Program provides a single point of contact for PEI clients and their portfolio companies—an experienced leader able to marshal the full resources of the organization to respond to individual opportunities and challenges.
Our Private Equity Portfolio Company Program fosters an innovative culture—our people are continuously reinventing the tools, technologies and processes they use to serve the needs of PEI clients. Visit www2.deloitte.com/us/PE. As used in this document, “Deloitte” means Deloitte & Touche LLP, a subsidiary of Deloitte LLP. Please see www.deloitte.com/us/about for a detailed description of the legal structure of Deloitte USA LLP, Deloitte LLP and their respective subsidiaries. Certain services may not be available to attest clients under the rules and regulations of public accounting.
IN PARTNERSHIP WITH
CO-SPONSOR
SPONSORED BY
4 PITCHBOOK 2016 ANNUAL US PE MIDDLE MARKET REPORT
MIDDLE MARKET DEFINITIONFor this report, the middle market (MM) is defined as US-based companies acquired through buyout transactions between $25 million and $1 billion. Note that minority deals are not included. The middle market is further broken down into the lower middle market (LMM; $25 million to $100 million), the core middle market (CMM; $100 million to $500 million) and the upper middle market (UMM; $500 million to $1 billion). This report covers only US-based
middle-market companies that have received some type of private equity investment.
TOTAL CAPITAL INVESTED/DEAL VALUETotal amount of equity and debt used in the private equity investment
Ex. $10 million of equity and $20 million of debt = $30 million of total capital investment
PitchBook’s total capital invested figures include deal amounts that were not collected by PitchBook but have been estimated using a multidimensional estimation matrix, which takes into account year of investment, deal type, platform v. add-on, industry and sector. Some datasets will include these extrapolated numbers while others will be compiled using only data collected directly by PitchBook; this explains any potential discrepancies that may be noticed.
EXITSThe report includes both full and partial exits of middle-market companies via corporate acquisition, secondary private equity buyout and initial public offering (IPO). PitchBook has utilized its multidimensional substitution and estimation matrix to estimate transaction sizes where the deal amount is unknown. For the MM company inventory,
we included companies that are expected to exit between $25 million and $1 billion.
FUNDRAISINGPitchBook defines middle-market funds as PE investment vehicles with between $100 million and $5 billion in capital commitments. The report only includes PE funds that have held their final close. Funds-of-funds and LP secondary
funds are not included.
LEAGUE TABLESAll league tables are compiled using deal counts for middle-market leveraged buyouts only to better reflect the other datasets within the report, with only the Lenders table also including all PitchBook debt round types in order to capture all debt provided to facilitate buyouts. For example, the Most Active Advisors league table shows the number of US-based middle-market buyouts that a firm advised on during the fourth quarter of 2016. Deals on which a firm advised multiple parties will only be counted once for that firm.

INTRODUCTION
Look up a company.
And its cap table.
And its investors.
And its EBITDA
multiples.
And its board
members.
In seconds.
The PitchBook Platform
has the data you need
to close your next deal.
Learn more at
pitchbook.com
Key takeaways
» Competition from strategic acquirers in 2016 forced PE investors to look for
value in smaller portfolio companies.
» As managers increasingly flocked to the lower middle market, deal value
in that space increased by 21.3% last year, across approximately the same
number of transactions as in 2015.
» Median transaction size for the entire middle market decreased to $134.0
million, the lowest in three years.
Much of the concern around PE dealmaking last year had to do with political
uncertainty and anticipated macroeconomic headwinds. And while those
certainly affected dealmaking, smaller middle-market activity showed resilience
due to less exposure to those very factors.
Shrewd investors shifted focus and deployed capital at smaller enterprise
values, making selective bets and finding relative bargains. In this more crowded
environment, deal sourcing will remain difficult, and operational prowess will be
put to the test. Yet, even with the aforementioned challenges, demand for the
asset class remains relatively strong and investor confidence is high.
We hope this report is useful in your practice. As always, feel free to send any
questions or comments to [email protected].
DYLAN E. COX
Analyst
The PitchBook PlatformThe data in this report comes from the PitchBook Platform–our data
software for VC, PE and M&A. Contact [email protected] to request
a free trial.
IN PARTNERSHIP WITH
CO-SPONSOR
SPONSORED BY
5 PITCHBOOK 2016 ANNUAL US PE MIDDLE MARKET REPORT

The new administration is moving fast. Less than a month after the inauguration, President Trump and Congressional Republicans
have begun to make good on campaign promises and Republican Party priorities. Moves to curb illegal immigration, build a Mexican
border wall, repeal the Affordable Care Act, select a Supreme Court nominee, withdraw from the Trans-Pacific Partnership and
tackle major tax reform signal swift policy changes that will create opportunities and challenges for middle-market PE.
On the regulatory side, important personnel hires and changes will drive policy in the new Republican-controlled Securities and
Exchange Commission. Trump has appointed attorney Jay Clayton, a partner at Sullivan & Cromwell LLP and an adviser to Goldman
Sachs, as new SEC chairman. Once Clayton is confirmed by the Senate and takes office, creating a new regulatory and enforcement
environment will be a top priority, but change will not happen overnight. ACG will take advantage of the interim period to establish
a relationship with new SEC staff before they begin their work of reviewing regulations in earnest. Steve Mnuchin, Trump’s pick
for treasury secretary, indicated that he may loosen some financial regulations under Dodd-Frank. While Mnuchin said in January
that he supports the Volcker Rule—restricting banks from making certain speculative investments—he suggested a desire to
make some changes to Dodd-Frank’s regulatory framework. The financial services industry is watching closely to see if the Trump
Administration halts the Labor Department fiduciary rule, which expands the “investment advice fiduciary” definition under the
Employee Retirement Income Security Act, slated to take effect in April.
Trump has generated significant momentum for comprehensive tax reform, voicing support for the so-called “Better Way Forward
on Tax Reform” unveiled by the House Ways and Means Committee in June. With a current corporate tax rate of 35%, House Speaker
Paul Ryan has called for cutting the corporate tax rate to 20%. Trump is pushing for an even lower rate. ACG agrees that a lower tax
rate would have a beneficial impact on private capital investors—but there will be tradeoffs for investors.
The new policy landscape is expected to directly impact private capital providers serving the middle market. Consider the
administration’s support for eliminating the ability to deduct interest on corporate debt. Since the early twentieth century, interest
deductibility has been a key driver of growth for capital providers and many small and midsize businesses. The House GOP Blueprint
limits interest deductibility in favor of 100% expensing. This would make borrowing more expensive for the majority of businesses.
Businesses of all sizes rely on credit to fund new investments and meet operating costs; without the ability to deduct interest
the incentive to invest and grow is diminished. The treatment of carried interest from capital gains to ordinary income is another
important issue for middle-market PE. In January, the Americans for Tax Reform recently stated that higher rates on capital gains
would have a disproportionate effect on investment partnerships and hurt investors such as pension funds, colleges and charities.
ATR suggested a model contained in the House GOP blueprint that would reduce the top rate on capital gains to 16.5%.
While the new administration is moving rapidly to implement campaign promises, President Trump will ultimately face fiscal realities
that will influence policy outcomes. With a slim Republican majority in the Senate, there will continue to be challenges in clearing the
necessary 60-vote threshold to move White House policy priorities forward. As the minority party, Senate Democrats will continue
to exert significant influence in that chamber and push back on many of Trump’s campaign promises, and some fiscally conservative
House Republicans will also push back on aggressive spending.
GARY LABRANCHE, FASAE, CAE
President & CEO
ACG Global
TRUMP’S FIRST 100 DAYS AND THEIR IMPACT ON PE by Gary LaBranche
IN PARTNERSHIP WITH
CO-SPONSOR
SPONSORED BY
6 PITCHBOOK 2016 ANNUAL US PE MIDDLE MARKET REPORT

Built solid.Communicate. Commit. Deliver.®
Since 2001, our record speaks for itself...
billion of net commitments new transactions private equity sponsors
of transactions closed as Administrative Agent, Sole Lender or Co-Agent since 2012
MANUFACTURING | DISTRIBUTION | SERVICES | CONSUMER PRODUCTS | HEALTHCARE | INSURANCE/FINANCIAL SERVICES | AEROSPACE & DEFENSE | TECHNOLOGY SERVICES
Madison Capital Funding is a subsidiary of New York Life Insurance Company. MCF-1722966
170-year commitment
exceptional success for ourselves and our partners.

THE BUYOUT CYCLE SLOWEDOverview
Deal flow stifled by corporate
competition
Middle-market PE deal value totaled
$366.8 billion across 1,908 deals in
2016, representing 8.1% and 11.6% year-
over-year decreases. The slowdown
was less pronounced than that of the
overall US PE marketplace, which
saw value and volume fall by 12.0%
and 14.4% respectively last year. PE
dealmaking, no matter the size, was
hindered by competition from large
corporate acquirers. These companies,
with inflated stock prices and record
amounts of cash on their balance
sheets, are able to move quickly and
justify higher multiples than many
financial sponsors are willing to pay.
US PE middle-market activity
After back-to-back robust years, activity finally subsided
US PE middle-market activity
$281
$352
$194
$94
$237
$272
$318
$301
$441
$399
$367
1,469
1,861
1,284
719
1,299 1,460
1,876 1,704
2,155 2,159 1,908
2006 2007 2008 2009 2010 2011 2012 2013 2014 2015 2016
Deal Value ($B) # of Deals Closed
Source: PitchBook
0
100
200
300
400
500
600
700
$0
$20
$40
$60
$80
$100
$120
1Q 2Q 3Q 4Q 1Q 2Q 3Q 4Q 1Q 2Q 3Q 4Q 1Q 2Q 3Q 4Q 1Q 2Q 3Q 4Q 1Q 2Q 3Q 4Q 1Q 2Q 3Q 4Q
2010 2011 2012 2013 2014 2015 2016
Deal Value # of Deals Closed
Source: PitchBook
IN PARTNERSHIP WITH
CO-SPONSOR
SPONSORED BY
8 PITCHBOOK 2016 ANNUAL US PE MIDDLE MARKET REPORT

US PE MM deals ($B) by segmentUS PE MM deals (#) by segment
Source: PitchBook Source: PitchBook
Fishing for value in the lower middle
market
The relative resilience of the middle
market can be attributed to its
insulation from strategic competitors.
That is, the smaller the PE fund, the
less likely it is to face competition from
large corporates for the most sought-
after acquisition targets. The same also
holds true within the middle market.
Competition is pushing financial
sponsors to search for relative value in
smaller portfolio companies. The lower
middle market (LMM)—enterprise
values between $25 million and $100
million—saw deal value increase by
21.3% this year, across approximately
the same number of transactions.
Meanwhile, 28.5% fewer deals were
completed in the upper middle market
(UMM)—deals between $500 million
and $1 billion—accounting for a 20.3%
decrease in value. With the move
to lower enterprise values, median
transactions size decreased to $134.0
million in 2016, the lowest in three
years.
Pricing cools, debt usage slides
As a result of the increased activity in
the LMM last year, median EV/EBITDA
multiples decreased by more than
a turn to 8.1x, with a caveat that the
population of eligible EBITDA multiples
is admittedly small. Smaller companies,
which tend to trade at lower multiples,
are also an integral part of the add-
on strategy that has become more
popular in private dealmaking lately.
Similarly to what we saw in the overall
PE and M&A markets in the US last
year, median debt usage fell to just
50% of enterprise value. For an
asset class that traditionally relies on
substantial leverage, the decreased
debt usage could lead to difficulty in
meeting LP expectations for future
distributions. However, the easing
of pricing pressures could lead to
a healthy re-balancing of leverage
and purchase prices, if not for larger
transactions, then at least in the middle
market.
Median US PE middle-market transaction size ($M)
$138.0
$134.0
$0
$20
$40
$60
$80
$100
$120
$140
$160
2006 2007 2008 2009 2010 2011 2012 2013 2014 2015 2016
Source: PitchBook
0
100
200
300
400
500
600
700
1Q 2Q 3Q 4Q 1Q 2Q 3Q 4Q 1Q 2Q 3Q 4Q 1Q 2Q 3Q 4Q
2013 2014 2015 2016
LMM CMM UMM
IN PARTNERSHIP WITH
CO-SPONSOR
SPONSORED BY
9 PITCHBOOK 2016 ANNUAL US PE MIDDLE MARKET REPORT
$0
$20
$40
$60
$80
$100
$120
1Q 2Q 3Q 4Q 1Q 2Q 3Q 4Q 1Q 2Q 3Q 4Q 1Q 2Q 3Q 4Q
2013 2014 2015 2016
LMM CMM UMM

FRANK FUMAI
Audit Partner
Deloitte & Touche, LLP
Frank is the National Audit
Leader for Deloitte’s Private
Equity practice. For over
20 years, he has served a
diverse range of clients, including private equity
firms, publicly-traded companies, registered
investment advisors, registered broker dealer
entities, and other investment funds. Frank has
an extensive understanding of the financial
services industry, SEC registrants, and the
rules impacting the investment management
industry. He is a contributor to Deloitte’s
Investment Management Industry Outlook and
Private Equity Fair Value Survey.
TIM MUNDY National Managing
Partner, PE Program
& West Coast Asset
Management Leader
Deloitte & Touche, LLP
With more than 27 years of
public and private investment management
audit and accounting experience, Tim
specializes in providing such services to asset
management companies. Tim is the national
managing partner for the private equity
portfolio company practice, providing services
committed to supporting private equity
enterprises and portfolios with distinction. As
Deloitte’s West Coast Regional Leader of the
Investment Management Services Group, Tim is
responsible for the coordination and oversight
of the regional practice serving asset managers
and their products, including mutual funds, and
alternative investments, such as hedge funds,
private equity/venture funds.
can help attract new investments with
their track record of success.
Particularly for the US lower middle
market, what do you deem are the
most important factors in value
creation for PE buyers looking to
increase their rate of adding on to
extant platforms?
Tim: The ability to address these three
threads will prove to be important for
value creation in my opinion:
• Are there operational improvements
to achieve?
• Can the companies commit
to controls, and thus quality
enhancement?
• Where is the overall industry
heading?
Frank: A big part of investment
success at a PE firm relies on
upfront due diligence and continued
monitoring of portfolio company
investments, which help lower overall
operational risk across portfolios
while achieving value creation and
increasing chance of success. For
example:
• Performing more operations
diligence in key functional areas of
a target company, and using data
and analytics to assess and improve
performance
• Looking for best practices or
functional areas at the top-performing
portfolio companies and sharing these
ideas across the entire portfolio
Many lower-middle-market firms
can improve functional business
processes that become more critical
as these portfolio companies grow and
mature. PE firms that recognize this
opportunity and support it through
programs can play an important role
in assisting management through
development stages that often carry
growing pains.
As used in this document, “Deloitte” means Deloitte & Touche LLP, a subsidiary of Deloitte LLP. Please see http://www.deloitte.com/us/about for a detailed description of the legal structure of Deloitte USA LLP, Deloitte LLP and their respective subsidiaries. Certain services may not be available to attest clients under the rules and regulations of public accounting.
One of the evolving narratives in US
PE has been increased interest in even
lower reaches of the middle market.
How do you expect the level of
competition for quality middle-market
targets to fare in 2017, given the PE
industry’s dry powder overhang?
Tim: PE has grown dramatically over
the past decade but it has been
slowing over the past few years.
There has been a huge increase in the
number of PE firms over the last 20
years, now with approximately 5,000
PE firms globally. In response to this
competitive pressure, PE firms have
become more specialized and shifted
some of their focus to value creation
in the underlying portfolio companies.
Clearly competition will force PE firms
into new emerging markets, as well
as some niche strategies. We may
also see more joint deals amongst
competitors, as PE firms seek to put
their dry powder to work.
Frank: The competition, along with
higher values, has only intensified
the search for the perfect deal. This
search has extended across the
spectrum of firm sizes, including the
lower end of the middle market. PE
firms are seeking high-quality deals,
and in many of the best deals the PE
firms invest capital and their expertise
to drive value creation and future
investment returns. The dry powder
leads to competition, which ultimately
may lead to better match-making
between portfolio companies and PE
firms. Dry powder may also provide
some stability to the current valuations
of portfolio companies.
In this competitive dealmaking
environment, how can PE investors
further distinguish worthwhile targets
and, in turn, amend their strategies
to appeal to the management of
prospective businesses?
Tim: Specialize, specialize, and
specialize. You have to show that
you are focused on helping portfolio
companies achieve operational
change and growth, and bring value
proposition through evidence. PE
firms that have programs in place
to share leading practices across
portfolio companies may be favorably
positioned, in the eyes of potential
portfolio companies, compared to
competitors that do not. The ability to
share data analytics capabilities is an
example of an area where PE firms can
leverage scale and experience for the
benefit of portfolio companies. This
sharing of leading practices fosters
value creation, and tends to lower
overall operational risk. In this sense
the capabilities of portfolio companies
SPONSORED BY
10 PITCHBOOK 2016 ANNUAL US PE MIDDLE MARKET REPORT

US PE LMM deal flow
US PE LMM deals (#) by sector in 2016
Source: PitchBook. Transactions sized between $25 million and
$100 million comprise the lower middle market.
SURGE IN DEAL VALUELower-middle-market activity
Heavy investment in LMM. Deal value jumped 21.3% YoY.
$31
$37
$37
$17
$23
$27
$35
$29
$30
$30
$36
628
784
697
411
516 571
817
677
721 745 748
2006 2007 2008 2009 2010 2011 2012 2013 2014 2015 2016
Deal Value ($B) # of Deals Closed
36%
30%
8%
2%
8%
14%2%
B2B B2C Energy
Financial Services Healthcare IT
Materials & Resources Source: PitchBook
Select US LMM PE deals in 2016
Company Investor(s)Deal Size ($M)
West Star AviationNorwest Equity Partners
$99.3
Perforce Software Summit Partners $97.4
TRANZACTClayton, Dubilier & Rice
$85
Northstar Travel Group
Wasserstein Partners, Alberta Teachers’ Retirement Fund Board
$76
D&S Community Services
Comvest Partners $70
Source: PitchBook
IN PARTNERSHIP WITH
CO-SPONSOR
SPONSORED BY
11 PITCHBOOK 2016 ANNUAL US PE MIDDLE MARKET REPORT

US PE CMM deal flow
US PE CMM deals (#) by sector in 2016
CONTINUED DOWNTURNCore-middle-market activity
Activity in CMM remains fairly steady in 2016.
Source: PitchBook. Transactions sized between $100 million and
$500 million comprise the core middle market.
$139
$169
$104
$46
$100
$139
$159
$151
$213
$171
$173
675
832
502
251
574
702 821 813
1,106 1,020
879
2006 2007 2008 2009 2010 2011 2012 2013 2014 2015 2016
Deal Value ($B) # of Deals Closed
28%
24%11%
7%
15%
12%3%
B2B B2C Energy
Financial Services Healthcare IT
Materials & ResourcesSource: PitchBook
Select US CMM PE deals in 2016
Company Investor(s)Deal Size ($M)
Power Products Genstar Capital $496
Accuride Crestview Partners $460.9
Electro Rent Platinum Equity $382.2
TransMontaigne GPArcLight Capital Partners
$350
Bomgar Thoma Bravo $282
Source: PitchBook
IN PARTNERSHIP WITH
CO-SPONSOR
SPONSORED BY
12 PITCHBOOK 2016 ANNUAL US PE MIDDLE MARKET REPORT

US PE UMM deal flow
US PE UMM deals (#) by sector in 2016
A SHARP DECLINEUpper-middle-market activity
PE moves away from UMM. Deal value fell 20.3% YoY.
Source: PitchBook. Transactions sized between $500 million
and $1 billion comprise the upper middle market.
$111
$147
$54
$31
$113
$107
$123
$121
$197
$198
$158
167
244
86 57
209 187
238 214
328
393
281
2006 2007 2008 2009 2010 2011 2012 2013 2014 2015 2016
Deal Value ($B) # of Deals Closed
19%
17%
14%3%
19%
28%
B2B B2C Energy
Financial Services Healthcare IT
Materials & ResourcesSource: PitchBook
Select US UMM PE deals in 2016
Company Investor(s)Deal Size ($M)
Masergy Berkshire Partners $900
Vivid Seats Vista Equity Partners $825
American Bath Group Lone Star Funds $750
Great Expressions Dental Centers
Roark Capital Group $675
Xura Siris Capital $649
Source: PitchBook
IN PARTNERSHIP WITH
CO-SPONSOR
SPONSORED BY
13 PITCHBOOK 2016 ANNUAL US PE MIDDLE MARKET REPORT

T H E P R E M I E R N E T W O R K I N G & D E A L F L O W E V E N T F O R
M I D D L E - M A R K E T D E A L - M A K E R S F E A T U R I N G K E Y N O T E
S P E A K E R E A R V I N “ M A G I C ” J O H N S O N .
W W W . I N T E R G R O W T H . O R G
IT’S YOUR DEAL.
© 2017 Association for Corporate Growth. All Rights Reserved.

A GROWING INVENTORYUS PE middle-market company inventory
Inventory is increasingly concentrated in relatively younger companies
US PE middle-market company inventory by count and year
US PE MM median hold period (years) by exit type
Middle-market companies make up 74.1% of all PE-backed company inventory in the US.
1,9432,254
2,670
3,1163,490 3,647 3,891
4,1264,388 4,594
4,8485,120 5,310
2004 2005 2006 2007 2008 2009 2010 2011 2012 2013 2014 2015 2016
2011-2016 2006-2010
2000-2005 Pre-2000
Year of Investment
6.4
4.8
5.5 5.4
4.8
5.1
0.5
1.5
2.5
3.5
4.5
5.5
6.5
7.5
2006 2007 2008 2009 2010 2011 2012 2013 2014 2015 2016
IPOs Corporate Secondary Buyout
Source: PitchBook
Source: PitchBook
IN PARTNERSHIP WITH
CO-SPONSOR
SPONSORED BY
15 PITCHBOOK 2016 ANNUAL US PE MIDDLE MARKET REPORT
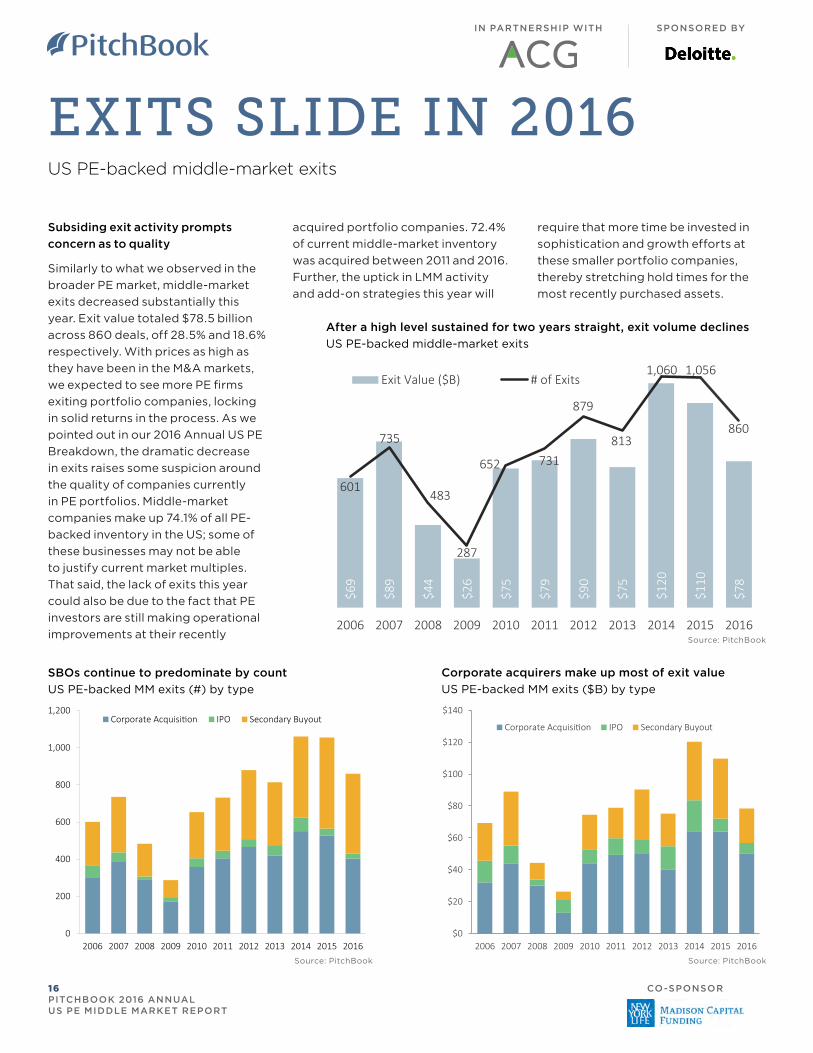
EXITS SLIDE IN 2016US PE-backed middle-market exits
Subsiding exit activity prompts
concern as to quality
Similarly to what we observed in the
broader PE market, middle-market
exits decreased substantially this
year. Exit value totaled $78.5 billion
across 860 deals, off 28.5% and 18.6%
respectively. With prices as high as
they have been in the M&A markets,
we expected to see more PE firms
exiting portfolio companies, locking
in solid returns in the process. As we
pointed out in our 2016 Annual US PE
Breakdown, the dramatic decrease
in exits raises some suspicion around
the quality of companies currently
in PE portfolios. Middle-market
companies make up 74.1% of all PE-
backed inventory in the US; some of
these businesses may not be able
to justify current market multiples.
That said, the lack of exits this year
could also be due to the fact that PE
investors are still making operational
improvements at their recently
SBOs continue to predominate by count
US PE-backed MM exits (#) by type
After a high level sustained for two years straight, exit volume declines
US PE-backed middle-market exits$6
9
$89
$44
$26
$75
$79
$90
$75
$120
$110
$78
601
735
483
287
652 731
879
813
1,060 1,056
860
2006 2007 2008 2009 2010 2011 2012 2013 2014 2015 2016
Exit Value ($B) # of Exits
0
200
400
600
800
1,000
1,200
2006 2007 2008 2009 2010 2011 2012 2013 2014 2015 2016
Corporate Acquisition IPO Secondary Buyout
Source: PitchBook
Source: PitchBook
Corporate acquirers make up most of exit value
US PE-backed MM exits ($B) by type
$0
$20
$40
$60
$80
$100
$120
$140
2006 2007 2008 2009 2010 2011 2012 2013 2014 2015 2016
Corporate Acquisition IPO Secondary Buyout
Source: PitchBook
acquired portfolio companies. 72.4%
of current middle-market inventory
was acquired between 2011 and 2016.
Further, the uptick in LMM activity
and add-on strategies this year will
require that more time be invested in
sophistication and growth efforts at
these smaller portfolio companies,
thereby stretching hold times for the
most recently purchased assets.
IN PARTNERSHIP WITH
CO-SPONSOR
SPONSORED BY
16 PITCHBOOK 2016 ANNUAL US PE MIDDLE MARKET REPORT

FUNDRAISING
Fundraising flattens by count
US PE middle-market fundraising by year
Fundraising count plateaus
Though they garnered about $15 billion
less in capital commitments, virtually
the same number of middle-market
A decrease of 19.4% YoY
Average US PE middle-market buyout fund size
Steady LMM-focused fund volume
US LMM PE funds
$118
$121
$113
$77
$52
$86
$90
$108
$133
$125
$110
168
193172
99 94
117 119
169 177165 164
2006 2007 2008 2009 2010 2011 2012 2013 2014 2015 2016
Capital Raised ($B) # of Funds Closed
Source: PitchBook
Source: PitchBook
0
20
40
60
80
100
120
2010 2011 2012 2013 2014 2015 201650%
52%
54%
56%
58%
60%
62%
64%
66%
68%Fund Count % in LMM ($100M-$500M)
Source: PitchBook
funds closed last year as did in 2015.
In our Annual US PE Breakdown, we
observed that larger funds have had
more success and accounted for a
higher proportion of total capital
commitments to PE. This trend,
however, is markedly different in the
middle market. Average buyout fund
size decreased by 19.4% last year to
$687.9 million. As firms target more
LMM companies, the average check
size for equity contributions will come
down, which could be contributing to
the decrease in fund size. The PE market
is showing signs of splitting itself into
two distinct segments: larger, more
institutionalized firms and smaller,
possibly nimbler specialty buyout
shops, such as LMM-focused PE shops.
The latter of which are certainly still in
high demand. In a sign of confidence,
the number of first-time funds to
close hit a five-year high last year, as
experienced associates are branching
out on their own in order to capitalize on
the quite palpable demand from LPs.
$853.0
$687.9
$500
$600
$700
$800
$900
2006 2007 2008 2009 2010 2011 2012 2013 2014 2015 2016
Average Buyout Fund Size ($M)
IN PARTNERSHIP WITH
CO-SPONSOR
SPONSORED BY
17 PITCHBOOK 2016 ANNUAL US PE MIDDLE MARKET REPORT

MIDDLE MARKET LEAGUE TABLES
4Q 2016
HarbourVest Partners 19
Audax Group 18
ABRY Partners 11
AlpInvest Partners 11
Genstar Capital 11
Hellman & Friedman 9
GTCR 8
Maranon Capital 8
H.I.G. Capital 6
Huron Capital Partners 6
The Riverside Company 6
Advent International 5
AEA Investors 5
Aquiline Capital Partners 5
Charlesbank Capital Partnesr 5
GoldPoint Partners 5
Kelso & Company 5
The Carlyle Group 5
Kirkland & Ellis 40
Jones Day 17
Paul Hastings 13
Latham & Watkins 12
Ropes & Gray 12
Weil, Gotshal & Manges 12
Morgan, Lewis & Bockius 9
Paul, Weiss, Rifkind, Wharton & Garrison
9
DLA Piper 7
Finn Dixon & Herling 7
Greenberg Traurig 7
Choate Hall & Stewart 6
McDermott Will & Emery 6
Morrison & Foerster 6
Shearman & Sterling 6
Covington & Burling 5
Honigman Miller Schwartz and Cohn
5
Most active investors by deal count
Most active law firms by deal count
Antares Capital 23
Madison Capital Funding 16
Twin Brook Capital Partners 11
Houlihan Lokey 15
Harris Williams & Co. 8
Lincoln International 8
Robert W. Baird & Co. 8
William Blair & Company 8
Piper Jaffray 6
Stifel 6
BB&T Capital Markets 5
Most active advisors by deal count
Source: PitchBook
Source: PitchBook
Source: PitchBook
Source: PitchBook
Note: The lenders’ table was updated as of 3/2/2017
given errors in deal attribution.
BMO Harris Bank 10
Monroe Capital 9
NewStar Financial 7
NXT Capital 7
RBC Capital Markets 5
Citizens Bank 5
Golub Capital 4
Fifth Street 4
KeyBanc Capital Markets 4
ORIX 4
PNC Bank 4
Webster Financial 4
Most active lenders by deal count
Most active lenders by deal count, ctd.
CHILDS Advisory Partners 5
Moelis & Company 5
RBC Capital Markets 5
The Jordan Edmiston Group 5
Most active advisors by deal count, ctd.
IN PARTNERSHIP WITH
CO-SPONSOR
SPONSORED BY
18 PITCHBOOK 2016 ANNUAL US PE MIDDLE MARKET REPORT
Madison Capital, founded in 2001, and headquartered in Chicago, Illinois, is a premier finance company focused exclusively on the corporate financing needs of middle market private equity firms. Madison Capital has closed transactions with over 255 different private equity firms and provides enterprise-value
leveraged financing for leveraged buyouts, management buyouts, add-on acquisitions and recapitalizations. Madison Capital Funding LLC is a subsidiary of New York Life Insurance Company. Additional information may be found at: www.mcfllc.com

See how the PitchBook Platform can
help your private equity firm close your
next deal.
We do EBITDA multiples,private comps,valuations,market trends,growth metrics.
You build a better portfolio.


