
Unaudited Condensed Consolidated Financial Statements and Notes
For the three months ended March 31, 2016 and 2015

Northview Apartment Real Estate Investment Trust
Northview 2016 First Quarter │2
Unaudited Condensed Consolidated Statements of Financial Position (thousands of Canadian dollars)
Note March 31, 2016 December 31, 2015
Assets
Non-current assets
Investment properties 4 2,986,823 3,025,468
Property, plant and equipment 5 40,524 55,510
Other long-term assets 5,725 5,593
Investment in joint ventures 6,472 6,210
Intangible assets 372 520
Loans receivable 6 5,289 6,922
3,045,205 3,100,223
Current assets
Loans receivable 6 2,374 992
Prepaid expenses and other assets 4,833 4,760
Accounts receivable 13(b)(ii) 9,725 12,417
Restricted cash 12,082 9,738
Cash 899 4,487
Assets held for sale 19 74,202 -
104,115 32,394
3,149,320 3,132,617
Liabilities
Non-current liabilities
Class B LP Units 11(b) 110,204 137,135
Mortgages payable 7 1,529,870 1,228,857
Convertible debentures 8 23,345 22,885
Derivative instruments 7 2,210 1,515
1,665,629 1,390,392
Current liabilities
Mortgages payable 7 124,634 131,032
Credit facilities 9 167,800 483,743
Trade and other payables 76,682 70,467
Distributions and Class B LP interest payable 7,092 7,089
Unit based payments 10 1,084 788
Liabilities related to assets held for sale 19 40,147 -
417,439 693,119
2,083,068 2,083,511
Unitholders’ equity
Equity attributable to Unitholders 1,064,423 1,047,296
Non-controlling interests 1,829 1,810
Total equity 1,066,252 1,049,106
3,149,320 3,132,617 See accompanying notes to the condensed consolidated financial statements. Guarantees, commitments and contingencies (Note 12).
Subsequent events (Note 21).

Northview Apartment Real Estate Investment Trust
Northview 2016 First Quarter │3
Unaudited Condensed Consolidated Statements of Net and Comprehensive Income Three months ended March 31 (thousands of Canadian dollars)
Note 2016 2015
Revenue
Rental revenue 79,488 47,403
Other revenue 6,819 1,418
86,307 48,821
Operating expenses 39,328 22,481
Net operating income 46,979 26,340
Other expense (income)
Financing costs 15 17,243 7,556
Administration 2,664 2,482
Depreciation and amortization 1,430 1,173
Loss (gain) on sale of property, plant and equipment (1) 21
Equity income from joint ventures (305) (278)
Business combination transaction costs 3 14,116 -
Unrealized fair value changes 16 7,351 768
42,498 11,722
Net and comprehensive income 4,481 14,618
Net and comprehensive income attributable to:
Unitholders 4,434 14,566
Non-controlling interests 47 52
Net and comprehensive income 4,481 14,618 See accompanying notes to the condensed consolidated financial statements.
Northview Apartment Real Estate Investment Trust
Northview 2016 First Quarter │4
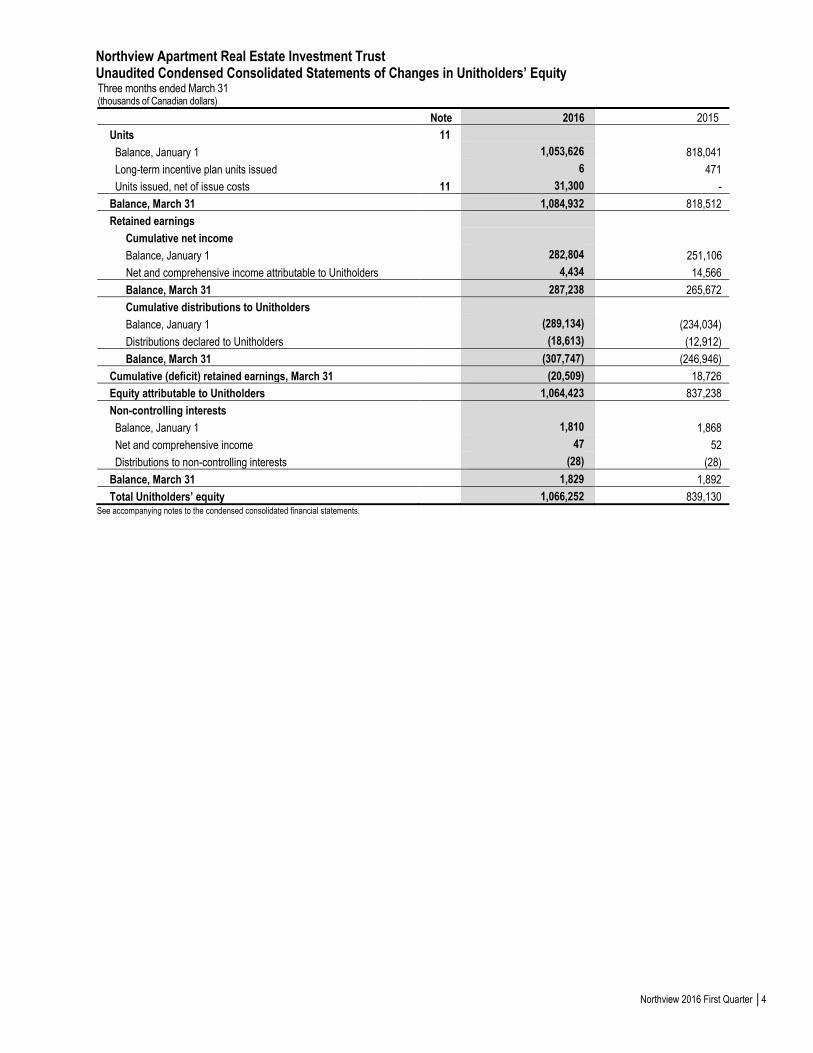
Unaudited Condensed Consolidated Statements of Changes in Unitholders’ Equity Three months ended March 31 (thousands of Canadian dollars)
Note 2016 2015
Units 11
Balance, January 1 1,053,626 818,041
Long-term incentive plan units issued 6 471
Units issued, net of issue costs 11 31,300 -
Balance, March 31 1,084,932 818,512
Retained earnings
Cumulative net income
Balance, January 1 282,804 251,106
Net and comprehensive income attributable to Unitholders 4,434 14,566
Balance, March 31 287,238 265,672
Cumulative distributions to Unitholders
Balance, January 1 (289,134) (234,034)
Distributions declared to Unitholders (18,613) (12,912)
Balance, March 31 (307,747) (246,946)
Cumulative (deficit) retained earnings, March 31 (20,509) 18,726
Equity attributable to Unitholders 1,064,423 837,238
Non-controlling interests
Balance, January 1 1,810 1,868
Net and comprehensive income 47 52
Distributions to non-controlling interests (28) (28)
Balance, March 31 1,829 1,892
Total Unitholders’ equity 1,066,252 839,130 See accompanying notes to the condensed consolidated financial statements.

Northview Apartment Real Estate Investment Trust
Northview 2016 First Quarter │5
Consolidated Statements of Cash Flows Three months ended March 31 (thousands of Canadian dollars)
Note 2016 2015
Operating activities:
Net and comprehensive income 4,481 14,618
Adjustments:
Deferred rental revenue (30) (31)
Tenant inducements amortization 117 117
Depreciation and amortization 1,430 1,173
Mortgage and credit facilities interest expense 14,219 7,609
Mortgage and credit facilities interest paid (14,671) (7,141)
Interest expense to Class B LP Unitholders 2,663 28
Distribution interest paid to Class B LP Unitholders (2,922) (28)
Interest expense on convertible debentures 330 -
Unrealized fair value changes 16 7,351 768
Loss (gain) on sale of property, plant and equipment (1) 21
Equity income from joint ventures (305) (278)
Long-term incentive plan compensation 280 421
Changes in non-cash working capital 17 7,862 (7,457)
20,804 9,820
Financing activities:
Proceeds from mortgages 353,998 19,372
Repayment of mortgages (20,306) (11,578)
Draw of credit facilities, net (315,943) 32,230
Payments to non-controlling interests (29) (28)
Distributions paid to Unitholders 11(c) (18,352) (12,909)
(632) 27,087
Investing activities:
Acquisition of investment properties and land for future development 4 (6) (23,178)
Investment properties under development 4 (11,465) (11,000)
Investment property improvements 4 (11,168) (8,531)
Proceeds from sale of investment properties 1 2,337
Acquisition of property, plant and equipment 5 (1,030) (509)
Distributions received from equity investees 43 25
Changes in non-cash working capital 17 (135) 3,949
(23,760) (36,907)
Net decrease in cash (3,588) -
Cash, beginning of period 4,487 -
Cash, end of period 899 - See accompanying notes to the condensed consolidated financial statements.

Northview Apartment Real Estate Investment Trust Notes to the Unaudited Condensed Consolidated Financial Statements Three months ended March 31, 2016 and 2015 (Tabular amounts expressed in thousands of Canadian dollars except where indicated)
Northview 2016 First Quarter │6
1. Description of the consolidated entities Northview Apartment Real Estate Investment Trust (“Northview” or the “REIT” or the “Trust”) (formerly Northern Property Real Estate Investment Trust (“NPR”)) is an unincorporated, open-ended real estate investment trust created pursuant to a declaration of trust (“DOT”) dated January 2, 2002, and last amended October 30, 2015, under the laws of the Province of Alberta (and the federal laws of Canada applicable therein). Northview is primarily a multi-family residential real estate investor and operator providing a broad spectrum of rental accommodations with a portfolio of more than 24,000 quality residential suites in more than 60 markets across Canada, which provides Northview the means to deliver stable and growing profitability and cash distributions to Unitholders. Northview’s registered office is located at 110, 6131 6th Street SE, Calgary, Alberta. On October 30, 2015, through a plan of arrangement, NPR acquired all of the assets and properties of True North Apartment Real Estate Investment Trust ("TN" or “True North”) in exchange for NPR Trust Units and NPR Special Voting Units. In addition, NPR acquired seven apartment properties held by Starlight Investment Ltd. (“SL” or “Starlight”) and 26 apartment properties from a joint venture between affiliates of SL and affiliates of the Public Sector Pension Investment Board (“PSP”), collectively the “Transaction”. Upon completion of the Transaction, NPR changed its name to Northview Apartment Real Estate Investment Trust. NPR units were delisted from the Toronto Stock Exchange (“TSX”) under the trading symbol NPR.UN. On November 5, 2015, Northview was listed and began trading on the TSX under the symbol “NVU.UN”. Northview continues to qualify as a real estate investment trust for tax purposes.
2. Significant accounting policies a) Basis of preparation and statement of compliance The condensed consolidated financial statements have been prepared in accordance with International Accounting Standards (“IAS”) 34 – Interim Financial Reporting, using accounting policies consistent with International Financial Reporting Standards (“IFRS”) as issued by the International Accounting Standards Board (“IASB”). The condensed consolidated financial statements are not subject to qualification relating to the application of IFRS as issued by the IASB. The condensed consolidated financial statements should be read in conjunction with Northview’s annual financial statements for the year ended December 31, 2015, prepared in accordance with IFRS. There have been no changes to Northview’s accounting policies from those disclosed in the consolidated financial statements of Northview for the year ended December 31, 2015, with the exception of the reclassification of prior period presentation as noted below. The condensed consolidated financial statements were authorized for release by the trustees of the REIT (the “Trustees”) on May 5, 2016. Reclassification of prior period presentation Certain prior period amounts have been reclassified for consistency with current period presentations. During the three months ended March 31, 2016, Northview concluded it was appropriate to reclassify instalment notes receivable as loans receivable due to being similar in nature. The prior period amounts for the year ended December 31, 2015, current instalment notes receivable of $0.7 million and non-current instalment notes receivable of $1.1 million, were reclassified to loans receivable. These reclassifications had no effect on the reported results of operations and did not impact Northview’s cash flows.
b) New accounting standards and interpretations Northview has applied a number of new and revised IFRSs issued by the IASB that are mandatorily effective for an accounting period that begins on or after January 1, 2016.
Proposed Standard Description Previous Standard Impact of Application
Amendments to IFRS 11 – Joint Arrangement: Accounting for Acquisitions of Interests
The amendments to IFRS 11 require an acquirer of an interest in a joint operation in which the activity constitutes a business combination, as defined in IFRS 3 – Business Combinations, to apply the relevant principles on accounting for business combinations in IFRS 3 and other standards.
No direct replacement. No material recognition or measurement impact on the condensed consolidated financial statements.

Northview Apartment Real Estate Investment Trust Notes to the Unaudited Condensed Consolidated Financial Statements Three months ended March 31, 2016 and 2015 (Tabular amounts expressed in thousands of Canadian dollars except where indicated)
Northview 2016 First Quarter │7
c) Recent accounting pronouncements The IASB has issued the following standards that have not been applied in preparing these condensed consolidated financial statements as their effective dates fall within annual periods subsequent to the current reporting period.
Proposed Standard Description Previous Standard Effective Date
IFRS 15 – Revenue from Contracts with Customers
Introduces a principle to report information about the nature, timing, and uncertainty of revenue from contracts with customers in a single, comprehensive revenue recognition model.
IAS 18 – Revenue, IAS 11 – Construction Contracts, and related interpretations.
Effective date for annual periods beginning on or after January 1, 2018.
IFRS 9 – Financial Instruments
The IASB has undertaken a three-phase project to replace IAS 39 with IFRS 9. The new standard replaces the current multiple classification and measurement models for financial assets and liabilities with a single model that has only two classification categories: amortized cost and fair value; and introduces a new hedge accounting model. The standard was finalized in July 2014.
IAS 39 – Financial Instruments: Recognition and Measurement.
Effective date for annual periods beginning on or after January 1, 2018.
IFRS 16 – Leases The IASB issued IFRS 16 – Leases, which provides a single lessee accounting model, requiring lessees to recognize assets and liabilities for all leases unless the lease term is 12 months or less or the underlying asset has a low value.
IAS 17 – Leases Effective date for annual periods beginning on or after January 1, 2019.
Management continues to evaluate the potential qualitative and quantitative impact of these new standards on Northview’s financial statement measurements and disclosures. Northview is not early adopting these standards.
3. Business combinations
a) True North acquisition On October 30, 2015, NPR acquired 100% of the outstanding Trust Units and Class B LP Units of TN, a real estate investment trust listed on the TSX. TN held a portfolio of residential rental apartments in Alberta, Ontario, Québec, Nova Scotia, and New Brunswick, and the acquisition provided NPR a unique opportunity to achieve scale and diversification in central and eastern Canada and access to those rental markets. The existing strategic management functions and associated processes were acquired with the properties and, as such, this transaction constitutes the acquisition of a business rather than an asset acquisition. The fair value of the identifiable assets and liabilities of TN as at the date of acquisition:
Fair value recognized on TN acquisition
Assets acquired:
Cash 1,582
Restricted cash 3,681
Accounts receivable 686
Prepaid expenses and other assets 2,568
Instalment notes receivable 1,917
Other long-term assets 919
Property, plant, and equipment 886
Investment property 846,959
Fair value of assets obtained 859,198

Northview Apartment Real Estate Investment Trust Notes to the Unaudited Condensed Consolidated Financial Statements Three months ended March 31, 2016 and 2015 (Tabular amounts expressed in thousands of Canadian dollars except where indicated)
Northview 2016 First Quarter │8
Liabilities assumed:
Trade and other payables 22,202
Derivative instruments 1,280
Credit facilities 37,000
Convertible debentures 23,345
Mortgages and loans payable 513,658
Fair value of liabilities assumed 597,485
Fair value of net assets 261,713
Fair value of purchase consideration transferred 240,984
Bargain purchase gain (20,729)
The TN acquisition was funded through a unit exchange, where each of the outstanding TN Trust Units and Class B LP Units were exchanged for 0.3908 NPR Trust Units and NPR Special Voting Units (“NPR Units”), respectively. NPR issued to each holder of TN Class B LP Units, for each TN Special Voting Unit held by such holder, such number of NPR Special Voting Units that was equal to the product obtained by multiplying the number of TN Class B LP Units held by such holder by the exchange ratio of 0.3908. The 7,587,375 NPR Trust Units and 5,445,820 NPR Special Voting Units issued as consideration are measured at fair value using the closing market price on the date of acquisition. Excluding the transaction costs incurred in the period, for the three months ended March 31, 2016, TN has contributed $6.5 million to the net and comprehensive income and $21.8 million to revenues.
b) Starlight and IMH acquisitions On October 30, 2015, NPR acquired the undivided interest of seven investment properties from Starlight (the “SL Portfolio”) and 26 investment properties from a joint venture between Public Sector Pension Investment Board and Starlight Investments Ltd., together with its affiliates (the “IMH Portfolio”), collectively the “Portfolio Acquisitions”. The portfolios consist of residential rental apartments in Ontario, Nova Scotia, and New Brunswick, and the acquisition provided NPR a unique opportunity to achieve scale and diversification in central and eastern Canada and access to those rental markets. The existing strategic management functions and associated processes were acquired with the properties and, as such, this transaction constitutes the acquisition of a business rather than an asset acquisition.
The fair value of the identifiable assets and liabilities of the SL Portfolio as at the date of acquisition:
Fair value recognized on SL acquisition
Assets acquired:
Investment property 108,318
Property, plant, and equipment 238
Prepaid expenses and other assets 843
Fair value of assets obtained 109,399
Liabilities assumed:
Mortgages and loans payable 16,927
Trade and other payables 790
Fair value of liabilities assumed 17,717
Fair value of net assets 91,682
Fair value of purchase consideration transferred 88,350
Bargain purchase gain (3,332)

Northview Apartment Real Estate Investment Trust Notes to the Unaudited Condensed Consolidated Financial Statements Three months ended March 31, 2016 and 2015 (Tabular amounts expressed in thousands of Canadian dollars except where indicated)
Northview 2016 First Quarter │9
The fair value of the identifiable assets and liabilities of the IMH Portfolio as at the date of acquisition:
Fair value recognized on IMH acquisition
Assets acquired:
Investment property 429,810
Prepaid expenses and other assets 1,948
Fair value of assets obtained 431,758
Liabilities assumed:
Mortgages and loans payable 35,002
Trade and other payables 4,107
Fair value of liabilities assumed 39,109
Fair value of net assets 392,649
Fair value of purchase consideration transferred 365,817
Bargain purchase gain (26,832)
The acquisition of the SL Portfolio was funded through a combination of (i) issuance of 879,053 of NPR Special Voting Units with an agreed upon value of $23.03 per unit to satisfy $20,245 of the purchase price, and (ii) cash consideration of $72,097 funded by a new credit facility. Excluding the transaction costs incurred in the period, for the three months ended March 31, 2016, the SL portfolio has contributed a net and comprehensive loss of $1.2 million to the net and comprehensive income and $2.6 million to revenues. The acquisition of the IMH Portfolio was funded through a combination of (i) issuance of 5,115,190 of NPR Trust Units with an agreed upon value of $23.03 per unit to satisfy $117,803 of purchase price, (ii) issuance of 1,416,870 of NPR Special Voting Units with an agreed upon value of $23.03 per unit to satisfy $32,631 of purchase price, and (iii) cash consideration of $245,039 funded by a new credit facility. Excluding the transaction costs incurred in the period, for the three months ended March 31, 2016, the IMH portfolio contributed $3.9 million to the net and comprehensive income and $10.8 million to revenues. During the three months ended March 31, 2016, additional transaction costs of $14.1 million incurred in connection with the Transaction have been expensed in the consolidated statements of net and comprehensive income. For more information, see Note 4 of the consolidated financial statements for the year ended December 31, 2015.
4. Investment properties
March 31, 2016 December 31, 2015
Investment properties 2,932,604 2,956,571
Investment properties under development 23,807 38,490
Land held for development 30,412 30,407
2,986,823 3,025,468

Northview Apartment Real Estate Investment Trust Notes to the Unaudited Condensed Consolidated Financial Statements Three months ended March 31, 2016 and 2015 (Tabular amounts expressed in thousands of Canadian dollars except where indicated)
Northview 2016 First Quarter │10
Changes to investment properties for the periods:
March 31, 2016 December 31, 2015
Balance, January 1 3,025,468 1,582,011
Acquisitions of investment properties - 19,299
Acquisitions of land for future development - 15,023
Business combinations - 1,385,087
Disposals - (16,010)
Transfers to property, plant and equipment (184) (759)
Transfers to assets held for sale (59,288) -
Investment properties under development 11,465 45,424
Investment property improvements 11,168 58,694
Unrealized fair value changes (1,806) (63,301)
Balance, end of period 2,986,823 3,025,468
As at March 31, 2016, Northview capitalized borrowing costs of $0.3 million (as at December 31, 2015 – $0.9 million) to investment properties under development. During the three months ended March 31, 2016, Northview did not purchase any land (December 31, 2015 – 18.4 acres were purchased for a total of $15.0 million).
For the three months ended March 31, 2016, Northview did not dispose of any properties. During the three months ended March 31, 2015, Northview disposed of the last seniors’ property for proceeds which equaled its fair value of $2.3 million. For the three months ended March 31, 2016, Northview did not acquire any properties. Acquisitions for the three months ended March 31, 2015, were as follows:
Acquisition Date Property
Type Units / sq ft Region
Total Acquisition Costs
Mortgage Funding Cash Paid
March 20, 2015 Multi-family 139 St. John’s, NL 11,732 - 11,732
January 14, 2015 Commercial 29,400 St. John’s, NL 6,646 - 6,646
139 / 29,400 18,378 - 18,378
Northview uses the capitalization rate (“Cap Rate”) method to value investment properties. As at March 31, 2016, Cap Rates ranging from 4.35% to 13.00% (December 31, 2015 – 4.35% to 13.00%) were applied to a projected stabilized net operating income (“NOI”). The weighted average Cap Rate applied to fair value Northview’s investment properties as at March 31, 2016, is 6.82% (December 31, 2015 – 6.83%). A summary of the Cap Rates used for the March 31, 2016, and December 31, 2015, valuations is as follows:
March 31, 2016 December 31, 2015
Regions Minimum Maximum
Effective Weighted Average Minimum Maximum
Effective Weighted Average
Atlantic Canada 5.50% 9.50% 6.85% 5.50% 9.50% 6.85%
Northern Canada 6.86% 13.00% 9.17% 6.86% 13.00% 9.20%
Ontario 4.35% 6.00% 5.28% 4.35% 6.00% 5.30%
Québec 5.85% 7.55% 6.07% 5.85% 7.55% 6.07%
Western Canada 4.75% 11.00% 7.10% 4.75% 11.00% 7.19%
Overall 4.35% 13.00% 6.82% 4.35% 13.00% 6.83%

Northview Apartment Real Estate Investment Trust Notes to the Unaudited Condensed Consolidated Financial Statements Three months ended March 31, 2016 and 2015 (Tabular amounts expressed in thousands of Canadian dollars except where indicated)
Northview 2016 First Quarter │11
The impact of a 10 basis point change in Cap Rates used to value the investment properties would affect the fair value as follows:
March 31, 2016 December 31, 2015
Regions
Effective Weighted Average Increase Decrease
Effective Weighted Average Increase Decrease
Atlantic Canada 6.85% (5,398) 5,558 6.85% (5,460) 5,622
Northern Canada 9.17% (6,220) 6,357 9.20% (6,206) 6,343
Ontario 5.28% (17,230) 17,895 5.30% (18,072) 18,767
Québec 6.07% (2,907) 3,005 6.07% (2,771) 2,864
Western Canada 7.10% (12,968) 13,338 7.19% (12,695) 13,050
Overall 6.82% (44,723) 46,153 6.83% (45,204) 46,646
The impact of a 1% change in stabilized NOI used to value the investment properties would increase or decrease the fair value as follows:
Regions March 31, 2016 December 31, 2015
Atlantic Canada 3,753 3,797
Northern Canada 5,766 5,771
Ontario 9,261 9,764
Québec 1,793 1,710
Western Canada 9,342 9,258
Overall 29,915 30,300
5. Property, plant and equipment
Land Buildings Furniture &
Fixtures Automotive Other
Assets Total
Cost or deemed cost
Balance at January 1, 2015 1,870 59,924 2,568 2,991 2,707 70,060
Additions for the year - 5,322 82 381 616 6,401
Business combinations 22 697 11 - 394 1,124
Transfers from investment property 294 465 - - - 759
Disposals for the year (1) (25) - (185) (467) (678)
Balance at December 31, 2015 2,185 66,383 2,661 3,187 3,250 77,666
Additions for the period - 995 3 - 32 1,030
Transfers from investment property 4 180 - - - 184
Transfers to assets held for sale (56) (14,771) (87) - - (14,914)
Disposals for the period - - - (33) - (33)
Balance at March 31, 2016 2,133 52,787 2,577 3,154 3,282 63,933
Accumulated depreciation
Balance at January 1, 2015 - 12,694 1,596 2,016 1,979 18,285
Depreciation for the year - 3,202 519 400 315 4,436
Disposals for the year - - - (148) (417) (565)
Balance at December 31, 2015 - 15,896 2,115 2,268 1,877 22,156
Depreciation for the period - 961 133 95 97 1,286
Disposals for the period - - - (33) - (33)
Balance at March 31, 2016 - 16,857 2,248 2,330 1,974 23,409
Carrying amounts
December 31, 2015 2,185 50,487 546 919 1,373 55,510
March 31, 2016 2,133 35,930 329 824 1,308 40,524

Northview Apartment Real Estate Investment Trust Notes to the Unaudited Condensed Consolidated Financial Statements Three months ended March 31, 2016 and 2015 (Tabular amounts expressed in thousands of Canadian dollars except where indicated)
Northview 2016 First Quarter │12
6. Loans receivable Loans receivable consists of instalment notes receivable, tenant inducement loans and vendor take back loans (“VTB”) on disposals of investment properties as follows:
March 31, 2016 December 31, 2015
Balance, January 1 7,914 4,796
Present value of instalment notes receivable – October 2015 - 1,794
Fair value adjustment on instalment notes receivable - 123
Amortization of instalment note premium (9) (5)
Tenant inducement loans additions - 1,150
VTB loans additions - 1,720
Repayments received (242) (1,664)
Balance, end of period 7,663 7,914
Current 2,374 992
Non-current 5,289 6,922
Balance, end of period 7,663 7,914
VTB receivable on asset disposals are receivable over terms of 3 to 10 years at interest rates of between 6.0% and 10.0%, maturing between March 1, 2017, and January 31, 2022. Loans are secured by investment properties which had a fair value of $26.0 million at the time of sale. Should the purchasers default on the loans, Northview has the option to reacquire the properties as settlement of the outstanding VTB loans balance. At March 31, 2016, there are $4.1 million in VTB loans (December 31, 2015 – $4.1 million). Tenant inducement loans are repayable over terms of 5 to 10 years, matching the lease terms, at interest rates of between 0.0% to 10.0%, maturing between September 1, 2017, and March 1, 2024. At March 31, 2016, there are $1.9 million in tenant inducement loans outstanding (December 31, 2015 – $2.0 million). Pursuant to the acquisition of TN, Northview acquired certain non-interest bearing instalment notes, with a present value of $1.8 million. At March 31, 2016, there is $1.7 million in instalment notes receivable outstanding (December 31, 2015 – $1.8 million). These instalment notes extend over the maturity dates of the assumed mortgages, expiring on various dates between June 1, 2017 and December 1, 2022.
7. Mortgages payable
March 31, 2016 December 31, 2015
Mortgages payable 1,702,543 1,357,215
Fair value adjustment upon assumption 19,528 20,838
Deferred financing costs (27,420) (18,164)
1,694,651 1,359,889
Mortgages related to assets held for sale (40,147) -
Total 1,654,504 1,359,889
Current 124,634 131,032
Non-current 1,529,870 1,228,857
Total 1,654,504 1,359,889
Mortgages payable bear interest at rates ranging from 1.41% to 6.48% (December 31, 2015 – 1.41% to 6.48%) and have a weighted average rate of 3.31% as at March 31, 2016 (December 31, 2015 – 3.33%). Mortgages are payable in monthly installments of blended principal and interest of approximately $7.2 million (December 31, 2015 – $6.7 million). The mortgages mature between 2016 and 2026 (December 31, 2015 – 2016 and 2025) and are secured by charges against specific properties. Land and buildings with a carrying value of $2.7 billion (December 31, 2015 – $2.3 billion) have been pledged to secure the mortgages payable of Northview.

Northview Apartment Real Estate Investment Trust Notes to the Unaudited Condensed Consolidated Financial Statements Three months ended March 31, 2016 and 2015 (Tabular amounts expressed in thousands of Canadian dollars except where indicated)
Northview 2016 First Quarter │13
The fair value of mortgages payable at March 31, 2016 is approximately $1.7 billion (December 31, 2015 – $1.4 billion). The fair value is determined by discounting the future cash payments by the current market borrowing rate. Most of the mortgages on Northview’s investment properties are insured by Canada Mortgage and Housing Corporation (“CMHC”). Pursuant to standard mortgage terms, each mortgagee has a first position security interest in the specified property funded with mortgage proceeds. As well, there are some mortgagees with a second position security interest. In addition, certain investment properties are cross-securitized providing the lender with preferential security rights to those properties.
The following table summarizes certain aspects of Northview’s mortgage maturities as at March 31, 2016:
Northview may, from time to time, enter into derivative financial instruments to mitigate interest rate risk. Pursuant to the acquisition of TN, Northview acquired an interest rate swap. At March 31, 2016, Northview held one cash-settled interest rate swap contract for $35.0 million of mortgages payable maturing in July 2017. The contract carries a swap rate of 2.44% with an effective term of five years. Hedge accounting is not being applied to this swap contract.
8. Convertible debentures
Pursuant to the acquisition of TN, Northview acquired a $23,000 principal amount of convertible unsecured subordinated debentures at par (the “2019 Debentures”). The 2019 Debentures bear interest at 5.75% per annum, are payable semi-annually in arrears, and mature on June 30, 2019 (the "Maturity Date"). The 2019 Debentures are convertible with each $1,000 (actual dollars) of face value being convertible into 42.0 Trust Units, being 107.5 TN Trust Units multiplied by an exchange ratio of 0.3908 of a Trust Unit for each TN Trust Unit, representing a conversion price of $23.80 per Trust Unit, for a total of 966,386 Trust Units. On and after June 30, 2017, but prior to June 30, 2018, the 2019 Debentures will be redeemable, in whole or in part, at par plus accrued and unpaid interest, at the sole option of Northview, on not more than 60-day and not less than 30-day prior notice, provided that the market price of a Unit, calculated with reference to the date on which notice of redemption is given, is not less than 125% of the conversion price. On and after June 30, 2018, but prior to the Maturity Date, the 2019 Debentures are redeemable, in whole or in part, at par plus accrued and unpaid interest, at the sole option of Northview, on not more than 60-day and not less than 30-day prior notice. Northview may, at its sole option, subject to certain restrictions, elect to satisfy its obligation to pay all or any portion of the principal amount on the 2019 Debentures by delivering to debenture holders on the redemption date that number of Trust Units obtained by dividing the principal amount redeemed by 95% of the current market price of the Trust Units on the redemption date.
Principal Repayments
During the Year Principal on Maturity Total % of Total
Weighted Average
Interest Rate
2016 (remainder of the year) 33,900 110,986 144,886 8.5% 3.47%
2017 44,075 95,216 139,291 8.2% 3.86%
2018 42,352 169,781 212,133 12.5% 3.93%
2019 37,710 182,520 220,230 12.9% 3.30%
2020 32,398 177,323 209,721 12.3% 2.72%
2021 24,119 235,112 259,231 15.2% 3.65%
2022 20,245 42,306 62,551 3.7% 3.27%
2023 18,600 94,909 113,509 6.7% 3.12%
2024 15,021 67,241 82,262 4.9% 3.19%
2025 9,677 153,421 163,098 9.6% 3.04%
Thereafter 2,206 93,425 95,631 5.5% 2.67%
280,303 1,422,240 1,702,543 100.0% 3.31%

Northview Apartment Real Estate Investment Trust Notes to the Unaudited Condensed Consolidated Financial Statements Three months ended March 31, 2016 and 2015 (Tabular amounts expressed in thousands of Canadian dollars except where indicated)
Northview 2016 First Quarter │14
The following table summarizes the changes in the 2019 Debentures during the three months ended March 31, 2016, and year ended December 31, 2015:
Convertible Debentures Principal Amount
Outstanding, December 31, 2014 - -
Outstanding, October 30, 2015 23,000 23,345
Fair value adjustment - (460)
Outstanding, December 31, 2015 23,000 22,885
Fair value adjustment - 460
Outstanding, March 31, 2016 23,000 23,345
The following table reconciles the face value of the 2019 Debentures to their fair value:
March 31, 2016 December 31, 2015
Face value 23,000 23,000
Cumulative fair value adjustment 345 (115)
Fair value 23,345 22,885
9. Credit facilities
March 31, 2016 December 31, 2015
Operating facilities(i) 112,165 88,450
Bridge facility(ii) - 350,000
Land financing(iii) 12,779 6,004
Construction financing(iv) 42,856 39,289
167,800 483,743
(i) At March 31, 2016, Northview had four operating facilities with borrowing capacity of $75.0 million, $45.0 million, $20.0 million, and $5.4 million,
respectively, a total of $145.4 million (December 31, 2015 – $135.0 million) for acquisition, development, and operating purposes. The $75.0 million facility bears interest at prime plus 0.75% or Bankers’ Acceptance plus 2.00% with a maturity date of May 12, 2016. As of March 31, 2016, the maximum borrowing capacity was $61.8 million (December 31, 2015 – $56.0 million) based on the investment properties pledged. At March 31, 2016, $48.7 million had been drawn (December 31, 2015 – $42.2 million). Specific investment properties with a fair value of $169.6 million (December 31, 2015 – $160.5 million) have been pledged as collateral security for the operating facility. This facility is subject to certain covenants, including vacancy achievement and debt service coverage. As of March 31, 2016, Northview was in compliance with all covenants. Northview also has $4.7 million (December 31, 2015 – $5.5 million) in Letters of Credit (“LOC”) outstanding as security for construction projects and mortgage holdbacks. The LOC reduces the amount available under the $75.0 million operating facility.
The $45.0 million facility bears interest at prime plus 0.75% or Bankers’ Acceptance plus 2.00% with a maturity date of May 31, 2016. As of March 31, 2016, the maximum borrowing capacity was $40.6 million (December 31, 2015 – $40.6 million) based on the investment properties pledged. At March 31, 2016, $40.6 million had been drawn (December 31, 2015 – $39.3 million). Specific investment properties with a fair value of $124.8 million (December 31, 2015 – $123.5 million) have been pledged as collateral security for the operating facility. This facility is subject to certain covenants, including vacancy achievement and debt service coverage. As of March 31, 2016, Northview was in compliance with all covenants. During the three months ended March 31, 2016, Northview increased the $15.0 million facility to $20.0 million. The $20.0 million facility bears interest at prime plus 0.75% or Bankers’ Acceptance plus 2.00% with a maturity date of July 23, 2016. As of March 31, 2016, the maximum borrowing capacity was $20.0 million (December 31, 2015 – $15.0 million) based on the investment properties pledged. At March 31, 2016, $17.5 million had been drawn (December 31, 2015 – $7.0 million). Specific investment properties with a fair value of $37.2 million (December 31, 2015 – $34.5 million) have been pledged as collateral security for the operating facility. This facility is subject to certain covenants, including lease term minimums and debt service coverage. As of March 31, 2016, Northview was in compliance with all covenants. On March 31, 2016, Northview received $5.4 million under a single advance non-revolving term bridge facility, bearing interest at prime plus 1.75% with a maturity date of June 29, 2016, to complete the repayment of the $350.0 million bridge facility. The financing is unsecured. At March 31, 2016, $5.4 million had been drawn.

Northview Apartment Real Estate Investment Trust Notes to the Unaudited Condensed Consolidated Financial Statements Three months ended March 31, 2016 and 2015 (Tabular amounts expressed in thousands of Canadian dollars except where indicated)
Northview 2016 First Quarter │15
(ii) Northview entered into two bridge facilities for a total of $350.0 million to fund the Transaction on October 30, 2015. The first bridge facility was a two-year senior secured non-revolving term loan facility bearing interest at prime plus 0.7% or Bankers’ Acceptance plus 1.95% for the amount of $325.0 million with a maturity date of October 30, 2017. The second bridge facility was a six month term, with a six month extension subject to lender approval, senior secured non-revolving equity bridge facility bearing interest at prime plus 1.25% or Bankers’ Acceptance plus 2.5% for the amount of $25.0 million with a maturity date of April 30, 2016. During the first quarter of 2016, the two bridge facilities were repaid in full.
(iii) The land financing relates to land held for development and bears interest at prime plus 0.50% or Bankers’ Acceptance plus 2.00% with a
maturity date of October 31, 2018. Financing is secured by six parcels of land held for development. (iv) At March 31, 2016, Northview had three construction financing loans outstanding relating to the developments in Airdrie, AB; Fort St. John, BC;
and Bonnyville, AB. Interest rates range from prime plus 0.50% to 0.75% or Banker’s Acceptance plus 2.00% to 2.20%. Maturity dates range from May 31, 2016, to December 31, 2016.
10. Unit based payments a) Performance Units On May 6, 2015, the Trustees approved a new unit award plan comprised of a Long-Term Incentive (“LTI”) plan, whereby Performance Units are issued to executives and key personnel of Northview. The unit award plan will be used in place of the former Long-Term Incentive Plan (“LTIP”). Each Performance Unit entitles the employees to receive payment upon vesting in the form of voting units of Northview. Performance Units vest over a period of up to three years and incorporate performance criteria established at the time of grant. Performance Units accumulate additional Performance Units at the same rate that distributions are paid on units from the time of granting until vesting. Northview intends to settle all Performance Units with units either through the purchase of voting units on the open market or the issuance of new units from treasury; however, wholly at its own discretion, Northview may settle the units in cash. Compensation expense is recognized in net and comprehensive income over the service period. Total Performance Units granted under the LTI plan are as follows:
Three months ended March 31, 2016
Year ended December 31, 2015
Number of Units Issue Price Number of Units Issue Price
Balance, January 1 72,910 - - -
Units granted 115,323 - 74,535 -
Units cancelled (6,068) - (1,625) -
Balance, end of period 182,165 - 72,910 -
Performance Units granted under the LTI plan to key management personnel (also included in the above table) are as follows:
Three months ended March 31, 2016
Year ended December 31, 2015
Number of Units Issue Price Number of Units Issue Price
Balance, January 1 33,266 - - -
Units granted 45,400 - 33,266 -
Units cancelled (6,068) - - -
Balance, end of period 72,598 - 33,266 -
b) Long-term incentive plan Northview has an LTIP for the executives and key personnel, based on the results of each fiscal year. This plan was replaced with the LTI plan described in Note 10(a). As such, Northview does not intend to grant any additional securities under the LTIP. The total amount of LTIP awards are determined at the end of each fiscal year by the Trustees based on an assessment of the performance of Northview and the individual performance of the executives and key personnel. The number of units granted is based on the weighted average trading price on December 31 of each year. Pursuant to the policy, rights to units generally vest in 1/3 tranches: immediately upon award, then 12 and 24 months following.

Northview Apartment Real Estate Investment Trust Notes to the Unaudited Condensed Consolidated Financial Statements Three months ended March 31, 2016 and 2015 (Tabular amounts expressed in thousands of Canadian dollars except where indicated)
Northview 2016 First Quarter │16
Total Units granted and issued under the LTIP are as follows:
Three months ended March 31, 2016
Year ended December 31, 2015
Number of Units Issue Price Number of Units Issue Price
Balance, January 1 2,980 - 36,895 -
Units issued (325) $18.46 (33,915) $21.06
Balance, end of period 2,655 - 2,980 -
Units granted and issued under the LTIP to key management personnel (also included in the above table) are as follows:
Three months ended March 31, 2016
Year ended December 31, 2015
Number of Units Issue Price Number of Units Issue Price
Balance, January 1 1,293 - 16,052 -
Units issued (325) $18.46 (14,759) $20.92
Balance, end of period 968 - 1,293 -
c) Deferred Units On May 6, 2015, the Unitholders approved a new unit award plan, whereby Deferred Units are issued to Trustees of Northview. The Deferred Unit Plan (“DUP”) is an alternative form of compensation for non-executive Trustees of Northview. Total compensation expense is recognized at the time of grant. Deferred Units accumulate additional Deferred Units at the same rate that distributions are paid on units from the time of granting until vesting. Fluctuations in the market value are recognized in fair value in the consolidated statements of net and comprehensive income in the period in which the fluctuations occur. For the year ended December 31, 2015, 10,026 Deferred Units were granted. During the year ended December 31, 2015, Northview did not settle any Deferred Units. The carrying amount of the liability, included in unit based payments, relating to the cash-settled Deferred Units at December 31, 2015 is $0.2 million. At December 31, 2015, 10,026 Deferred Units are vested and outstanding. Deferred Units are redeemable upon the Trustee’s retirement from Northview. Total Deferred Units granted under the DUP are as follows:
Three months ended March 31, 2016
Year ended December 31, 2015
Number of Units Issue Price Number of Units Issue Price
Balance, January 1 10,026 - - -
Units granted - - 10,026 -
Balance, end of period 10,026 - 10,026 -
11. Unitholders’ equity a) Trust Units The number of Trust Units issued and outstanding at March 31, 2016, and December 31, 2015, is as follows:
Three months ended
March 31, 2016 Year ended
December 31, 2015
Number of Units Amount Number of Units Amount
Balance, January 1 44,410,640 1,053,626 31,674,160 818,041
LTIP units issued 325 6 33,915 715
Units issued 1,910,853 31,300 12,702,565 234,870
Balance, end of period 46,321,818 1,084,932 44,410,640 1,053,626

Northview Apartment Real Estate Investment Trust Notes to the Unaudited Condensed Consolidated Financial Statements Three months ended March 31, 2016 and 2015 (Tabular amounts expressed in thousands of Canadian dollars except where indicated)
Northview 2016 First Quarter │17
b) Class B LP Units and Special Voting Units The Class B LP Units are units issued by subsidiaries of Northview and can be issued in conjunction with property acquisitions. The Class B LP Units can be exchanged for Trust Units at any time at the option of the holder. Each Class B LP Unit will have a “Special Voting Unit” attached to it, which will entitle the holder to one vote, either in person or by proxy, at the meeting of Unitholders of the Trust as if he or she was a Unitholder of the Trust. Subsidiaries of Northview are authorized to issue Class B LP Units and Special Voting Units. The ability to exchange Class B LP Units for Trust Units implies a liability element exists because it imposes an unavoidable obligation to deliver units of the Trust (i.e., a financial instrument of another entity). Therefore, Class B LP Units are classified as financial liabilities on the consolidated statements of financial position. The total number of Class B LP Units and Special Voting Units outstanding as at March 31, 2016 is 5,898,686 (December 31, 2015 – 7,809,539) with a corresponding liability of $110.2 million (December 31, 2015 – $137.1 million). During the three months ended March 31, 2016, 1,910,853 Class B LP and Special Voting Units (December 31, 2015 – nil) were exchanged for Trust Units with a fair value of $31.3 million by a Trustee, a related party. The continuity schedule for the Class B LP and Special Voting Units classified as liabilities is as follows:
Date Description
Issue Price/
Call Price Number of
Units Amount
January 1, 2015 $27.75 67,796 1,612
Q1, 2015 Fair value adjustment $23.58 - (13)
Q2, 2015 Fair value adjustment $22.38 - (81)
Q3, 2015 Fair value adjustment $19.73 - (180)
October 30, 2015 Issuance of Class B LP and Special Voting Units $18.49 7,741,743 143,144
Q4, 2015 Fair value adjustment $17.56 - (7,347)
December 31, 2015 $17.56 7,809,539 137,135
February 11, 2016 Exchange of Class B LP and Special Voting Units $16.38 (1,910,853) (31,300)
Q1, 2015 Fair value adjustment $18.68 - 4,369
March 31, 2016 $18.68 5,898,686 110,204
c) Distributions to Unitholders Pursuant to the DOT, holders of Trust Units and Class B LP Units are entitled to receive distributions made on each distribution date as approved by the Trustees. During the three months ended March 31, 2016, Northview declared monthly cash distributions of $0.1358 per Unit. For the three months ended March 31, 2016, Northview declared distributions totaling $21.3 million (March 31, 2015 – $12.9 million). d) Normal course issuer bid (“NCIB”) On July 31, 2014, the TSX approved Northview’s notice of intention to renew the NCIB for its Trust Units. Northview's NCIB was made in accordance with the policies of the TSX. Northview was allowed to purchase Trust Units during the period from August 6, 2014, to August 5, 2015, or an earlier date had Northview completed its maximum purchases. As of March 31, 2016, the NCIB has expired and has not been renewed.

Northview Apartment Real Estate Investment Trust Notes to the Unaudited Condensed Consolidated Financial Statements Three months ended March 31, 2016 and 2015 (Tabular amounts expressed in thousands of Canadian dollars except where indicated)
Northview 2016 First Quarter │18
12. Guarantees, commitments and contingencies In the ordinary course of business, Northview may provide indemnification commitments to counterparties in transactions such as credit facilities, leasing transactions, service arrangements, director and officer indemnification agreements, and sales of assets. These indemnification agreements may require Northview to compensate the counterparties for costs incurred as a result of changes in laws and regulations (including tax legislation) or as a result of litigation claims or statutory sanctions that may be suffered by counterparties as a consequence of the transaction. The terms of these indemnification agreements vary based on the contract and do not provide any limit on the maximum potential liability. To date, Northview has not made any payments under such indemnifications and no amount has been accrued in the consolidated financial statements with respect to these indemnification commitments. In the normal course of operations, from time to time, Northview becomes subject to various legal and other claims. Management and its legal counsel evaluate these claims and, where required, accrue the best estimate of costs relating to these claims. Management believes the outcome of claims of this nature at March 31, 2016 will not have a material impact on Northview. During the normal course of operations, Northview provided guarantees for mortgages payable relating to investments in corporations and joint ventures where Northview owns less than 100%. The mortgages payable are secured by specific charges against the properties owned by the corporations and joint ventures. In the event of a default of the corporation or joint venture, Northview may be liable for up to 100% of the outstanding balances of these mortgages payable. At March 31, 2016, Northview has provided guarantees on mortgages secured by investment properties totaling $11.8 million (December 31, 2015 – $12.0 million) of its equity accounted joint ventures, Inuvik Commercial Properties Zheh Gwizu’ Limited Partnership (“ICP”) and Inuvik Capital Suites Zheh Gwizuh Limited Partnership (“ICS”). These mortgages bear interest at rates ranging from 2.43% to 5.50% and mature between April 2016 and December 2020 (December 31, 2015 – 2.43% to 5.50% and mature between January 2016 and March 2020). As at March 31, 2016, land and buildings with a carrying value of $16.2 million have been pledged to secure these mortgages payable (December 31, 2015 – $16.2 million). Due to the equity accounting of ICP and ICS, the mortgage balances have not been recorded in Northview’s consolidated financial statements. Management believes no default will occur and, accordingly, no amount has been recorded by Northview in these consolidated financial statements.
13. Financial instruments and risk management a) Fair value of financial assets and financial liabilities Northview’s financial assets and financial liabilities are carried at amortized cost, which approximates fair value, or at fair value through profit or loss (“FVTPL”) as applicable. Such fair value estimates are not necessarily indicative of the amounts Northview might pay or receive in actual market transactions. Fair value measurements recognized in the consolidated statements of financial position are categorized using a fair value hierarchy that reflects the significance of inputs used in determining the fair value:
i) Level 1: Quoted prices in active markets for identical assets or liabilities. ii) Level 2: Quoted prices in active markets for similar assets or liabilities or valuation techniques where significant inputs are based
on observable market data. iii) Level 3: Valuation techniques for which any significant input is not based on observable market data.

Northview Apartment Real Estate Investment Trust Notes to the Unaudited Condensed Consolidated Financial Statements Three months ended March 31, 2016 and 2015 (Tabular amounts expressed in thousands of Canadian dollars except where indicated)
Northview 2016 First Quarter │19
The tables below present the fair value of Northview's assets and liabilities, reflecting the significance of inputs used when determining the fair value as at March 31, 2016 and December 31, 2015:
March 31, 2016 December 31, 2015
Level 1 Level 2 Level 3 Level 1 Level 2 Level 3
Assets Investment properties - - 2,986,823 - - 3,025,468
Cash 899 - - 4,487 - -
Restricted cash 12,082 - - 9,738 - -
Assets held for sale - - 59,288 - - -
Liabilities
Mortgages payable - 1,747,412 - - 1,394,358 - Convertible debentures 23,345 - - 22,885 - - Class B LP Units - 110,204 - - 137,135 - Derivative instruments - 2,210 - - 1,515 - Unit based payments - 1,084 - - 788 -
Northview had no embedded derivatives requiring separate recognition as at March 31, 2016, or December 31, 2015. Transfers between levels in the fair value hierarchy are recognized on the date of the event or change in circumstances that caused the transfer. During the three months ended March 31, 2016, and year ended December 31, 2015, there were no transfers between Level 1, Level 2 and Level 3 classified assets and liabilities. Northview had no credit derivatives over financial assets at March 31, 2016, or December 31, 2015, and throughout the intervening periods.
The following summarizes the significant methods and assumptions used in estimating fair values of Northview's assets and liabilities measured at fair value and other financial instruments: (i) Investment properties Northview determined the fair value of each investment property using the valuation methodology and key assumptions described in Note 4. (ii) Mortgages payable The fair value of mortgages payable is estimated based on the present value of future payments, discounted at the yield on a Government of Canada bond with the nearest maturity date to the underlying mortgage, plus an estimated credit spread at the reporting date for a comparable mortgage or the yield of a comparable mortgage. The spread rates used at March 31, 2016, ranged from 1.01% to 2.35% (December 31, 2015 - 1.04% to 2.24%), depending on the nature and terms of the respective mortgages. (iii) Convertible debentures The fair value of the convertible debentures is determined based on the market trading prices of the convertible debentures as at the valuation date. As allowed under IFRS 13, Fair Value Measurement ("IFRS 13"), if an asset or liability measured at fair value has a bid and an ask price, the price within the bid-ask spread that is most representative of fair value in the circumstances shall be used to determine fair value. Northview has chosen to use the closing price at the end of the period of the convertible debentures as the fair value for the convertible debentures. (iv) Class B LP Units The fair value of the Class B LP Units is estimated based on the market trading prices of the Trust Units at the valuation date. As allowed under IFRS 13, if an asset or liability measured at fair value has a bid price and an ask price, the price within the bid-ask spread that is most representative of fair value in the circumstances shall be used to determine fair value. Northview has chosen to use the closing price of its Trust Units for fair value measurement for its Class B LP Units.
(v) Derivative instruments The fair value of the interest rate swap is determined using widely accepted valuation techniques including discounted cash flow analysis on the expected cash flows of the derivatives. The fair value is determined using the market standard methodology of netting the discounted future fixed cash payments and the discounted expected variable cash receipts. The variable cash receipts are based on expectation of future interest rates (forward curves) derived from observable market rate curves. The fixed cash payments are based on the rates disclosed in Note 7. (vi) Unit based payments Northview determines the fair value of Unit based payments and Deferred Units using the valuation methodology and key assumptions described in Note 2(l) of the consolidated financial statements for the year ended December 31, 2015.

Northview Apartment Real Estate Investment Trust Notes to the Unaudited Condensed Consolidated Financial Statements Three months ended March 31, 2016 and 2015 (Tabular amounts expressed in thousands of Canadian dollars except where indicated)
Northview 2016 First Quarter │20
(vii) Other financial assets and financial liabilities The fair values of Northview's other financial assets, which include cash, restricted cash, accounts receivable, prepaid expenses and other assets, as well as Northview's other financial liabilities, which include credit facilities, trade and other payables, and distributions and Class B LP interest payable, approximate their recorded values due to their short-term nature.
b) Risk management related to financial instruments Northview is exposed to utility, credit, interest rate, and liquidity risks associated with its financial assets and liabilities. The Trustees have responsibility for the establishment and approval of Northview’s overall risk management policies, including those related to financial instruments. Management performs continuous assessments so that all significant risks related to financial instruments are reviewed and addressed in light of changes to market conditions and Northview’s operating activities. (i) Utility cost risk Utility cost risk is the potential financial loss Northview may experience as a result of higher resource prices or lack of supply. Northview is exposed to utility cost risk from the fluctuation in retail prices for fuel oil, natural gas, and electricity, the primary utilities used to heat its properties. The exposure to utility cost risk is restricted primarily to the multi-family rental and execusuites and hotel portfolios. The leases in the commercial portfolio generally provide for recovery of operating costs from tenants, including utilities. Due to the northern locations of a significant portion of Northview’s portfolio, the exposure to utility price fluctuations is more pronounced in the first and last fiscal quarters of the year. Northview manages its exposure to utility risk through a number of preventative measures, including retrofitting properties with energy efficient appliances, fixtures, and windows. Northview does not utilize hedges or forward contracts to manage exposure to utility cost risk. Northview continues to implement a sub-metering program in properties located in Ontario. Sub-metering provides individual electric meters for each multi-family rental unit, allowing tenants to pay their electricity bills directly. This reduces utility costs to the landlord. As a result, Northview’s exposure to utility price fluctuations is minimized in Ontario. Heating oil is the primary source of fuel for heating properties located in Nunavut and Yellowknife, NT. Natural gas is the main source of fuel for heating properties located in Alberta, parts of British Columbia, New Brunswick, Nova Scotia, Ontario, Québec, Saskatchewan, and Inuvik, NT. Natural gas prices in Alberta, British Columbia, and Ontario are not subject to regulated price control. Northview does not use financial instruments to manage the exposure to the utility cost risk. Management prepared a sensitivity analysis of the impact of price changes in the cost of heating oil and natural gas. A 10% change in the combined average price of heating oil and natural gas would impact Northview’s net income by approximately $0.3 million for the three months ended March 31, 2016 (March 31, 2015 – $0.2 million). Electricity is the primary source for heating properties located in Newfoundland and Labrador, as well as parts of British Columbia. In Newfoundland and Labrador and British Columbia, electricity is purchased from the provincially regulated utilities and is directly paid by the residents for a significant portion of Northview’s multi-family rental units. As a result, there is no significant risk to Northview regarding the price of electricity in Newfoundland and Labrador and British Columbia. (ii) Credit risk Credit risk is the risk that one party to a financial instrument will cause a financial loss for the other party by failing to discharge an obligation. Northview’s credit risk primarily arises from the possibility that residents may not be able to fulfill their lease commitments. Loan receivables consist mainly of amounts due from commercial tenants. Given Northview’s collection history and the nature of these tenants, credit risk is assessed as low. Accounts receivable consists mainly of resident receivables. Resident receivables are comprised of a large number of residents spread across the geographic areas in which Northview operates. There are no significant exposures to single residents with the exception of the Governments of Canada, Nunavut and the Northwest Territories, which lease a large number of residential units and commercial space in the Northwest Territories and Nunavut. Northview mitigates credit risk through conducting thorough credit checks on prospective residents, requiring rental payments on the first of the month, obtaining security deposits approximating one month’s rent from residents where legislation permits, and geographic diversification in its portfolio. Northview records a specific bad debt provision on balances owed from past residents and provides an allowance for receivables, net of security deposits, from current residents where the expected amount to be collected is less than the actual accounts receivable. The aging of current residents and resident receivables is net of allowance for doubtful accounts from current and past residents. Northview classifies residents as past residents on the date of their move out from a residential unit. Any subsequent recovery of balances owed from past residents is recorded as a reduction in the bad debt provision for the period. The amounts disclosed on the consolidated statements of financial position are net of allowances for uncollectible accounts from current and past residents and other receivables, estimated by management based on prior experience and current economic conditions.

Northview Apartment Real Estate Investment Trust Notes to the Unaudited Condensed Consolidated Financial Statements Three months ended March 31, 2016 and 2015 (Tabular amounts expressed in thousands of Canadian dollars except where indicated)
Northview 2016 First Quarter │21
The following is an aging of current residents and other receivables:
March 31, 2016 December 31, 2015
0-30 days 1,793 1,519
31-60 days 431 429
61-90 days 326 310
Over 90 days 2,333 2,062
Resident receivables 4,883 4,320
Other receivables 4,886 8,102
Allowance for doubtful accounts (44) (5)
9,725 12,417
Other receivables consist of goods and services tax rebates, mortgage holdbacks, insurance claims, and miscellaneous receivables. The reconciliation of changes in allowance for doubtful accounts is as follows:
March 31, 2016 December 31, 2015
Balance, January 1 5 848
Increase (decrease) in allowance for doubtful accounts 39 (843)
Balance, end of year 44 5
(iii) Interest rate risk Interest rate risk is the risk that the value of future cash flows of a financial instrument will fluctuate as a result of changes in market interest rates. Northview is exposed to interest rate risk on mortgages payable and its credit facilities and does not hold any financial instruments to mitigate that risk. In the current economic environment, it is difficult to predict what future interest rates will be and, as such, Northview may not be able to continue to renew mortgage loans with interest rates that are lower than those currently in place. Northview utilizes both fixed and floating rate debt. Interest rate risk related to floating interest rates is limited primarily to the utilization of credit facilities. Management mitigates interest rate risk by utilizing fixed rate mortgages, ensuring access to a number of sources of funding, and staggering mortgage maturities with the objective of achieving relatively even annual debt maturities. To the extent possible, Northview maximizes the amount of mortgages on residential rental properties where it is possible to lower interest rates through CMHC mortgage insurance. A sensitivity analysis on floating rate debt has been completed based on the exposure to interest rates at the statement of financial position date. Floating rate debt includes all mortgages payable which are not subject to fixed interest rates and the credit facilities. A 0.50% change in interest rates, keeping all other variables constant, would change Northview’s net income for the three months ended March 31, 2016, by approximately $0.4 million (December 31, 2015 – $0.5 million). For the three months ended March 31, 2016, the average floating rate debt was $4.2 million and the average credit facilities balance was $266.1 million (December 31, 2015 – average floating rate debt was $4.2 million and the average credit facilities balance was $240.0 million). During the first quarter of 2016, the two bridge facilities with a total of $350.0 million were repaid in full. (iv) Liquidity risk Liquidity risk is the risk that Northview is not able to meet its financial obligations as they fall due or can do so only at excessive cost. Northview manages liquidity risk by managing mortgage and loan maturities to ensure a relatively even amount of mortgage maturities in each year. Cash flow projections are completed on a regular basis to ensure there will be adequate liquidity to maintain operating, capital, and investment activities in addition to making monthly distributions to Unitholders. The Trustees review the current financial results and the annual business plan in determining appropriate distribution levels. Contractual maturity for non-derivative financial liabilities at March 31, 2016:
Carrying Amount
Contractual Cash Flows
0 – 6 months
6 months to 1 year
1 – 5 years
Over 5 years
Mortgages payable 1,654,504 1,916,313 129,136 73,956 941,110 772,111
Credit facilities 167,800 167,800 167,800 - - -
Trade and other payables (i) 76,682 76,682 76,682 - - -
Distributions and Class B LP interest payable
7,092 7,092 7,092 - - -
(i) Security deposits payable are included in trade and other payables.
Contractual maturity for derivative financial liabilities at March 31, 2016:
Carrying Amount
Contractual Cash Flows
0 – 6 months
6 months to 1 year
1 – 5 years
Over 5 years
Unit based payments 1,084 1,084 1,084 - - -

Northview Apartment Real Estate Investment Trust Notes to the Unaudited Condensed Consolidated Financial Statements Three months ended March 31, 2016 and 2015 (Tabular amounts expressed in thousands of Canadian dollars except where indicated)
Northview 2016 First Quarter │22
Contractual maturity for non-derivative financial liabilities at December 31, 2015:
Carrying Amount
Contractual Cash Flows
0 – 6 months
6 months to 1 year
1 – 5 years
Over 5 years
Mortgages payable 1,359,889 1,558,717 104,111 97,987 826,730 529,889
Credit facilities 483,743 483,743 483,743 - - -
Trade and other payables (i) 70,467 70,467 70,467 - - -
Distributions and Class B LP interest payable
7,089 7,089 7,089 - - -
(i) Security deposits payable are included in trade and other payables. Contractual maturity for derivative financial liabilities at December 31, 2015:
Carrying Amount
Contractual Cash Flows
0 – 6 months
6 months to 1 year
1 – 5 years
Over 5 years
Unit based payments 788 788 788 - - -
Management believes that future cash flows from operations, mortgage refinancing, and cash available under the current operating facilities provide sufficient available funds through the foreseeable future to support these financial liabilities.
14. Capital management Northview’s objectives when managing its capital are to safeguard its assets while maximizing the growth of its business, returns to Unitholders, and maintaining the sustainability of cash distributions. Northview’s capital consists of mortgages payable, credit facilities, Trust Units, and Class B LP Units. Management monitors Northview’s capital structure on an ongoing basis to determine the appropriate level of mortgages payable to be placed on specific properties at the time of acquisition or when existing debt matures. Northview follows conservative guidelines which are set out in the DOT. In determining the most appropriate debt, consideration is given to strength of cash flow generated from the specific property, interest rate, amortization period, maturity of the debt in relation to the existing debt of Northview, interest and debt service ratios, and limits on the amount of floating rate debt. Northview has credit facilities which are used to fund acquisitions, development, and capital expenditures until specific mortgage debt is placed or additional equity is raised. Consistent with others in the industry, Northview monitors capital on the basis of debt to gross book value ratio. The DOT provides for a maximum debt to gross book value ratio of 70%. For the purposes of these consolidated financial statements, Debt to Gross Book Value is calculated on the consolidated entities.
Northview’s calculations of its adherence to bank covenants are considered non-GAAP measures. As at March 31, 2016, Northview was in compliance with all covenants.
The following debt to gross book value, interest coverage, and debt service coverage excludes the 2019 Debentures and interest expenses on 2019 Debentures.
March 31, 2016 December 31, 2015
Debt to gross book value
Cash (899) (4,487)
Credit facilities 167,800 483,743
Mortgages payable 1,702,543 1,357,215
Debt 1,869,444 1,836,471
Investment properties 2,986,823 3,025,468
Property, plant and equipment 40,524 55,510
Properties held for sale 74,202 -
Accumulated depreciation and amortization 23,409 22,156
Gross book value 3,124,958 3,103,134
Debt to gross book value 59.8% 59.2%

Northview Apartment Real Estate Investment Trust Notes to the Unaudited Condensed Consolidated Financial Statements Three months ended March 31, 2016 and 2015 (Tabular amounts expressed in thousands of Canadian dollars except where indicated)
Northview 2016 First Quarter │23
Twelve months ended
March 31, 2016 Year ended
December 31, 2015
Interest coverage and debt service coverage
Income before income taxes 21,715 31,852
Depreciation and amortization 5,287 5,030
Mortgage interest and deferred financing costs 36,260 32,250
Interest expense on credit facilities 5,922 3,315
Interest expense to Class B LP Unitholders 4,848 2,213
Bargain purchase gain (50,893) (50,893)
Business combination transaction costs 53,075 38,959
Unrealized fair value changes 61,686 55,103
Income before interest, taxes, depreciation and amortization, unrealized fair value changes, bargain purchase gain, and business combination transaction costs 137,900 117,829
Mortgage interest and deferred financing costs 36,260 32,250
Interest expense on credit facilities 5,922 3,315
Total interest expense 42,182 35,565
Principal repayment 32,981 27,757
Debt service payments 75,163 63,322
Interest coverage 3.27 3.31
Debt service coverage 1.83 1.86
Northview’s operating facilities contain certain financial covenants. The interest coverage ratio and debt service coverage ratio covenant minimum threshold is of at least 1.90 and 1.50, respectively. Interest coverage and debt service coverage are calculated based on the most recently completed four fiscal quarters. Debt to gross book value as at March 31, 2016, interest coverage, and debt service coverage for the twelve months ended March 31, 2016, including the 2019 Debentures and interest expenses on 2019 Debentures is 60.6%, 3.24, and 1.83, respectively (December 31, 2015 – 59.9%, 3.30, and 1.86, respectively).
15. Financing costs
Three months ended
March 31, 2016 Three months ended
March 31, 2015
Mortgage interest 10,723 6,719
Deferred financing costs 535 529
Interest expense on 2019 debentures 330 -
Interest expense on credit facilities 2,968 361
Interest expense to Class B LP Unitholders 2,663 28
Interest and other income (177) (199)
Loss on extinguishment of debt 201 118
17,243 7,556

Northview Apartment Real Estate Investment Trust Notes to the Unaudited Condensed Consolidated Financial Statements Three months ended March 31, 2016 and 2015 (Tabular amounts expressed in thousands of Canadian dollars except where indicated)
Northview 2016 First Quarter │24
16. Unrealized fair value changes
Three months ended
March 31, 2016 Three months ended
March 31, 2015
Unrealized fair value change to investment properties (8,556) (4,575)
Sustaining CAPEX 10,362 5,372
Interest rate swap 695 -
2019 debentures 460 -
Unit based payments 20 (16)
Class B LP Units 4,370 (13)
Net unrealized fair value decrease 7,351 768
17. Changes in non-cash working capital
Three months ended
March 31, 2016 Three months ended
March 31, 2015
Restricted cash (487) (4)
Accounts receivable 2,683 (1,031)
Prepaid expenses and other assets (73) 315
Loans receivable 241 (1,078)
Other long-term assets (219) 10
Trade and other payables 5,717 (5,669)
Changes in non-cash working capital from operating activities 7,862 (7,457)
The changes in non-cash working capital from investing activities for the three months ended March 31, 2016, of $0.1 million cash outflow (March 31, 2015 – $3.9 million cash inflow) is due to the change in trade and other payables related to work in progress with respect to investment property improvements and land held for development.
18. Segmented information Management uses geographic segments (i.e. groups of provinces and territories) to manage the properties. The geographic segments consist of Atlantic Canada (Newfoundland and Labrador, Nova Scotia, and New Brunswick), Northern Canada (Northwest Territories and Nunavut), Ontario, Québec, and Western Canada (British Columbia, Alberta, and Saskatchewan). In addition, due to the differences between the commercial and the residential markets, management also reviews operations by market segment. Within the residential property market, execusuites and hotel are reviewed and managed as separate sub-segments. Northview’s residential portfolio is comprised of a multi-family segment: apartments, town homes, and single family rental units; and an execusuites and hotel segment where the rental period ranges from a few days to several months. The commercial business segment is comprised of office, industrial, and retail properties primarily in areas where Northview has residential operations. a) Geographic Segments
Atlantic Canada
Northern Canada Ontario Québec
Western Canada Total
Three months ended March 31, 2016
Rental revenue 11,109 22,255 22,597 4,531 18,996 79,488
Other revenue 190 4,095 1,298 104 1,132 6,819
Operating expense (6,230) (8,970) (12,581) (2,488) (9,059) (39,328)
Net operating income 5,069 17,380 11,314 2,147 11,069 46,979
As at March 31, 2016
Total assets 399,803 609,722 983,694 181,407 933,301 3,107,927
Investment properties 374,021 576,273 925,569 178,863 932,097 2,986,823
Total liabilities 233,249 293,590 611,606 139,146 433,936 1,711,527

Northview Apartment Real Estate Investment Trust Notes to the Unaudited Condensed Consolidated Financial Statements Three months ended March 31, 2016 and 2015 (Tabular amounts expressed in thousands of Canadian dollars except where indicated)
Northview 2016 First Quarter │25
Atlantic Canada
Northern Canada Ontario Québec
Western Canada Total
Three months ended March 31, 2015
Rental revenue 6,057 21,741 - 328 19,277 47,403
Other revenue 227 548 - 3 640 1,418
Operating expense (3,105) (10,191) - (154) (9,031) (22,481)
Net operating income 3,179 12,098 - 177 10,886 26,340
As at December 31, 2015
Total assets 397,842 624,109 981,084 172,993 928,606 3,104,634
Investment properties 378,434 576,806 975,821 170,562 923,845 3,025,468
Total liabilities 195,385 305,734 343,364 141,541 436,343 1,422,367
b) Market Segments
Multi-family Execusuites &
Hotel Total
Residential Commercial Total
Three months ended March 31, 2016
Rental revenue 68,110 3,070 71,180 8,308 79,488
Other revenue 6,573 46 6,619 200 6,819
Operating expense (34,342) (1,714) (36,056) (3,272) (39,328)
Net operating income 40,341 1,402 41,743 5,236 46,979
As at March 31, 2016
Total assets 2,828,170 31,715 2,859,885 248,042 3,107,927
Investment properties 2,747,245 - 2,747,245 239,578 2,986,823
Total liabilities 1,568,001 17,928 1,585,929 125,598 1,711,527
Multi-family Execusuites &
Hotel Total
Residential Commercial Total
Three months ended March 31, 2015
Rental revenue 36,586 2,716 39,302 8,101 47,403
Other revenue 1,004 51 1,055 363 1,418
Operating expense (17,434) (1,794) (19,228) (3,253) (22,481)
Net operating income 20,156 973 21,129 5,211 26,340
As at December 31, 2015
Total assets 2,809,539 46,483 2,856,022 248,612 3,104,634
Investment properties 2,787,123 - 2,787,123 238,345 3,025,468
Total liabilities 1,267,209 25,941 1,293,150 129,217 1,422,367
c) Reconciliation of reportable segment net income
Three months ended
March 31, 2016 Three months ended
March 31, 2015
Total net operating income for reportable segments 46,979 26,340
Financing costs (17,243) (7,556)
Administration (2,664) (2,482)
Depreciation and amortization (1,430) (1,173)
Gain (loss) on sale of property, plant and equipment 1 (21)
Equity income from joint ventures 305 278
Business combination transaction costs (14,116) -
Unrealized fair value changes (7,351) (768)
Net and comprehensive income 4,481 14,618

Northview Apartment Real Estate Investment Trust Notes to the Unaudited Condensed Consolidated Financial Statements Three months ended March 31, 2016 and 2015 (Tabular amounts expressed in thousands of Canadian dollars except where indicated)
Northview 2016 First Quarter │26
d) Reconciliation of reportable segment assets March 31, 2016 December 31, 2015
Total assets for reportable segments 3,107,927 3,104,634
Property, plant and equipment 316 329
Investment in joint ventures 6,472 6,210
Intangible assets (399) (383)
Loans receivable 5,544 5,743
Prepaid expenses and other assets (376) (146)
Accounts receivable 5,872 5,682
Restricted cash 8,401 8,743
Cash 649 1,805
Assets held for sale 14,914 -
Total assets 3,149,320 3,132,617
e) Reconciliation of reportable segment liabilities
March 31, 2016 December 31, 2015
Total liabilities for reportable segments 1,711,527 1,422,367
Class B LP Units 110,204 137,135
Convertible debentures 23,345 22,885
Derivative instruments 2,210 1,515
Credit facilities 167,800 483,743
Trade and other payables 19,659 7,989
Distributions and Class B LP interest payable 7,092 7,089
Unit based payments 1,084 788
Liabilities related to assets held for sale 40,147 -
Total liabilities 2,083,068 2,083,511
19. Assets held for sale As at March 31, 2016, there are sixteen (16) non-core properties across the portfolio classified as ‘Assets held for sale’ with a fair value of $59.3 million and property, plant, and equipment with a book value of $14.9 million which are expected to be disposed of within twelve (12) months. The associated mortgages on these properties in the amount of $40.1 million have been reclassified from mortgages payables to ‘Liabilities related to assets held for sale’. The revenue and expense for these properties are reported in net and comprehensive income in the consolidated statements of net and comprehensive income. The results of the assets held for sale included in the consolidated statements of financial position are set out below:
Statement of financial position from assets held for sale March 31, 2016 December 31, 2015
Assets
Investment properties 59,288 -
Property, plant and equipment 14,914 -
74,202 -
Liabilities
Mortgage payable 40,147 -
40,147 -
Net assets from assets held for sale 34,055 -

Northview Apartment Real Estate Investment Trust Notes to the Unaudited Condensed Consolidated Financial Statements Three months ended March 31, 2016 and 2015 (Tabular amounts expressed in thousands of Canadian dollars except where indicated)
Northview 2016 First Quarter │27
20. Related parties
Related party transactions are conducted in the normal course of operations and are made on terms equivalent to those used in arm’s length transactions. During the period, revenue from associates related to management fees and maintenance service fees received from ICP and ICS, and receipt of services from associates related to rent paid by Northview to ICP, was as follows:
Transactions for the three months ended March 31
Balance Outstanding as at March 31
2016 2015 2016 2015
Revenue from associates 103 80 41 22
Receipt of services from associates 13 13 32 6
Northview has engaged Starlight to perform certain services, as outlined below. Starlight is a related party as it is controlled by a significant Unitholder of Northview. Pursuant to the Transitional Services Agreement dated October 30, 2015, Starlight is to provide transitional services of an asset management nature for a monthly fee equal to 0.125% of the sum of: (i) the agreed upon allocated values of the properties acquired from True North and its affiliates in connection with the Transaction; (ii) the third party appraised values of the private portfolio acquired by Northview in connection with the Transaction; (iii) the purchase price of new sourced properties; (iv) the third party appraised values of added properties; and (v) the cost of any capital expenditures incurred by Northview or any of its affiliates in respect of the properties since the closing date of the Transaction. This agreement is for a term of three years ending October 30, 2018, with Northview having the option to exclude the New Brunswick and Nova Scotia properties from the agreement after the second year. At Northview’s option, the term may be renewed for two additional one year terms. For the three months ended March 31, 2016, the costs of these services aggregated to $0.5 million, of this amount $0.4 million has been capitalized, while the remaining $0.1 million has been recognized as administration expenses in the consolidated statements of net and comprehensive income. During the three months ended March 31, 2016, 1,910,853 Class B LP and Special Voting Units were exchanged for Trust Units with a fair value of $31.3 million by a Trustee, a related party. Exchange of Class B LP and Special Voting Units to REIT Trust Units does not affect total ownership.
21. Subsequent events One additional property with a fair value of $12.2 million was considered to be an asset held for sale subsequent to March 31, 2016 and was not recognized as an asset held for sale as at March 31, 2016. On May 2, 2016, Northview entered into agreements to consolidate the $75.0 million and $45.0 million operating facilities into one operating facility. In addition, Northview entered into an agreement to establish a $30.0 million operating facility secured by certain properties in Nunavut. The agreements to both operating facilities are subject to customary closing conditions.


