Download - Topographic studies on visual neurons in the dorsolateral prefrontal cortex of the monkey
Exp Brain Res (1983) 53:47-58 E . _mental Brain Research �9 Springer-Verlag 1983
Topographic Studies on Visual Neurons in the Dorsolateral Prefrontal Cortex of the Monkey*
H. Suzuki and M. Azuma
Dept. of Physiology, Hirosaki University Faculty of Medicine, Hirosaki 036, Japan
Summary. The topographic distribution and organi- zation of visual neurons in the prefrontal cortex was examined in alert monkeys. The animal was trained to fixate straight ahead onto a tinty, dim light spot. While he was fixating, we presented a stationary second light spot (RF spot) at various locations in the visual field and examined unit responses of the prefrontal neurons to the RF-spot stimulus. Many prefrontal neurons, especially those located in the relatively superficial layers of the cortex, responded with a phasic and/or tonic activation to the RF spot illuminating a limited extent of the visual field, a receptive field (RF) being so determined. The visual neurons were found to be widely distributed in the prearcuate and inferior dorsolateral areas. One hemisphere mainly represented the contralateral vis- ual field. According to the location of the neurons in these areas, their visual properties varied with re- spect to RF eccentricity from the fovea and in size. The neurons located in the lateral part of the areas and close to the inferior arcuate sulcus had relatively small RFs representing the foveal and parafoveal regions. When the recording site was moved medially, the RFs became eccentric from the fovea and were larger. Then, the neurons located between the caudal end of the principal sulcus and the arcuate sulcus had RFs with a considerable eccentricity. The size of the RF became progressively larger for anteriorly located neurons and this occurred gener- ally without a change in RF eccentricity. The visual neurons were not organized on a regular pattern in the cortex with regard to their RF direction (vector angle) from the foveal region. From these observa- tions, we conclude, first, that the prearcuate and inferior dorsolateral areas of the prefrontal cortex
* Supported by Grant-in-aid for Scientific Research 444022, 587030 and Special Project Research Grant 56121-- [ from the Ministry of Education, Science and Culture of Japan
Offprint requests to: Hisao Suzuki, MD (address see above)
are functionally differentiated so that the lateral area's function is related to central vision, while that of the medial area to ambient vision. Second, the RF representation on the cortex with loss of the vector relation may generate an interaction between sepa- rate objects in visual space and may subserve the control of attention ]performance.
Key words: Visual neuron - Prefrontal cortex - Alert monkey - Visual representation - Visual receptive field
Introduction
In a previous paper', we showed that the inferior dorsolateral and inferior prearcuate areas (IDL) of the prefrontal cortex contain many neurons which increase their discharge rate during foveal fixation on a light spot (Suzuki and Azuma 1977). Further investigation revealed that the activation includes several visual processes including an intentional one (Suzuki et al. 1979). These cortical regions may mediate functions concerned with central vision such as visual foveation to an object or visual attention in a broad sense. On the other hand, the prearcuate area posterior to the end of the principal sulcus seems to mediate processes relating to ambient vision. Using alert monkeys, Mohler et al. (1973) found neurons in the area that had a relatively large receptive field (RF) often located in the peripheral visual field contralateral to the recording hemi- sphere. The neurons did not show activation during fixation to a visual stimulus per se, indicating that they had rather peripheral RFs, sparing the fovea. These neurons frequently showed an enhancement of their visual response when the animal made a saccade to a stimulus in the RF (Wurtz and Mohler 1976;
48 H. Suzuki and M. Azuma: Topography of Prefrontal Neurons
Goldberg and Bushnell 1981). Such a functional differentiation within the prefrontal cortex in terms of neuronal location was also described by Pigarev et al. (1979). Neurons anteriorly located in the ar- cuate region required more complex visual stimuli for their activation as compared to posteriorly located neurons.
Thus, it is expected that a wide area of the prefrontal cortex is concerned with the processing of visual information, and may further be differentiated with respect to specific visual functions. Recently, Mikami et al. (1982) found visual neurons over a wide area of prefrontal cortex, but they did not mention the areal differences of their neuronal properties. In this paper, we report the investigation of a neuron population widely located in the periprin- cipal and periarcuate areas of the prefrontal cortex in order to elucidate their different visual properties with particular reference to properties of visual RF. A preliminary report has appeared elsewhere (Azuma and Suzuki 1981).
Methods
Training of Fixation Behavior
Six male monkeys (Macaca rnulatta) weighing 5.0-8.4 kg were used. The monkeys were first trained to gaze steadily at a tiny, dim light spot (Wurtz 1969; Suzuki and Azuma 1977; Suzuki et al. 1979; Mikami et al. 1982). Each animal was seated in a primate chair facing a translucent screen 1.5 x 1.5 m square, illuminated diffusely at 1 cd/m 2 and placed 58 cm away from his eyes. After an intertrial interval of 4--6 s, a tiny, faint spot appeared on the center of the screen. By pressing a lever in front of him, the center spot stayed on for a duration of multiples of 0.5 s from 1 to 4 s, and then it slightly brightened for 0.5 s. A rapid lever-release within this bright period (except for the first 0.2 s) resulted in the delivery of 0.1-0.2 ml of orange-flavored sweet juice with the turning off of the light spot. The light spot was as small as 0.1 ~ in visual angle and the level of brightening was near-threshold for detection. There- fore, the monkey could not detect the brightening unless he gazed directly at the spot. Thus, a continuous gaze behavior was elicited during the light-spot presentation.
The training method for this fixation task was described in detail in other papers (Suzuki and Azuma 1977; Suzuki et al. 1979). In this training for fixation, it was essential that very early in the training period the animal was taught to select the center spot as the only cue for getting the reward. Otherwise, various kinds of timing behavior were elicited which remained for long periods and led to long periods of training. It took 2 weeks - 1 month to establish the fixation behavior.
Surgery
After the above training was completed, a cylinder (20 mm diameter) for attaching a microelectrode positioner was implanted in the skull under Sernylan (phencyclidine hydrochloride) anes- thesia. Bolts and nuts specially designed for restraining the monkey's head were also anchored to .the skull. These implants
were all made of Ni-Co-Mo alloy (Nippon Kinzoku, 22A) which was formed for orthopedic use to elicit negligible reactions by the animal's tissue.
The experiments to examine the visual properties of prefron- tal neurons were started 2 weeks or more after the surgery when any damage of the brain due to surgery had been virtually recovered from. To control infection, Kanamycin sulfate (Banyu) was injected into the animal once a day.
Presentation of Receptive Field Stimulus
In the experimental sessions, the monkey was seated in a primate chair with his head immobilized by the implanted bolts, perform- ing the fixation task. During maintained fixation of the center spot, a second light (RF spot) was projected via a double galvanometer mirror system onto various parts of screen (90 x 90~ The second light was used to define the RF of neurons under study. It was usually a round spot, presented 0.5 s after a lever- press and lasting for 1 s. Its rise time was reduced to 5 ms by a feed-back circuit. Neutral density filters were used so that its intensity level was kept at 1.0-1.5 log units above background.
While the center spot remained on, the monkey usually maintained fixation until the brightened, and made no eye movements toward the second spot. The eye position was moni- tored as horizontal and vertical electroculograms (EOGs). Inap- propriate eye movements occurring during the fixation period were detected by means of EOGs, and the trial was terminated automatically by an interposed 3 s time-out, a 5 ~ red-spot appear- ing in the center of the screen.
Stimulus generation, sequential control of the manipulandum during the trials and the presentation of RF light were carried out by a programmable controller developed in our laboratory.
Unit Recording and Data Processing
For recording unit activity, a microelectrode positioner (Narishige, MO-9) was attached to the implanted cylinder. With this device we could insert a glass-insulated Elgiloy microelectrode (Suzuki and Azuma 1976, 1979) through the intact dura into a desired location of the prefrontal cortex. The electrode had a sharp tip which was exposed 15-25 Ixm from the electrode insulation. Care was taken to sterilize the electrode, instruments and wound area. Typically, one penetration of the microelectrode into the cortex was under- taketi dally with a series of penetrations made at 1 mm intervals.
Unit activities were conventionally amplified and passed through a window discriminator. The converted pulses, together with EOGs and event signals, were fed into an interface led into a Nippon Data General 01 computer. Signals were processed on-line and shown on a computer display terminal (Tektronix, 4010-1) as raster patterns and peristimulus time histogram with respect to behavioral or stimulus events. A printed copy of this display was made by means of a Tektronix 4361 hard copy unit. Signals were also monitored on an oscilloscope and stored on a seven-channel FM tape recorder (Shinko, RCD-926H) for later analysis when necessary. Statistical analysis was made using a Nova 3 computer system.
When the dura was thickened after the lapse of time following surgery and the microelectrode could not readily penetrate it anymore, the monkey was reanesthetized and the granulation tissue on the dura was surgically removed under a binocular microscope. Granulation tissue could be almost completely removed leaving the dura intact. When all penetrations were finished at one cylinder site, the cylinder was sometimes moved to an adjacent part of the skull for exploring a new penetration area, or another cylinder implanted over the opposite hemisphere.
H. Suzuki and M. Azuma: Topography of Prefrontal Neurons 49
Histological Technique
After the experiments were finished, the animal was killed with Nembutal injection. Then, the brain surface was marked by electrolytic deposition of iron at four selected points near the rim and the center of the recording cylinder. The brain was perfused through the heart with saline, followed by formalin solution containing ferrocyanide, and then removed. The iron-marked places were colored by the Prussian blue reaction. The sites were plotted as point of known coordinates on a photograph of the brain surface. Using these landmarks, the electrode penetrations on the cortical surface were transfered into the corresponding points on the photograph. The sulcus was also used as a landmark because it was recognized by the depth of the first appearing unit activity on electrode penetration.
Some of unit recording sites were marked by electrolytic deposits of iron from the tip of the glass-insulated Elgiloy microelectrode (Suzuki and Azuma 1976, 1979). The removed brain was further hardened in the formalin solution, frozen and cut into 50 ~m thick sections. The marked recording site was evi- denced by the approximately 150 pJn blue spot that was also sometimes surrounded by a proliferation of glial cells. Sections were stained with cresyl violet for identification of the marked sites.
Results
Sampling of Visual Responses
2 0 -
1 0 -
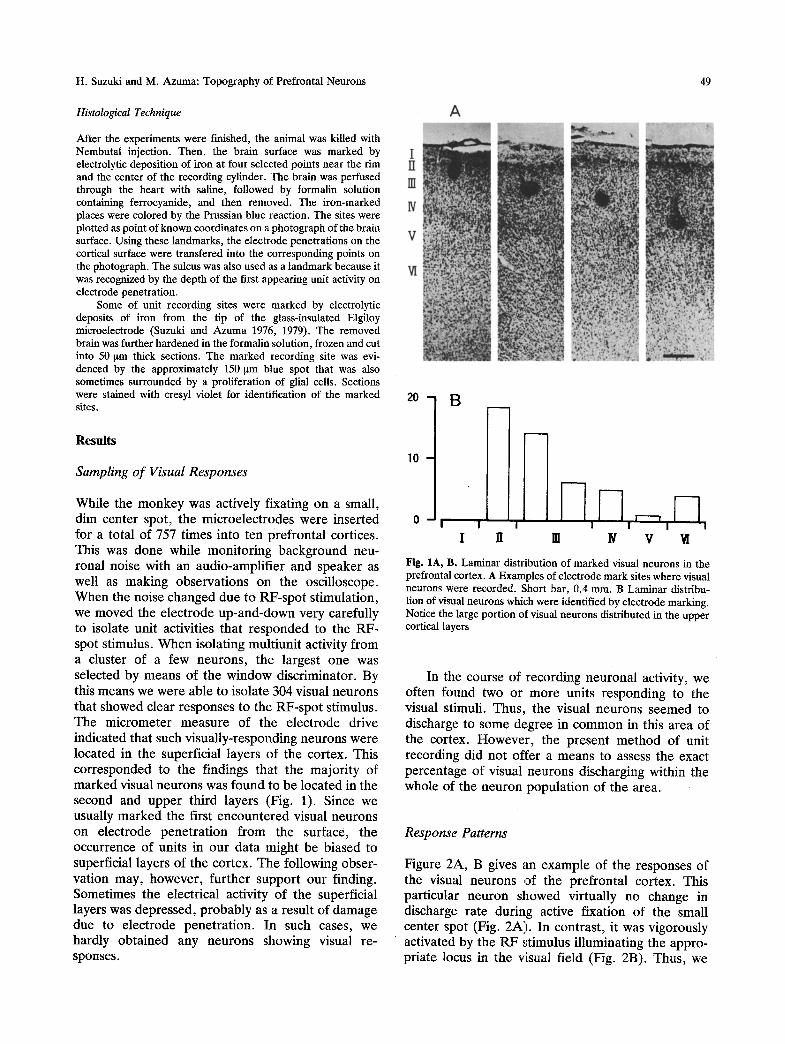
While the m o n k e y was actively fixating on a small, dim center spot, the microelec t rodes were inserted 0 ~ for a total of 757 times into ten prefronta l cortices. This was done while moni tor ing background neu- ronal noise with an audio-amplif ier and speaker as well as making observat ions on the oscilloscope. W h e n the noise changed due to RF-spo t st imulation, we moved the e lect rode up-and-down very carefully to isolate unit activities that r e sponded to the RF- spot stimulus. W h e n isolating mult iunit activity f rom a cluster of a few neurons , the largest one was selected by means of the window discriminator. By this means we were able to isolate 304 visual neurons that showed clear responses to the RF-spo t stimulus. The mic romete r measure of the e lect rode drive indicated that such visual ly-responding neurons were located in the superficial layers of the cortex. This cor responded to the findings that the major i ty of marked visual neurons was found to be located in the second and upper third layers (Fig. 1). Since we usually marked the first encoun te red visual neurons on electrode pene t ra t ion f rom the surface, the occurrence of units in ou r data might be biased to superficial layers of the cortex. The following obser- vation may, however , fur ther suppor t our finding. Sometimes the electrical activity of the superficial layers was depressed, p robab ly as a result of damage due to electrode penet ra t ion. In such cases, we hardly obta ined any neurons showing visual re- sponses.
B
ij i l i i i i
I II IV V ~I
J jl i
m
Fig. 1A, B. Laminar distribution of marked visual neurons in the prefrontal cortex. A Examples of electrode mark sites where visual neurons were recorded. Short bar, 0.4 mm. B Laminar distribu- tion of visual neurons which were identified by electrode marking. Notice the large portion of visual neurons distributed in the upper cortical layers
In the course of recording neurona l activity, we often found two or more units responding to the visual stimuli. Thus, the visual neurons seemed to discharge to some degree in c o m m o n in this area of the cortex. However , the present m e t h o d of unit recording did no t offer a means to assess the exact percentage o f visual neurons discharging within the whole of the neu ron popula t ion o f the area.
Response Patterns
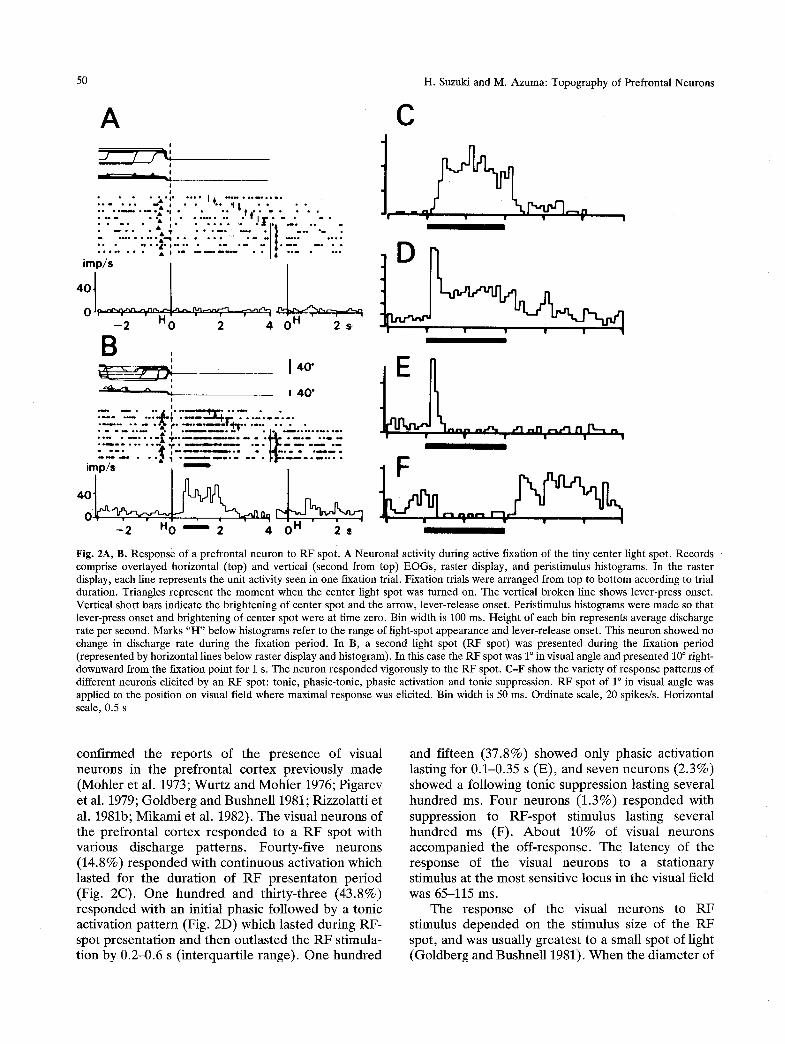
Figure 2A, B gives an example of the responses of the visual neurons ,of the prefronta l cortex. This particular neuron showed virtually no change in discharge rate during active fixation of the small center spot (Fig. 2A). In contrast , it was vigorously activated by the R F stimulus i l luminating the appro- priate locus in the visual field (Fig. 2B). Thus , we
50 H. Suzuki and M. Azuma: Topography of Prefrontal Neurons
A I
11 I
. . . . ~ . 0 . . . . . I , . . . . . . . . . . .
. . . . . "A i ........ "II" . . . . . ..... , ," -..-.. ..... ! .... �9 "
- - . : . . . . . . : g . . . . . . . . . . ~ . . . . . . . . . - ..- . . . . " . ' : �9 �9 �9 , , �9 �9 �9 �9 I " ~ �9 �9 - , - �9 , . ,
- 2 H~) 2 4 ,
B , o
I , m " - - i
|
~-- ~ ~ ,,~ e ~ . ( l " ~ T V
I
C
~ e l n A n A
I m ~ ~176 i o oo j ------e.~m~ ~ ~ ~ ~ . . . . . . . . . F . . . . . . . . . . . . " . - - " - ' L Z " " . " ' " . ~ _ . . . . . . : . " ' . - - . . ' . . . . . . . . . , ,1 , , n , - , , 1 1 n I ' t - , , ,
' ' ' ' ' ' '
- - ~ ~ " " "A ~ " ~ ' ' ~ " " ~ I'dl " ~ ' ~ 1 7 6 1 7 6 ~
- 2 HO ~ 2 4
Fig. 2A, B. Response of a prefrontal neuron to RF spot. A Neuronal activity during active fixation of the tiny center light spot. Records comprise overlayed horizontal (top) and vertical (second from top) EOGs, raster display, and peristimulus histograms. In the raster display, each line represents the unit activity seen in one fixation trial. Fixation trials were arranged from top to bottom according to trial duration. Triangles represent the moment when the center light spot was turned on. The vertical broken line shows lever-press onset. Vertical short bars indicate the brightening of center spot and the arrow, lever-release onset. Peristimulus histograms were made so that lever-press onset and brightening of center spot were at time zero. Bin width is 100 ms. Height of each bin represents average discharge rate per second. Marks "H" below histograms refer to the range of light-spot appearance and lever-release onset. This neuron showed no change in discharge rate during the fixation period. In B, a second light spot (RF spot) was presented during the fixation period (represented by horizontal lines below raster display and histogram). In this case the RF spot was 1 ~ in visual angle and presented 10 ~ right- downward from the fixation point for 1 s. The neuron responded vigorously to the RF spot. C-F show the variety of response patterns of different neuroiis elicited by an RF spot: tonic, phasic-tonic, phasic activation and tonic suppression. RF spot of l ~ in visual angle was applied to the position on visual field where maximal response was elicited. Bin width is 50 ms. Ordinate scale, 20 spikes/s. Horizontal scale, 0.5 s
conf i rmed the r epo r t s of the p r e s e n c e of visual neurons in the p r e f r o n t a l co r tex p rev ious ly m a d e (Moh le r et al. 1973; W u r t z and M o h l e r 1976; P igarev et al. 1979; G o l d b e r g and Bushne l l 1981; R izzo la t t i e t al. 1981b; M i k a m i et al. 1982). T h e visual neu rons of the p re f ron t a l co r tex r e s p o n d e d to a R F spo t wi th var ious d i scharge pa t t e rns . Fou r ty - f i ve ne u rons (14 .8%) r e s p o n d e d wi th con t inuous ac t iva t ion which las ted for the d u r a t i o n of R F p r e s e n t a t o n p e r i o d (Fig. 2C). O n e h u n d r e d and th i r t y - th r ee (43 .8%) r e s p o n d e d wi th an ini t ia l phas ic fo l lowed by a ton ic ac t iva t ion p a t t e r n (Fig. 2D) which l a s ted dur ing R F - spot p r e s e n t a t i o n and then o u t l a s t e d the R F s t imula- t ion by 0 .2 -0 .6 s ( i n t e rqua r t i l e r ange) . O n e h u n d r e d
and f i f teen (37 .8%) s h o w e d only phas ic ac t iva t ion last ing for 0 .1-0 .35 s (E) , and seven n e u r o n s (2 .3%) showed a fo l lowing ton ic suppress ion las t ing severa l h u n d r e d m s . F o u r ne u rons (1 .3%) r e s p o n d e d with suppress ion to R F - s p o t s t imulus las t ing severa l h u n d r e d ms (F) . A b o u t 10% of visual neu rons a c c o m p a n i e d the o f f - response . T h e l a t ency of the r e sponse of the visual ne u rons to a s t a t iona ry s t imulus at the mos t sensi t ive locus in the visual f ie ld was 65-115 ms.
The r e sponse of the visual ne u rons to R F st imulus d e p e n d e d on the s t imulus size of the R F spot , and was usua l ly g rea t e s t to a smal l spo t of l ight ( G o l d b e r g and Bushne l l 1981). W h e n the d i a m e t e r of
I
H. Suzuki and M. Azuma: Topography of Prefrontal Neurons 51
v
" _ _ - - - - .
' / , 1 401mp/s
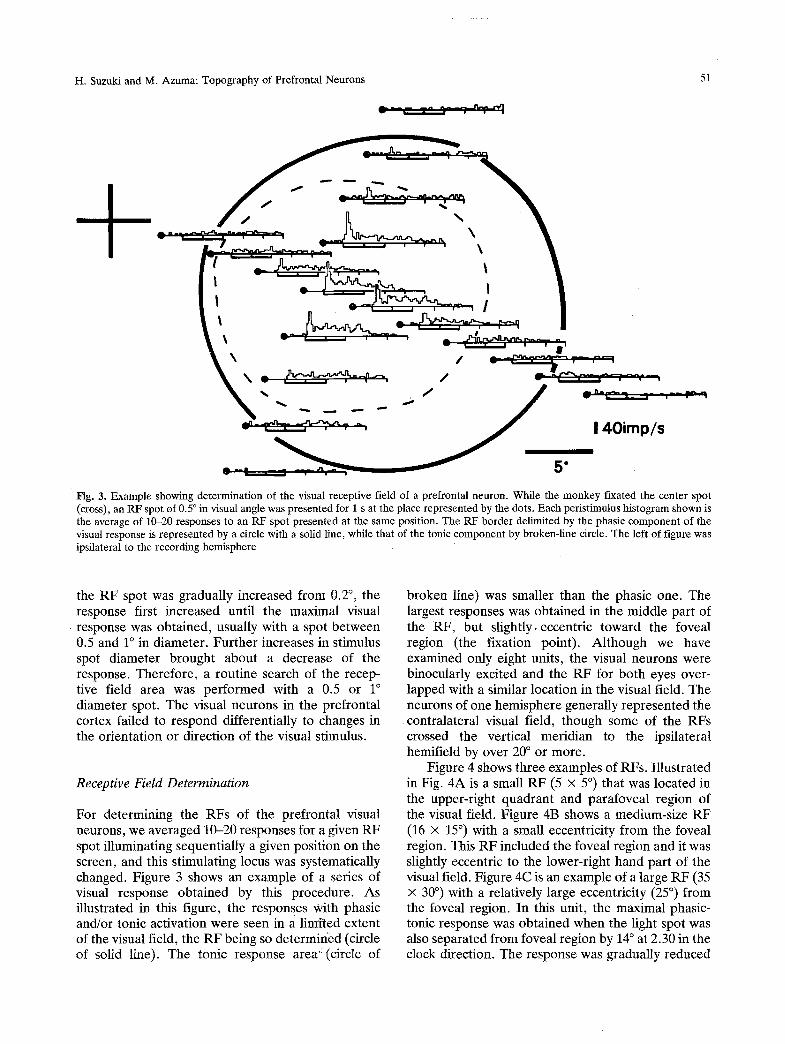
Fig. 3. Example showing determination of the visual receptive field of a prefrontal neuron. While the monkey fixated the center spot (cross), an RF spot of 0.5 ~ in visual angle was presented for 1 s at the place represented by the dots. Each peristimulus histogram shown is the average of 10-20 responses to an RF spot presented at the same position. The RF border delimited by the phasic component of the visual response is represented by a circle with a solid line, while that of the tonic component by broken-line circle. The left of figure was ipsilateral to the recording hemisphere
the RF spot was gradually increased from 0.2 ~ the response first increased until the maximal visual response was obtained, usually with a spot between 0.5 and 1 ~ in diameter. Further increases in stimulus spot diameter brought about a decrease of the response. Therefore, a routine search of the recep- tive field area was performed with a 0.5 or 1 ~ diameter spot. The visual neurons in the prefrontal cortex failed to respond differentially to changes in the orientation or direction of the visual stimulus.
Receptive Field Determination
For determining the RFs of the prefrontal visual neurons, we averaged 10-20 responses for a given RF spot illuminating sequentially a given position on the screen, and this stimulating locus was systematically changed. Figure 3 shows an example of a series of visual response obtained by this procedure. As illustrated in this figure, the responses With phasic and/or tonic activation were seen in a limited extent of the visual field, the RF being so determined (circle of solid line). The tonic response area': (circle of
broken line) was smaller than the phasic one. The largest responses was obtained in the middle part of the RF, but slightly, eccentric toward the foveal region (the fixation point). Although we have examined only eight units, the visual neurons were binocularly excited and the RF for both eyes over- lapped with a similar location in the visual field. The neurons of one hemisphere generally represented the contralateral visual field, though some of the RFs crossed the vertical meridian to the ipsilateral hemifield by over 20 ~ or more.
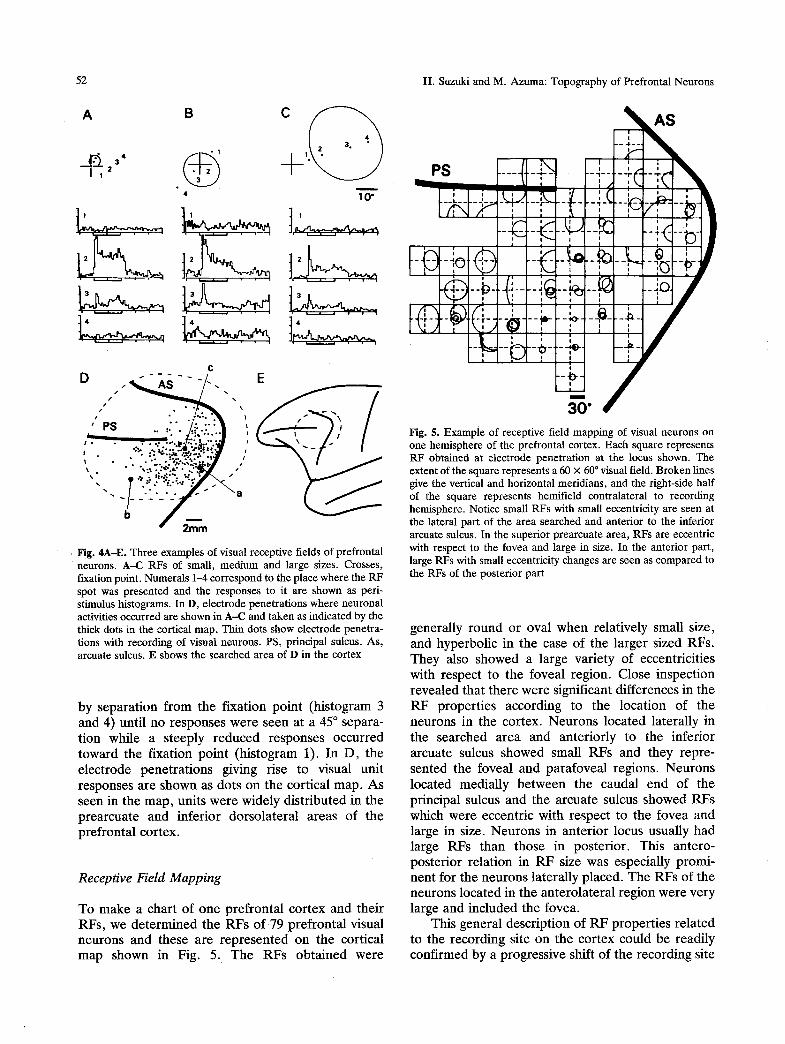
Figure 4 shows three examples of RFs. Illustrated in Fig. 4A is a small RF (5 x 5 ~ that was located in the upper-right quadrant and parafoveal region of the visual field. Figure 4]3 shows a medium-size RF (16 x 15 ~ with a small eccentricity from the foveal region. This RF included the foveal region and it was slightly eccentric to the lower-right hand part of the visual field. Figure 4(2 is an example of a large RF (35 x 30 ~ with a relatively large eccentricity (25 ~ from the foveal region. In this unit, the maximal phasic- tonic response was obtained when the light spot was also separated from foveal region by 14 ~ at 2.30 in the clock direction. The response was gradually reduced
52 H. Suzuki and M. Azuma: Topography of Prefrontal Neurons
A B
3
4 10" I
L ~
c D " - . . . . - . E
, . ...:.-,.,.<y:a,.,;:..., , , ., ~..'.,'~;~-..~.~ �9 -
f 2"m-rn
Fig. 4A-E. Three examples of visual receptive fields of prefrontal neurons. A-C RFs of small, medium and large sizes. Crosses, fixation point. Numerals 1-4 correspond to the place where the RF spot was presented and the responses to it are shown as peri- stimulus histograms. In D, electrode penetrations where neuronal activities occurred are shown in A--C and taken as indicated by the thick dots in the cortical map. Thin dots show electrode penetra- tions with recording of visual neurons. PS, principal sulcus. As, arcuate sulcus. E shows the searched area of D in the cortex
by s epa ra t i on f rom the f ixa t ion p o i n t (h i s tog ram 3 and 4) unt i l no r e sponses w e r e seen at a 45 ~ sepa ra - t ion whi le a s t eep ly r e d u c e d r e sponses occu r r ed t o w a r d the f ixa t ion po in t ( h i s tog ram 1). In D , the e l ec t rode p e n e t r a t i o n s giving r ise to visual uni t r esponses a re shown as do t s on the cor t ica l map . A s seen in the m a p , uni ts we re wide ly d i s t r i bu t ed in the p r e a r c u a t e and in fe r io r d o r s o l a t e r a l a r ea s of t he p re f ron ta l cor tex .
Receptive Field Mapping
To m a k e a cha r t of one p r e f ron t a l co r t ex and the i r RFs , we d e t e r m i n e d the R F s o f 79 p r e f r o n t a l visual neu rons and these a re r e p r e s e n t e d on the cor t ica l m a p shown in Fig. 5. T h e R F s o b t a i n e d were
AS
PS . . . . . . . . . . . 't-4r
I I z . , , - -
- - , F , - . . . . - -
0
7 . . . .
. . . .
m
30" Fig. 5. Example of receptive field mapping of visual neurons on one hemisphere of the prefrontal cortex. Each square represents RF obtained at electrode penetration at the locus shown. The extent of the square represents a 60 • 60 ~ visual field. Broken lines give the vertical and horizontal meridians, and the right-side half of the square represents hemifield contralateral to recording hemisphere. Notice small RFs with small eccentricity are seen at the lateral part of the area searched and anterior to the inferior arcuate sulcus. In the superior prearcuate area, RFs are eccentric with respect to the fovea and large in size. In the anterior part, large RFs with small eccentricity changes are seen as compared to the RFs of the posterior part
genera l ly r o u n d o r oval when re la t ive ly smal l size, and hype rbo l i c in t he case of the l a rge r s ized RFs . They also showed a la rge va r i e ty of eccent r ic i t i es with respec t to the fovea l reg ion . Close inspec t ion r evea l ed tha t t he re were s ignif icant d i f fe rences in the R F p rope r t i e s accord ing to the loca t ion of the neurons in the cor tex . N e u r o n s l o c a t e d l a te ra l ly in the sea rched a r ea and an te r io r ly to the in fe r ior a rcua te sulcus showed smal l R F s and t hey repre - sen ted the fovea l and p a r a f o v e a l reg ions . N e u r o n s loca ted med ia l l y b e t w e e n the cauda l end of the pr inc ipa l sulcus and the a rcua te sulcus showed R F s which we re eccen t r ic wi th r e spec t to t he fovea and large in size. N e u r o n s in an t e r io r locus usual ly h a d la rge R F s than those in pos t e r io r . This an t e ro - pos t e r io r r e l a t ion in R F size was espec ia l ly p romi - nen t for the ne u rons l a te ra l ly p laced . T h e R F s of the neurons l oca t ed in the a n t e r o l a t e r a l r eg ion were ve ry large and inc luded the fovea .
This gene ra l desc r ip t ion of R F p r o p e r t i e s r e l a t ed to the r eco rd ing si te on the co r t ex could be r ead i ly conf i rmed b y a p rogres s ive shift of the r eco rd ing si te
I
H. Suzuki and M. Azuma: Topography of Prefrontal Neurons 53
' Lc OOtDID tD ~ . = T �9 , �9 ,
o , . o , w g '
~'11 2 = B .3 .o. D
,4" IL; ..I "4 / . I f J ' % , ' ~) , / I ~._o =
30
B 'I ,2 4 s ,3
/ . I I / ~ O o
1 , , l
--~'/ o i ' w ' ~ ' 0 w , , , �9 , �9 �9
I 3 5 7
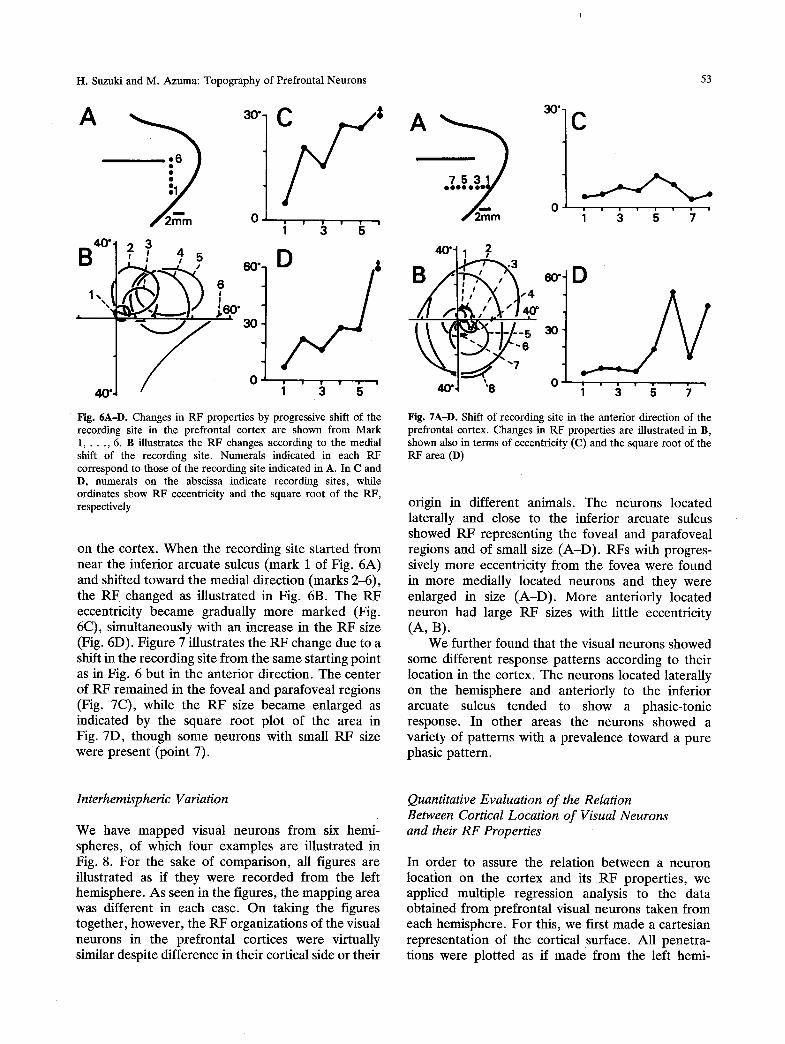
Fig. 6A-I). Changes in RF properties by progressive shift of the recording site in the prefrontal cortex are shown from Mark 1 , . . . , 6. B illustrates the RF changes according to the medial shift of the recording site. Numerals indicated in each RF correspond to those of the recording site indicated in A. In C and D, numerals on the abscissa indicate recording sites, while ordinates show RF eccentricity and the square root of the RF, respectively
on the cortex. When the recording site started from near the inferior arcuate sulcus (mark 1 of Fig. 6A) and shifted toward the medial direction (marks 2-6), the RF changed as illustrated in Fig. 6B. The RF eccentricity became gradually more marked (Fig. 6C), simultaneously with an increase in the RF size (Fig. 6D). Figure 7 illustrates the RF change due to a shift in the recording site from the same starting point as in Fig. 6 but in the anterior direction. The center of RF remained in the foveal and parafoveal regions (Fig. 7C), while the RF size became enlarged as indicated by the square root plot of the area in Fig. 7D, though some neurons with small RF size were present (point 7).
Fig. 7A-l). Shift of recording site in the anterior direction of the prefrontal cortex. Changes in RF properties are illustrated in B, shown also in terms of eccentricity (C) and the square root of the RF area (D)
origin in different animals. The neurons located laterally and close to the inferior arcuate sulcus showed RF representing the foveal and parafoveal regions and of small size (A-D). RFs with progres- sively more eccentricity from the fovea were found in more medially located neurons and they were enlarged in size (A-D). More anteriorly located neuron had large RF sizes with little eccentricity (A, B).
We further found that the visual neurons showed some different response patterns according to their location in the cortex. The neurons located laterally on the hemisphere and anteriorly to the inferior arcuate sulcus tended to show a phasic-tonic response. In other areas the neurons showed a variety of patterns with a prevalence toward a pure phasic pattern.
Interhemispheric Variation
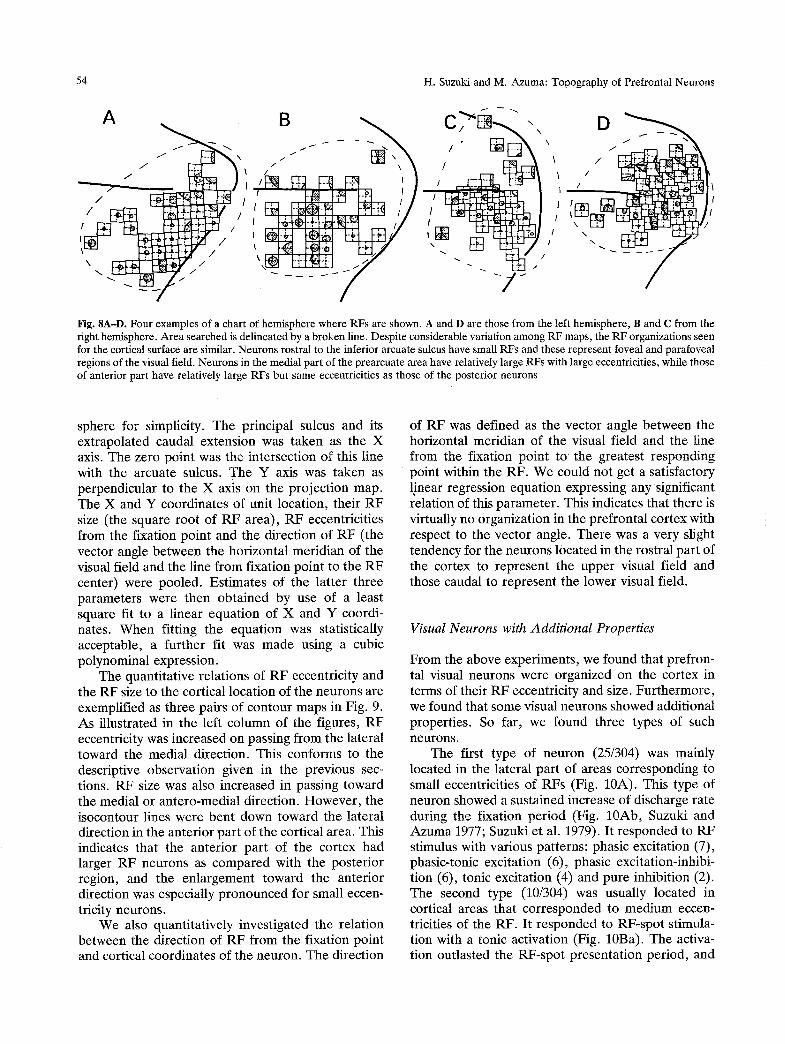
We have mapped visual neurons from six hemi- spheres, of which four examples are illustrated in Fig. 8. For the sake of comparison, all figures are illustrated as if they were recorded from the left hemisphere. As seen in the figures, the mapping area was different in each case. On taking the figures together, however, the RF organizations of the visual neurons in the prefrontal cortices were virtually similar despite difference in their cortical side or their
Quantitative Evaluation of the Relation Between Cortical Location of Visual Neurons and their RF Properties
In order to assure the relation between a neuron location on the cortex and its RF properties, we applied multiple regression analysis to the data obtained from prefrontal visual neurons taken from each hemisphere. For this, we first made a cartesian representation of the cortical surface. All penetra- tions were plotted as if made from the left hemi-
54 H. Suztdd and M. Azuma: Topography of Prefrontal Neurons
I N ] , 4,
X , , . y
Fig. 8A-D. Four examples of a chart of hemisphere where RFs are shown. A and D are those from the left hemisphere, B and C from the right hemisphere. Area searched is delineated by a broken line. Despite considerable variation among RF maps, the RF organizations seen for the cortical surface are similar. Neurons rostral to the inferior arcuate sulcus have small RFs and these represent foveal and parafoveal regions of the visual field. Neurons in the medial part of the prearcuate area have relatively large RFs with large eccentricities, while those of anterior part have relatively large RFs but same eccentricities as those of the posterior neurons
sphere for simplicity. The principal sulcus and its extrapolated caudal extension was taken as the X axis. The zero point was the intersection of this line with the arcuate sulcus. The Y axis was taken as perpendicular to the X axis on the project ion map. The X and Y coordinates of unit location, their RF size (the square root of RF area) , RF eccentricities from the fixation point and the direction of RF (the vector angle between the horizontal meridian of the visual field and the line f rom fixation point to the RF center) were pooled. Est imates of the latter three parameters were then obtained by use of a least square fit to a linear equation of X and Y coordi- nates. When fitting the equat ion was statistically acceptable, a further fit was made using a cubic polynominal expression.
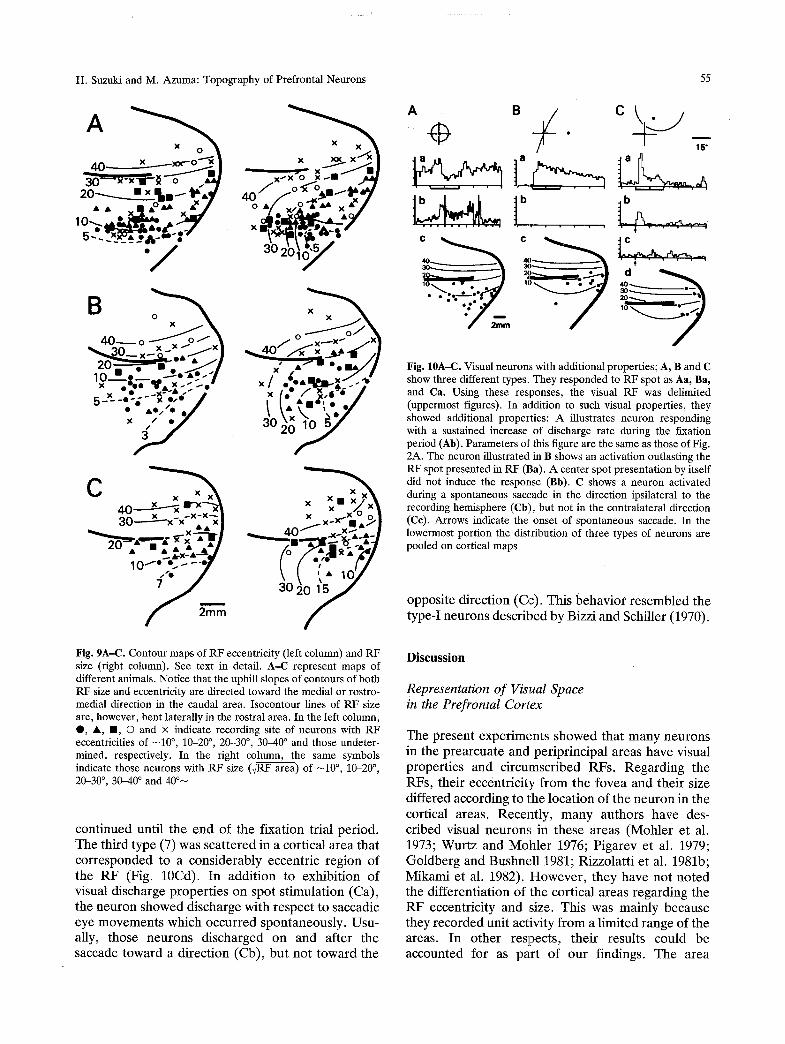
The quantitative relations of RF eccentricity and the RF size to the cortical location of the neurons are exemplified as three pairs of contour maps in Fig. 9. As illustrated in the left column of the figures, RF eccentricity was increased on passing f rom the lateral toward the medial direction. This conforms to the descriptive observat ion given in the previous sec- tions. RF size was also increased in passing toward the medial or antero-medial direction. However , the isocontour lines were bent down toward the lateral direction in the anterior part of the cortical area. This indicates that the anterior part of the cortex had larger RF neurons as compared with the posterior region, and the enlargement toward the anterior direction was especially pronounced for small eccen- tricity neurons.
We also quantitatively investigated the relation between the direction of RF f rom the fixation point and cortical coordinates of the neuron. The direction
of RF was defined as the vector angle between the horizontal meridian of the visual field and the line f rom the fixation point to the greatest responding point within the RF. We could not get a satisfactory linear regression equation expressing any significant relation of this parameter . This indicates that there is virtually no organization in the prefrontal cortex with respect to the vector angle. There was a very slight tendency for the neurons located in the rostral part of the cortex to represent the upper visual field and those caudal to represent the lower visual field.
Visual Neurons with Additional Properties
From the above experiments, we found that prefron- tal visual neurons were organized on the cortex in terms of their RF eccentricity and size. Fur thermore , we found that some visual neurons showed additional properties. So far, we found three types of such neurons.
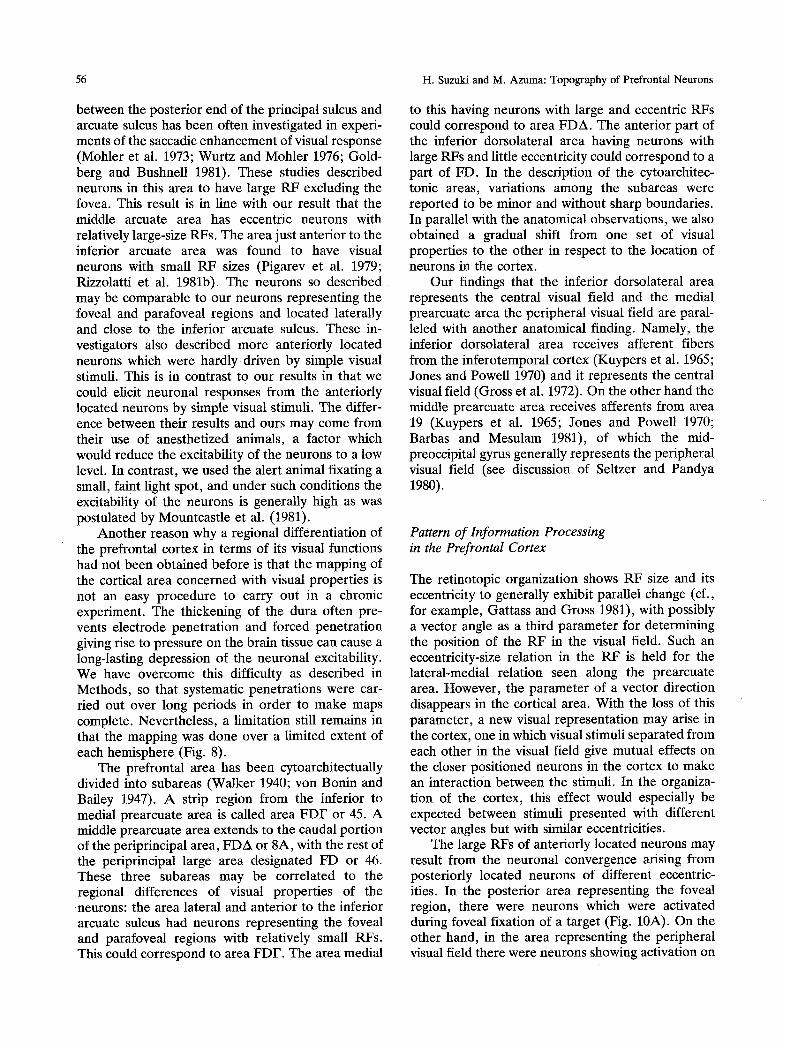
The first type of neuron (25/304) was mainly located in the lateral part of areas corresponding to small eccentricities of RFs (Fig. 10A). This type of neuron showed a sustained increase of discharge rate during the fixation period (Fig. 10Ab, Suzuki and Azuma 1977; Suzuki et al. 1979). I t responded to RF stimulus with various patterns: phasic excitation (7), phasic-tonic excitation (6), phasic excitation-inhibi- tion (6), tonic excitation (4) and pure inhibition (2). The second type (10/304) was usually located in cortical areas that corresponded to medium eccen- tricities of the RF. It responded to RF-spot stimula- tion with a tonic activation (Fig. 10Ba). The activa- tion outlasted the RF-spot presentat ion period, and
H. Suzuki and M. Azuma: Topography of Prefrontal Neurons
A X O
3 o ~ x - x - r - l l o . ~ 2 0 ~ �9 x iillil.....
. /
4 0 o o x x x - ^ / ~ x~x~ i x ] . f x x ._,l..A l i
5._X__o_i_-~ . , r ] x to / ~ , . i ' l i : ,:,-.. / t t - . t , ' % . ,S-/
X- zu �9 � 9 1 4 9 � 9 �9 ~ 8 _ � 9
" \ t t - ~ o / ~ 30 2 0 y
f Fig. 9A-C. Contour maps of RF eccentricity (left column) and RF size (right column). See text in detail. A-C represent maps of different animals. Notice that the uphill slopes of contours of both RF size and eccentricity are directed toward the medial or rostro- medial direction in the caudal area. Isocontour lines of RF size are, however, bent laterally in the rostral area. In the left column, O, i , II, �9 and x indicate recording site of neurons with RF eccentricities of -10 ~ 10-20 ~ 20-30 ~ 30--40 ~ and those undeter- mined, respectively. In the right column, the same symbols indicate those neurons with RF size (,JRF area) of -10 ~ 10.20 ~ 20-30 ~ , 30-40 ~ and 40 ~
cont inued unt i l the end of the f ixat ion trial period. The third type (7) was scat tered in a cortical area that cor responded to a cons iderably eccentr ic region of the R F (Fig. 10Cd). In addi t ion to exhibi t ion of visual discharge proper t ies on spot s t imula t ion (Ca), the n e u r o n showed discharge with respect to saccadic eye movemen t s which occurred spontaneous ly . Usu- ally, those neu rons discharged on and after the saccade toward a di rect ion (Cb), bu t no t toward the
55
2 - - I ~ ~ . "."~l d'
. . . . . . . . 7"=. " / -----y
Fig. 10A-C. Visual neurons with additional properties; A, B and C show three different types. They responded to RF spot as Aa, Ba, and Ca. Using these responses, the visual RF was delimited (uppermost figures). In addition to such visual properties, they showed additional properties: A illustrates neuron responding with a sustained increase of discharge rate during the fixation period (Ab). Parameters of this figure are the same as those of Fig. 2A. The neuron illustrated in B shows an activation outlasting the RF spot presented in RF (Ba). A center spot presentation by itself did not induce the response (Bb). C shows a neuron activated during a spontaneous saccade in the direction ipsilateral to the recording hemisphere (Cb), but not in the contralateral direction (Ce). Arrows indicate the onset of spontaneous saccade. In the lowermost portion the distribution of three types of neurons are pooled on cortical maps
opposi te direct ion (Cc). This behavior resembled the type-I neurons descr ibed by Bizzi and Schiller (1970).
Discussion
Representation of Visual Space in the Prefrontal Cortex
The present exper iments showed that m a n y ne u rons in the prearcuate and per ipr inc ipa l areas have visual propert ies and c i rcumscr ibed RFs. Regard ing the RFs, their eccentrici ty f rom the fovea and their size differed according to the locat ion of the n e u r o n in the cortical areas. Recent ly , m a n y authors have des- cribed visual ne u r ons in these areas (Mohler et al. 1973; Wur tz and Mohle r 1976; Pigarev et al. 1979; Goldberg and Bushne l l 1981; Rizzolat t i et al. 1981b; Mikami et al. 1982). However , they have not no ted the different ia t ion of the cortical areas regarding the R F eccentricity and size. This was main ly because they recorded uni t activity f rom a l imi ted range of the areas. In o ther respects, their results could be accounted for as par t of our f indings. The area
56 H. Suzuki and M. Azuma: Topography of Prefrontal Neurons
between the posterior end of the principal sulcus and arcuate sulcus has been often investigated in experi- ments of the saccadic enhancement of visual response (Mohler et al. 1973; Wurtz and Mohler 1976; Gold- berg and Bushnell 1981). These studies described neurons in this area to have large RF excluding the fovea. This result is in line with our result that the middle arcuate area has eccentric neurons with relatively large-size RFs. The area just anterior to the inferior arcuate area was found to have visual neurons with small RF sizes (Pigarev et al. 1979; Rizzolatti et al. 1981b). The neurons so described may be comparable to our neurons representing the foveal and parafoveal regions and located laterally and close to the inferior arcuate sulcus. These in- vestigators also described more anteriorly located neurons which were hardly driven by simple visual stimuli. This is in contrast to our results in that we could elicit neuronal responses from the anteriorly located neurons by simple visual stimuli. The differ- ence between their results and ours may come from their use of anesthetized animals, a factor which would reduce the excitability of the neurons to a low level. In contrast, we used the alert animal fixating a small, faint light spot, and under such conditions the excitability of the neurons is generally high as was postulated by Mountcastle et al. (1981).
Another reason why a regional differentiation of the prefrontal cortex in terms of its visual functions had not been obtained before is that the mapping of the cortical area concerned with visual properties is not an easy procedure to carry out in a chronic experiment. The thickening of the dura often pre- vents electrode penetration and forced penetration giving rise to pressure on the brain tissue can cause a long-lasting depression of the neuronal excitability. We have overcome this difficulty as described in Methods, so that systematic penetrations were car- ried out over long periods in order to make maps complete. Nevertheless, a limitation still remains in that the mapping was done over a limited extent of each hemisphere (Fig. 8).
The prefrontal area has been cytoarchitectually divided into subareas (Walker 1940; von Bonin and Bailey 1947). A strip region from the inferior to medial prearcuate area is called area FDF or 45. A middle prearcuate area extends to the caudal portion of the periprincipal area, FDA or 8A, with the rest of the periprincipal large area designated FD or 46. These three subareas may be correlated to the regional differences of visual properties of the neurons: the area lateral and anterior to the inferior arcuate sulcus had neurons representing the foveal and parafoveal regions with relatively small RFs. This could correspond to area FDF. The area medial
to this having neurons with large and eccentric RFs could correspond to area FDA. The anterior part of the inferior dorsolateral area having neurons with large RFs and little eccentricity could correspond to a part of FD. In the description of the cytoarchitec- tonic areas, variations among the subareas were reported to be minor and without sharp boundaries. In parallel with the anatomical observations, we also obtained a gradual shift from one set of visual properties to the other in respect to the location of neurons in the cortex.
Our findings that the inferior dorsolateral area represents the central visual field and the medial prearcuate area the peripheral visual field are paral- leled with another anatomical finding. Namely, the inferior dorsolateral area receives afferent fibers from the inferotemporal cortex (Kuypers et al. 1965; Jones and Powell 1970) and it represents the central visual field (Gross et al. 1972). On the other hand the middle prearcuate area receives afferents from area 19 (Kuypers et al. 1965; Jones and Powell 1970; Barbas and Mesulam 1981), of which the mid- preoccipital gyrus generally represents the peripheral visual field (see discussion of Seltzer and Pandya 1980).
Pattern of Information Processing in the Prefrontal Cortex
The retinotopic organization shows RF size and its eccentricity to generally exhibit parallel change (cf., for example, Gattass and Gross 1981), with possibly a vector angle as a third parameter for determining the position of the RF in the visual field. Such an eccentricity-size relation in the RF is held for the lateral-medial relation seen along the prearcuate area. However, the parameter of a vector direction disappears in the cortical area. With the loss of this parameter, a new visual representation may arise in the cortex, one in which visual stimuli separated from each other in the visual field give mutual effects on the closer positioned neurons in the cortex to make an interaction between the stimuli. In the organiza- tion of the cortex, this effect would especially be expected between stimuli presented with different vector angles but with similar eccentricities.
The large RFs of anteriorly located neurons may result from the neuronal convergence arising from posteriorly located neurons of different eccentric- ities. In the posterior area representing the foveal region, there were neurons which were activated during foveal fixation of a target (Fig. 10A). On the other hand, in the area representing the peripheral visual field there were neurons showing activation on
H. Suzuki and M. Azuma: Topography of Prefrontal Neurons 57
spontaneous saccadic eye movements (Fig. 10C). The area representing the foveal region may relate to foveal fixation processes, while the area with peripheral visual fields to saccadic eye movements to foveate the object appearing in the field (Goldberg and Bushnell 1981). If such convergence in the anterior region is present, it will share in controlling the fixation of the eyes to one object and the shift of fixation to another object.
There is much evidence on the dependence of sensory processes on the animal's internal state in the prefrontal cortex (Wurtz and Mohler 1976; Suzuki et al. 1979; Goldberg and Bushnell 1981). This may suggest some convergence between the visual and the other system. However , at the level of the association cortex, sensory information of different modalities seems to be mediated by separate neural channels. Recently, Rizzolatti et al. (1981a, b) described visual and somatosensory neurons in the periarcuate area, and they also exhibited modality separation. In our experiments, prefrontal neurons sometimes showed an auditory activation (unpublished observation). The neurons responded especially to natural auditory stimuli presented on the side contralateral to that of the hemisphere recorded from, and as well in a lateral or posterolateral direction to the animal's head. From this observation we conceived that those neurons have a function in relation to the peripheral parts of the environment where visual sense could not operate, a space where visual neurons would not function. This assumption was further supported by the fact that these auditory neurons were juxtaposed with the visual neurons in the representation of the peripheral visual field. Thus, various kinds of sensory input (Bignall and Imbert 1969; Chavis and Pandya 1976; Rizzolatti et al. 1981a, b; Wollberg and Sela 1980; Barbas and Mesulam 1981) processed in sepa- rate channels help one another to give more com- plete information of the animal's environmental space.
Periprincipal and Periarcuate Areas as a Part of an Attentional System
In the prefrontal visual neurons, the shape, orienta- tion and direction of the movement of fight stimuli were not significant factors in their responsiveness as is the case in the primary visual cortex (Hubel and Wiesel 1968). On the other hand, the prefrontal visual neurons were differentially sensitive to stimulus size, with the best responses obtained by a small-size fight stimulus. Such properties resemble those of superior-colliculus neurons (Schiller and Koerner 1971; Moors and Vendrick 1979). This leads
to the notion that the prefrontal visual neurons may receive visual input, at least in part, via the superior colliculus (SC). Anatomically, axons of the inter- mediate layers of the SC terminate in the paralami- nar part of the dorsomedial nucleus, the medial (oral) pulvinar etc. (Benevento and Fallon 1975; Harting et al. 1980; Wurtz and Albano 1980). The intermediate and deep layer neurons of the SC show neuronal activity associated with a saccadic eye movement and have visual properties (Schiller and Koerner 1971; Wurtz and Goldberg 1972; Mays and Sparks 1980). The paralaminar part of the dorsome- dial nucleus (Akert 1964; Barbas and Mesulam 1981) and the medial pulvinar (Trojanowski and Jacobson 1974; Barbas and Mesulam 1981) in turn project to the prearcuate area. In addition, the inferior parietal cortex is also one of the projection targets of these subcortical structures (Harting et al. 1980) and the area shows similar neuronal activities (Robinson et al. 1978; Motter and Mountcastle 1981; Bushnell et al. 1981). Therefore, all the neuronal structures described above may be assessed as parts of one large functional unit subserving a specific function where at every level of the system the sensory process receives a convergence of non-visual input such as those relating to the animal's intention and generat- ing new neuronal processes; i.e. visual attention in the broad sense (Schiller et al. 1980; Crowne et al. 1981).
In addition to subcortical connections part of the cortico-cortical pathways (Kuypers et al. 1965; Jones and Powell 1970; Jacobson and Trojanowski 1977) may be involved in generating the visual responses seen in the prearcuate, and periprincipal neurons.
Acknowledgement. We are indebted to Dr. S. Ochs for his helpful suggestions regarding the English. Thanks are due to R. Funamizu, Y. Sasaki and T. Kuchiiwa for their technical assist- ance, and Mr. Y. Takeda for preparation of the illustrations.
References
Akert K (1964) Comparative anatomy of frontal cortex and thalamofrontal connections. In: Warren JM, Akert K (eds) The frontal granular cortex and behavior. McGraw-Hill, New York, pp 372-396
Azuma M, Suznld H (1981) Visual neurons in the monkey prefrontal cortex. J Physiol Soc Jpn 43:322
Barbas H, Mesulam M-M (1981) Organization of afferent input to subdivisions of area 8 in the rhesus monkey. J Comp Neurol 200:407-431
Benevento LA, Fallon JH (1975) The ascending projections of the superior coUiculus in the rhesus monkey (Macaca mulatta). J Comp Neurol 160:339-362
Bignall KE, Imbert M (1969) Polysensory and cortico-cortical projections to frontal lobe of squirrel and rhesus monkeys. Electroencephalogr Clin Neurophysiol 26:206-215
58 H. Suzuki and M. Azuma: Topography of Prefrontal Neurons
Bizzi E, Schiller PH (1970) Single unit activity in the frontal eye fields of unanesthetized monkeys during eye and head move- ment. Exp Brain Res 10:151-158
you Bonin G, Bailey P (1947) The neocortex of macaea mulatta. The University of Illinois Press, Urbana
Bushnell MC, Goldberg ME, Robinson DL (1981) Behavioral enhancement of visual responses in monkey cerebral cortex. I. Modulation in posterior parietal cortex related to selective visual attention. J Neurophysiol 46:755-772
Chavis DA, Pandya DN (1976) Further observations on cortico- frontal connections in the rhesus monkey. Brain Res 117: 369-386
Crowne DP, Yeo CH, Russel SI (1981) The effects of unilateral frontal eye field lesions in the monkey: visual-motor guidance and avoidance behavior. Behav Brain Res 2:165-187
Gattass R, Gross CG (1981) Visual topography of striate projec- tion zone (MT) in posterior superior temporal sulcus of the macaque. J Neurophysiol 46:621-638
Goldberg ME, Bushnell MC (1981) Behavioral enhancement of visual responses in monkey cerebral cortex. II. Modulation in frontal eye fields specifically related to saccades. J Neuro- physiol 46:773-787
Gross CG, Rocha-Miranda CE, Bender DB (1972) Visual proper- ties of neurons in inferotemporal cortex of the macaque. J Neurophysiol 35:96-111
Harting JK, Huerta MF, Frankfurter AJ, Strominger NL, Royce GJ (1980) Ascending pathways from the monkey superior colliculus: an autoradiographic analysis. J Comp Neurol 192: 853-882
Hubel DH, Wiesel TN (1968) Receptive fields and functional architecture of monkey striate cortex. J Physiol (Lond) 195: 215-243
Jacobson S, Trojanowski JQ (1977) Prefrontal granular cortex of the rhesus monkey. I. Intrahemispheric cortical afferents. Brain Res 132:209-233
Jones EG, PoweU TPS (1970) An anatomical study of converging sensory pathways within the cerebral cortex of the monkey. Brain 93:793-820
Kuypers HGJM, Szwarcbart MK, Mishkin M, Rosvold HE (1965) Occipitotemporal cortieocortical connections in the rhesus monkey. Exp Neurol 11:245-262
Mays LE, Sparks DL (1980) Dissociation of visual and saccade- related responses in superior colliculus neurons. J Neuro- physiol 43:207-232
Mikami A, Ito S, Kubota K (1982) Visual response properties of dorsolateral prefrontal neurons during visual fixation task. J Neurophysiol 47:593-605
Mohler CW, Goldberg ME, Wurtz RH (1973) Visual receptive fields of frontal eye field neurons. Brain Res 61:385-389
Moors J, Vendrick AJH (1979) Responses of single units in the monkey superior collieulus to stationary flashing stimuli. Exp Brain Res 35:333-347
Motter BC, Mountcastle VB (1981) The functional properties of the light-sensitive neurons of the posterior parietal cortex studied in Waking monkeys: foveal sparing and opponent vector organization. J Neurosci 1:3-26
Mountcastle VB, Andersen RA, Motter BC (1981) The influence of attentive fixation upon the excitability of the light-sensitive
neurons of the posterior parietal cortex. J Neurosci 1: 1218-1235
Pigarev IN, Rizzolatti G, Scandolara C (1979) Neurons responding to visual stimuli in the frontal lobe of macaque monkeys. Neurosei Lett 12:207-212
Rizzolatti G, Scandolara C, Matelli M, Gentilucei M (1981a) Afferent properties of periarcuate neurons in macaque mon- keys. I. Somatosensory responses. Behav Brain Res 2: 125-146
Rizzolatti G, Scandolara C, Matelli M, Gentilucci M (198Ib) Afferent properties of periarcuate neurons in macaque mon- keys. II. Visual responses. Behav Brain Res 2:147-163
Robinson DL, Goldberg ME, Stanton GB (1978) Parietal associa- tion cortex in the primate: sensory mechanisms and be- havioral modulations. J Neurophysiol 41:910-932
Schiller PH, Koemer F (1971) Discharge characteristics of single units in superior colliculus of the alert rhesus monkey. J Neurophysiol 34:920-936
Schiller PH, True SD, Conway JL (1980) Deficits in eye move- ments following frontal eye-field and superior coUiculus ablations. J Neurophysiol 44:1175-1189
Seltzer B, Pandya DN (1980) Converging visual and somatic sensory cortical input to the intraparietal sulcus of the rhesus monkey. Brain Res 192:339--351
Suzuki H, Azuma M (1976) A glass-insulated "Elgiloy" microelec- trode for recording unit activity in chronic monkey experi- ments. Electroencephalogr Clin Neurophysiol 41:93-95
Suzuki H, Azuma M (1977) Prefrontal neuronal activity during gazing at a light spot in the monkey. Brain Res 126:497-508
Suzuki H, Azuma M (1979) A method for the accurate localization of recording sites in chronic monkey experiments. In: Ito M (ed) Integrative control function of the brain. Kodansha Scientific, Tokyo (vol II, pp 405-407)
Suzuki H, Azuma M, Yumiya H (1979) Stimulus and behavioral factors contributing to the activation of monkey prefrontal neurons during gazing. Jpn J Physiol 29:481-499
Trojanowski JQ, Jacobson S (1974) Medial pulvinar afferents to frontal eye fields in rhesus monkey demonstrated by horse- radish peroxidase. Brain Res 80:395-411
Walker AE (1940) A cytoarchitectual study of the prefrontal area of the macaque monkey. J Comp Neurol 73:59-86
Wollberg Z, Sela J (1980) Frontal cortex of the awake squirrel monkey: responses of single cells to visual and auditory stimuli. Brain Res 198:216-220
Wurtz RH (1969) Visual receptive fields of striate cortex neurons in awake monkeys. J Neurophysiol 32:727-742
Wurtz RH, Albano JE (1980) Visual-motor function of the primate superior colliculus. Ann Rev Neurosci 3:189-226
Wurtz RH, Goldberg ME (1972) Activity of superior colliculus in behaving monkey. III. Cells discharging before eye move- ments. J Neurophysiol 35:575-586
Wurtz RH, Mohler CW (1976) Enhancement of visual responses in monkey stfiate cortex and frontal eye fields. J Neurophysiol 39:766-772
Received December 21, 1982 / Received in final form May 16, 1983


