1
The “Stuck Kids” Problem Assessment of the Children’s Mental Health System
in Massachusetts
Prepared for:
Emily Sherwood
Director of Children’s Behavioral Health Initiative
Massachusetts Executive Office of Health and Human Services
Prepared by: Emily Francis Hartmann
Candidate for Masters in Public Policy, May 2015
Harvard Kennedy School
Katherine Schiavoni
Candidate for Doctor of Medicine, Masters in Public Policy, May 2015
Harvard Medical School, Harvard Kennedy School
Academic Advisors:
Professor Julie Wilson
Harvard Kennedy School
Professor Josh Goodman
Harvard Kennedy School
March 31, 2015
This Policy Analysis Exercise reflects the views of the authors and should
not be viewed as representing the views of Children’s Behavioral Health
Initiative, nor those of Harvard University or any of its faculty
2
ACKNOWLEDGEMENTS
This work would not have been possible without the support our advisors. We want to thank
Professor Julie Wilson and Professor Josh Goodman for their dedication to mentoring and
supporting us throughout this process. We also want to thank Emily Sherwood at the Children’s
Behavioral Health Initiative for engaging us in this project and for all of her guidance, advice,
and patience throughout the process. We would also like to thank Massachusetts Behavioral
Health Partnership for sharing historical data with us, and Margot Tracy for her help compiling
it. Finally, we would like to thank all of our interviewees for taking the time to share their
experience with us. We truly appreciated learning from you, and we hope that our work will help
contribute to addressing the stuck kids problem in Massachusetts.
3
EXECUTIVE SUMMARY
The “Stuck Kids” Problem
Children’s Behavioral Health Initiative (CBHI) engaged us to understand how youth flow
through the mental health system in Massachusetts, and why some youth do not flow smoothly
despite available resources. Specifically, they were interested in two points where youth remain
longer than medically necessary while awaiting their next placement: Emergency Departments
and acute psychiatric units. Colloquially, this has become known as the “stuck kids” problem.
Methodology
We evaluated the stuck kids problem using both qualitative and quantitative data.
Qualitative Analysis: We interviewed a total of 33 experts, including professionals from
state agencies and health care facilities across Massachusetts.
Quantitative Analysis: We analyzed data on providers across the care continuum to
characterize the stuck kids problem and identify trends in who becomes stuck.
Key Findings
Stuck kids are an indication of underlying problems in the behavioral health system. As one
interviewee described, they are the “canary in the coal mine” indicating that youth are not getting
the care that they need along the mental health continuum. Key findings include:
Characteristics of the Stuck Kids Problem
Focus on a Subset of the Problem: The Children Awaiting Resolution and Discharge
(CARD) Report, which is used as a key measure of stuck kids, does not capture the full
magnitude of the problem. We conservatively estimate that the stuck kids problem is
over two times larger than this report suggests.
System of Care
Repeat Admissions: There is a small number of youth who cycle between placements
and become stuck multiple times throughout the year.
Inadequate Outpatient Care: Outpatient care is often viewed as the backbone of a
functioning mental and behavioral health system. However, inadequate outpatient care
was the most frequently cited systemic issue leading to stuck kids. Interviewees described
long wait times and poor quality due to lack of coordination and provider experience.
Increasing Acuity: Most providers perceived a recent increase in patient acuity, and
many attributed it to the success of CBHI. CBHI has kept many youth in the community,
leaving only the most complex, challenging youth in acute settings. Providers do not feel
equipped to accommodate this strong concentration of acute patients.
Quality
Lack of Quality Outcomes Measurement: Issues cited by interviewees included a lack
of outcome-based quality measurements, inconsistent quality evaluation in different
segments of the care continuum, and limited accountability for outcomes.
4
Inadequate Quality of Services: Many interviewees believed that youth became stuck
because the efficacy of services was lacking. Providers felt that both high acuity and
complex youth were not well-served by either acute or community-based services.
Payment
Low Payment Rates: Most interviewees who identified payment as an issue said that the
payment rates were inadequate to support high quality care or to retain experienced staff.
Misaligned Payment Structures: Both state agency and provider interviewees reported
that the structure of payments, including fee-for-service and payment from fragmented
funding sources, incentivized poor care and prevented them from doing their job well.
Leadership
Interagency cooperation: Siloing was an issue raised by every state agency. State
agencies expressed a desire to focus on youth and families and not on dividing payments.
Provider Communication: There is frequently a communications gap between what is
intended on a state level and what is understood by clinical practitioners.
Lack of High-Level Engagement: While some key stakeholders send high-level
representatives to committee meetings focusing on stuck kids, others either fail to send a
representative or send a representative that lacks formal decision-making authority.
Recommendations
Short-Term
Measure the full scope of the stuck kids problem by developing a system to track and
report stuck kids with all insurance plans across the full mental health continuum.
Engage Secretary Marylou Sudders to make stuck kids a priority and ensure that high-
level leadership from key stakeholders is at the table.
Mid-Term
Develop predictive analytics to identify youth at risk of getting stuck and intervene early.
Focus on repeat admissions and high-utilizers. Develop complex-care management
interventions for high-utilizing youth such as for aggression or placement instability.
Expand quality measurement to include all providers and emphasize care coordination
and functional outcomes. Report performance to providers, encourage sharing of best
practices, and develop accountability for the efficacy of services.
Long-Term
Pool state agency funding for children’s for mental health services from the youth-
serving agencies that frequently require funding negotiations. This would avoid cost-
sharing negotiations between state agencies and allow flexible resource allocation.
Engage in conversations on the movement of MassHealth toward Global Payments and
Accountable Care Organizations. Behavioral Health will likely play a pivotal role in
these new models and it presents an opportunity to ensure that such structures support the
goals of the Children’s Behavioral Health Initiative.
5
Table of Contents
CHILDREN’S BEHAVIORAL HEALTH INITIATIVE ......................................................... 6
MENTAL HEALTH CONTINUUM OF CARE ....................................................................... 6 COMMUNITY BASED .................................................................................................................................................. 6
CRISIS ........................................................................................................................................................................ 7
ACUTE PSYCHIATRIC CARE ....................................................................................................................................... 7
KEY PARTNERSHIPS AND STAKEHOLDERS .................................................................... 7 STATE AGENCY PARTNERS ........................................................................................................................................ 7
INSURANCE PARTNERS .............................................................................................................................................. 8
CLINICAL PARTNERS ................................................................................................................................................. 8
FOUNDATIONS FOR A SYSTEM OF CARE ......................................................................... 9 SYSTEM OF CARE ....................................................................................................................................................... 9
CHILD AND ADOLESCENT DEVELOPMENT ................................................................................................................. 9
PROBLEM .................................................................................................................................. 11 CASE ILLUSTRATIONS .............................................................................................................................................. 11
CONNECTION TO MENTAL HEALTH CONTINUUM OF CARE ...................................................................................... 14
METHODOLOGY ..................................................................................................................... 14 QUALITATIVE ANALYSIS ......................................................................................................................................... 14
QUANTITATIVE ANALYSIS ....................................................................................................................................... 15
FINDINGS ................................................................................................................................... 16 CHARACTERIZATION OF THE STUCK KIDS PROBLEM ............................................................................................... 16
CAUSES OF THE STUCK KIDS PROBLEM ................................................................................................................... 21
KEY FINDINGS AND RECOMMENDATIONS .................................................................... 34 SHORT-TERM RECOMMENDATION: MEASURE THE FULL SCOPE OF THE STUCK KIDS PROBLEM ................................ 35
SHORT-TERM RECOMMENDATION: ENGAGE KEY STAKEHOLDERS TO LEAD INITIATIVES ......................................... 36
MID-TERM RECOMMENDATION: USE PREDICTIVE ANALYTICS TO ENABLE EARLY INTERVENTION .......................... 37
MID-TERM RECOMMENDATION: FOCUS ON REPEAT ADMISSIONS AND HIGH-UTILIZERS .......................................... 38
MID-TERM RECOMMENDATION: DEVELOP MORE COMPREHENSIVE QUALITY MEASURES ........................................ 39
LONG-TERM RECOMMENDATION: ALIGN PAYMENT INCENTIVES THROUGH POOLED FUNDING ................................ 40
LONG-TERM RECOMMENDATION: PREPARE FOR FUTURE PAYMENT MODELS TODAY .............................................. 41
CONCLUSION ........................................................................................................................... 43
APPENDIX .................................................................................................................................. 44 A – GLOSSARY OF TERMS ........................................................................................................................................ 45
B – CBHI ................................................................................................................................................................ 46
C – ROSIE D. LAWSUIT ............................................................................................................................................ 48
D – STATE AGENCY PARTNERS ............................................................................................................................... 49
E – INSURANCE PARTNERS ...................................................................................................................................... 51
F – PRIOR INTERVENTIONS ON STUCK KIDS ............................................................................................................. 52
G – DATA SOURCES ................................................................................................................................................. 56
H – QUALITATIVE INTERVIEWS ............................................................................................................................... 58
I – CARD REPORT ANALYSIS .................................................................................................................................. 59
J – MCI DATA ANALYSIS ........................................................................................................................................ 67
K – ESTIMATED NUMBER OF STUCK KIDS ............................................................................................................... 69
L – CASE STUDIES .................................................................................................................................................. 72
REFERENCES ............................................................................................................................ 80
6
CHILDREN’S BEHAVIORAL HEALTH INITIATIVE
Children’s Behavioral Health Initiative (CBHI) is an interagency initiative of the Massachusetts
Executive Office of Health and Human Services. Its mission is to expand and strengthen
community-based services for youth with behavioral health needs1
CBHI was created following the 2006 class action lawsuit, Rosie D. v. Romney, in which eight
plaintiffs (aged 5 to 16) sued the state of Massachusetts for violating the Early and Periodic
Screening, Diagnosis, and Treatment (EPSDT) provisions of the Medicaid Act. Under the
EPSDT mandate, state Medicaid programs are required to address both the physical and mental
health issues of beneficiaries.2,3 The state was found to have provided inadequate early detection
and home-based treatment for youth with emotional or mental health needs. As a result,
Massachusetts was directed to comply, and CBHI was formed to ensure compliance.4
CBHI has led efforts to provide standardized screening and assessment for all children and
adolescents with Medicaid (MassHealth) and expand community treatment for youth with severe
emotional disturbance (SED). Services provided by CBHI are described in Appendix B. As
Director of CBHI, Emily Sherwood coordinates these initiatives and regularly meets with the
Rosie D. court monitor to share CBHI’s progress.4 While CBHI remains under the supervision of
the court monitor, there are limits to how and what CBHI can change, as mandated by the terms
of the settlement. Appendix C provides an overview of key terms.
CBHI engaged us to understand how youth flow through the mental health system and why some
youth do not flow smoothly despite the many resources available. Specifically, they were
interested in points on the continuum where youth remain longer than medically necessary while
awaiting a next placement or services. Colloquially, this is known as the “stuck kids” problem.
MENTAL HEALTH CONTINUUM OF CARE A broad range of services is available along the mental health continuum. Children and
adolescents flow through the continuum differently depending on their diagnosis, family
situation, and state agency involvement. This section provides an overview of how the mental
health continuum is designed to meet the health needs of young people through community
based, crisis, and acute psychiatric care.
Community Based
Outpatient and Wraparound Services are provided in outpatient clinics or in the home setting.
Pediatricians screen all children and adolescents for behavioral health concerns and focus on
prevention and developmental guidance. If a youth needs behavioral health services, providers
see them on a regular basis in the clinic or at home to focus on creating therapeutic partnerships
and building emotional skills like resiliency and adaptive coping strategies.
Residential Services are provided to youth in the child welfare system or those living outside of
the home. Youth may live in foster homes, group homes, or residential schools for a few months
7
or for longer-term placement. These services are tailored to youth who may have severe
behavioral disturbances or social situations that make them unable to reside at home.
Transitional Care services are for youth in state custody through the Department of Children
and Family Services (DCF) who are clinically stable, but require care beyond what is available in
the outpatient or residential settings. If a youth is in DCF custody but is awaiting a long-term
placement, they may receive care in a Transitional Care Unit (TCU) until a foster home or
residential school is found. A youth who needs additional services may also go to a STARR
(Short-term Assessment and Rapid Reunification) program while providers determine an
appropriate placement.
Crisis
Youth are in crisis when they are at high risk of harming themselves or others or cannot be safely
maintained in their current living situation. If a youth or caregiver feels unsafe, they will call the
Mobile Crisis Intervention (MCI) team or go directly to an Emergency Department (ED). If
possible, the MCI team will evaluate the youth in the community. The team will work with
caregivers to stabilize the youth and determine appropriate next steps including a community-
based support plan or proceeding to acute care. If a youth is in the ED, the MCI team will do a
clinical evaluation and search for an acute placement if it is needed.
Acute Psychiatric Care
If a youth needs acute treatment, including 24 hour clinical supervision and a staff that can
change and administer medications, they will go to an Inpatient unit or Community Based Acute
Treatment (CBAT) program. The inpatient unit is a more contained environment with more
frequent psychiatric consultation. Both settings provide a highly structured environment with
daily therapy options. When it is safe to do so, the youth will be discharged to a lower level of
care such as from inpatient to CBAT and then to home or residential placement such as foster
care, group home, or a residential school.
KEY PARTNERSHIPS AND STAKEHOLDERS There are several state agency, clinical, and insurance partners that support the mental health
continuum and aim to help youth flow smoothly through the system.
State Agency Partners
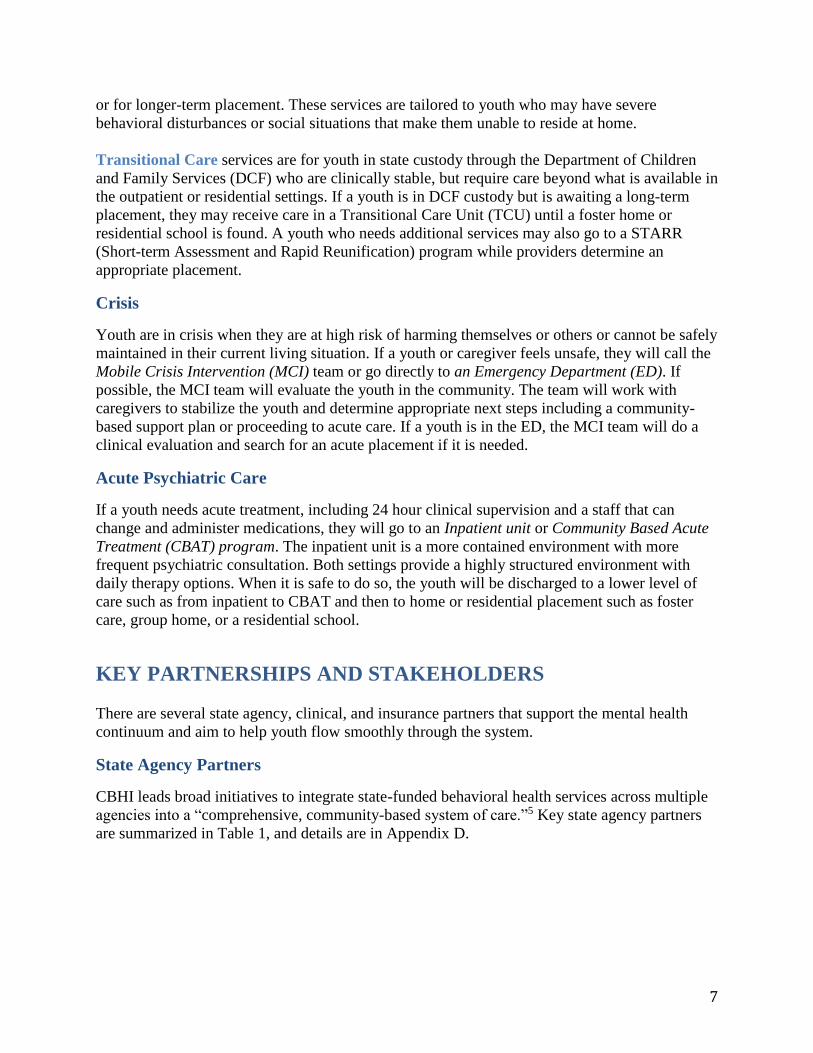
CBHI leads broad initiatives to integrate state-funded behavioral health services across multiple
agencies into a “comprehensive, community-based system of care.”5 Key state agency partners
are summarized in Table 1, and details are in Appendix D.
8
Table 1: Key State Agency Partners
State Agency Role
Department of Mental Health
(DMH)
Mental health authority that licenses inpatient units
and provides continuing care services.
Department of Children and
Families (DCF)
Child welfare agency charged with protecting children
from abuse and neglect. Provides many residential and
transitional care services.
Department of Youth Services
(DYS)
Agency that oversees juvenile justice system and
maintains detention centers and group homes.
Department of Developmental
Services (DDS)
Agency that coordinates services for children and
adults with intellectual disabilities.
Department of Education
(DE)
Local school systems provide or fund education for
special needs children in their communities.
Insurance Partners
Insurance partners provide insurance coverage for behavioral health services. In addition, many
are involved in care management and data sharing. While some MassHealth managed care
entities (MCEs) cover behavioral health services directly, others subcontract for this care. These
behavioral health carve-outs are Massachusetts Behavioral Health Partnership (MBHP) or
Beacon Health Strategies. Additional details are available in Appendix E.
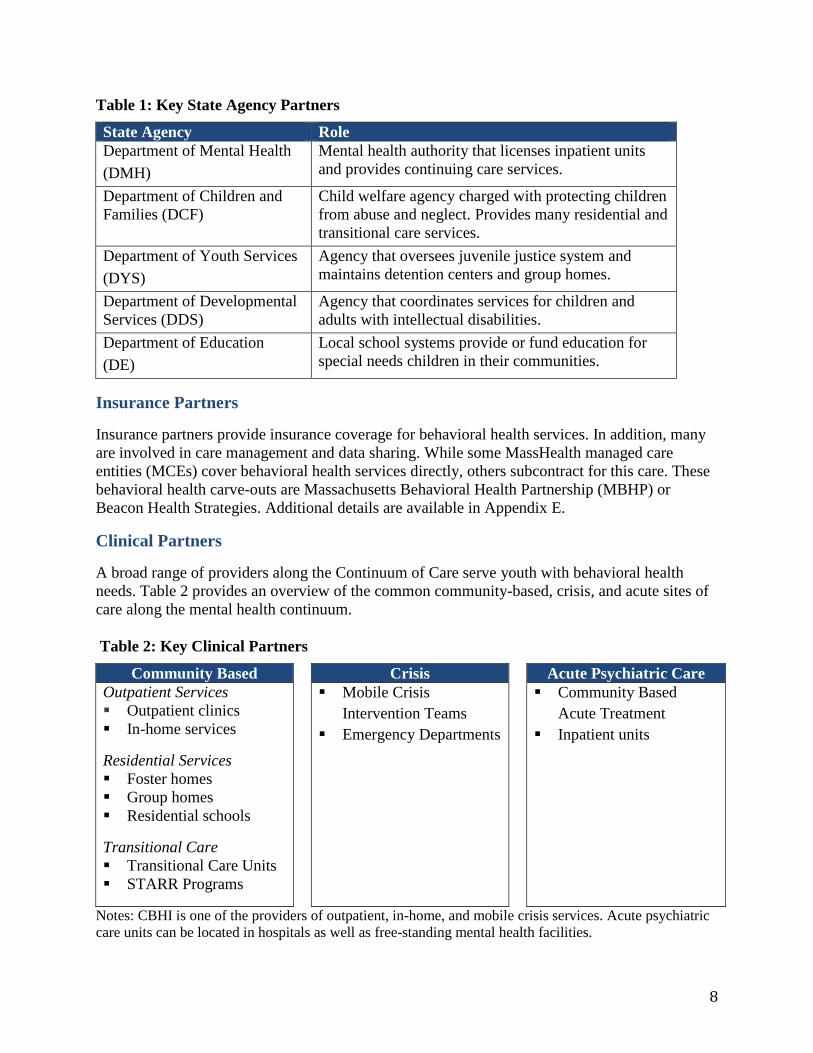
Clinical Partners
A broad range of providers along the Continuum of Care serve youth with behavioral health
needs. Table 2 provides an overview of the common community-based, crisis, and acute sites of
care along the mental health continuum.
Table 2: Key Clinical Partners
Community Based Crisis Acute Psychiatric Care
Outpatient Services
Outpatient clinics
In-home services
Residential Services
Foster homes
Group homes
Residential schools
Transitional Care
Transitional Care Units
STARR Programs
Mobile Crisis
Intervention Teams
Emergency Departments
Community Based
Acute Treatment
Inpatient units
Notes: CBHI is one of the providers of outpatient, in-home, and mobile crisis services. Acute psychiatric
care units can be located in hospitals as well as free-standing mental health facilities.
9
FOUNDATIONS FOR A SYSTEM OF CARE
The provision of mental health services for children and adolescents should be grounded in best
practices for coordinated care delivery and an understanding of the developing brain for
behavioral skill development. In this report, we will use a developmentally-informed and
evidence-based approach, with reference to these foundations as the benchmarks for provision
of youth behavioral health services.
System of Care
The concept of a System of Care was originally developed in 1986 by the Substance Abuse and
Mental Health Services Administration as part of the national Child and Adolescent Service
System Program (CASSP).6 These ideas have become the framework for the provision of
behavioral health services across the country and continue to evolve with the changing needs of
mental health systems.
A System of Care is defined as:
“A spectrum of effective, community-based services and support for children and
youth with or at risk for mental health or other challenges and their families, that is
organized into a coordinated network, builds meaningful partnerships with families
and youth, and addresses their cultural and linguistic needs, in order to help them to
function better at home, in school, in the community, and throughout life.”7
The values of the CBHI reflect such a system of care. CBHI states its core values to be:1
Child-centered and family driven
Strengths-based
Culturally responsive
Collaborative and integrated
Continuously improving
CBHI seeks to integrate services across the state’s youth-serving agencies around these core
values by continuously improving service through the use of data, evidence, recognized best
practices, and family feedback.1
In this report, we will use this definition of a System of Care and seek to uphold and further the
core values of CBHI in our recommendations for the children’s mental health system in
Massachusetts.
Child and Adolescent Development The environment of early childhood shapes the developing brain to profoundly affect learning,
behavior, and lifetime health.8–11 A child’s genetic predisposition, physical environment, and
social and familial relationships all impact the ability to learn language, behavioral skills, and
social-emotional regulation. Adverse childhood experiences such as abuse or neglect, parental
mental illness or substance use, and exposure to family and community violence can change the
way the brain develops.12–14Repeated and prolonged exposure to these adverse experiences is
10
called toxic stress.9 Toxic stress exposes the developing brain to chemicals that impair the child’s
ability to learn emotional skills and adaptive coping mechanisms. Prolonged exposure to toxic
stress can even alter the genome, leading to effects in future generations.15,16
Research has shown a direct relationship between the intensity and duration of toxic stress and
the likelihood of negative outcomes.17 Lifetime effects include poor mental and behavioral
health, educational attainment, low socioeconomic status, and chronic physical diseases such as
obesity, cardiovascular disease, and diabetes.18–20
Nurturing caregivers buffer the effects of toxic stress
The negative effects of toxic stress can be mitigated by the protection of a safe, stable,
responsive relationship with an adult caregiver.11,21 These relationships promote foundational
cognitive and behavioral skills that lead to adaptive coping mechanisms and the ability to tolerate
stresses.9 Supportive caregivers and communities buffer the negative effects of toxic stress and
offer an opportunity to promote positive development. Programs that bolster the abilities of
caregivers, such as visiting nurse programs, are shown to be highly effective.8,9
Stability and permanence matter
Children in the child welfare system also need such buffering relationships. However, those with
mental and behavioral health problems are more likely to experience multiple placements and
less likely to achieve permanency through reunification, adoption or guardianship.22 Research
has shown placement instability to be associated with previous poor behavior, but also with
future externalizing behaviors like acting out and aggression.23–25A system of care should
prioritize placement stability, particularly for children with serious behavioral health needs.
Adolescence is a time of vulnerability and great opportunity
Adolescence is a second period of brain plasticity akin to early childhood. The malleability of the
brain is U shaped, downward-sloping after the toddler years but increasing again with puberty.26
Like infancy, this period of heightened change makes adolescents particularly vulnerable to the
toxic effects of stress and adverse exposures. In this stage of brain development, they are more
susceptible to addiction than adults, have few perceptions of consequences, and are substantially
impacted by peers. The average age of onset of mental health problems is 14, and more than half
of all serious mental health conditions begin between the ages of 10 and 25. Adolescence is a
vulnerable time in development and that requires careful attention in a system of care.27,28
Youth success is determined by self-regulation and resiliency
The central developmental task of adolescence is increasing self-regulation, the ability to
recognize and control one’s emotions and impulses. It is the primary predictor of later mental
health, educational achievement, and social success. All adolescents, even those with histories of
aggression and criminal involvement, can improve self-regulation.26
11
The factors that describe the ability of youth to overcome adverse situations are termed
resiliency. Development of resiliency has been described by the “7Cs:”8
Competence Confidence Connectedness Character Contribution Coping Control
These attributes must be the central focus of a youth serving system.29 Youth need a strong
relationship with a caring adult, high expectations for their success, and opportunities for
meaningful participation to develop into caring and productive adults.30
In this report, we will integrate evidence-informed approaches from the science of child and
adolescent development as foundations for our evaluation and recommendations for the
children’s mental health system.
PROBLEM
Despite the comprehensive services offered throughout the mental health continuum in
Massachusetts, not all youth move through the continuum in a timely manner. Our client, CBHI,
engaged us to understand why some youth do not flow through the system smoothly.
Specifically, CBHI asked us to analyze the two key points on the continuum where youth remain
longer than medically necessary while awaiting their next placement and/or services –
Emergency Departments (EDs) and acute psychiatric units (including inpatient and CBAT units).
Colloquially, this has become known as the “stuck kids” problem.
Case Illustrations
To illustrate the stuck kids problem, we outline three archetypes of cases shared by EDs and
acute psychiatric units during our interviews. These stories highlight how some children get
stuck in the mental health continuum despite the supports offered by their community-based care
teams. It is important to note these three cases are not unique. Many similar cases were shared
with us throughout our interviews. All names and identifying information has been changed.
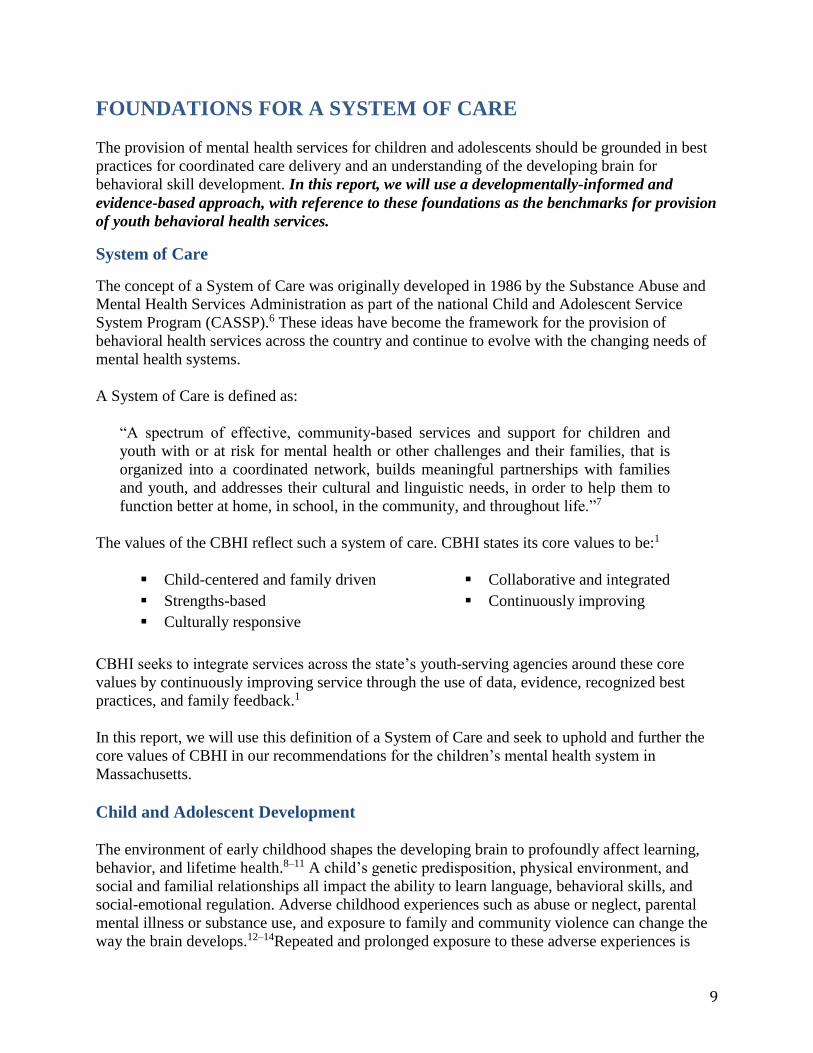
Case: “Dan” – Adolescent with Trauma History
Dan is a 13 year old young man who was diagnosed with anxiety and post-traumatic stress
disorder (PTSD) and was classified as having serious emotional disturbance after repeated
episodes of out acting out. He has a significant history of early childhood trauma and has been in
DCF custody for the last several years. Figure 1 provides an overview of Dan’s community-
based care team.
12
Figure 1: Dan’s Care Team
Dan has had several different placements in foster care and group homes, but his aggressive
behavior towards staff and peers has prevented him from remaining in any placement for a long
period. During his last group home placement, Dan was taken to the ED after threatening and
aggressive behavior toward peers in the residence. When the MCI team arrived to evaluate Dan
in the ED, they determined that he required CBAT level of care and started a bed search.
Although there were beds available at several hospitals, Dan was not felt to be appropriate for
these facilities. Some providers suspected that the units passed on Dan due to his large size and
history of aggressive behavior.
While Dan waited for a bed, he became increasingly hopeless and distressed about not knowing
where he would be placed next. He began to take his frustration out on ED staff. He threw
objects and spit at staff, and required several incidents of restraints. After several weeks, Dan
was admitted to a CBAT. However, he remains at high risk of becoming stuck in the CBAT
because his group home does not intend to take him back and finding an alternative placement
may be difficult due to his history.
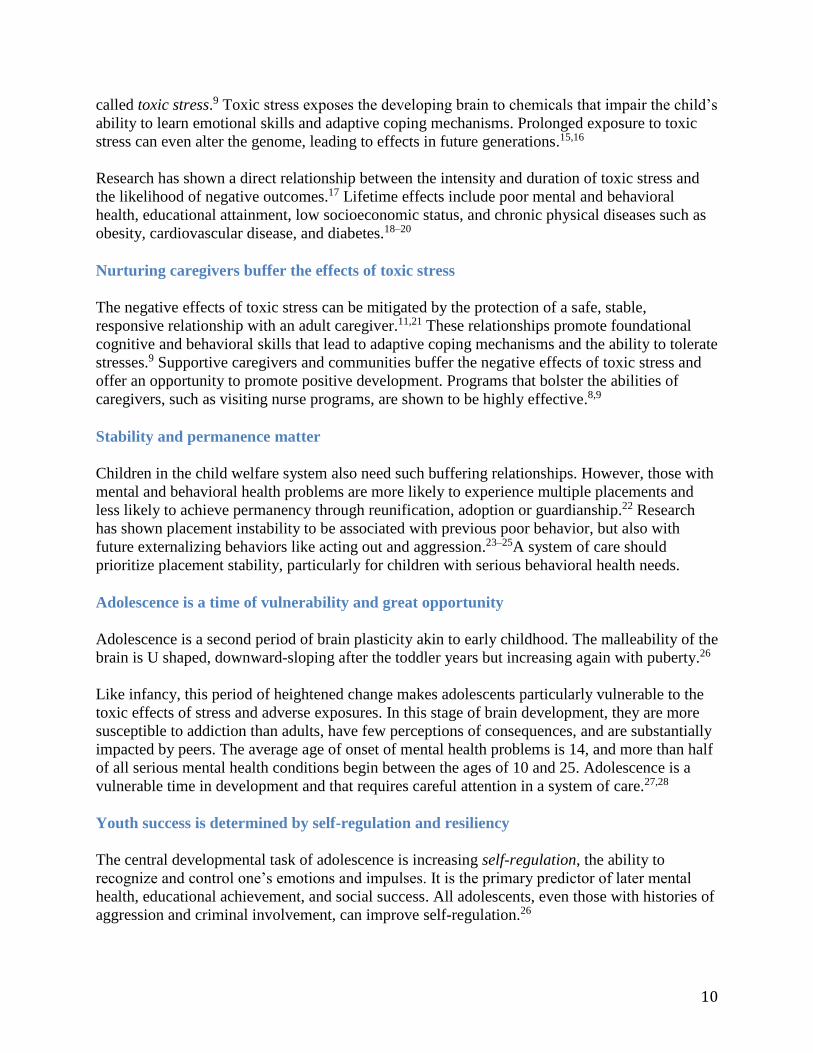
Case: “Kerry” – Young Girl with Autism Spectrum Disorder
Kerry is an 8 year-old girl with autism spectrum disorder (ASD) and severe speech delays.
Figure 2 below provides an overview of her community-based care team.
Figure 2: Kerry’s Care Team
13
Kerry recently presented to the ED after out of control behavior at home. After she arrived in the
ED, the MCI team was contacted and arrived to evaluate Kerry. The MCI team determined that
Kerry required acute psychiatric treatment, and started an inpatient bed search. Inpatient units
were hesitant to admit her because she is nonverbal and they did not feel equipped to care for
her. The only inpatient unit that was open to admitting Kerry had a long waitlist and was located
in a neighboring state.
In the meantime, Kerry boarded in the ED. The bright lights, constant beeping, and frequent
change of staff were disorienting and over-stimulating, and the clinicians did not have the
specialized expertise or resources to communicate with or care for her. As a result, Kerry began
acting out by biting staff. After three weeks boarding in the ED waiting for an inpatient bed,
Kerry left the ED without receiving treatment.
Case: “Sam” – Adolescent with Aggressive Behavior
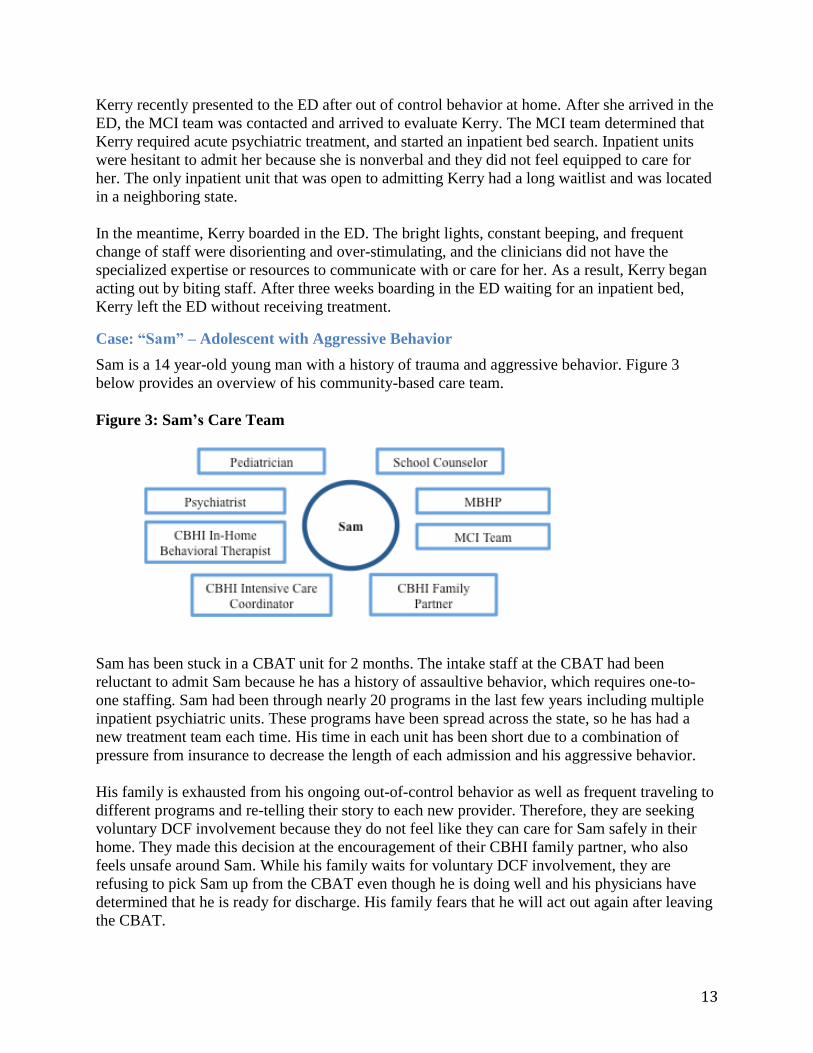
Sam is a 14 year-old young man with a history of trauma and aggressive behavior. Figure 3
below provides an overview of his community-based care team.
Figure 3: Sam’s Care Team
Sam has been stuck in a CBAT unit for 2 months. The intake staff at the CBAT had been
reluctant to admit Sam because he has a history of assaultive behavior, which requires one-to-
one staffing. Sam had been through nearly 20 programs in the last few years including multiple
inpatient psychiatric units. These programs have been spread across the state, so he has had a
new treatment team each time. His time in each unit has been short due to a combination of
pressure from insurance to decrease the length of each admission and his aggressive behavior.
His family is exhausted from his ongoing out-of-control behavior as well as frequent traveling to
different programs and re-telling their story to each new provider. Therefore, they are seeking
voluntary DCF involvement because they do not feel like they can care for Sam safely in their
home. They made this decision at the encouragement of their CBHI family partner, who also
feels unsafe around Sam. While his family waits for voluntary DCF involvement, they are
refusing to pick Sam up from the CBAT even though he is doing well and his physicians have
determined that he is ready for discharge. His family fears that he will act out again after leaving
the CBAT.
14
Residential programs are not an option for Sam at this time. Multiple state agencies are involved
in Sam’s care, but they are each hesitant to fund residential care given its high cost. The other
agencies have decided to wait to see whether DCF will become involved with the family since
DCF involvement would change the interagency dynamics of any funding negotiations.
Connection to Mental Health Continuum of Care
These cases are important to consider because some argue that the stuck kids problem has been
solved. Fewer youth are reported as stuck relative to a decade ago. However, the stuck kids
problem is deeper than the number of reported stuck cases; it is a symptom of larger, persistent
problems in the mental health system. To fully represent the core values of CBHI and clinical
providers, it is important to understand how and why the system fails this group of youth with
severe behavioral health needs.
METHODOLOGY
We collected and analyzed both qualitative and quantitative data to evaluate the stuck kids
problem in Massachusetts.
Qualitative Analysis
We interviewed professionals from state agencies and health care facilities across Massachusetts
as well as health policy experts and leaders of successful programs in other states. Overall, we
completed 33 interviews. Table 3 below provides an overview of our interviewees.
Table 3: Interviews
State Agencies CBHI
DMH
DYS
DCF
Office of the Child Advocate
Community Based
Providers
Outpatient clinics
Residential facilities
DCF STARR programs
CSAs
Crisis Providers MCIs EDs
Acute Psychiatric Units Hospitals CBATs
Advocate Society for the Prevention of Cruelty to Children
Experts Mental health policy
Child welfare
Juvenile justice
Case Examples Wraparound Milwaukee
In semi-structured interviews, we asked these professionals to describe 1) who they think of as
“stuck kids”, 2) why youth get stuck in acute psychiatric units and EDs, and 3) their
recommendations for change.
15
We used detailed notes from these interviews to evaluate trends in the experience and
perspectives regarding the stuck kids problem. We also tracked whether information was
volunteered spontaneously or obtained through direct questions. All responses are identified only
within a category of interviewee to preserve confidentiality.
Data Limitations
A limitation of any qualitative research is that it is a reflection of the opinions and personal
perspectives of interviewees. To address this limitation, every effort was made to speak with a
representative cross-section of stakeholders and assess their responses objectively using the
constant comparative method of qualitative analysis.31
It is important to note that several interviewees indicated that they felt as though they did not
have another avenue to discuss the stuck kids problem outside of their organization, and
perceived our interview as an opportunity to report concerns confidentially. Therefore there may
be a reporting bias to focus on shortcomings of programs rather than strengths. In addition,
responses reflect interviewees’ understanding of the behavioral health system and may not reflect
awareness of existing programs to address their concerns. However, such findings also indicate
important gaps in communication between segments of the system.
Quantitative Analysis
Data Overview
We compiled existing data from MBHP on acute psychiatric units, crisis providers, and
community-based providers to characterize the stuck kids problem and identify trends. See Table
4 below and Appendix G for additional details.
Table 4: MBHP Data Sources and Descriptions
Provider Source Description
Acute
Psychiatric
Units
CARD
Reports*
Overview of children in CBAT or inpatient units that
MBHP determines no longer require the level of care
at their current placement, but they have not been yet
been discharged.
Crisis MCI Trends
Report
Overview of MCI calls, including call volume as well
as calls resulting in ED visits or acute psychiatric unit
referrals.
Community
Based
Children’s
Mental Health
Reports
Overview of utilization of community-based
programs, including TCUs and residential
placements. Residential placements include intensive
foster care, group homes, and residential schools. *CARD = Children awaiting resolution and discharge
Notes: Additional detail on data sources and limitations is available in Appendix G.
16
Data Limitations
While this data is valuable, it is also important to note its limitations. The following children and
youth are not included in our data:
Children and youth boarding in the ED awaiting acute psychiatric unit beds.
Children and youth stuck in STARR programs and TCUs.
Children and youth with commercial insurance or an MCE other than MBHP.
Our data limitations present a challenge for drawing conclusions on the stuck kids problem
because we only have information on a subset of stuck kids. Therefore, we estimated the total
number of stuck kids for all insurance plans and sites of care based on MBHP data, interviews
with providers, and bed capacity.
FINDINGS
We define “stuck kids” as any child or adolescent that remains longer than medically necessary
at a site of care awaiting their next placement and/or services. Sites of care where youth become
stuck include acute psychiatric units, EDs, STARR programs, and TCUs. Although inpatient
Administratively Necessary Days and ED boarding are often considered to be separate issues,
they stem from the same underlying causes and will therefore be discussed as components of the
same “stuck kids” problem.
In this section, we summarize our quantitative and qualitative findings, including:
Characterization of the stuck kids problem
Causes of the stuck kids problem
Characterization of the Stuck Kids Problem
To characterize the stuck kids problem, we quantified the number of stuck kids across the care
continuum and identified key trends in who becomes stuck.
Number of Stuck Kids
State agencies use the CARD Report as a measure of the stuck kids problem.4 CARD Reports
indicate that there are an average of 147 children and youth per month stuck in acute psychiatric
units, including children and youth not affiliated with state agencies.
Based on these CARD Reports, a handful of interviewees believed that the stuck kids problem
has been solved. Since more children were stuck for longer periods a decade ago, they do not
believe that stuck kids should be a current policy focus.
17
Despite the achievement of reducing the number of stuck children, it is important to note that the
CARD Report does not capture the full spectrum of the stuck kids problem. Note the following
data gaps by site of care.
Acute Psychiatric Units: Only children with MBHP are included in the CARD Report.
Therefore, the report does not capture children with other behavioral health carve-outs or
commercial insurance.
Crisis Providers: Boarding in the ED or at home while awaiting a bed in an acute
psychiatric unit is not systematically tracked across all insurance plans, although most
state agency representatives did mention ED boarding was an issue.
Community Providers: STARR and TCU programs were developed to help address the
stuck kids problem in acute psychiatric units. However, the STARR programs we
interviewed reported stuck kids to be a significant problem in their units as well. One
STARR program reported having a child stuck for over six months when their length of
stay was anticipated to be forty-five days. In addition, TCUs were designed as a
transitional program after an acute psychiatric unit discharge to ease the stuck kids
problem. Therefore, TCU programs likely face similar challenges with stuck kids.
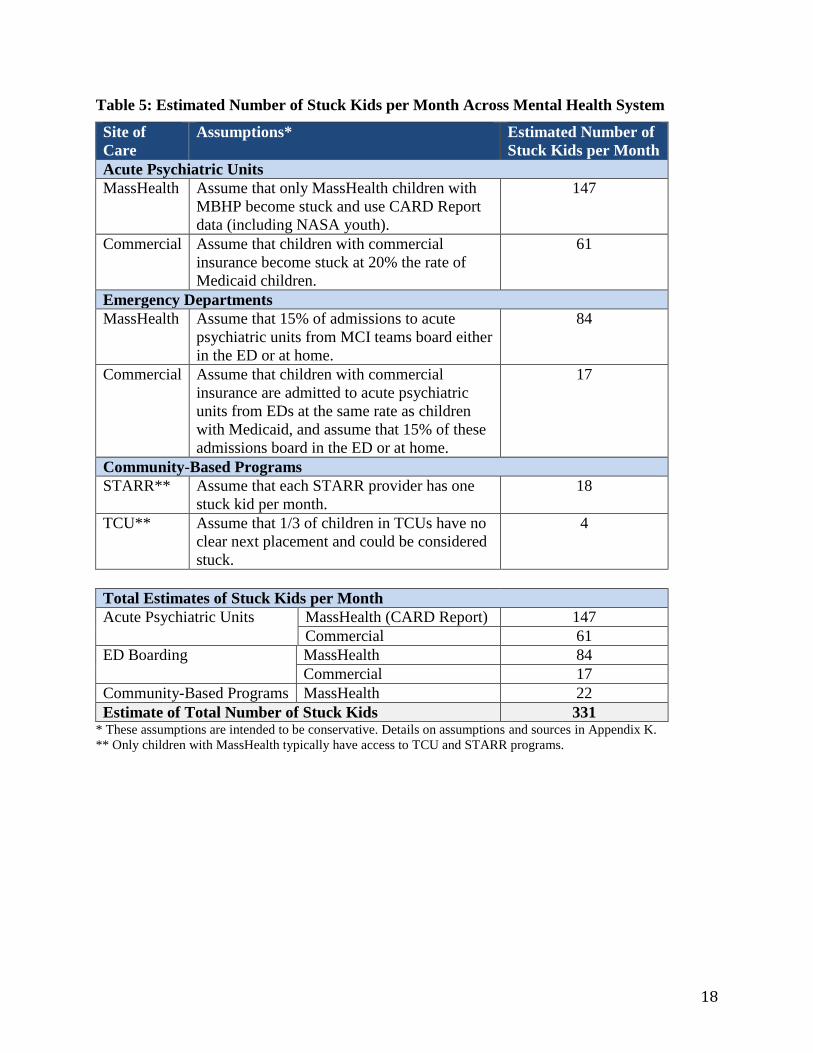
Accounting for these gaps, we conservatively estimate that the stuck kids problem across all sites
of care is over twice as large as CARD Reports indicate. See Table 5 and Appendix K for
detailed estimates.
State agencies may argue that these sites or populations are outside the scope of their
responsibility. However, providers’ capacity and resources depends on total demand for services.
Therefore, it is important to understand the full system.
18
Table 5: Estimated Number of Stuck Kids per Month Across Mental Health System
Site of
Care
Assumptions* Estimated Number of
Stuck Kids per Month
Acute Psychiatric Units
MassHealth Assume that only MassHealth children with
MBHP become stuck and use CARD Report
data (including NASA youth).
147
Commercial Assume that children with commercial
insurance become stuck at 20% the rate of
Medicaid children.
61
Emergency Departments
MassHealth Assume that 15% of admissions to acute
psychiatric units from MCI teams board either
in the ED or at home.
84
Commercial Assume that children with commercial
insurance are admitted to acute psychiatric
units from EDs at the same rate as children
with Medicaid, and assume that 15% of these
admissions board in the ED or at home.
17
Community-Based Programs
STARR** Assume that each STARR provider has one
stuck kid per month.
18
TCU** Assume that 1/3 of children in TCUs have no
clear next placement and could be considered
stuck.
4
Total Estimates of Stuck Kids per Month
Acute Psychiatric Units MassHealth (CARD Report) 147
Commercial 61
ED Boarding MassHealth 84
Commercial 17
Community-Based Programs MassHealth 22
Estimate of Total Number of Stuck Kids 331 * These assumptions are intended to be conservative. Details on assumptions and sources in Appendix K.
** Only children with MassHealth typically have access to TCU and STARR programs.
19
Characteristics of Stuck Kids
The majority of providers interviewed spontaneously said that they could tell which youth would
become stuck when they presented to care (3/4 of inpatient and 2/3 of MCI interviewees).
Provider’s recognition of which youth are at risk indicates strong trends in who is likely to
become stuck.
This section provides insight into the demographics of stuck kids based on our qualitative and
quantitative analyses. Note that our quantitative analysis relies heavily on CARD Report data
because it is the best available data on stuck kids, despite its limitations.
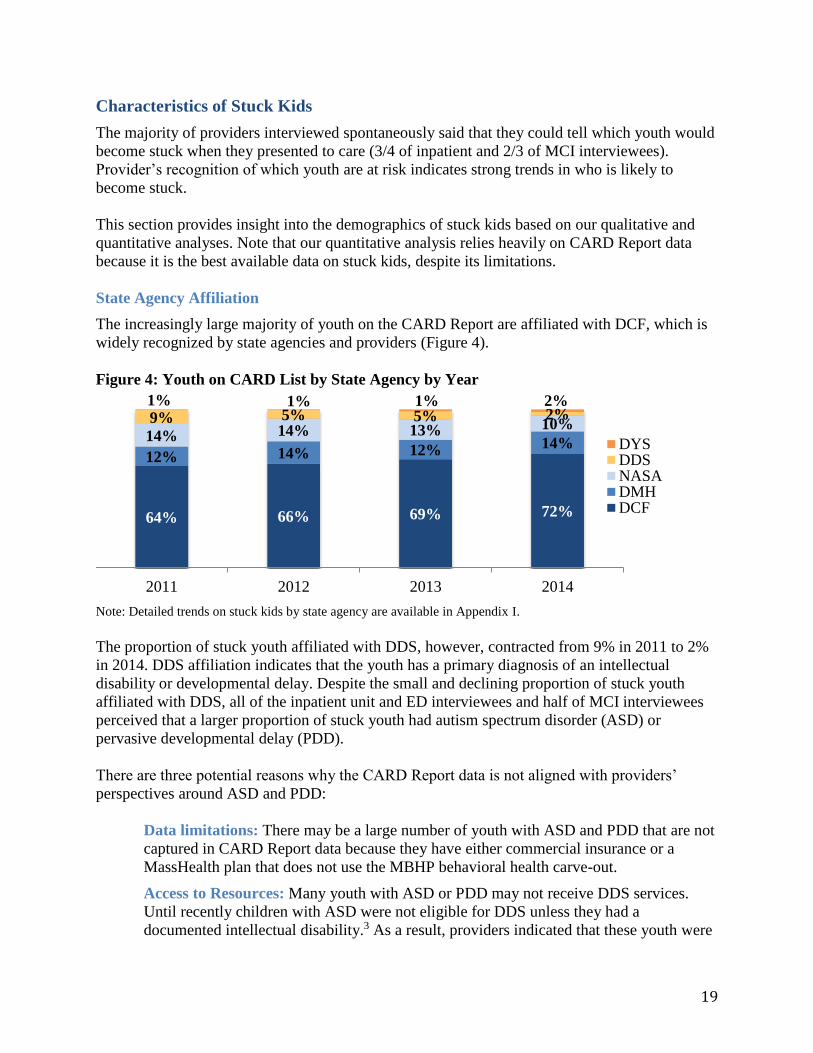
State Agency Affiliation
The increasingly large majority of youth on the CARD Report are affiliated with DCF, which is
widely recognized by state agencies and providers (Figure 4).
Figure 4: Youth on CARD List by State Agency by Year
Note: Detailed trends on stuck kids by state agency are available in Appendix I.
The proportion of stuck youth affiliated with DDS, however, contracted from 9% in 2011 to 2%
in 2014. DDS affiliation indicates that the youth has a primary diagnosis of an intellectual
disability or developmental delay. Despite the small and declining proportion of stuck youth
affiliated with DDS, all of the inpatient unit and ED interviewees and half of MCI interviewees
perceived that a larger proportion of stuck youth had autism spectrum disorder (ASD) or
pervasive developmental delay (PDD).
There are three potential reasons why the CARD Report data is not aligned with providers’
perspectives around ASD and PDD:
Data limitations: There may be a large number of youth with ASD and PDD that are not
captured in CARD Report data because they have either commercial insurance or a
MassHealth plan that does not use the MBHP behavioral health carve-out.
Access to Resources: Many youth with ASD or PDD may not receive DDS services.
Until recently children with ASD were not eligible for DDS unless they had a
documented intellectual disability.3 As a result, providers indicated that these youth were
64% 66% 69% 72%
12% 14% 12% 14%14% 14% 13% 10%9% 5% 5% 2%1% 1% 1% 2%
2011 2012 2013 2014
DYSDDSNASADMHDCF
20
often not affiliated with a state agency (NASA) or instead received services through
DMH. Therefore DDS affiliation may be a poor proxy for ASD or PDD, and the CARD
Report data may underrepresent the number of these youth.
Recall Bias: People tend to believe that events with emotional significance occur more
frequently than they really do.32 Therefore, it is possible that because these cases were
more salient to providers due to their both their severity and the reported lack of available
resources, they remembered them more readily. Providers reported both a paucity of
services and expertise for these youth.
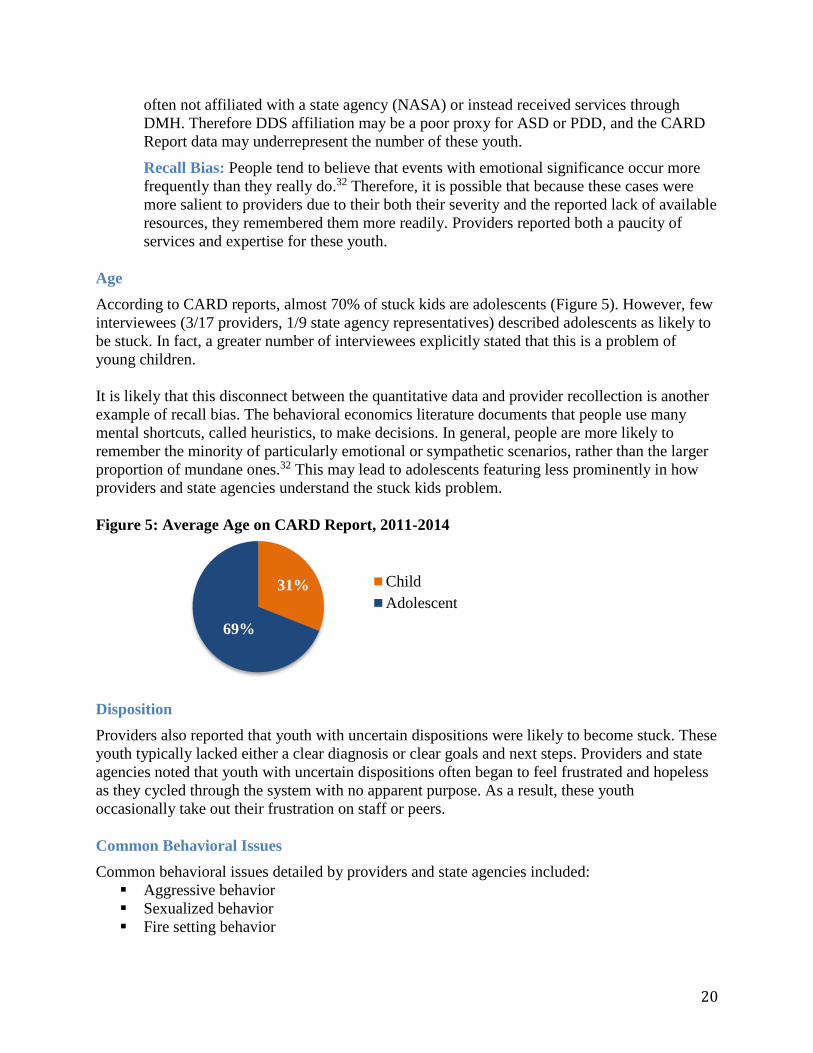
Age
According to CARD reports, almost 70% of stuck kids are adolescents (Figure 5). However, few
interviewees (3/17 providers, 1/9 state agency representatives) described adolescents as likely to
be stuck. In fact, a greater number of interviewees explicitly stated that this is a problem of
young children.
It is likely that this disconnect between the quantitative data and provider recollection is another
example of recall bias. The behavioral economics literature documents that people use many
mental shortcuts, called heuristics, to make decisions. In general, people are more likely to
remember the minority of particularly emotional or sympathetic scenarios, rather than the larger
proportion of mundane ones.32 This may lead to adolescents featuring less prominently in how
providers and state agencies understand the stuck kids problem.
Figure 5: Average Age on CARD Report, 2011-2014
Disposition
Providers also reported that youth with uncertain dispositions were likely to become stuck. These
youth typically lacked either a clear diagnosis or clear goals and next steps. Providers and state
agencies noted that youth with uncertain dispositions often began to feel frustrated and hopeless
as they cycled through the system with no apparent purpose. As a result, these youth
occasionally take out their frustration on staff or peers.
Common Behavioral Issues
Common behavioral issues detailed by providers and state agencies included:
Aggressive behavior
Sexualized behavior
Fire setting behavior
31%
69%
Child
Adolescent
21
As a result of these issues, some youth become stuck because their parents cannot or will not
take them home due to safety concerns. Providers report that in some cases parents come to this
decision at the encouragement of CBHI family partners.
Repeated Admissions
Repeated admissions and being “kicked out” of residential facilities were also named frequently
as markers of youth who are likely to become stuck. When youth have a history of repeat
admissions or multiple residential placements, it is an indicator that they are difficult to maintain
and may require additional staffing or other resources. Therefore, providers become less likely to
take that youth and the youth becomes more likely to get stuck
Causes of the Stuck Kids Problem The most common causes of the stuck kids problem discussed by interviewees included:
Systems problems, including capacity constraints, high acuity patients, frequent
readmissions, and the lack of outpatient resources
Quality issues, including the perceived lack of efficacy of services delivered by CBHI,
inpatient units, and MCI teams, and the lack of accountability for quality of outcomes
across the system.
Payment issues, in terms of both payment rates and the structure of reimbursement.
Leadership and collaboration problems, including the lack of strong leadership,
interagency cooperation, and meaningful participation from all stakeholders.
Systems Problems
“Stuck kids are like the canary in the coal mine- they are a manifestation of
larger problems in the mental health system” - State agency interviewee
“ED problems flow from hospital problems because of a systemic failure to
find appropriate placement . . . it is almost always a systems problem and
lack of therapeutic efficacy” - Inpatient provider
Almost all interviewees regarded stuck kids as a surface-level problem that serves as an indicator
of more fundamental problems in the mental and behavioral health system. Many spontaneously
noted that the issues of stuck kids in the ED and on inpatient units are part of the same system
wide problems. The most common problems mentioned include capacity, high acuity, frequent
readmissions and, lack of outpatient resources.
22
Capacity
It is widely held that the seasonal variation in demand for child and adolescent acute services
complicates the evaluation of capacity needs. The highest volume is when school is in session,
while units can be nearly empty during the summer. The majority of interviewees spontaneously
raised this issue, and both CARD and MCI data indicate that volumes vary significantly by
season. For example, the average number of stuck kids on the CARD Report ranges from 142
during summer months to 155 during fall months (See Appendix I).
Despite trends in seasonal variation, respondents had differing views about whether the cause of
youth getting stuck is merely a capacity issue within the mental health system.
In general, state agency interviewees were less likely to think that capacity is a problem; only 4/9
mentioned any kind of capacity constraint. Furthermore, two high level interviewees explicitly
stated that capacity was a false start and a distraction from the underlying systems problems.
In contrast, over 75% of providers (13/17) thought that there was a capacity issue in the mental
health system that contributed to kids being stuck. This makes sense as the providers are doing
the day-to-day admitting and discharging and would perceive a lack of availability in
placements. However, there was no broad agreement over where capacity should be expanded.
Among providers, CBATs and STARRs were most likely to think that additional capacity was
needed and 75% of these providers cited foster care and residential capacity as a constraint.
These are generally the places to which such providers discharge children and adolescents.
Overall, the most common issue mentioned was capacity for autism spectrum and
developmentally delayed youth (7/17 providers). This was concentrated in the providers who see
these cases most often and experience the youth who are stuck for long periods of time without
services. Two-thirds of ED providers and half of MCI and inpatient unit interviewees felt there is
not enough capacity for ASD or PDD youth.
Almost no providers thought that more inpatient capacity was needed. A small number expressed
the idea that more state hospital Intensive Residential Treatment Program (IRTP) beds would
help reduce waiting times.
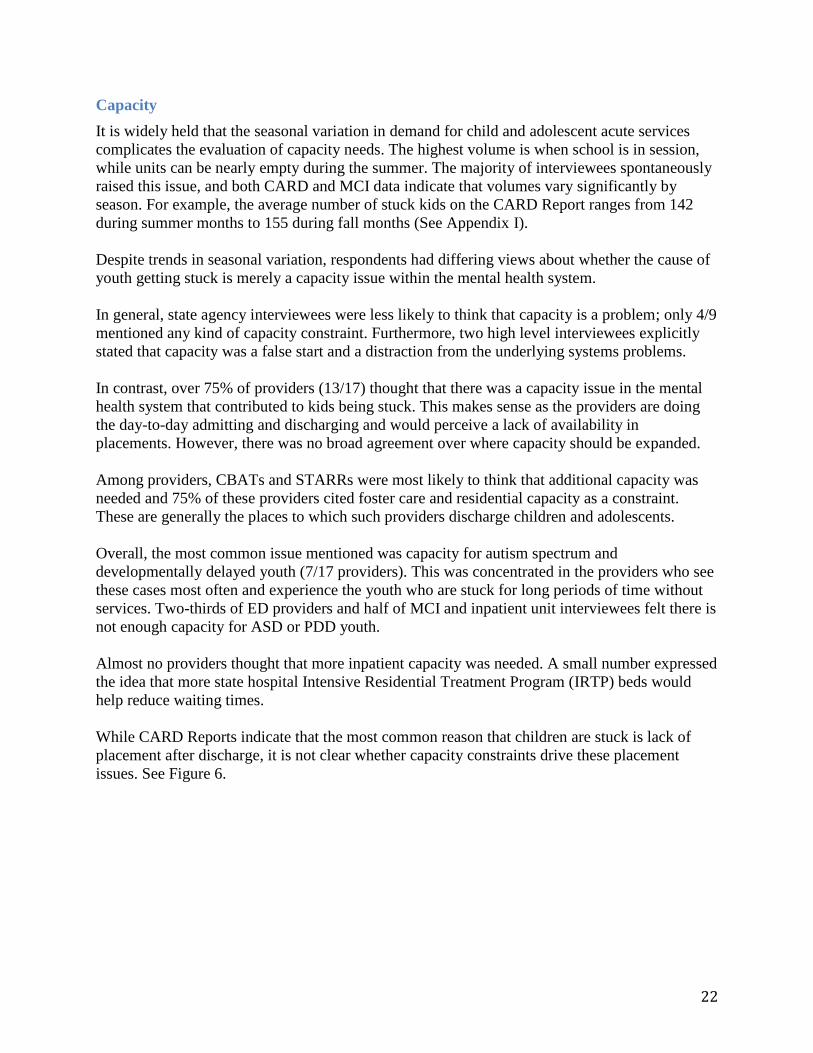
While CARD Reports indicate that the most common reason that children are stuck is lack of
placement after discharge, it is not clear whether capacity constraints drive these placement
issues. See Figure 6.
23
Figure 6: Reported Reason Youth Stuck on CARD Report, 2013-2014
Note: Data from 2011 and 2012 is excluded due to significant changes in reason code definitions beginning in 2012.
Similar reason categories have been combined for the purpose of this analysis.
Acuity
The anecdotal sentiment that the “acuity” of the youth in the mental health system has increased
in recent years was common throughout our interviews with providers. Notably, all (4/4)
inpatient providers and two-thirds of CBAT providers spontaneously raised this issue. Most
providers described these higher acuity youth as being more assaultive, combative, and difficult
to contain. These behavioral issues were particularly difficult among larger adolescents who had
the potential to harm staff or other patients on the unit. As a result, all inpatient interviewees
were concerned about the mix on their units due to the high volume of aggressive youth.
"If they want to take kids out of EDs, they are sitting there for a reason . . .
They are too disruptive to the milieu. If we already have 3-4 assaultive kids
on the unit, we can’t take more."
--Inpatient provider
The majority (3/4) of inpatient interviewees ascribed the increase in acuity to the success of
CBHI. Because CBHI has successfully kept many youth in the community, an unintended
consequence has been to leave only the most complex and challenging youth in acute settings.
“CBHI has been successful in keeping a lot of kids in the community who we
used to see admitted inpatient . . . But now what is left is extremely acute,
assaultive . . . the system hasn’t changed with this demographic change”
--Inpatient provider
The perceived increase in acuity may also have substantial financial implications that affect flow
through the system. Most interviewees felt that aggressive youth were less desirable patients for
acute units. Half of all providers explicitly stated that there was a financial disincentive for
taking aggressive or complex youth, including 3/4 of inpatient providers, 2/3 of EDs, and half of
MCI interviewees.
39%
11%
1%5%
44%
DCF Placement/Services
DMH Eligibity or Placement
Educational Setting
Other
No placment
24
“While I would like to say that there are no financial decisions on whether to
accept a patient, it does have a financial impact on the hospital . . . As much
as we want to fill the bed, we have risk in this as well. Workers
compensation, restraint rates go up, just processing the paper intake . . .”
--Inpatient provider
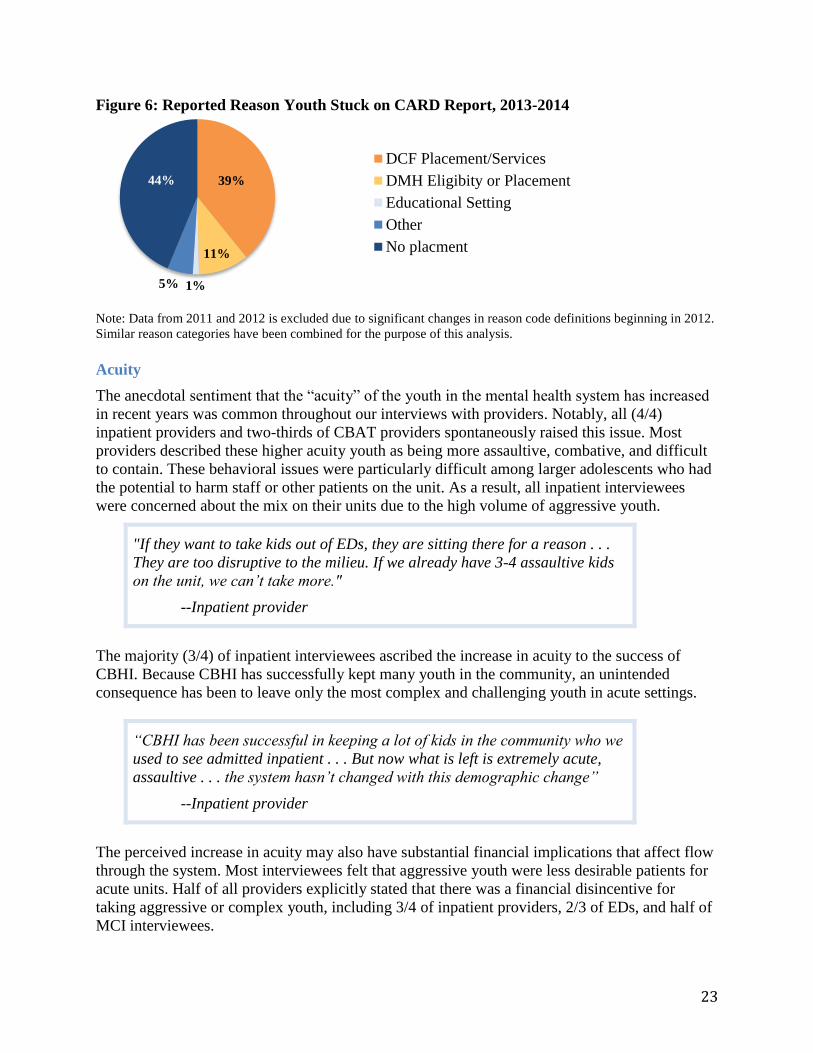
While providers report increasing acuity, they also cite increasing pressure from insurance
companies to send higher acuity patients to a lower-cost site of care. CBATs are typically
reimbursed at a significantly lower rate than inpatient units. As a result, they reported that CBAT
acuity has increased significantly over the last several years. However, the CARD Report data
indicates that the proportion of stuck kids in CBATs has remained relatively constant (See Figure
7). However, it is important to note that we do not have data total CBAT volumes or acuity.
Figure 7: Children on CARD Report by Site of Care, 2011-2014
Some (25%) of providers suggested using a high acuity payment rate because this would
incentivize acute units to take aggressive youth from the ED, rather than passing them over for
other patients. However, almost an equal number of providers, including half of inpatient
interviewees, did not believe this would help. They felt that ultimately a higher rate would not
guarantee that these youth get the specialized services and environment that they need.
Many providers, including 3/4 inpatient interviewees and half of MCIs, thought the idea of an
intensive adolescent unit had promise. Many cited a comparable adult unit at The Quincy Center,
an Arbor facility, which has all single rooms, trained staff, and specialized services for
aggressive adult patients.
There may be a notable disconnect between how providers and state agencies perceive trends in
acuity. Only a minority (2/9) of state agencies raised the concern of increased acuity.
Readmissions
Frequent readmissions were viewed as a fundamental contributor to stuck kids problem by all
CBAT, STARR, and outpatient providers and by 3/4 of inpatient interviewees. Overall, half of
all interviewees spontaneously raised the issue of readmissions as a problem, making it the
55% 57% 55% 55%
41% 36% 35% 33%
3% 8% 10% 12%
0%
20%
40%
60%
80%
100%
2011 2012 2013 2014
Substance Abuse
Inpatient
CBAT/ICBAT
25
second largest systemic issue mentioned. It is commonly believed that readmissions are fueled
by length of stay pressure and the need to “fail up” in order to access more acute services.
Length of Stay: Length of stay pressure was a frequently raised topic by interviewees across all
sectors (11 total, including 7 providers and 4 state agency interviewees). Many felt as though
pressure from insurance providers to decrease length of stay had severely impacted their ability
to provide the quality of care that patients needed. In addition, providers stated that they felt like
the degree and character of utilization management had changed such that it was more intense
and adversarial than in the past.
“There needs to be more robust programs when they are inpatient or at a
higher level of care . . . Maybe keeping them longer is better than having
tons of 3-day hospitalizations.” - MCI provider
Failing Up: Several provider interviewees specifically mentioned a “fail-up” system in which
youth had to experience multiple acute psychiatric hospitalizations before insurance plans, state
agencies, or schools would consider funding more intensive treatment or residential care.
“How many short-term placements should one kid or family need to
experience to be paid attention to in a different way?” - CBAT provider
While we do not have data on youth’s admission and residential placement histories, we can use
CARD Reports to see how many months a youth appears on the CARD Report over a three-year
period (2011-2014). On average, a youth that has been stuck is on the CARD Report for 2.9
months over this period, with a wide range from one month to nineteen months.
The months that a youth is on the CARD Report may be either consecutive or non-consecutive.
Non-consecutive months on the CARD Report occur when a youth experiences several distinct
stuck episodes. Regardless, being stuck for multiple months is a chronic issue for a subset of
youth.
Over 43% of youth are on the CARD list for greater than three months.
Over 10% of youth are on the CARD list for greater than four months.
Over 5% of youth are on the CARD list for greater than five months.
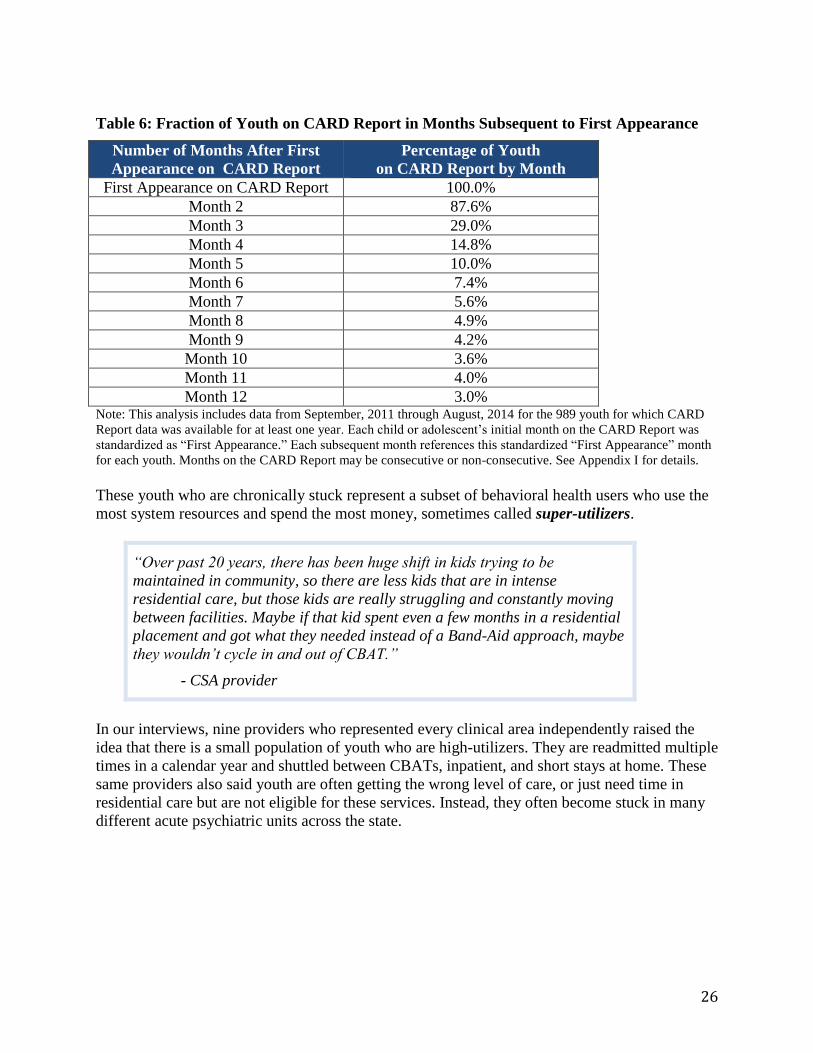
We analyzed how often youth became stuck using three years of CARD Report data. We found
that if a child or adolescent is on the CARD Report in any given month, there is a high
probability that they will be on the CARD Report for the next two to three months. In addition,
there is a subset of youth that will remain stuck for long periods or become stuck again during
subsequent months. See Table 6 and Appendix I for details.
26
Table 6: Fraction of Youth on CARD Report in Months Subsequent to First Appearance
Number of Months After First
Appearance on CARD Report
Percentage of Youth
on CARD Report by Month
First Appearance on CARD Report 100.0%
Month 2 87.6%
Month 3 29.0%
Month 4 14.8%
Month 5 10.0%
Month 6 7.4%
Month 7 5.6%
Month 8 4.9%
Month 9 4.2%
Month 10 3.6%
Month 11 4.0%
Month 12 3.0% Note: This analysis includes data from September, 2011 through August, 2014 for the 989 youth for which CARD
Report data was available for at least one year. Each child or adolescent’s initial month on the CARD Report was
standardized as “First Appearance.” Each subsequent month references this standardized “First Appearance” month
for each youth. Months on the CARD Report may be consecutive or non-consecutive. See Appendix I for details.
These youth who are chronically stuck represent a subset of behavioral health users who use the
most system resources and spend the most money, sometimes called super-utilizers.
“Over past 20 years, there has been huge shift in kids trying to be
maintained in community, so there are less kids that are in intense
residential care, but those kids are really struggling and constantly moving
between facilities. Maybe if that kid spent even a few months in a residential
placement and got what they needed instead of a Band-Aid approach, maybe
they wouldn’t cycle in and out of CBAT.”
- CSA provider
In our interviews, nine providers who represented every clinical area independently raised the
idea that there is a small population of youth who are high-utilizers. They are readmitted multiple
times in a calendar year and shuttled between CBATs, inpatient, and short stays at home. These
same providers also said youth are often getting the wrong level of care, or just need time in
residential care but are not eligible for these services. Instead, they often become stuck in many
different acute psychiatric units across the state.
27
Philosophical Divide on Residential Care: Multiple interviewees from across state agencies and
provider settings expressed the viewpoint that some families cannot safely maintain more
complex youth at home even with maximal supports. However, this was not a view shared by all.
“There is a model of treatment where
[therapists] would go into the home and be
available to the family as often as possible.
The job was to have success with the family.
They go in with the belief that they can keep
kids who are hard in the home, they really
believe that.”
- State agency interviewee A
“We are raising a generation in institutions.
And it is not doing much good.”
-State agency interviewee B
“You have to acknowledge that families
are at various stages of understanding
and willingness to work on behavior.”
- State agency interviewee C
“There has been a change of philosophy
that kids need to be in home and
community. And we should have that.
But it overlooks that some kids that need
residential level of care and you can’t
apply that philosophy to every kid.”
- CSA provider
“Sometimes there are circumstances
that you can’t reasonably, safely,
humanely treat a child in a place
without walls and secure staffing. No
matter what we do, it will always be a
necessarily level of care for some kids.”
- MCI provider
These comments underscore a basic philosophical difference that we encountered during
interviews. Some favor a rigorous wrap-around approach where even the most challenging youth
can remain at home with their families if sufficient intervention is delivered. Others feel that
some families are so overwhelmed by current challenges, including a caretaker’s own mental
health or personal limitations, that a very high acuity and complex youth cannot be safely
maintained at home. These philosophical disagreements are likely complicated by variation in
treatment options across the state.
Outpatient
Outpatient mental and behavioral health treatment is often viewed as the backbone of a
functioning health system. However, inadequate outpatient care was the single most
frequently cited systemic issue leading to stuck kids.
“What is causing this issue? The inadequacy of community mental health.
The watering down and lack of integrity of outpatient. Identifying and
getting help earlier is very needed.”
- State agency interviewee
When early detection and treatment does not happen, the situation for youth and families
deteriorates. Half of state agency interviewees and one third of providers said that inadequate
28
outpatient care was a root cause of kids becoming stuck and that a recommendation to fix the
problem would be to bolster the outpatient system.
“More and more agencies have shrunk their outpatient component because
they are not compensated adequately. Who in the world can afford to do fee-
for-service if you are graduating with immense student loans?”
- CSA provider
All outpatient providers interviewed said that both the payment rates and the current fee-for-
service system make it impossible to provide high quality care. In a fee-for-service environment,
providers must take on high case-loads to earn an adequate salary through billing for each
appointment. They perceive that they are not paid for care coordination services like calling
other providers, school, or family members – only for in-person visits.
Multiple interviewees from all sectors cited a lack of highly trained outpatient staff, including
child psychiatrists and experienced therapists, leading to long wait lists and poor quality of care
for children with MassHealth. They reported that poor quality of care stemmed from lack of care
coordination, short appointments, and lack of experience and training.
Quality Issues
Many interviewees felt that the lack of measurement of and accountability for quality
outcomes and the need for more efficacious services contributed to the stuck kids problem.
Quality Measurement
The quality of mental and behavioral health services is typically measured through process
metrics. For example, providers are evaluated on length of stay, whether or not a follow-up
appointment is scheduled within a week of discharge, and or restraint rates.
However, outcome measurements of quality that assess clinical improvement or life functioning
are rarely used.
“We should be focusing on the triple aim of healthcare – looking at
outcomes and experience, not just utilization”
- State agency interviewee
“Systems do not support real quality because we do not look at outcomes”
- State agency interviewee
The lack of outcomes measurement was brought up most often by advocacy groups and outside
policy experts. Both DCF and DMH interviewees raised this as an issue as well, but it was only
mentioned by 30% of state agency interviewees overall. Very few providers suggested lack of
outcome measurement as a problem.
29
Rather, more interviewees cited the problem that very little data was collected or shared between
agencies or providers. Four state agency interviewees said it was a problem that either data was
not collected or not shared. Some cited parental preference for not sharing data or privacy
constraints. Four providers recommended collecting better data, though few state agency
interviewees expressed this view. Two high level DCF and DMH interviewees said better data
sharing and collection would be helpful, but expressed little optimism about this reality.
Quality of Services
Many interviewees expressed the idea that youth became stuck because the efficacy of mental
and behavioral health services was lacking. They felt that youth are not getting the care they
need at the time they need it.
In all, 88% (8/9) of state agency interviewees and 75% (13/17) of providers spontaneously cited
the quality of one or more components of the mental and behavioral health system as an
underlying problem contributing to stuck kids. The most frequently mentioned areas were CBHI,
Inpatient units, and MCI.
CBHI
Many interviewees expressed that CBHI was serving the majority of youth well. They mentioned
a substantial shift in the number of youth who can safely be cared for in the community and a
positive change in the range of options now available for behavioral services.
However, they felt that for a subset of high-acuity or very complex youth, CBHI services were
not having the desired effect. The view that CBHI does not serve complex children well was
raised spontaneously by at least one interviewee in every group. Eleven interviewees expressed
concern about the quality of services in CBHI, including 7 providers and all 3 interviewees from
DCF. Ten interviewees cited the experience and level of training of ICCs and in-home
behavioral providers, including all regional DCF interviewees and 3/4 inpatient providers. Six
interviewees were concerned that supervision was inadequate.
"The CBHI continuum of services with CSAs and in-home therapy was huge for
allowing us to have legitimate sub-acute alternatives that can hold families and
children in the community in a safe and therapeutic way that mitigates risk. It
enables providers to aim for hospitalization much less than they did in past."
--MCI provider
30
Interviewees often described CBHI clinicians as “inexperienced” and “overwhelmed.” They also
cited frequent turnover and inadequate levels of training for challenging cases. Four separate
interviewees used identical phrasing that the least experienced providers were treating the most
challenging youth in the system.
Many interviewees, including every inpatient provider, expressed a concern about the ability of
CBHI providers to work with the most complex children. Several providers expressed concern
about the number of in-home team members assigned to each family while seeing little
improvement in outcomes.
Another common concern, particularly among inpatient, STARR providers, and DCF was that
the family partner often aligns with the caretakers in fear of the youth or pushes the family to
keep the youth out of the home. As a result, family partners were often viewed as working in the
interests of the caretaker rather than in the best interest of the youth.
Inpatient
About a third of all interviewees raised the issue that the quality of inpatient care has eroded,
including most DCF and DMH interviewees. Notably, 3/4 inpatient provider interviewees said
that inpatient quality is in general variable or that their units were not providing the kind of care
they would like to be.
The most commonly cited reasons for quality erosion were budget constraints and pressure to
decrease length of stay.
“The hospital used to be a place where all the difficulties could be worked
out, but the hospitals are not given that time anymore. They are not getting
paid for the work that they had to do in the past.” - Inpatient provider
Interviewees mentioned hospitals previously offering more therapy and neurocognitive
evaluation with psychologists, as well as more occupational therapy, sensory evaluation, and
physical therapy that they were unable to do now due to budget constraints.
“They are young and not deeply experienced.
They are well intended, but often taken back
by the level of violence that they see in these
homes.” - Inpatient provider
“The people who are seeing these kids are new
grads – so the least experienced in the system
are seeing the most disturbed kids. The senior
people are not doing the work and the junior
people are not getting the supervision.”
- Outpatient provider
“The most difficult setting to work in is the
home, so we are putting the hardest work on
the least paid and experienced in the system.”
- MCI provider
“The demands and expectations on staff are
very, very high. They are dealing with the most
complicated kids in the state, with the most
needs, and staff don’t have the experience and
training and supervision and support.”
- CSA Provider
31
Length of stay was a frequently raised topic by interviewees across all sectors (11 total, 7
providers and 4 state agency interviewees). All DMH and some DCF interviewees spontaneously
raised length of stay pressure. It was also mentioned by 3/4 inpatient, 2/3 CBAT, and an MCI
team. In addition, providers stated that they felt like the degree and character of utilization
management had changed such that it was more intense and adversarial than in the past.
MCI
Some (7/26) interviewees, most of whom were from state agencies including DCF and DYS,
stated that MCI services or training needed to be improved. However, very few providers said
that MCI services were of variable or poor quality. In fact, 6/17 providers volunteered that their
relationship overall was positive with MCI. This included 2/3 of CBAT and ED providers.
The most common state agency recommendation for system change was expansion of the role of
MCI to include prevention and crisis planning. However, no providers suggested this. Instead,
providers favored improving CBHI services or creating an acute unit for aggressive teens.
Payment
Payment was the most commonly discussed problem that interviewees believed influenced stuck
kids. Overall, 77% of interviewees (7/9 state agencies, 14/17 providers) spontaneously
mentioned payment rates or payment structures, including all outpatient, CBAT, STARR,
Inpatient, DMH, and DCF interviewees. However, the issue was quite polarized. While some
interviewee groups universally discussed payment, others, such as MCI teams, did not mention it
as an issue.
Rates
Most interviewees who identified payment as an issue said that the payment rates were
inadequate to support high quality care.
“It takes time to get the kid to go home. The social workers are not doing
disposition planning on the unit – the financing doesn’t support this”
- State agency interviewee
“The insurance just wants to get the kid out. Some facilities are still doing
the right thing, being family centered . . . but they’re not getting paid for it.”
- State agency interviewee
Structure
Most state agency interviewees (75%, including all of DCF and DMH) and 11/17 providers
including all CBAT, all outpatient, and some inpatient, MCI, and ED providers, said that the
structure of payments incentivized the wrong things. This included hospitals not getting paid for
disposition planning (this was said as often by state agencies as by providers). In addition, 100%
of outpatient interviewees spontaneously mentioned the negative consequences of a fee-for-
service model. Outpatient providers said that they feel rushed to see high caseloads and that the
32
uncertainty of their income causes people to leave the field. They also perceived that they did not
get paid to call community team members, coordinate care, or do other administrative work.
“It’s the fee-for-service model that doesn’t work. How do you do training
when you’re doing fee for service?”
- CSA Provider
Although billing codes for patient calls and care coordination exist, it is notable that they were
not mentioned by any interviewees. There may be inadequate communication about the use of
these codes, or providers may feel that the reimbursement is too low to justify the administrative
burden of billing for these individual services.
In addition, different entities fund different aspects of patients’ care. Therefore, funding
incentives do not always align even between state agencies. Residential care, for example, is
funded by different combinations of state agencies and schools depending on each beneficiaries’
situation. Interviewees report that accessing residential services can therefore require long
difficult negotiations between both different state agencies and schools.
Leadership and Cooperation
Multiple interviewees said that strong leadership was necessary to improve the mental health
care system.
“Someone needs to take the helm, say we are going to do this! This is the
model! . . . There needs to be a strategic response.”
- State agency interviewee A
“It all boils down to same problem, which is who is running the show?”
- State agency interviewee B
“There is no hammer, no decider . . . Who can pick up the phone and say you
have to take this kid? People are always telling us to do more. Tell me, what
is that more?”
- MCI provider
In total, 11/26 interviewees mentioned the need for stronger leadership on a range of issues along
the mental health continuum, including a creating a culture of excellence and stronger oversight
of hospital rejections. These views were most often expressed by interviewees from DCF and
from inpatient hospital units.
Many interviewees were excited by the appointment of Secretary Marylou Sudders, and they
believed that she was the only one who could successfully address issues related to interagency
cooperation, communication with providers, and bringing key stakeholders to the table.
33
Interagency Cooperation
Interagency cooperation and siloing was raised as an issue by half (13/26) of all interviewees. It
was more frequently raised by state agencies themselves than by providers. Among providers,
lack of state agency coordination was most felt by inpatient, CBAT, and STARR programs (7/8
providers). Half of inpatient providers and all STARR programs also mentioned that state
agencies and MBHP often do not agree in their clinical recommendations.
“It starts at the highest level, being responsible to kids and families. The
focus should be on getting the services that they need rather than what door
a kid walks through”
- CBAT provider
“Everyone is focused on where the kid should go, not what the kid needs.”
- State agency A
“We should be focused on what is best for the child, not who is paying for
what unit of care.”
- State agency B
State agency interviewees frequently discussed how the state needs to be more responsible to
youth and focus on ensuring quality, rather than focus on cost sharing negotiations or dividing
payment for care episodes. This sentiment was expressed independently by 7 interviewees,
including both DCF and DMH.
Clinical Providers
There is frequently a communications gap between what is intended on a state level and what is
understood by clinical practitioners. For example, only a handful of providers we interviewed
were familiar with the new Caring Together program (See Appendix F for details on Caring
Together). Most were confused about the purpose of the program. Clear communication would
be well received by providers.
In addition, providers cited a lack of avenues for expressing their concerns about stuck youth
with state agencies and EOHHS. A handful of providers even mentioned fear of future backlash
from state agencies if they expressed disagreement with the opinions of state agencies on the
cases of individual youth or on the issue of stuck youth more broadly.
Key Stakeholders
While some key stakeholders send high-level representatives to CARD committee meetings
focusing on stuck kids, others either fail to send a representative or send a low level
representative that lacks formal authority to make decisions.
34
DDS: There is no DDS representation at the CARD committee meetings, even though
youth with ASD and PDD are a significant concern among other state agencies.
DCF: DCF’s mental health specialists actively participate in the CARD meetings and
they are extremely knowledgeable. However, DCF does not send high-level leadership to
these meetings.
MassHealth MCEs and Behavioral Health Carve-Outs: Only MBHP regularly attends
CARD committee meetings. However, efforts are underway to rotate involvement from
other MCEs and behavioral health carve-outs in addition to MBHP.
School Systems: School systems are not directly involved in CARD committee meetings
even though cost sharing between state agencies and school districts is a well-known
cause of budgetary issues for stuck kids. Half of all interviewees said that involving
schools in reform was important or mentioned relationships and communication with
schools as a key part of the stuck problem.
DOI: DOI engages commercial insurance plans and the agency recently held hearings on
children’s mental health services. However, they are not actively involved in
conversations on stuck kids with other state agencies.
KEY FINDINGS AND RECOMMENDATIONS
The following recommendations are based on our key findings from both our quantitative
analysis and qualitative interviews about the nature and causes of the stuck kids problem.
These recommendations incorporate current evidence-based practices from the behavioral health,
healthcare economics, and management literatures, as well as lessons learned from successful
programs in other states (See Appendix L for case example details). These recommendations also
seek to align with the foundational values for a System of Care stated by the Children’s
Behavioral Health Initiative.
Our short, mid, and long-term recommendations include:
Short-Term
Measure the full scope of the stuck kids problem.
Engage key stakeholders to lead initiatives
Mid-Term
Use predictive analytics to enable early intervention.
Focus on repeat admissions and high-utilizers
Develop more comprehensive quality measures.
Long-Term
Pool funding to align incentives
Prepare for future payment models today
35
Short-Term Recommendation: Measure the full scope of the stuck kids problem
Key Finding
The stuck kids problem is currently defined and measured primarily through the CARD Report.
While the CARD Report captures youth stuck in acute psychiatric units who are the direct
responsibility of MBHP and the state agencies, it does not describe the full scope and magnitude
of the stuck kids problem. We conservatively estimate that the stuck kids problem is two to three
times larger than the CARD Report suggests.
Recommendation
Any intervention to address the issue of stuck kids in Massachusetts must be informed by a true
understanding of the scope and nature of the problem. Therefore, we recommend developing a
system to track and report the stuck kids problem across the care continuum and for all payers.
Sites of Care: Acute psychiatric units, EDs, STARR Programs, and TCUs
State Agency Affiliation: Youth affiliated and youth not affiliated with state agencies
Insurance Plans: All MassHealth and commercial plans
Sharing actionable data is a key to the success of other wraparound programs and would advance
CBHI’s core intention to integrate and improve services using data (See cases in Appendix L).
Political Considerations
State agencies may argue that these sites or populations are outside the scope of their
responsibility. However, provider capacity and resource availability depends on total demand for
services. Therefore, it is important to understand the full system. In addition, insurance plans
that have not traditionally been involved in the stuck kids problem may be hesitant to share data.
For this reason, it is important to engage both MassHealth and the Department of Insurance to
help communicate the importance of collaborating. Finally, clinical partners are likely to
welcome the broader focus on stuck kids. However, they will be hesitant of data collection if it
requires additional time without a clear benefit.
Operational and Financial Feasibility
Most of these additional data on stuck kids are already tracked by state agencies or insurance
plans. Therefore, incorporating this data into a stuck kids report would primarily require building
partnerships and establishing data-sharing agreements. ED boarding may be an exception since
some insurance plans may not currently track it.33 Therefore, establishing a comprehensive
measure of ED boarding may require additional capacity.
Action Steps
Form a subcommittee of both state agency and clinical stakeholders to lead this initiative.
Broaden the definition of stuck kids to include youth with behavioral health needs that do
not flow smoothly through any site along the care continuum.
Partner with insurance plans and the DOI to collect data on non-MBHP stuck kids.
Work with DCF to collect and report data on stuck kids in TCUs and STARR programs.
Partner with clinical providers, MCIs, insurance plans, and advocacy groups to develop a
strategy for collecting ED boarding data.
Identify a data-sharing platform to report stuck kid data in an easy-to-use format.
Ensure that data is actionable and captures important trends in who is stuck and why.
36
Short-Term Recommendation: Engage key stakeholders to lead initiatives
Key Finding
Many interviewees felt that the leadership necessary to address the stuck kids problem was
lacking. They expressed a desire to see someone “leading the charge.”
Recommendation
Many interviewees believed that Secretary Marylou Sudders was the only one who could
successfully lead the charge to break down silos and address the stuck kids problem. We
certainly agree that it is important to engage Secretary Sudders.
In addition, we recommend engaging the following stakeholders at a high-level with the
authority to make decisions and concessions.
DDS: There is no DDS representation at committees focusing on stuck kids. We
recommend coordinating with Secretary Sudders to ensure DDS involvement.
DOI: DOI recently held hearings on children’s mental health services. We recommend
actively collaborating with DOI leadership on these issues.
DCF: DCF’s mental health specialists actively participate in committees on stuck kids,
and they are extremely knowledgeable. We recommend coordinating with Secretary
Sudders to engage active support at the Commissioner level as well because stuck kids
can only become a visible priority for DCF with high-level support.
School Systems: School systems are not actively involved in committees focusing on
stuck kids. We recommend consulting with Secretary Sudders and school superintendents
on how to more actively engage school leadership.
MassHealth Behavioral MCEs: Efforts are underway to rotate involvement from other
MCEs in addition MBHP. To ensure optimal data collection and care management it is
crucial to have all insurance plans actively involved.
Clinical providers: Clinical providers representing different sites of care are not actively
engaged in committees or conversations on the stuck kids problem. We recommend
creating an avenue for clinical leaders to provide insight on both potential initiatives and
provider communication strategies.
Political and Operational Feasibility
Engaging this broad range of stakeholders will be essential to the success of any initiative. Many
of these stakeholders are likely eager to participate. For example, many clinical providers want to
improve quality and build better relationships with the state. They are just not sure where to start.
However, some of the leaders that we recommend engaging, including DDS, are invited to
committee meetings on the stuck kid problem and choose not to participate. Engaging these
leaders will likely require Secretary Sudders’ leadership.
37
Action Steps
Engage Secretary Sudders on the stuck kids problem.
Identify key stakeholders and work with Secretary Suddders on an engagement strategy.
Encourage and support genuine communication from stakeholders.
Subdivide the larger committee into smaller working groups as necessary to promote
deeper conversations and accountability.
Mid-Term Recommendation: Use predictive analytics to enable early intervention
Key Finding
Many providers noted that they could tell immediately who was likely to become stuck. CARD
Report data corroborated several of the features they identified.
Recommendation
We recommend developing predictive analytics to identify youth at risk of getting stuck.
Predictive analysis would enable early intervention, which could prevent children from
becoming stuck and promote the development goal of stability and permanence.34
Predictive analytics can be an effective strategy to improve patient care while avoiding lowering
costs. For example, Parkland Health and Hospital System in Dallas, Texas has successfully used
patient’s clinical and social characteristics to predict who may be in need of additional
intervention to prevent heart failure readmissions. As a result, they have reduced 30-day
Medicare readmissions for heart failure by 31% without increasing staffing.35
Political Feasibility
Predictive analytics is likely to be supported by most key stakeholders as long as the early
intervention teams have the resources and training necessary to be effective. A small number of
stakeholders may also be hesitant to support the program if they felt that it would make accessing
residential care more difficult for youth in need of those services.
Operational and Financial Feasibility
Developing the algorithm to identify youth at risk of becoming stuck will require a computer
scientist or skilled quantitative analyst with broad access to MassHealth data. The potential cost
savings from predictive analytics may offset the cost of developing the algorithm and
implementing an early intervention program. However, the financial analyses of this
recommendation should be ongoing as the analytics are developed and the number of at-risk
youth is estimated.
38
Action Steps:36
Form a subcommittee of state agencies, clinical providers, and insurance plan
stakeholders to lead this initiative.
Identify a computer scientist or quantitative analyst to evaluate the potential for
development of a predictive analytics program using claims data.
Use historical claims data to evaluate if it is possible to predict who will become stuck.
Estimate the number of children at risk of becoming stuck.
Partner with state agencies and clinical providers across the continuum to develop
evidence-based early intervention services.
Develop a pilot program and evaluate the potential for a state-wide program.
Mid-Term Recommendation: Focus on repeat admissions and high-utilizers
Key Finding
The quantitative and qualitative data point to a small number of youth who are admitted multiple
times to multiple different programs. These youth cycle between short placements in inpatient
units, CBATs, home, and residential facilities, and eventually become stuck. There are also
specific populations of high-utilizing youth, such as aggressive adolescents, that are challenging
to treat and become stuck.
Recommendation
We recommend developing complex-care management programs and interventions designed for
specific high-utilizing populations such as youth with aggression or placement instability. Care
management programs specifically for high-utilizers present an opportunity to target the visible
gaps in the current system and engage stakeholders, including acute care providers, wraparound
programs, and schools.37–39 Medicaid behavioral health programs such as those in Colorado and
Texas have already started using these approaches (Appendix L). 40–42
This small population of youth may also benefit from a wraparound team with specific training
and experience in aggression. Massachusetts should continue its role as a leader in restraint
reduction by implementing on a statewide basis programs such as the Collaborative Problem
Solving (CPS) approach or the Treatment of Maladaptive Aggression in Youth (T-MAY)
guidelines and sharing best practices between adolescent providers.43–45 Targeted interventions
provide an opportunity to address the adolescent population that is often overlooked in stuck kid
discussions, but who is at a critical junction for developing behavioral skills for future success.
Operational and Political Feasibility
MCEs and hospitals already measure 30-day readmission rates; however they only pertain to
readmission to the same hospital. By virtue of admission to the first open acute bed, youths are
often readmitted instead to another inpatient unit or CBAT, which should also be measured.
Health plans could use claims data to develop a more complete metric as well as a “trigger
criteria” by examining outliers in top spending or number of admissions. Providers expressed
challenges with these youth and would welcome more information and resources. They also
voiced support for an intensive adolescent unit with single rooms and specialized staff which
may present an opportunity to decrease boarding while improving care for this population.
39
Financial Feasibility
Developing complex-care management teams and specific programming for aggressive youth
will require upfront investment. It will require special staff training and retaining experienced
staff. However, previous cross-disciplinary case management initiatives like the Massachusetts
Mental Health Services Partnership for Youth (MHSPY) demonstrated cost-effectiveness for a
similar small, high-need group (Appendix L).46,47 In addition, success will require easing length
of stay penalties for acute units. Strict utilization review is correlated with increased
readmissions in youth specifically, and it may save money overall with fewer, more intensive
treatment options. 48
Action Steps
Collect and share data on 30-day readmission to all inpatient units or CBATs.
Share and implement best practices for adolescents and aggressive youth, and investigate
the development of intensive units.
Develop a “trigger criteria” for high utilization such as historic admissions or spending.
Develop high-utilizer care management program including both acute care and
wraparound providers.
Monitor readmissions and overall utilization in addition to the number of youth who
become stuck. Share information among providers to facilitate shared responsibility.
Mid-Term Recommendation: Develop more comprehensive quality measures
Key Finding
Stuck kids are an indication of underlying problems in the behavioral health system. Youth who
become stuck are not getting the care that they need. Providers and agencies across the system
are not held accountable for care processes, outcomes, coordination, and client satisfaction.
Recommendation
We recommend expanding quality measurement to include all providers, emphasizing care
coordination and functional outcomes. Currently, CBHI rigorously evaluates its wraparound
processes including those in outpatient, MCI, and ICC/IHT. These evaluations also include
measures of family engagement and satisfaction.49 Similar quality measures should be developed
throughout the system to encourage use of recommended practices and coordination between
silos of care delivery. Agency integration and continuous improvement are core tenets of CBHI,
and meaningful improvement in youth functioning should be a joint responsibility of youth-
serving entities.
Measuring outcomes in behavioral health can be particularly challenging due to the range of
presentations and the difficulty of attributing improvement to interventions.50–52 It is also
important to ensure adequate risk-adjustment in reporting outcomes to not select against
challenging patients.53–55 However, outcome measurement and payment is now increasingly used
to guide progress in a diverse care team. Philadelphia Community Behavioral Health, a Medicaid
MCE, uses pay-for-performance for nearly all providers and has observed promising
40
improvements.56,57 (Appendix L). Even without financial incentives, public reporting of
measures is shown to stimulate provider quality improvement processes.58,59
Massachusetts already uses the CANS as an instrument for process and outcomes measures;60
however, we believe it can better utilized to achieve its full potential. We recommend converting
the CANS into a fully electronic system that providers can update in a timely manner and use to
view the progress of individual patients over time. Evaluations should also be shared between
providers in different settings to facilitate collaboration and mutual accountability.
Operational and Political Feasibility
Operationally, improvement of the CANS is very feasible but requires technical assistance. Full
data sharing will be more difficult, but other systems such as Wraparound Milwaukee have
successfully used a voluntary waiver to enable access to relevant data on the part of a broad
group of individuals working with a child and family (Appendix L).61–64
Politically, it is important to develop a culture among providers of continuous improvement and
data use. Studies of other Medicaid systems have shown most success when stakeholders help
design the measures and feel like the data is straightforward to contribute and meaningful for
their individual practice.65,66
Action Steps
Identify programming assistance to develop an electronic and viewable CANS system.
Develop waivers to enable sharing of CANS data for patients entering a system of care.
Use experience with CBHI wraparound quality measurement to develop measures for
other care settings (acute, outpatient, residential) including recommended practices,
functional outcomes, care coordination, and satisfaction.
Share data on individual performance with providers, including their performance
relative to the aggregate group of their peers.
Consider future options to integrate quality with financial accountability using pay-for-
performance, particularly under a global payment or shared budget system that
encourages flexible resource use.
Long-Term Recommendation: Align payment incentives through pooled funding
Key Finding
Funding incentives are not aligned between state agencies. When youth need services that
require joint funding decisions between state agencies, funding negotiations can be slow and
difficult. Interviewees report feeling like everyone is always pointing the finger at everyone else.
As a result, youth can be at high risk of being stuck for longer amounts of time.
Recommendation
We recommend pooling state agency funding for children’s behavioral health services for use
with that group of individuals whose care frequently requires funding negotiations. Pooled
funding would allow state agencies to make decisions about service provision on the basis of
need rather than on individual agency budgets. By removing constraints on time and type of care,
41
pooled funding has the potential to reduce both the number of stuck kids and the length of stay of
stuck kids. In addition, it could improve overall collaboration between state agencies.63 See
Appendix L for case examples of how pooled state agency funding can align incentives.
Political Feasibility
Pooled funding would require the leadership and support of Secretary Sudders. Some state
agencies are likely to resist pooled funding because it reduces the autonomy of individual
agencies. However, recent success with DMH and DCF collaborating on the Caring Together
initiative may provide a solid foundation for pooling interagency funding. Insurance plans and
clinical providers are likely to support pooled funding if it decreases the amount of time that
children are stuck in acute psychiatric units and they can share in the resulting savings.
Operational and Financial Feasibility
Establishing pooled funding will require an intensive financial analysis of historical state agency
spending as well as the characteristics of youth that become stuck. This analysis will help to
identify which services should be included and to determine the scope and potential magnitude
of state agency contributions. Secretary Sudders should chair an interagency committee that
oversees this process. The committee should also determine operating procedures for requesting
services covered by the pooled funding. By aligning incentives, pooled funding has the potential
to decrease length of stay, which would both improve quality and reduce costs.63
Action Steps
Engage Secretary Sudders on aligning incentives through pooled funding.
Establish an interagency committee to lead the transition pooled funding.
Analyze historical interagency conflict and joint funding to determine which services are
appropriate to include in the initiative.
Analyze historical spending for these services to determine how each state agency should
contribute to the pooled fund.
Establish a system for ongoing evaluation. Consider the following metrics:
Length of stay
Number of kids stuck while awaiting placement
Utilization of services funded through pool and directly through state agencies
Number of interagency conflicts
Implement pooled funding in stages by starting with one specific set of services to ensure
that the processes work well.
Long-Term Recommendation: Prepare for future payment models today
Key Finding
The incentive and accountability structures in the children’s mental health system are
fundamentally misaligned. Different providers and state agencies are responsible for discrete
points along the continuum. However, no single person or entity is responsible for ensuring that
children flow through the system of care smoothly and appropriately. Many providers reported
that this structure actually prevents them from doing their jobs well. As one interviewee put it,
“You don’t necessarily have to pay people more. You just have to pay them differently.”
42
Recommendation
The structure of MassHealth payment is set to change as it evaluates the potential for
accountable care organizations (ACOs).67,68 We recommend actively engaging in these payment
conversations to ensure that the new payment structures support CBHI’s goals. ACOs are groups
of physicians and hospitals that are responsible for caring for a defined group of patients. ACOs
are often funded through global payments, which are set amounts per patient for specific time
periods.69 This structure allows providers to focus on the most appropriate services for children
and their families without considering reimbursement details. Providers are also rewarded for
managing their patients well. If providers meet both financial and quality targets, they receive
financial rewards funded by the savings that accrue from better patient management.69 This
reward structure is commonly referred to as “shared savings.”
Centers for Medicare and Medicaid Services has suggested global payment models with shared
savings as a strategy for addressing fragmented behavioral health systems, particularly in states
with behavioral health carve-outs like Massachusetts.70 Philadelphia County in Pennsylvania
started a Medicaid shared savings program in 2009 and early results are promising. Not only do
early results indicate that behavioral health care is improving, but their payment structure is
supporting the integration of physical and behavioral care.67,70 See Appendix L for case details.
Political Feasibility
Global payment would require the leadership and support of Secretary Sudders as well as
Governor Baker. While some state agencies and clinical providers are likely to be hesitant of
large changes to payment structure, others are likely to support the goals of payment reform.
Operational and Financial Feasibility
Global payment may require MassHealth MCOs and providers to invest in technology to support
the new payment structure. Providers and state agencies would also require training on the new
payment structure. While some ACOs cite large upfront costs, it is highly variable, and global
payment also offers cost savings and quality improvement opportunities.
Action Steps
Engage Secretary Sudders on the role of children’s behavioral health in Medicaid ACOs.
Join the MassHealth conversations on payment reform.
Establish a committee with state agencies and providers to prepare for payment reform.
Develop a strategy with provider leaders to communicate payment changes to providers.
Identify and measure quality metrics before financial incentives are in place.
Develop metrics to evaluate success.
43
CONCLUSION
Stuck kids are the “canary in the coal mine” indicating fundamental problems in the mental
health system in Massachusetts. Although many children, adolescents, and their families benefit
from the current behavioral health services, there is a group of youth who are not being well
served. Addressing the underlying causes of the stuck kids problem will require significant
structural and payment changes to the mental and behavioral health system. These changes
would enable greater collaboration and alignment between state agencies, payers, and providers
to support the provision of high-quality care delivered at the right place and the right time.
Leading change on these underlying causes of stuck kids offers an opportunity for the Children’s
Behavioral Health Initiative to strengthen its role in providing comprehensive services to all
youth with significant behavioral health needs. The recommendations that we have outlined in
this report provide a path forward toward a system of care that reflects the core values of CBHI.
Now is a pivotal moment in the development of reformed health systems in Massachusetts and
CBHI is well poised to be a leader and advocate for this important population of young people.
44
APPENDIX
A – Glossary of Terms
B – CBHI
C – Rosie D. Lawsuit
D – State Agency Partners
E – Insurance Partners
F – Prior Interventions on Stuck Kids
G – Data Sources
H – Qualitative Interviews
I – CARD Report Analysis
J – MCI Data Analysis
K – Estimated Number of Stuck Kids
L – Case Studies
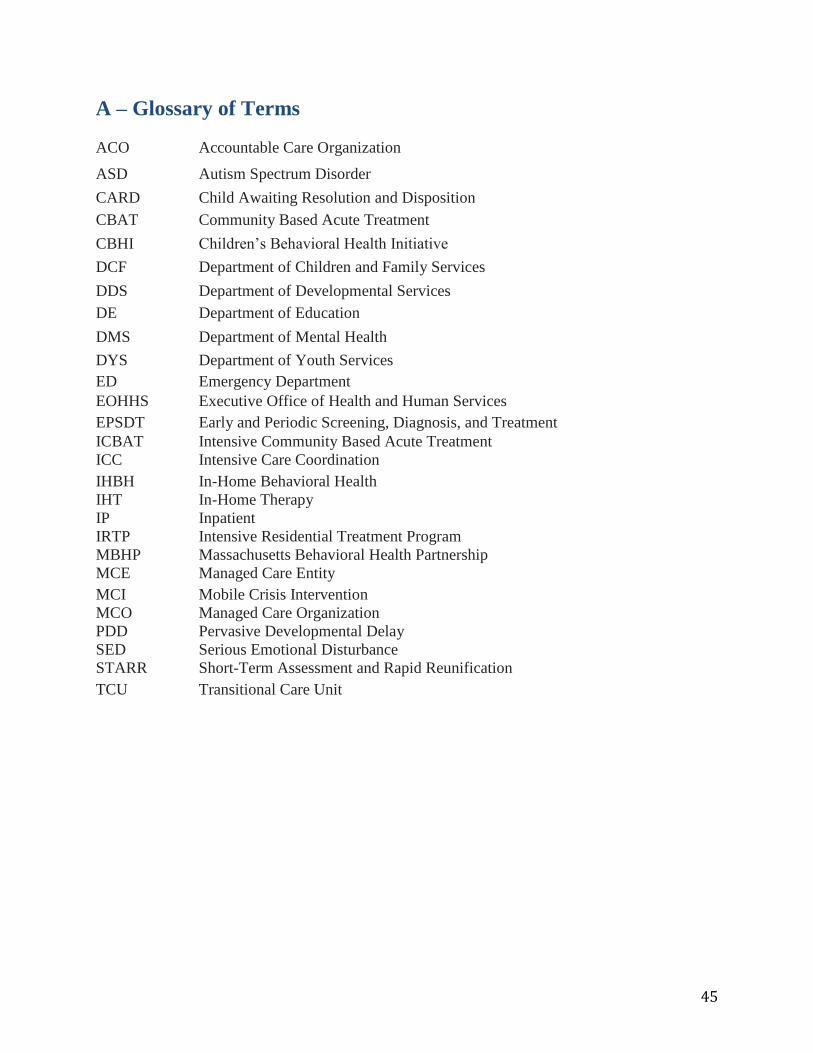
45
A – Glossary of Terms
ACO Accountable Care Organization
ASD Autism Spectrum Disorder
CARD Child Awaiting Resolution and Disposition
CBAT Community Based Acute Treatment
CBHI Children’s Behavioral Health Initiative
DCF Department of Children and Family Services
DDS Department of Developmental Services
DE Department of Education
DMS Department of Mental Health
DYS Department of Youth Services
ED Emergency Department
EOHHS Executive Office of Health and Human Services
EPSDT Early and Periodic Screening, Diagnosis, and Treatment
ICBAT Intensive Community Based Acute Treatment
ICC Intensive Care Coordination
IHBH
IHT
In-Home Behavioral Health
In-Home Therapy
IP Inpatient
IRTP Intensive Residential Treatment Program
MBHP Massachusetts Behavioral Health Partnership
MCE Managed Care Entity
MCI Mobile Crisis Intervention
MCO
PDD
Managed Care Organization
Pervasive Developmental Delay
SED Serious Emotional Disturbance
STARR Short-Term Assessment and Rapid Reunification
TCU Transitional Care Unit
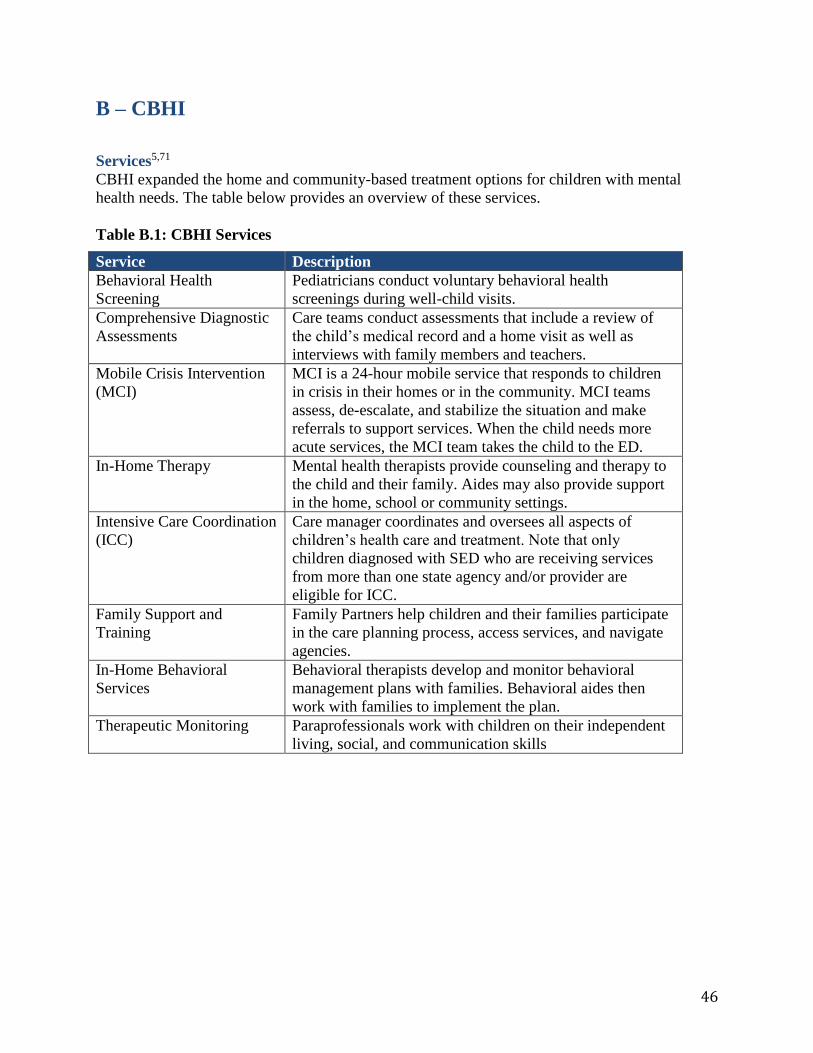
46
B – CBHI
Services5,71
CBHI expanded the home and community-based treatment options for children with mental
health needs. The table below provides an overview of these services.
Table B.1: CBHI Services
Service Description
Behavioral Health
Screening
Pediatricians conduct voluntary behavioral health
screenings during well-child visits.
Comprehensive Diagnostic
Assessments
Care teams conduct assessments that include a review of
the child’s medical record and a home visit as well as
interviews with family members and teachers.
Mobile Crisis Intervention
(MCI)
MCI is a 24-hour mobile service that responds to children
in crisis in their homes or in the community. MCI teams
assess, de-escalate, and stabilize the situation and make
referrals to support services. When the child needs more
acute services, the MCI team takes the child to the ED.
In-Home Therapy Mental health therapists provide counseling and therapy to
the child and their family. Aides may also provide support
in the home, school or community settings.
Intensive Care Coordination
(ICC)
Care manager coordinates and oversees all aspects of
children’s health care and treatment. Note that only
children diagnosed with SED who are receiving services
from more than one state agency and/or provider are
eligible for ICC.
Family Support and
Training
Family Partners help children and their families participate
in the care planning process, access services, and navigate
agencies.
In-Home Behavioral
Services
Behavioral therapists develop and monitor behavioral
management plans with families. Behavioral aides then
work with families to implement the plan.
Therapeutic Monitoring Paraprofessionals work with children on their independent
living, social, and communication skills
47
Eligibility5,71
Children are eligible for CBHI services if they meet each of the following requirements:1
Resident of Massachusetts
Eligible for MassHealth
Under the age of 21
Diagnosed with a serious emotional, behavioral of psychiatric conditions
Determined to need home-based services through a mental health evaluation
Access5,72
To receive a particular CBHI service, the child must meet the medically necessary criteria
for that specific service. Appropriate services for eligible children are identified through several
different channels, including:
Behavioral health screenings: Primary care physicians and nurses must offer voluntary
behavioral health screenings at well-child visits.
Mental health evaluations: Children with known conditions have mental health
evaluations to determine their service needs. This evaluation will include a CANS survey
to identify the child and family’s strengths and needs.
Home-based assessment: Children diagnosed with SED who are receiving services from
more than one state agency and/or provider are entitled to intensive-care coordination.
Their care manager will coordinate a comprehensive home-based assessment to
determine the child and family’s strengths and needs.
48
C – Rosie D. Lawsuit
In a 2006 class action lawsuit, Rosie D. v. Romney, eight plaintiffs (aged 5 to 16) sued the state
of Massachusetts for violating the Early and Periodic Screening, Diagnosis, and Treatment
(EPSDT) provisions of the Medicaid Act. As a result, Massachusetts was directed to comply
with a remedial plan to address these inadequacies, and a court monitor was appointed to ensure
compliance.73
The final remedial plan includes the following key terms, which may restrict the changes that
CBHI can make to address the stuck kids problem.73
Screening: Standardized screening instruments must be used to determine eligibility for
home-based services.
Child and Adolescent Needs (CANS) Tool: The CANS tool must be used for
preliminary assessments.
Qualifications, Training, and Supervision Requirements: Minimum qualifications and
training requirements are outlined for care managers and the Child and Family Team,
which includes home-based service providers. Supervision requirements for these Child
and Family Teams are also specified.
Child and Family Team: Guidelines on who should be included on the team are
included, and minimum requirements for the clinical and administrative functions of the
Child and Family team are outlined.
Eligibility: Eligibility cannot be further restricted. While reimbursement rates and
utilization procedures can be changed or developed, they cannot effectively restrict
eligibility further.
Data and Evaluation: Utilization data must be collected on screening, assessment, and
case management. However, there is no requirement to evaluate child and family
outcomes.
Note that these terms would be difficult to change during the duration of the court monitoring.
The anticipated end date of the court monitoring is not publically available.
49
D – State Agency Partners
Department of Mental Health (DMH)74
The Department of Mental Health is the State Mental Health Authority. It operates two state
hospitals and three public inpatient hospital units. It also offers an Intensive Residential
Treatment Program (IRTP) for adolescents and Clinically Intensive Residential Treatment
(CIRT) for children. DMH contracts and pays for long-term residential and group home
placements in the community. Most DMH services are delivered in the community through
partnering providers. The agency also performs targeted case management through Medicaid
funding. DMH licenses all psychiatric inpatient hospital units in the Commonwealth.
Children and adolescents up to 18 years are eligible for DMH services through diagnosis with an
Axis I psychiatric condition that does not include developmental delay. Youth must also meet
certain criteria for lack of functioning in their environment. Child focused services are centered
on serious emotional disturbance while adult services are focused on those with chronic, serious
mental health needs.
The current commissioner of DMH is Marcia Fowler who has been in her role since 2012. The
agency is divided into 5 geographic regions, each managed by a Regional Director. At the state
level, the Central Office coordinates all regional activities and has a Division of Child and
Adolescent Services, led by a deputy commissioner.
Department of Children and Families (DCF)75
The Department of Children and Families is the child welfare agency charged with protecting
children from abuse and neglect. DCF services are not granted through eligibility, but rather
report of abuse/neglect through 51A filing or voluntarily seeking assistance by a CRA (Child
Requiring Assistance) petition. All children who receive DCF services are eligible for
MassHealth and are all assigned to the PCC plan with MBHP mental health services.
DCF operates the foster care system in the Commonwealth, including therapeutic or intensive
foster care placements. In the mental health system, it operates Transitional Care Units (TCUs)
and Stabilization, Assessment, and Rapid Reunification (STARR) programs for children who no
longer meet acute hospital level of care but cannot be readily discharged to home or foster care.
Historically, the agency has been the primary contractor for residential services.
The agency is organized into 4 regional offices with several area offices within each region.
There is one mental health clinician per regional office. These individuals report to a state mental
health coordinator. These clinicians are separate from the hierarchy of case workers to regional
directors and state officers. The interim-commissioner of DCF is Erin Deveney, appointed after
Olga Roche resigned in April 2014. Recently, Linda Spears, currently head of the Child Welfare
League of America, was appointed as the next DCF Commissioner under Governor Baker.
50
Department of Youth Services (DYS)76
The Department of Youth Services oversees the juvenile justice system in the Commonwealth.
Youth become committed to DYS by a criminal court judge. DYS operates overnight arrest
units, detention centers, and residential programs throughout the state. The agency is divided into
5 regional units across the state, each with its own supervision. Mental health issues are overseen
at the state office level by an assistant commissioner. The current Commissioner is Peter Forbes
who has been in office since 2013.
Department of Developmental Services (DDS)77
The Department of Developmental Services is the state agency charged with overseeing
coordinated services for children and adults with intellectual disabilities. This includes those
youth diagnosed with Pervasive Developmental Delay (PDD) and as of this year, the agency will
serve youth with Autism Spectrum Disorder (ASD). Eligibility requirements for services include
formal intelligence and developmental testing with an established medical diagnosis. The agency
is comprised of 4 regional offices and smaller area offices overseen by the state Central Office.
The current DDS commissioner is Elin Howe.
Department of Education (DOE)
The State Department of Education is a key stakeholder through its involvement with special
education, therapeutic schools, and residential schools that frequently serve children and
adolescents with severe behavioral needs. Under Chapter 766 the each local school system is
required to fund education for any special needs child in that community.78 This includes school
portions of long-term residential treatment settings.
51
E – Insurance Partners
Families with children enrolled in MassHealth choose a managed care plan to provide their
insurance coverage. Managed care plans must ensure that their network includes access to a set
of mandated services, including mental and behavioral health services. While some managed
care plans provide these services directly, others plans subcontract for behavioral health services.
These subcontracted plans for behavioral health services are called “behavioral health carve-
outs.”
There are two general types of managed care plans, and behavioral health insurance coverage
can vary based on the type of plan.79
Primary Care Clinician (PCC) Plans: Members in PCC plans receive behavioral health
insurance through a behavioral health carve-out. Massachusetts Behavioral Health
Partnership (MBHP) currently has the contract for these services.
Manage Care Organization (MCO) Plans: There are five MCO plans in
Massachusetts. Each MCO plan either insures behavioral health services directly or uses
a behavioral health carve-out. All MCO plans using a behavioral health carve-out
contract with either MBHP or Beacon Health Strategies.4
MBHP is the primary payer for mental health services in the Commonwealth. MBHP operates 5
regional offices around Massachusetts. Currently, Carol Kress, LICSW is interim CEO and Jim
Thatcher, MD is the Chief Medical Officer.80 Beacon Health Strategies recently acquired
ValueOptions, the parent company of MBHP, and formed Beacon Health Options.81 However,
MBHP currently operates as a distinct MCE from the perspective of state agencies and
providers.4
52
F – Prior Interventions on Stuck Kids
Research Studies
Previous research on youth who are unable to move to their next location of care have focused
on Emergency Department (ED) boarding. To our knowledge, no studies have specifically
focused on youth stuck on acute psychiatric units.
Nationally, literature on ED boarding has focused on adults. The Office of the Assistant
Secretary for Planning and Evaluation (ASPE) in the U. S. Department of Health and Human
Services published a national literature review and interview study on psychiatric boarding in
2008.82,83 However, studies of adults and of states with high rates of uninsurance may not be
generalizable to youth in Massachusetts due to differences in resource availability. Pediatric
studies have largely focused on the length of stay for psychiatric patients and implications for
emergency department management.84,85
Research teams in the Emergency Departments at Boston Children’s Hospital and Boston
Medical Center published several observational studies detailing youth boarding in EDs and
pediatric medical floors.86–88 These studies are summarized in Table F.1.
These studies are the most relevant literature on the issue of stuck youth in Massachusetts.
However, it is important to note that all were conducted before CBHI was implemented, which
we believe has changed the dynamics governing which youth are likely to be stuck versus which
may be treated in the community. Additional research is needed to understand the full extent of
these problems in the current behavioral health system.
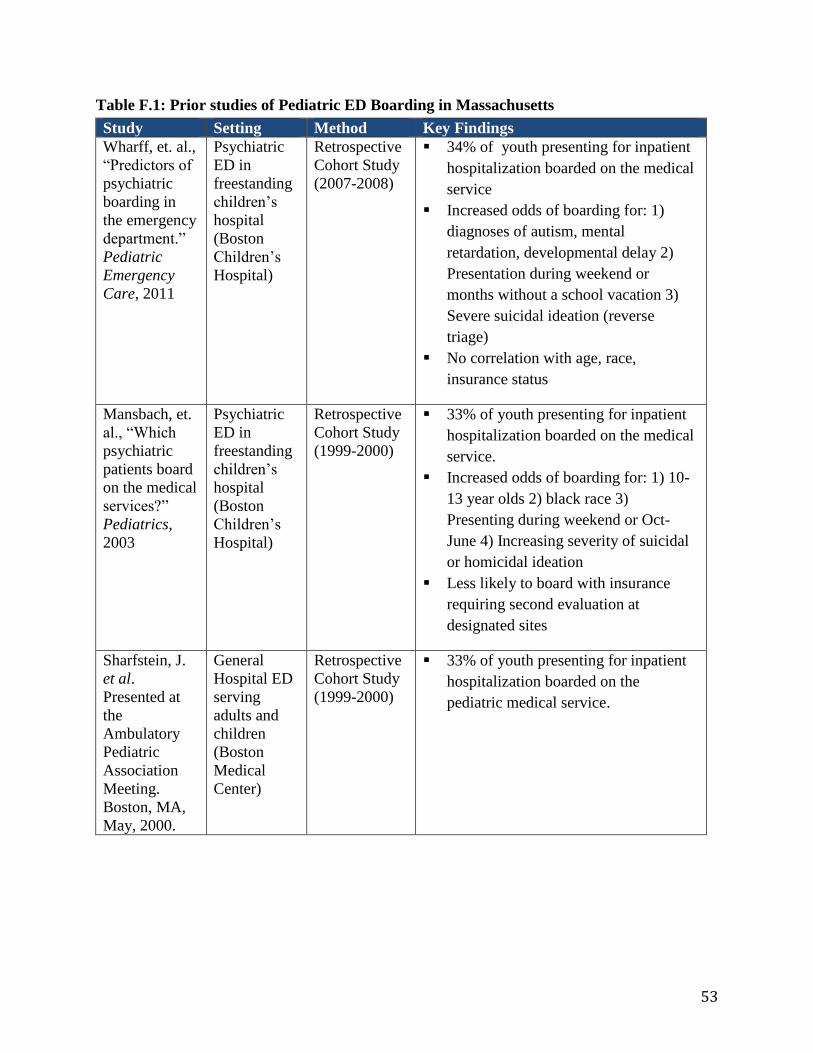
53
Table F.1: Prior studies of Pediatric ED Boarding in Massachusetts
Study Setting Method Key Findings
Wharff, et. al.,
“Predictors of
psychiatric
boarding in
the emergency
department.”
Pediatric
Emergency
Care, 2011
Psychiatric
ED in
freestanding
children’s
hospital
(Boston
Children’s
Hospital)
Retrospective
Cohort Study
(2007-2008)
34% of youth presenting for inpatient
hospitalization boarded on the medical
service
Increased odds of boarding for: 1)
diagnoses of autism, mental
retardation, developmental delay 2)
Presentation during weekend or
months without a school vacation 3)
Severe suicidal ideation (reverse
triage)
No correlation with age, race,
insurance status
Mansbach, et.
al., “Which
psychiatric
patients board
on the medical
services?”
Pediatrics,
2003
Psychiatric
ED in
freestanding
children’s
hospital
(Boston
Children’s
Hospital)
Retrospective
Cohort Study
(1999-2000)
33% of youth presenting for inpatient
hospitalization boarded on the medical
service.
Increased odds of boarding for: 1) 10-
13 year olds 2) black race 3)
Presenting during weekend or Oct-
June 4) Increasing severity of suicidal
or homicidal ideation
Less likely to board with insurance
requiring second evaluation at
designated sites
Sharfstein, J.
et al.
Presented at
the
Ambulatory
Pediatric
Association
Meeting.
Boston, MA,
May, 2000.
General
Hospital ED
serving
adults and
children
(Boston
Medical
Center)
Retrospective
Cohort Study
(1999-2000)
33% of youth presenting for inpatient
hospitalization boarded on the
pediatric medical service.
54
Interventions to Reduce Stuck Kids
Interagency CARD Meeting and CARD List33,89
Representatives from youth-serving state agencies meet monthly to discuss the status of the
Child Awaiting Resolution of Disposition (CARD) list and discuss initiatives to address the
stuck kids problem in Massachusetts. Recent initiatives from this working group include:
Protocols for effectively using MCI and for discharging from inpatient units
Improving collaboration between MCI and Residential facilities
Improve collaboration between schools and behavioral health providers
Coordinating with Division of Insurance (DOI) on commercially insured stuck youth
The Director of CBHI moderates the meeting and invites agencies including DCF, DMH, DYS,
DDS, Department of Education, MBHP, and other MassHealth MCEs. The individual agency
chooses whether to attend and which representative to send. Not all agencies choose to
participate and the level of seniority or authority of their delegates varies. The meeting serves as
a forum for communication between agencies and a check-in on actionable projects addressing
stuck kids.
The Executive Office of Health and Human Services tracks the number of MassHealth clients
who remained in hospital units beyond when it was considered medically necessary. Many
believe that accounting for these youth was a catalyst for efforts to decrease the number stuck. A
detailed description of the CARD Report is available in Appendix G.
Massachusetts Behavioral Health Partnership (MBHP) Bed and Boarding List90
MBHP hosts an electronic portal that shows the number of available beds at each inpatient and
CBAT in the state and lists MBHP clients who are seeking a bed. The acute bed availability is
required to be updated by providers at least twice daily and may be used by Mobile Crisis
Intervention (MCI) teams or Emergency Departments (EDs) to find placements. No similar
system exists for commercially insured patients.
Caring Together91
Caring Together is a joint initiative of DCF and DMH to increase collaboration among the
agencies and streamline resource allocation for shared clientele. It launched approximately 9
months ago.
Key components of the initiative include joint procurement of residential services, continuum of
outpatient care, and emphasis on family involvement. Historically, DCF and DMH separately
contracted with residential providers for beds, but new uniform requirements enable joint
contracting for residential services.
There are also several in-home services offered similar to what would be experienced in a
residential setting in order to better prepare families to transition a child to home. This initiative
includes trips home with the residential staff to make a smoother transition.
55
Massachusetts Child Psychiatry Action Project (MCPAP)92,93
MCPAP is an intervention to increase access to child psychiatry services by providing telephone
consultations to primary care pediatricians. It is administered through MBHP and funded by
DMH. A regional mental health team consisting of child psychiatrists, clinical social workers,
psychologists, and care coordinators are available for telephone consult during business hours on
weekdays. The goal is to increase the comfort of pediatricians in treating children and
adolescents with basic mental health conditions and to better integrate behavioral health into
primary care. It is hoped that it will alleviate shortages in outpatient psychiatry services by
increasing the capacity in primary care and leading to more efficient referrals to mental health
for only the more severe patients.
Care plans and protocols33,94
Over the last 10 years, both the DYS and DMH have developed step-by-step protocols and flow
charts to help hospital providers negotiate a situation in which a youth may become stuck. These
protocols include care plans for DYS youth with a variety of conditions, for example how to
approach care of a suicidal youth within the juvenile justice system. The DMH protocols are
specifically targeted toward discharge planning and helping providers work through multiple
contingency plans for disposition.
Higher initial rate for “intensive adolescents”33
Both MBHP and DMH have investigated the use of higher up-front payments for aggressive or
acute adolescents who are at high risk of becoming stuck in emergency departments. The goal of
these payments is offset additional costs that may be incurred from patients requiring single
rooms or increased staffing. There have also been bonuses for accepting patients within the first
few hours after they have approval for acute care.
56
G – Data Sources
We compiled data from three primary sources for our analysis.
Acute Psychiatric Units – CARD Reports
Crisis – MCI Key Indicators Report
Community – Children’s Mental Health Reports
Acute Psychiatric Units – CARD Reports89,90
The CARD Reports provide insight into the stuck kids problem in both inpatient units and
CBATs for youth with MassHealth and MBHP. In the CARD Report, a child or adolescent is
considered stuck when they no longer meet level of care in their current placement and they have
not yet been discharged. The days that a child or adolescent is stuck are considered
administratively necessary days for reimbursement.
The CARD Report is distributed weekly to key state agency stakeholders. Stakeholders have the
opportunity to submit any corrections to the weekly report, and then a final report is published at
the end of the month. For our analysis, MBHP provided monthly CARD Reports from
September, 2011 through August, 2014. It is important to note that the CARD Report does not
typically include youth not affiliated with state agencies (NASA youth). However, MBHP was
able to include NASA youth in the data they provided to us.
In addition, the data that MBHP provided included unique identifiers for each child or adolescent
on the CARD Report. It is important to note that these unique identifiers are de-identified. In
other words, they cannot be traced back to individual children or adolescents in any way. These
unique identifiers allowed us to analyze trends in which youth become stuck repeatedly over the
three year period.
While this data is valuable, it is also important to note its limitations. The following children and
adolescents are not included in CARD Report Data.
Children and youth with commercial insurance
Children and youth with a MassHealth MCO that does not contract for MBHP for a
behavioral health carve-out.
Crisis – MCI Key Indicators Report95
MBHP developed a report in early 2015 on key MCI indicators, which includes MCI data from
July 2009 through December 2014. The MCI data in the report includes trends in key indicators,
including:
MCI call volumes
Percent of encounters in community locations
Percent of calls resulting in acute psychiatric unit referrals
57
We analyzed trends in this data to inform our evaluation of both MCIs and EDs. We only present
data from 2011 through 2014 so that the timeline is comparable to the CARD Report data.
While this data is valuable, it is also important to note its limitations. First, we do not have
unique identifiers for children in this data. Second, we do not have data on the number of
children boarding in EDs or at home.
Community – Children’s Mental Health Reports96
Mental Health Reports are available on the CBHI web site by month. These reports include
provide an overview of the utilization of community-based programs, including TCUs and
residential placements. Residential placements include intensive foster care, group homes, and
residential schools. We analyzed trends in 2014 Mental Health Report data to inform our
evaluation of community based programs.
While this data is valuable, it is also important to note its limitations. First, we do not have
unique identifiers for children in this data. Second, we do not have data on the number of
children that could be considered stuck in any of these programs.
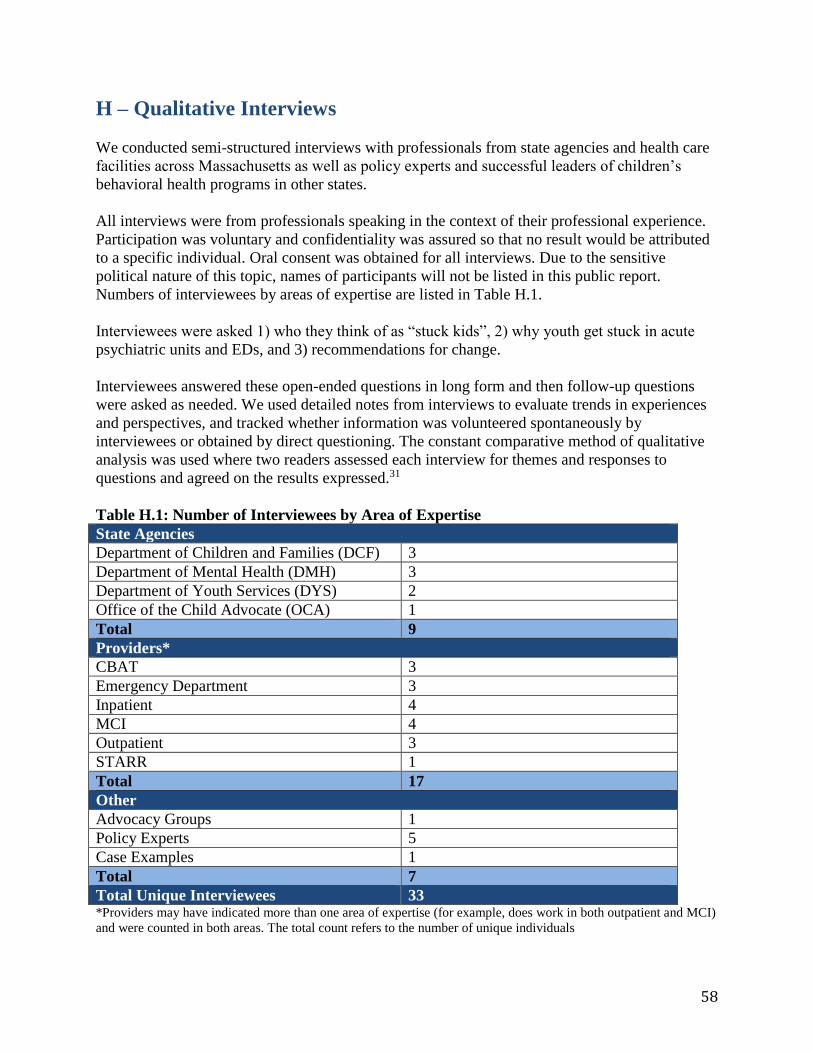
58
H – Qualitative Interviews
We conducted semi-structured interviews with professionals from state agencies and health care
facilities across Massachusetts as well as policy experts and successful leaders of children’s
behavioral health programs in other states.
All interviews were from professionals speaking in the context of their professional experience.
Participation was voluntary and confidentiality was assured so that no result would be attributed
to a specific individual. Oral consent was obtained for all interviews. Due to the sensitive
political nature of this topic, names of participants will not be listed in this public report.
Numbers of interviewees by areas of expertise are listed in Table H.1.
Interviewees were asked 1) who they think of as “stuck kids”, 2) why youth get stuck in acute
psychiatric units and EDs, and 3) recommendations for change.
Interviewees answered these open-ended questions in long form and then follow-up questions
were asked as needed. We used detailed notes from interviews to evaluate trends in experiences
and perspectives, and tracked whether information was volunteered spontaneously by
interviewees or obtained by direct questioning. The constant comparative method of qualitative
analysis was used where two readers assessed each interview for themes and responses to
questions and agreed on the results expressed.31
Table H.1: Number of Interviewees by Area of Expertise
State Agencies
Department of Children and Families (DCF) 3
Department of Mental Health (DMH) 3
Department of Youth Services (DYS) 2
Office of the Child Advocate (OCA) 1
Total 9
Providers*
CBAT 3
Emergency Department 3
Inpatient 4
MCI 4
Outpatient 3
STARR 1
Total 17
Other
Advocacy Groups 1
Policy Experts 5
Case Examples 1
Total 7
Total Unique Interviewees 33 *Providers may have indicated more than one area of expertise (for example, does work in both outpatient and MCI)
and were counted in both areas. The total count refers to the number of unique individuals
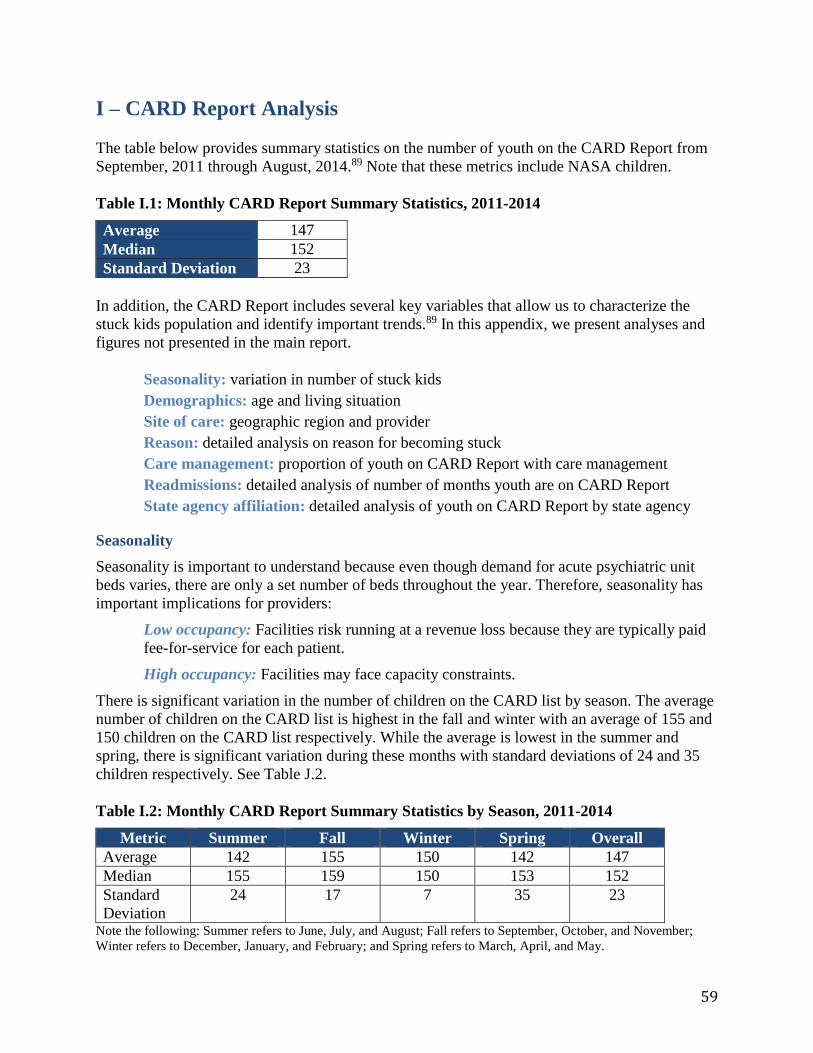
59
I – CARD Report Analysis The table below provides summary statistics on the number of youth on the CARD Report from
September, 2011 through August, 2014.89 Note that these metrics include NASA children.
Table I.1: Monthly CARD Report Summary Statistics, 2011-2014
Average 147
Median 152
Standard Deviation 23
In addition, the CARD Report includes several key variables that allow us to characterize the
stuck kids population and identify important trends.89 In this appendix, we present analyses and
figures not presented in the main report.
Seasonality: variation in number of stuck kids
Demographics: age and living situation
Site of care: geographic region and provider
Reason: detailed analysis on reason for becoming stuck
Care management: proportion of youth on CARD Report with care management
Readmissions: detailed analysis of number of months youth are on CARD Report
State agency affiliation: detailed analysis of youth on CARD Report by state agency
Seasonality
Seasonality is important to understand because even though demand for acute psychiatric unit
beds varies, there are only a set number of beds throughout the year. Therefore, seasonality has
important implications for providers:
Low occupancy: Facilities risk running at a revenue loss because they are typically paid
fee-for-service for each patient.
High occupancy: Facilities may face capacity constraints.
There is significant variation in the number of children on the CARD list by season. The average
number of children on the CARD list is highest in the fall and winter with an average of 155 and
150 children on the CARD list respectively. While the average is lowest in the summer and
spring, there is significant variation during these months with standard deviations of 24 and 35
children respectively. See Table J.2.
Table I.2: Monthly CARD Report Summary Statistics by Season, 2011-2014
Metric Summer Fall Winter Spring Overall
Average 142 155 150 142 147
Median 155 159 150 153 152
Standard
Deviation
24 17 7 35 23
Note the following: Summer refers to June, July, and August; Fall refers to September, October, and November;
Winter refers to December, January, and February; and Spring refers to March, April, and May.
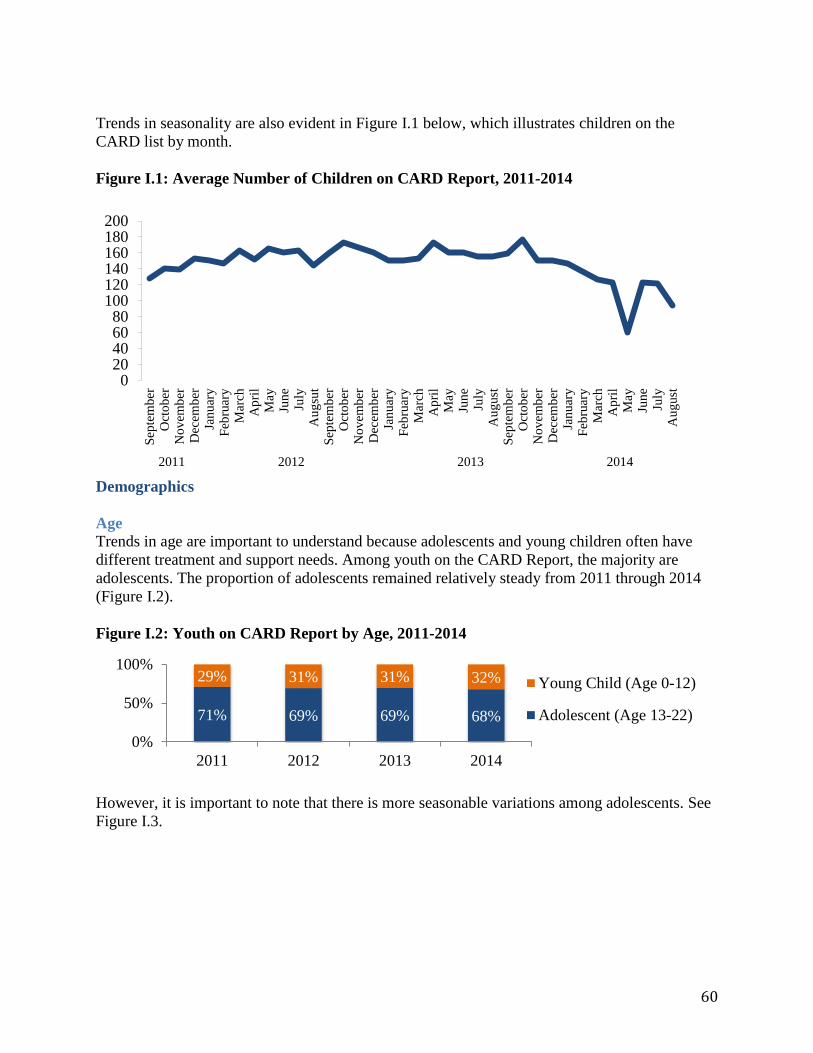
60
Trends in seasonality are also evident in Figure I.1 below, which illustrates children on the
CARD list by month.
Figure I.1: Average Number of Children on CARD Report, 2011-2014
Demographics
Age
Trends in age are important to understand because adolescents and young children often have
different treatment and support needs. Among youth on the CARD Report, the majority are
adolescents. The proportion of adolescents remained relatively steady from 2011 through 2014
(Figure I.2).
Figure I.2: Youth on CARD Report by Age, 2011-2014
However, it is important to note that there is more seasonable variations among adolescents. See
Figure I.3.
020406080
100120140160180200
Sep
tem
ber
Oct
ob
erN
ov
emb
erD
ecem
ber
Jan
uar
yF
ebru
ary
Mar
chA
pri
lM
ayJu
ne
July
Au
gsu
tS
epte
mb
erO
cto
ber
No
vem
ber
Dec
emb
erJa
nu
ary
Feb
ruar
yM
arch
Ap
ril
May
Jun
eJu
lyA
ug
ust
Sep
tem
ber
Oct
ob
erN
ov
emb
erD
ecem
ber
Jan
uar
yF
ebru
ary
Mar
chA
pri
lM
ayJu
ne
July
Au
gust
2011 2012 2013 2014
71% 69% 69% 68%
29% 31% 31% 32%
0%
50%
100%
2011 2012 2013 2014
Young Child (Age 0-12)
Adolescent (Age 13-22)
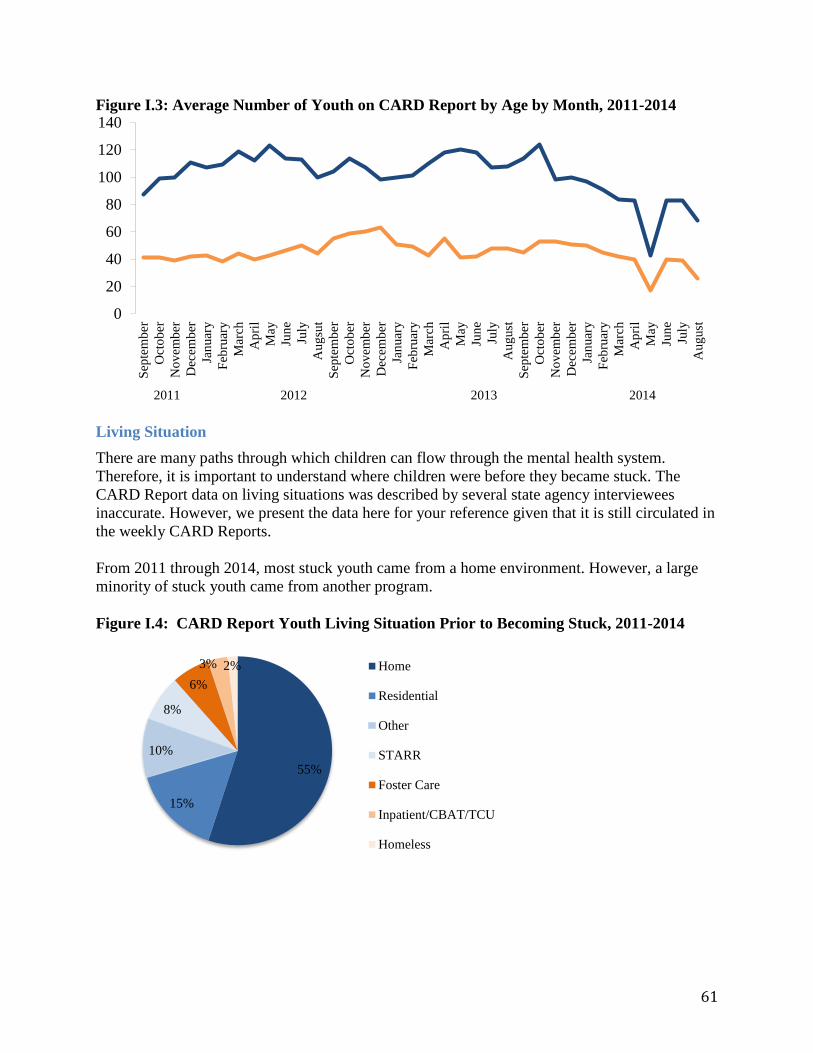
61
Figure I.3: Average Number of Youth on CARD Report by Age by Month, 2011-2014
Living Situation
There are many paths through which children can flow through the mental health system.
Therefore, it is important to understand where children were before they became stuck. The
CARD Report data on living situations was described by several state agency interviewees
inaccurate. However, we present the data here for your reference given that it is still circulated in
the weekly CARD Reports.
From 2011 through 2014, most stuck youth came from a home environment. However, a large
minority of stuck youth came from another program.
Figure I.4: CARD Report Youth Living Situation Prior to Becoming Stuck, 2011-2014
0
20
40
60
80
100
120
140
Sep
tem
ber
Oct
ob
er
No
vem
ber
Dec
emb
er
Jan
uar
y
Feb
ruar
y
Mar
ch
Ap
ril
May
Jun
e
July
Au
gsu
t
Sep
tem
ber
Oct
ob
er
No
vem
ber
Dec
emb
er
Jan
uar
y
Feb
ruar
y
Mar
ch
Ap
ril
May
Jun
e
July
Au
gust
Sep
tem
ber
Oct
ob
er
No
vem
ber
Dec
emb
er
Jan
uar
y
Feb
ruar
y
Mar
ch
Ap
ril
May
Jun
e
July
Au
gust
2011 2012 2013 2014
55%
15%
10%
8%
6%
3% 2% Home
Residential
Other
STARR
Foster Care
Inpatient/CBAT/TCU
Homeless
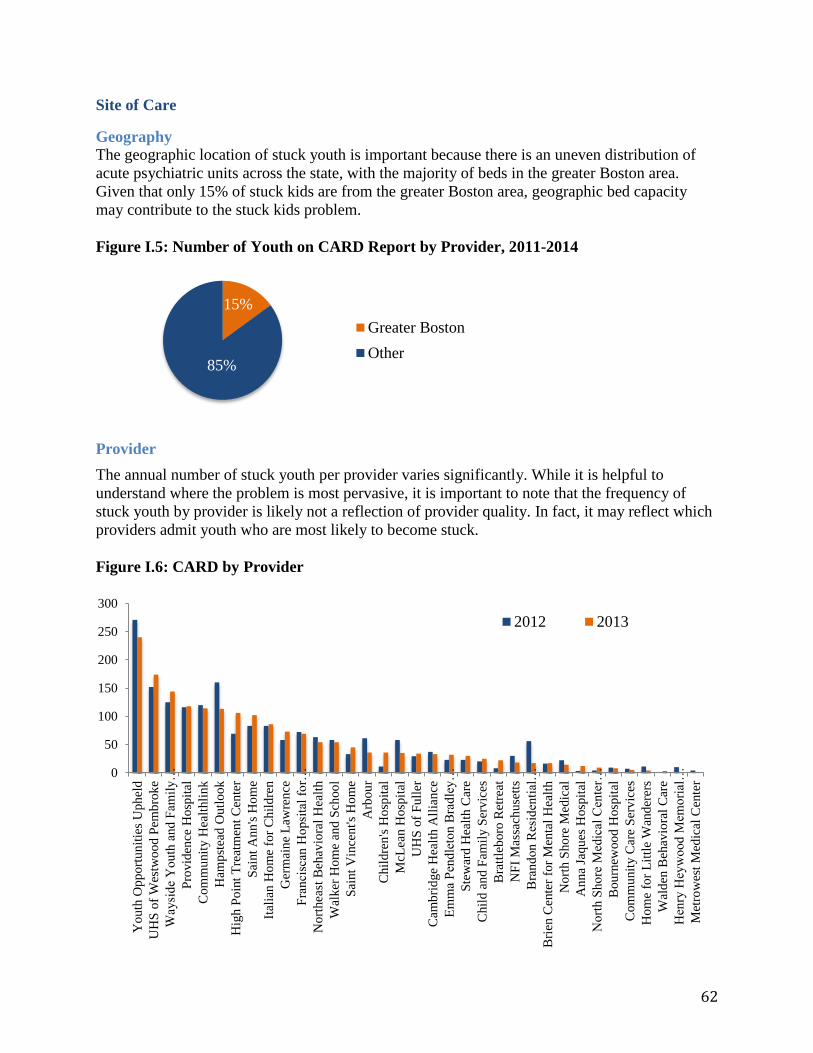
62
Site of Care
Geography
The geographic location of stuck youth is important because there is an uneven distribution of
acute psychiatric units across the state, with the majority of beds in the greater Boston area.
Given that only 15% of stuck kids are from the greater Boston area, geographic bed capacity
may contribute to the stuck kids problem.
Figure I.5: Number of Youth on CARD Report by Provider, 2011-2014
Provider
The annual number of stuck youth per provider varies significantly. While it is helpful to
understand where the problem is most pervasive, it is important to note that the frequency of
stuck youth by provider is likely not a reflection of provider quality. In fact, it may reflect which
providers admit youth who are most likely to become stuck.
Figure I.6: CARD by Provider
15%
85%
Greater Boston
Other
0
50
100
150
200
250
300
Yo
uth
Op
port
un
itie
s U
ph
eld
UH
S o
f W
estw
oo
d P
emb
rok
e
Way
sid
e Y
ou
th a
nd
Fam
ily
…
Pro
vid
ence
Ho
spit
al
Com
mu
nit
y H
ealt
hli
nk
Ham
pst
ead
Ou
tlo
ok
Hig
h P
oin
t T
reat
men
t C
ente
r
Sai
nt
An
n's
Ho
me
Ital
ian
Ho
me
for
Ch
ild
ren
Ger
mai
ne
Law
ren
ce
Fra
nci
scan
Ho
psi
tal
for…
No
rthea
st B
ehav
iora
l H
ealt
h
Wal
ker
Ho
me
and
Sch
oo
l
Sai
nt
Vin
cen
t's
Ho
me
Arb
ou
r
Chil
dre
n's
Ho
spit
al
McL
ean
Hosp
ital
UH
S o
f F
ull
er
Cam
bri
dge
Hea
lth A
llia
nce
Em
ma
Pen
dle
ton
Bra
dle
y…
Ste
war
d H
ealt
h C
are
Chil
d a
nd F
amil
y S
erv
ices
Bra
ttle
boro
Ret
reat
NF
I M
assa
chuse
tts
Bra
nd
on
Res
iden
tial
…
Bri
en C
ente
r fo
r M
enta
l H
ealt
h
No
rth S
ho
re M
edic
al
An
na
Jaqu
es H
osp
ital
No
rth S
ho
re M
edic
al C
ente
r…
Bou
rnew
oo
d H
osp
ital
Com
mu
nit
y C
are
Ser
vic
es
Ho
me
for
Lit
tle
Wan
der
ers
Wal
den
Beh
avio
ral
Car
e
Hen
ry H
eyw
ood
Mem
ori
al…
Met
row
est
Med
ical
Cen
ter
2012 2013
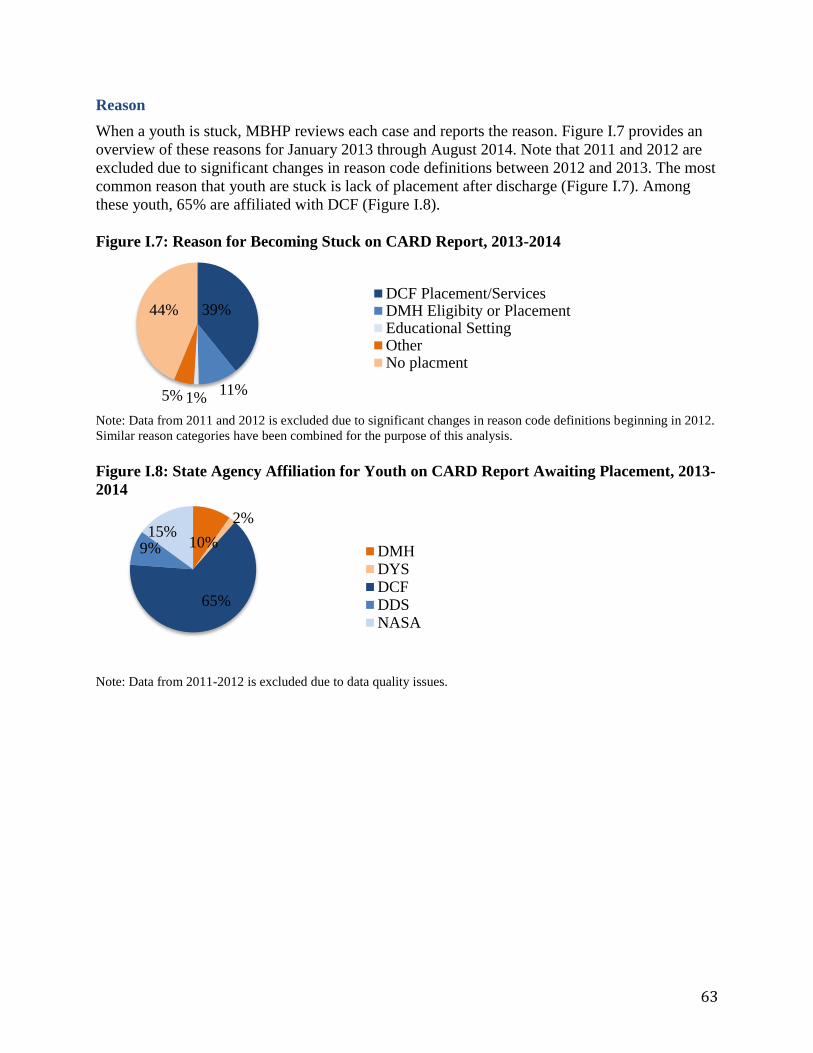
63
Reason
When a youth is stuck, MBHP reviews each case and reports the reason. Figure I.7 provides an
overview of these reasons for January 2013 through August 2014. Note that 2011 and 2012 are
excluded due to significant changes in reason code definitions between 2012 and 2013. The most
common reason that youth are stuck is lack of placement after discharge (Figure I.7). Among
these youth, 65% are affiliated with DCF (Figure I.8).
Figure I.7: Reason for Becoming Stuck on CARD Report, 2013-2014
Note: Data from 2011 and 2012 is excluded due to significant changes in reason code definitions beginning in 2012.
Similar reason categories have been combined for the purpose of this analysis.
Figure I.8: State Agency Affiliation for Youth on CARD Report Awaiting Placement, 2013-
2014
Note: Data from 2011-2012 is excluded due to data quality issues.
39%
11%1%5%
44%DCF Placement/ServicesDMH Eligibity or PlacementEducational SettingOtherNo placment
10%
2%
65%
9%15%
DMHDYSDCFDDSNASA
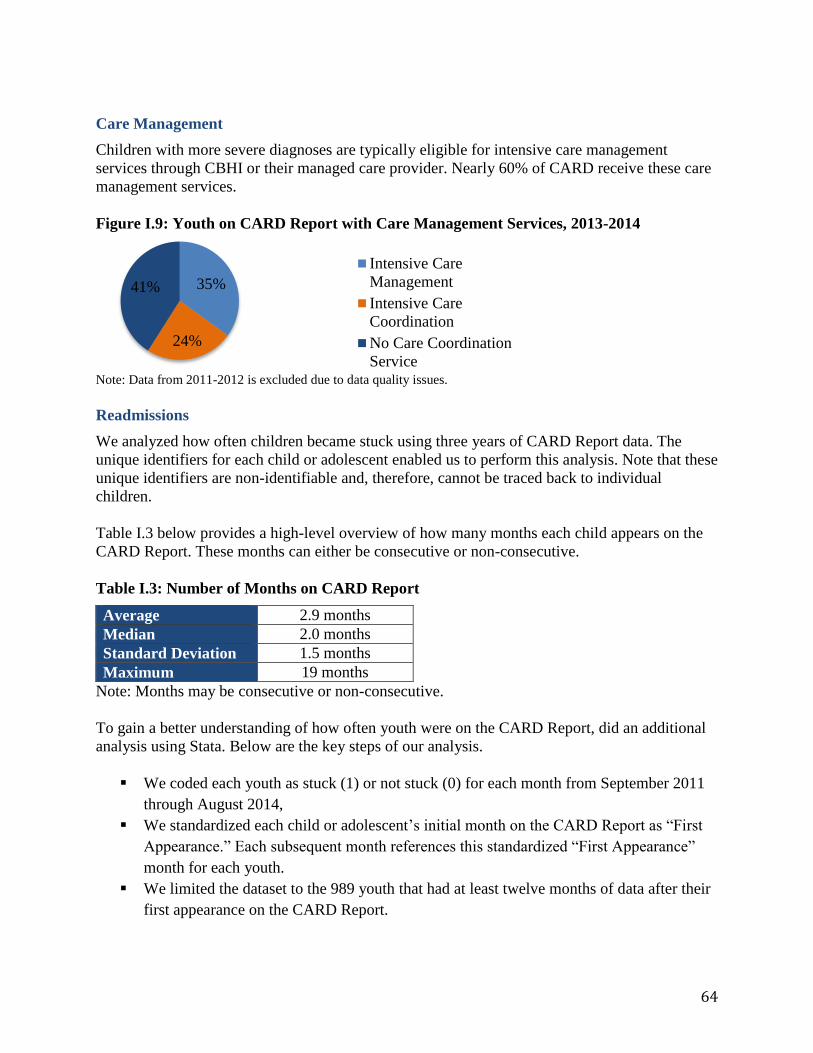
64
Care Management
Children with more severe diagnoses are typically eligible for intensive care management
services through CBHI or their managed care provider. Nearly 60% of CARD receive these care
management services.
Figure I.9: Youth on CARD Report with Care Management Services, 2013-2014
Note: Data from 2011-2012 is excluded due to data quality issues.
Readmissions
We analyzed how often children became stuck using three years of CARD Report data. The
unique identifiers for each child or adolescent enabled us to perform this analysis. Note that these
unique identifiers are non-identifiable and, therefore, cannot be traced back to individual
children.
Table I.3 below provides a high-level overview of how many months each child appears on the
CARD Report. These months can either be consecutive or non-consecutive.
Table I.3: Number of Months on CARD Report
Average 2.9 months
Median 2.0 months
Standard Deviation 1.5 months
Maximum 19 months
Note: Months may be consecutive or non-consecutive.
To gain a better understanding of how often youth were on the CARD Report, did an additional
analysis using Stata. Below are the key steps of our analysis.
We coded each youth as stuck (1) or not stuck (0) for each month from September 2011
through August 2014,
We standardized each child or adolescent’s initial month on the CARD Report as “First
Appearance.” Each subsequent month references this standardized “First Appearance”
month for each youth.
We limited the dataset to the 989 youth that had at least twelve months of data after their
first appearance on the CARD Report.
35%
24%
41%
Intensive Care
Management
Intensive Care
Coordination
No Care Coordination
Service
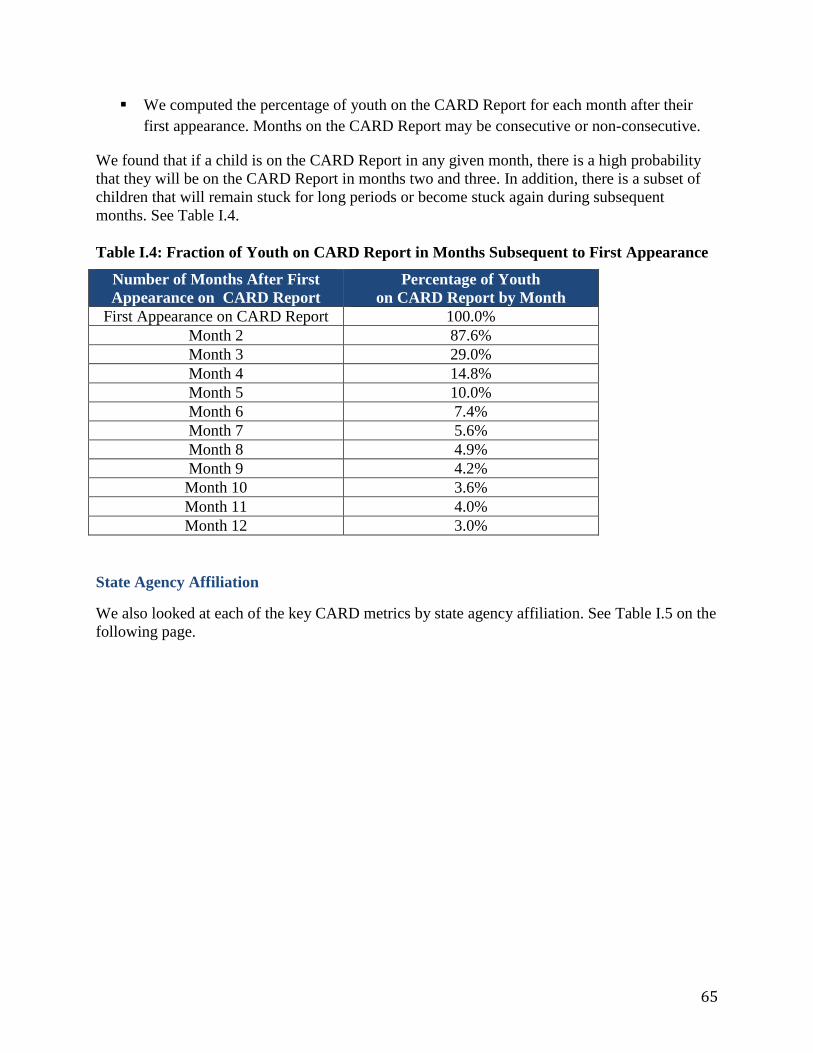
65
We computed the percentage of youth on the CARD Report for each month after their
first appearance. Months on the CARD Report may be consecutive or non-consecutive.
We found that if a child is on the CARD Report in any given month, there is a high probability
that they will be on the CARD Report in months two and three. In addition, there is a subset of
children that will remain stuck for long periods or become stuck again during subsequent
months. See Table I.4.
Table I.4: Fraction of Youth on CARD Report in Months Subsequent to First Appearance
Number of Months After First
Appearance on CARD Report
Percentage of Youth
on CARD Report by Month
First Appearance on CARD Report 100.0%
Month 2 87.6%
Month 3 29.0%
Month 4 14.8%
Month 5 10.0%
Month 6 7.4%
Month 7 5.6%
Month 8 4.9%
Month 9 4.2%
Month 10 3.6%
Month 11 4.0%
Month 12 3.0%
State Agency Affiliation
We also looked at each of the key CARD metrics by state agency affiliation. See Table I.5 on the
following page.
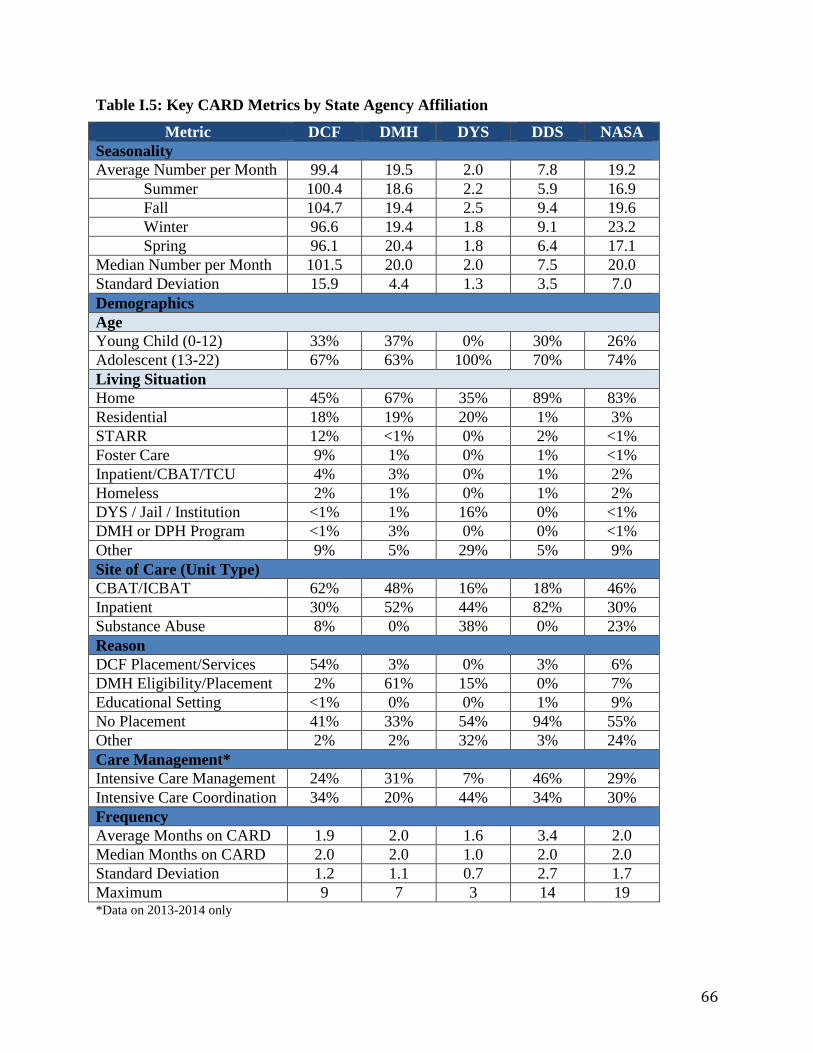
66
Table I.5: Key CARD Metrics by State Agency Affiliation
Metric DCF DMH DYS DDS NASA
Seasonality
Average Number per Month 99.4 19.5 2.0 7.8 19.2
Summer 100.4 18.6 2.2 5.9 16.9
Fall 104.7 19.4 2.5 9.4 19.6
Winter 96.6 19.4 1.8 9.1 23.2
Spring 96.1 20.4 1.8 6.4 17.1
Median Number per Month 101.5 20.0 2.0 7.5 20.0
Standard Deviation 15.9 4.4 1.3 3.5 7.0
Demographics
Age
Young Child (0-12) 33% 37% 0% 30% 26%
Adolescent (13-22) 67% 63% 100% 70% 74%
Living Situation
Home 45% 67% 35% 89% 83%
Residential 18% 19% 20% 1% 3%
STARR 12% <1% 0% 2% <1%
Foster Care 9% 1% 0% 1% <1%
Inpatient/CBAT/TCU 4% 3% 0% 1% 2%
Homeless 2% 1% 0% 1% 2%
DYS / Jail / Institution <1% 1% 16% 0% <1%
DMH or DPH Program <1% 3% 0% 0% <1%
Other 9% 5% 29% 5% 9%
Site of Care (Unit Type)
CBAT/ICBAT 62% 48% 16% 18% 46%
Inpatient 30% 52% 44% 82% 30%
Substance Abuse 8% 0% 38% 0% 23%
Reason
DCF Placement/Services 54% 3% 0% 3% 6%
DMH Eligibility/Placement 2% 61% 15% 0% 7%
Educational Setting <1% 0% 0% 1% 9%
No Placement 41% 33% 54% 94% 55%
Other 2% 2% 32% 3% 24%
Care Management*
Intensive Care Management 24% 31% 7% 46% 29%
Intensive Care Coordination 34% 20% 44% 34% 30%
Frequency
Average Months on CARD 1.9 2.0 1.6 3.4 2.0
Median Months on CARD 2.0 2.0 1.0 2.0 2.0
Standard Deviation 1.2 1.1 0.7 2.7 1.7
Maximum 9 7 3 14 19 *Data on 2013-2014 only
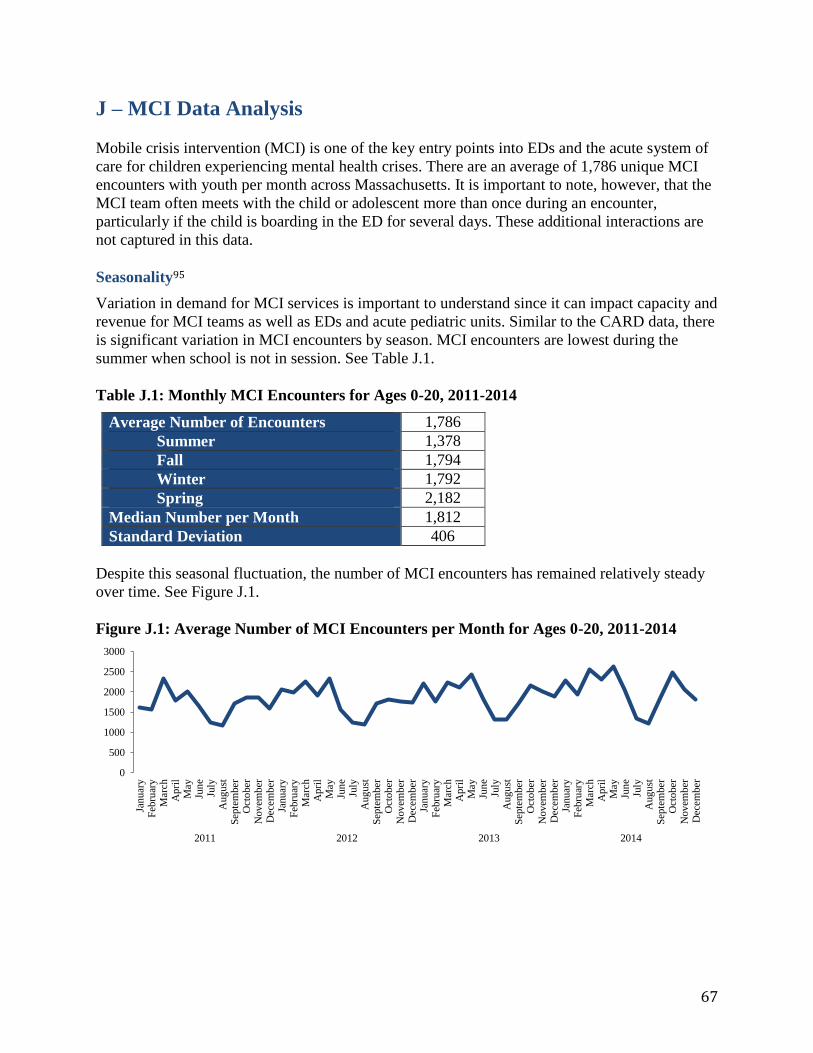
67
J – MCI Data Analysis Mobile crisis intervention (MCI) is one of the key entry points into EDs and the acute system of
care for children experiencing mental health crises. There are an average of 1,786 unique MCI
encounters with youth per month across Massachusetts. It is important to note, however, that the
MCI team often meets with the child or adolescent more than once during an encounter,
particularly if the child is boarding in the ED for several days. These additional interactions are
not captured in this data.
Seasonality95
Variation in demand for MCI services is important to understand since it can impact capacity and
revenue for MCI teams as well as EDs and acute pediatric units. Similar to the CARD data, there
is significant variation in MCI encounters by season. MCI encounters are lowest during the
summer when school is not in session. See Table J.1.
Table J.1: Monthly MCI Encounters for Ages 0-20, 2011-2014
Average Number of Encounters 1,786
Summer 1,378
Fall 1,794
Winter 1,792
Spring 2,182
Median Number per Month 1,812
Standard Deviation 406
Despite this seasonal fluctuation, the number of MCI encounters has remained relatively steady
over time. See Figure J.1.
Figure J.1: Average Number of MCI Encounters per Month for Ages 0-20, 2011-2014
0
500
1000
1500
2000
2500
3000
Januar
yF
ebru
ary
Mar
chA
pri
lM
ayJu
ne
July
Aug
ust
Sep
tem
ber
Oct
ober
Nov
emb
erD
ecem
ber
Januar
yF
ebru
ary
Mar
chA
pri
lM
ayJu
ne
July
Aug
ust
Sep
tem
ber
Oct
ober
Nov
emb
erD
ecem
ber
Januar
yF
ebru
ary
Mar
chA
pri
lM
ayJu
ne
July
Aug
ust
Sep
tem
ber
Oct
ober
Nov
emb
erD
ecem
ber
Januar
yF
ebru
ary
Mar
chA
pri
lM
ayJu
ne
July
Aug
ust
Sep
tem
ber
Oct
ober
Nov
emb
erD
ecem
ber
2011 2012 2013 2014
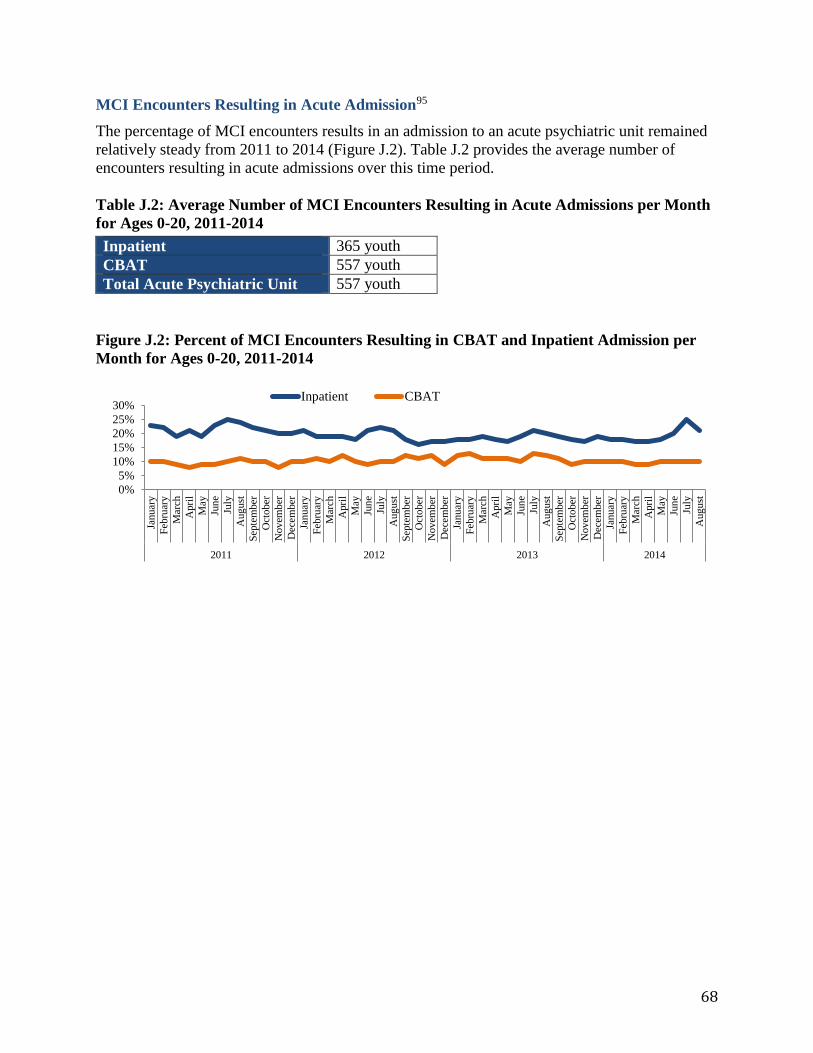
68
MCI Encounters Resulting in Acute Admission95
The percentage of MCI encounters results in an admission to an acute psychiatric unit remained
relatively steady from 2011 to 2014 (Figure J.2). Table J.2 provides the average number of
encounters resulting in acute admissions over this time period.
Table J.2: Average Number of MCI Encounters Resulting in Acute Admissions per Month
for Ages 0-20, 2011-2014
Inpatient 365 youth
CBAT 557 youth
Total Acute Psychiatric Unit 557 youth
Figure J.2: Percent of MCI Encounters Resulting in CBAT and Inpatient Admission per
Month for Ages 0-20, 2011-2014
0%
5%
10%
15%
20%
25%
30%
Januar
y
Feb
ruar
y
Mar
ch
Apri
l
May
Jun
e
July
Aug
ust
Sep
tem
ber
Oct
ober
Nov
emb
er
Dec
ember
Januar
y
Feb
ruar
y
Mar
ch
Apri
l
May
Jun
e
July
Aug
ust
Sep
tem
ber
Oct
ober
Nov
emb
er
Dec
ember
Januar
y
Feb
ruar
y
Mar
ch
Apri
l
May
Jun
e
July
Aug
ust
Sep
tem
ber
Oct
ober
Nov
emb
er
Dec
ember
Januar
y
Feb
ruar
y
Mar
ch
Apri
l
May
Jun
e
July
Aug
ust
2011 2012 2013 2014
Inpatient CBAT
69
K – Estimated Number of Stuck Kids
Providers’ capacity and resources depends on total demand for services. Therefore, it is
important to understand the full scope of the stuck youth problem across sites of care and payers.
Sites of Care
Acute psychiatric units
(IP and CBAT)
EDs
Community-based programs
(STARR and TCU)
Payers
MassHealth
(including non-MBHP youth)
Commercial
We estimated the total number of stuck youth across sites of care and payers. Our estimates rely
on a series of assumptions based on utilization data, program details, and key insights from our
interviews with experts, providers, and state agencies. Our aim was to develop conservative
“back of the envelope” estimates.
Acute Psychiatric Units
We estimated the number of stuck youth with both MassHealth and commercial insurance.
MassHealth
As a conservative estimate, we assumed that only MassHealth children with MBHP become
stuck and use CARD Report data (including NASA). We make this assumption since MBHP is
the largest provider of behavioral health services for children with MassHealth.80
We based our estimate on the average number of youth on the CARD report each month from
August 2011 through September 2014.
Therefore, we estimate 147 youth with MassHealth are stuck on acute psychiatric units per
month.
Commercial
Youth with commercial insurance also become stuck in acute psychiatric units. While providers
report that youth with commercial insurance become stuck at a lower rate, there is no publically
available data on the rate at which they become stuck. Therefore, we estimated the number of
youth with commercial insurance that become stuck as follows:
We started with the total number of youth (aged <18) with commercial insurance in 2013
(most recent year of data available):97 993,400 youth.
Then we calculated the rate at which children with MassHealth become stuck.
Rate at which children with MassHeatlh become stuck:89,97
70
We conservatively assumed that children with commercial insurance become
stuck at 20% the rate of children with MassHealth based on conversations with
providers and CBHI. We find:
Therefore, we estimate 61 youth with commercial insurance are stuck on acute psychiatric units
per month.
Emergency Departments
We estimated the number of youth boarding in the ED with both MassHealth and commercial
insurance.
MassHealth
From Table J.2 in Appendix J, we know that an average of 557 youth per month are referred to
acute psychiatric units by an MCI team (365 IP and 192 CBAT). Since only those with
MassHealth typically have access to MCI services, we assume that all of these children and
adolescents have MassHealth.
Several studies on ED boarding in Massachusetts found that approximately 33-34% of youth
presenting for inpatient psychiatric hospitalization boarded on the medical service (See table F.1
in Appendix F for an overview of these studies). These studies define a youth as an ED boarder
when they have been awaiting bed placement for 12 or more hours. Note that this definition of
ED boarding is stricter than MBHP’s definition of 72 hours. However, we believe that the 12
hour definition of ED boarding more accurately reflects the values of a youth and family
centered care system.
We assume a lower rate of ED boarding than these studies though since they were conducted
prior to establishment of CBHI. Since CBHI likely helped alleviate the ED boarding problem, we
conservatively estimate that 15% of youth presenting for acute psychiatric care board in the ED.
Note that that this is less than half of the rate found in studies on ED boarding in Massachusetts.
Using these assumptions, we do the following calculations:
Therefore, we estimate 84 youth with MassHealth board in EDs per month.
Commercial
Youth with commercial insurance also board in EDs. Some believe that youth with commercial
insurance board at a lower rate than children with MassHealth. However, we consulted with a
provider on these estimates who shared that in some cases youth with more commercial
insurance may be more likely to board than youth with MassHealth. Commercial payers often
cover a narrower range of community-based services. Therefore, an ED phsysician may have a
youth with commercial insurance board while waiting for a CBAT bed if they know that the
child will not have access to in-home services. Additionally, commercial insurers typically
contract with fewer CBATs than MassHealth behavioral health carve-outs.
71
With this insight, we made the following assumptions and calculations:
We started with the total number of youth (aged <18) with commercial insurance in 2013
(most recent year of data available):97 993,400 youth.
Then we calculated the rate at which children with MassHealth are admitted to acute
psychiatric units from EDs, and assumed that children with commercial insurance are
admitted to acute psychiatric units from EDs at 10% the rate of children with
MassHealth based on provider interviews.95,97
We assume that approximately 15% of these admissions to acute psychiatric units board
in either the ED or at home prior to admission. Note that we used the same boarding rate
assumption for youth with both MassHealth and commercial insurance. We make this
assumption based on provider insight that youth with commercial insurance often board
in the ED, but for different reasons than youth with MassHealth. We then calculate the
number of commercial insurance boarders per month as follows:
Therefore, we estimate 17 youth with commercial insurance board in EDs per month.
Community-Based Programs
We estimated the number of stuck kids at two additional sites of care where the stuck youth
problem is not typically discussed by state agencies: STARR programs and TCUs. Only children
with MassHealth typically utilize these programs.
STARR Programs
The DCF STARR programs that we interviewed described how the stuck kid problem also exists
in their programs. However, there is no available data on the number of youth stuck in STARR
programs. Based on these conversations, we conservatively estimate that there is one stuck youth
per month at each of the 18 STARR programs.91
Therefore, we estimate 18 youth are stuck in STARR Programs per month.
TCU
Several of our interviewees discussed how TCUs were created by DCF to address the stuck kids
problem by providing a transitional placement for youth discharged from acute psychiatric units
while awaiting their next placement. However, there is no available data on number of youth that
could be considered stuck in TCUs. Therefore, we conservatively estimate that 1/3 of the youth
in TCUs have no clear next placement and could be considered stuck. Based on the 2014 Mental
Health Reports, we found an average of 13 youth in TCUs at the end of the month count.96
Therefore, we estimate 4 youth are stuck in TCUs per month.
72
L – Case Studies
Since other states face similar problems, we compiled several case studies that highlight
innovative approaches to addressing the “stuck kids” problem. Lessons learned from these case
studies were used in the development of our recommendations.
Wraparound Milwaukee – Milwaukee, Wisconsin
Philadelphia Community Behavioral Health – Philadelphia, PA
Massachusetts Mental Health Services Program for Youth (MHSPY) – Cambridge, MA
Texas Medicaid MCO Super-Utilizers Program – Bexar County, Texas
Wraparound Milwaukee61–64
Overview
Wraparound Milwaukee is a managed care program that provides comprehensive, community-
based, and individualized care to children with serious emotional or mental health needs at risk
of institutional placement.
Program
Milwaukee County developed Wraparound in 1995 to address the overutilization of institutional
care (eg. inpatient psychiatric care, residential treatment, and group homes) by children in the
child welfare and juvenile justice systems.
The child welfare and juvenile justice systems refer children with serious emotional or mental
health needs at risk of institutional placement to Wraparound. Wraparound then assigns each
child and their families a Care Coordinator. Care Coordinators work with families to develop an
individualized care plan and they facilitate treatment by coordinating services from the
Wraparound network of providers. A broad array of services is offered from medication
management, and in-home therapy, to respite care, and housekeeping. To ensure that the child’s
care plan is working well, Care Coordinators conduct weekly home visits and monthly treatment
team meetings, appear in court as needed, and monitor the child’s plan of care.
Impact
Wraparound has successfully reduced utilization of institutional placements, lowered costs, and
improved clinical outcomes.
Utilization: The average daily census in residential treatment dropped from 375 to 110 children
from 1995 to 2014. During this same time period, the average length of stay for residential
treatment dropped from 14 months to 4 months.
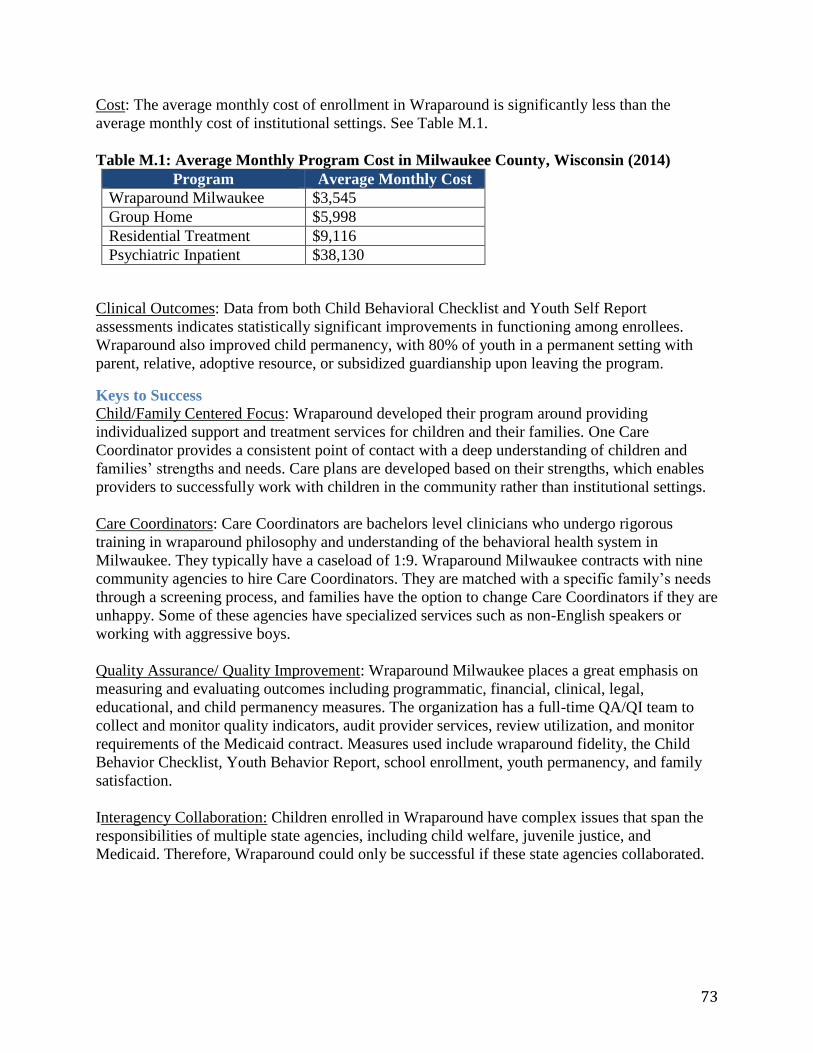
73
Cost: The average monthly cost of enrollment in Wraparound is significantly less than the
average monthly cost of institutional settings. See Table M.1.
Table M.1: Average Monthly Program Cost in Milwaukee County, Wisconsin (2014)
Program Average Monthly Cost
Wraparound Milwaukee $3,545
Group Home $5,998
Residential Treatment $9,116
Psychiatric Inpatient $38,130
Clinical Outcomes: Data from both Child Behavioral Checklist and Youth Self Report
assessments indicates statistically significant improvements in functioning among enrollees.
Wraparound also improved child permanency, with 80% of youth in a permanent setting with
parent, relative, adoptive resource, or subsidized guardianship upon leaving the program.
Keys to Success
Child/Family Centered Focus: Wraparound developed their program around providing
individualized support and treatment services for children and their families. One Care
Coordinator provides a consistent point of contact with a deep understanding of children and
families’ strengths and needs. Care plans are developed based on their strengths, which enables
providers to successfully work with children in the community rather than institutional settings.
Care Coordinators: Care Coordinators are bachelors level clinicians who undergo rigorous
training in wraparound philosophy and understanding of the behavioral health system in
Milwaukee. They typically have a caseload of 1:9. Wraparound Milwaukee contracts with nine
community agencies to hire Care Coordinators. They are matched with a specific family’s needs
through a screening process, and families have the option to change Care Coordinators if they are
unhappy. Some of these agencies have specialized services such as non-English speakers or
working with aggressive boys.
Quality Assurance/ Quality Improvement: Wraparound Milwaukee places a great emphasis on
measuring and evaluating outcomes including programmatic, financial, clinical, legal,
educational, and child permanency measures. The organization has a full-time QA/QI team to
collect and monitor quality indicators, audit provider services, review utilization, and monitor
requirements of the Medicaid contract. Measures used include wraparound fidelity, the Child
Behavior Checklist, Youth Behavior Report, school enrollment, youth permanency, and family
satisfaction.
Interagency Collaboration: Children enrolled in Wraparound have complex issues that span the
responsibilities of multiple state agencies, including child welfare, juvenile justice, and
Medicaid. Therefore, Wraparound could only be successful if these state agencies collaborated.
74
Collaboration efforts were successful for three key reasons.
Each state agency was frustrated with the current system.
Leaders at each state agency were committed to fixing the system.
Pilot program with twenty-five children demonstrated the potential of Wraparound.
Data Sharing: Information on each child’s case can be shared between state agencies, care
coordinators, and providers. Data sharing enables state agencies and providers to collaborate and
discuss cases without the child and their family repeating the same information multiple times.
While Wraparound did face obstacles in integrating different data systems used by state
agencies, data is now integrated into the Synthesis IT system that serves as one Electronic Health
Record for all Case Coordinators and providers that contract with Wraparound.
Wraparound Milwaukee created a one-page waiver authorizing release of patient information for
the duration of a family’s involvement with the program. The waiver system was supported by
the Milwaukee Municipal court and certified by HIPAA. Information in the Synthesis system is
shared only on a need-to-know basis such that most users cannot access the record in its entirety.
A privacy office routinely monitors data use and levels of access.
Pooled Funding: Wraparound’s development was funded with a $15 million federal grant from
the Center for Mental Health Services. The program is sustained through a pooled funding
system. State and county agencies contribute to the funding, including Milwaukee Child
Welfare, the State Division of Health Care Financing (operators of Medicaid), County’s
Delinquency and Court Services, and the Behavioral Health.
Funds were combined from Child Welfare’s budget for institutional care of Children Requiring
Assistance and/or Services (CHIPS), Juvenile Justice’s budget for treatment and juvenile
corrections placements, along with a per member per month payment from Medicaid and block
grants, crisis billing, and commercial insurance payments from the Mental Health system.
Payment Structure: Wraparound is a Care Management Organization (CMO), which enables the
program to operate like a behavioral health HMO. It has a 1915(a) Medicaid waiver to act as a
voluntary managed care organization. Payment is capitated per enrollee per month and
Wraparound is at risk for any costs above the capitated rate, including both inpatient and
outpatient care. Therefore, Wraparound is financially accountable for all care provided and has a
strong incentive to provide high-quality community-based services to prevent children from
needing institutional care.
Wraparound contracts with providers in a fee-for-service structure to allow maximum flexibility
in choosing individualized services for each family and youth. Each service provider is
contracted for a specific service in a care plan, which is reviewed every 90 days. If the youth and
family are not improving, the contract is not renewed and a new care plan is created.
Potential Application to Massachusetts
CBHI ensures that MassHealth beneficiaries have access to community-based treatment options
for mental health. However, CBHI does not have the kind of accountability structure that ensures
children flow through the system of care smoothly and appropriately. A combination of pooled
75
funding, global payment, and rigorous quality assurance similar to Wraparound Milwaukee, has
the potential to provide the necessary accountability.
State agencies and MBHP are likely to resist pooled funding and global payment because each
tends to feel as though they are fulfilling their responsibilities. However, their insular focus is
also contributes to the need for a global payment structure that supports child/family focused
care. Establishing a global payment structure would likely require the support and leadership of
Governor Baker and Secretary Sudders.
A global payment structure would also support improvements in data sharing and care
coordination. Regardless of payment structure, however, CBHI may have the authority to lead
interagency initiatives on data sharing and care coordination.
Philadelphia Community Behavioral Health (CBH)56,57
Overview
Philadelphia Community Behavioral Health (CBH) is non-profit organization contracted by the
city of Philadelphia to provide mental and behavioral health services to Medicaid recipients in
Philadelphia County.
Program
CBH functions as a behavioral health carve-out for Medicaid in Philadelphia County. In 2007, it
began a pay-for-performance system in which providers were given end of year bonuses based
on whether or not they met specified levels on outcome-based quality measures. The amount of
the bonus is scaled to the level of performance. CBH now uses pay-for-performance incentives
with over 90% of its provider network.
Philadelphia CBH uses a homegrown set of quality metrics developed in collaboration with
providers and the city. Although there are over 60 metrics for different sites of care, usually only
a few apply to a given provider. Typically, measurements include speed of access to care,
follow-up after treatment, and recidivism. Performance is calculated from Medicaid claims data
so that providers do not have to submit additional information. Providers receive evaluations
with their performance on these metrics in comparison to local and national benchmarks for
providers who do similar work and serve similar populations. CBH also monitors all providers in
the city to see if the program is effectively improving outcomes.
Impact
Early reports show that Medicaid recipients are more often using outpatient services and have
shorter waiting times for appointments. Adult 30-day readmission rates for inpatient facilities
have dropped from 16% to 11%. Effective practices have been shared between providers at
learning conferences. However, it is still unclear if the program will generate cost savings that
may come from reducing inpatient hospitalizations.

76
Keys to Success
Provider involvement: Providers helped to design the metrics used in Philadelphia and are
regularly solicited for feedback about the fairness of the measurements and utility of the
evaluations. There is complete transparency where providers are aware of the metrics and
benchmarks, as well as how to give feedback to CBH leadership. Providers were initially in
favor of the program because it offered them an opportunity to make a profit if they were able to
successfully adapt and meet performance benchmarks.
Outcome orientation: CBH focused exclusively on outcome-based measures rather than on the
processes that lead to these outcomes. This approach gives providers wide latitude in meeting the
benchmarks and encourages creativity in improving care processes. It has been deemed a
“whatever it takes” approach that encourages providers to focus on the overall health and
productivity of their clients.
Shared learning: Providers have credited the approach with increasing collaboration across the
city by encouraging agencies to find best practices and work together as a network so that they
can all benefit. The pay-for-performance evaluations are designed so that providers are measured
against an external benchmark, rather than competing with each other. Everyone can potentially
earn the bonus. CBH holds learning conferences where the most effective providers in the city
can share their practices.
Leadership: The Philadelphia City Behavioral Health Commissioner was the one to initially push
for an outcome oriented approach. The Commissioner wanted to be an early adopter when
Pennsylvania Medicaid made funding available for managed care organizations to institute pay-
for-performance. City leadership has fostered a close relationship between CBH and the
Department of Behavioral Health and Intellectual Disability Services (DBHIDS) which oversees
all of public sector behavioral health. The city has also made close ties between CBH and the
Office of Housing, Health, and Opportunity to be able to offer a full spectrum of social services.
Potential Application to Massachusetts
Instituting an outcomes-based pay-for-performance approach such as Philadelphia CBH may
benefit Massachusetts by encouraging provider creativity and collaboration in sharing the most
effective practices across the state. Providers who are already high performers can help to raise
the level of others. It may also help foster collaboration between different sectors of the
behavioral health system (e.g. inpatient units and the clinics to which they discharge patients) in
order to achieve mutual goals.
The metrics used by CBH are primarily HEDIS measures already captured by Medicaid
reporting. Initiating the program would require funding for the performance bonuses and
evaluation of the measurements by a managed care organization such as MBHP. It is possible
that savings could be captured from decreased use of acute services. Such a program may also
represent an opportunity for the state to create stronger partnerships with providers and
collaborate to form a culture of accountability for outcomes.
77
Massachusetts Mental Health Services Partnership for Youth (MHSPY)46,47
Overview
The Massachusetts Mental Health Services Partnership for Youth (MHSPY) was a community-
based integrated clinical intervention that managed wraparound services for youth with severe
functional impairment.
Program
MHSPY offered coordinated services in mental health, primary care, substance use, and social
services in a home-based, family centered model. It operated from 1999-2009 and served youth
from the towns of Cambridge, Somerville, Malden, Medford, and Everett.
It was initially funded by the Robert Wood Johnson Foundation (RWJF) and Washington
Business Group on Health (WGBH) as a demonstration project to create a System of Care within
state Medicaid. The program was a collaboration of MassHealth, DCF, DYS, DMH, and the
Department of Education where the state’s youth-serving state agencies pooled funding to
address the needs of a specific youth population. Neighborhood Health Plan, a Medicaid MCO,
managed the funding and paid MHSPY a capitated rate.
Any state agency that funded the program could refer youth for care management. Eligibility
included being at-risk for out of home placement, score greater than 40 on the Child and
Adolescent Functional Assessment Scale (CAFAS), and a parent or guardian who would consent
to the program. It was therefore specifically created for a small segment of youth for whom the
existing behavioral health system was not working.
MHSPY used a wraparound model where a Care Manager identified needs and resources then
worked with families to develop an individual care plan. Data was collected on clinical
functioning at baseline and every 6 months, as well as on service utilization, costs of care, and
satisfaction from families, youth, and state agencies.
Impact
Analysis of 4 years of data showed that participants improved clinical functioning, reduced
service utilization and costs of care, and had high rates of family satisfaction.
During the pilot period from 1998-2002, 83 children were enrolled in the program. Youth who
were enrolled for 12 months in the program showed improvement on every subscale of the
CAFAS, an indicator of global functioning. The greatest areas of improvement were in home,
self-harm, substance abuse, and school/work.
There was also a reduction in hospitalizations and out-of-home placements. Both costs included
in the capitation, as well as state agency expenses such as foster care, residential, group home, or
jail were decreased by 50% during the pilot period. Enrollees in the program were 50-60% less
expensive than similar youth who were placed in more restrictive settings.
78
Keys to Success
Outcomes orientation: MHSPY rigorously tracked outcomes of the program in four key domains:
1) clinical improvement and global functioning 2) utilization 3) cost 4) satisfaction. Multiple
clinical outcomes tools were used including the Child and Adolescent Functional Assessment
Scale (CAFAS), Child Behavior Checklist (CBCL), Youth Self-Report (YSR), Teacher Report
Form, and Family Support Scale (FSS) that were administered by a MHSPY Enrollment
Manager initially and then by a Clinical Outcomes Coordinator at regular intervals. Clinicians
administered the Child Global Assessment Scale (CGAS) and Patient Assessment Tool (PAT).
Administrative reports on living situation and level of restrictiveness were collected weekly.
Care Managers: MHSPY utilized both a Family Coordinator and a Care Manager for each
family. The Family Coordinator was a paraprofessional who had personal experience caring for a
child with behavioral health needs. The Care Manager was a master’s level clinician who
assessed the strengths and needs of each family, designed an individualized care plan, and
contracted for the services provided. Each Care Manager carried 8 families. This individual was
responsible for the care provided to each family and was the point-person in the behavioral
health continuum.
Pooled funding: The demonstration project was able to successfully pool funding from the major
youth-serving state agencies in Massachusetts to jointly serve a specific population. This enabled
flexibility in using individual services to create a wraparound plan and promoted shared care
planning and accountability.
Interagency Cooperation: Importantly, the program sought to have a shared decision-making
structure built on state agency cooperation. This helped to remedy what was otherwise a
fragmented and overlapping approach to providing services.
Potential Application to Massachusetts
The MHSPY demonstration project was a highly effective intervention to improve behavioral
health services for s small segment of youth. Youth were able to be kept in their homes and the
program successfully reduced costs of care. Unfortunately it did not appear to be readily scalable
or financially sustainable.
Many of the wraparound services previously provided by MHSPY are now provided by CBHI.
However, there are some potential lessons from the success of the demonstration project. It was
initially envisioned for a particularly challenging, high-cost population of youth, much like
modern super-utilizer programs. It used highly trained master’s level Care Managers with low
case-loads, and routinely evaluated treatment progress with validated measures. These
approaches may be helpful for the challenging and high-utilizing population that becomes stuck.
Importantly, the MHSPY demonstration was able to coordinate state agency efforts to address
youth behavioral health and achieved pooled funding with a capitated rate for provision of
services. The process by which this was originally achieved may serve as a model for another
attempt at pooled state agency funding. Although the more detailed services of the program may
not have been ready for scale, it may offer an example for how to move forward with more
accountable payment schemes. The funding landscape may now be ready to accommodate a
shared savings approach to capture the cost effectiveness of a similar high-utilizer program.
79
Texas Medicaid MCO Super-Utilizers Program41,42
Overview
The Texas Health and Human Services Commission (HHSC) now requires all Managed Care
Organizations (MCOs) in the state to have a specialized program for the outreach, education, and
intervention on the highest utilizing members for whom typical disease management approaches
have not proven effective.
Program
Each MCO plan is allowed to set its own trigger criteria for super-utilizers, for example ED
utilization, inpatient hospital use, readmissions, or total costs of care. HHSC is developing a
common benchmark to define super-utilizers to measure progress consistently across MCOs.
Most super-utilizer programs include a similar structure of intensive case management, home
visits, interdisciplinary teams, and referral to social resources. The goal is to better coordinate
both physical and behavioral care across all Medicaid providers in the region. HHSC requires all
programs to have face-to-face visits with super-utilizers. Most MCOs are also utilizing predictive
modeling to direct their efforts towards those who are at risk of being high-utilizers.
MCOs are required to measure progress by overall costs of care, ED visits, and readmissions.
They report clinical outcomes by nationally recommended measures such as from the Agency for
Healthcare Research and Quality (AHRQ) or the Healthcare Effectiveness Data and Information
Set (HEDIS). An important outcome measured is gaps in care and continuity with the program.
One program, the Texas Center for HealthCare Services, in Bexnar County, has specifically
targeted behavioral health super-utilizers. The goal of the program is to create an integrated,
strengths-based, and multidisciplinary team. It has involved multiple hospitals and outpatient
clinics in Bexnar County that are coordinating efforts. The program utilizes health navigators
located across the county with additional mental health support from NPs or LMHCs as needed.
The state of Texas recently received a grant to design multi-payer delivery and payment models
that will base payment on quality outcomes. In addition, the Texas Legislature requires public
reporting of the quality of all state-funded mental health and substance abuse services that is
available online. These measures include a wide range of outcomes from readmission and
follow-up appointments to jail diversion, effective crisis response, and family engagement.
Impact
Implementation in Texas is still fairly recent and the overall impact of these initiatives has yet to
be evaluated.
Potential Application to Massachusetts
High-utilizer care management programs are becoming increasingly common in Medicaid
managed care. Although relatively new, programs like the Texas Medicaid MCOs offer a
promising approach for a state level Medicaid agency to coordinate care for a specific, high cost
population who is not well served by existing services.
80
REFERENCES
1. Massachusetts Executive Office of Health and Human Services. Overview of the
Children’s Behavioral Health Initiative. Available at:
http://www.mass.gov/eohhs/gov/commissions-and-initiatives/cbhi/childrens-behavioral-
health-initiative-overview.html.
2. Center for Public Representation. Summary of Court Decision in Rosie D. vs Romney.;
2010. Available at:
http://www.masslegalservices.org/system/files/library/7263_Rosie_D_Summary[1].pdf.
3. Centers for Medicare and Medicaid Services. EPSDT - A Guide for States: Coverage in
the Medicaid Benefit for Children and Adolescents.; 2014. Available at:
http://www.medicaid.gov/Medicaid-CHIP-Program-Information/By-
Topics/Benefits/Downloads/EPSDT_Coverage_Guide.pdf.
4. Interview with Emily Sherwood, Director of the Children’s Behavioral Health Initiative.
March 2015.
5. Mental Health Legal Advisory Committee. Access to Children’s Behavioral Health
Initiative (CBHI) Services in Massachusetts.; 2012. Available at:
http://www.mhlac.org/Docs/cbhi_services.pdf.
6. Stroul B, Friedman R. A System of Care for Children and Adolescents with Severe
Emotional Disturbances. Washington D.C.: Georgetown University Center for Child
Development, National Technical Assistance Center for Children’s Mental Health.; 1986.
7. Stroul B, Blau G, Friedman R. Updating the System of Care Concept and Philosophy.
Washington D.C.: Georgetown University Center for Child Development, National
Technical Assistance Center for Children’s Mental Health.; 2010.
8. Garner AS, Shonkoff JP. Early childhood adversity, toxic stress, and the role of the
pediatrician: translating developmental science into lifelong health. Pediatrics.
2012;129(1):e224–31..
9. Garner AS. Home visiting and the biology of toxic stress: opportunities to address early
childhood adversity. Pediatrics. 2013;132 Suppl (November 2013):S65–73.
10. Shonkoff, Jack P and Deborah A. Phillips E. From Neurons to Neighborhoods: The
Science of Early Childhood Developent. Washington D.C.; 2000.
11. Shonkoff JP, Garner AS. The Lifelong Effects of Early Childhood Adversity and Toxic
Stress. Pediatrics. 2012;129(1):e232–46.
81
12. Kahn RS, Brandt D, Whitaker RC. Combined Effect of Mothers’ and Fathers’ Mental
Health Symptoms on Children’s Behavioral and Emotional Well-being. Arch Pediatr
Adolesc Med. 2004;158:721–729.
13. Tarry ES, Richmond JB. A Science-Based Framework for Early Childhood Policy.
Cambridge, MA.: Harvard Center for the Developing Child.; 2007. Available at:
http://www.developingchild.harvard.edu.
14. Felitti VJ, Anda RF, Nordenberg D, et al. Household Dysfunction to Many of the Leading
Causes of Death in Adults The Adverse Childhood Experiences ( ACE ) Study. Am J Prev
Med. 1998;14(4):245–258.
15. Shonkoff JP, Boyce WT, Mcewen BS. Neuroscience, Molecular Biology, and the
Childhood Roots of Health Disparities: Building a New Framework for Health Promotion
and Disease Prevention. JAMA. 2009;301(21):2252–2259.
16. Flaherty EG, Thompson R, Litrownik AJ, et al. Adverse childhood exposures and reported
child health at age 12. Acad Pediatr. 2009;9(3):150–6.
17. Jonson-Reid M, Kohl PL, Drake B. Child and adult outcomes of chronic child
maltreatment. Pediatrics. 2012;129(5):839–45.
18. Dube SR, Anda RF, Felitti VJ, et al. Childhood Abuse , Household Dysfunction , and the
Risk of Attempted Suicide Findings From the Adverse Childhood Experiences Study.
JAMA. 2001;286(24):3089–3096.
19. Koenen KC, Moffitt TE, Poulton R. Early childhood factors associated with the
development of post-traumatic stress disorder: results from a longitudinal birth cohort.
Psychol Med. 2007;37(2):181–192.
20. Danese A, Moffitt TE, Harrington H, et al. Adverse Childhood Experiences and Adult
Risk Factors for Age-Related Disease: Depression, Inflammation, and Clustering of
Metabolic Risk Markers. Arch Pediatr Adolesc Med. 2009;163(12):1135–1143.
21. Johnson SB, Riley AW, Granger D a, Riis J. The science of early life toxic stress for
pediatric practice and advocacy. Pediatrics. 2013;131(2):319–27.
22. Taussig HN, Culhane SE, Garrido E, Knudtson MD. RCT of a mentoring and skills group
program: placement and permanency outcomes for foster youth. Pediatrics.
2012;130(1):e33–9.
23. Aarons GA, James S, Monn AR, Raghavan R, Wells R, Leslie L. Disentangling the
Relationship between Behavior Problems and Placement Change in Child Welfare: A
Multi-Level Cross-Lag Modeling Approach. J Am Acad Child Adolesc Psychiatry.
2010;49(1):70–80.
82
24. Rubin DM, O’Reilly ALR, Luan X, Localio a R. The impact of placement stability on
behavioral well-being for children in foster care. Pediatrics. 2007;119(2):336–44.
25. Newton, Rae R., Litrownik, Alan J., and Landsverk JA. Children and Youth in Foster
Care: Disentangling the Relationship Between Problem Behaviors and Number of
Placements. Child Abuse Negl. 2008;24(10):1363–1374.
26. Steinberg L. Age of Opportunity: Lessons from the New Science of Adolescence. Eamon
Dolan/Houghton Mifflin Harcour; 2014.
27. Insel TR. Mental Disorders in Childhood Shifting the Focus From Behavioral Symptoms
to Neurodevelopmental Trajectories. JAMA. 2014;311(17):2014–2015.
28. National Institute of Mental Health. Brain Development During Childhood and
Adolescence: Fact Sheet.; 2014.
29. Stroud C, Mainero T, Olson S. Improving the Health, Safety, and Well-Being of Young
Adults: Workshop Summary.; 2013.
30. Pittman KJ, Irby M, Tolman J, Yohalem N, Ferber T. Preventing Problems , Promoting
Development , Competing Priorities or Inseparable Goals ? Washington D.C.; 2003.
Available at: www.forumfyi.org.
31. Strauss, A and Corbin J. Basics of Qualitative Research: Grounded Theory Procedures
and Techniques. Newbury Park, CA: Sage; 1998.
32. Kahneman D. Thinking Fast and Slow. New York: Farrar, Strauss, and Giroux; 2011.
33. Massachusetts Executive Office of Health and Human Services. Interagency Child
Awaiting Resolution and Dispotion (CARD) Monthly Meetings. Oct. 2014-Mar. 2015.
34. Selman DP. Paradigm of Prediction: Predictive Analytics to Prevent Congestive Heart
Failure. HIMSS Healthc Inf Manag Syst. 2014. Available at:
http://www.himss.org/ResourceLibrary/GenResourceDetail.aspx?ItemNumber=30533.
35. Jacob S. Health Systems Use “Big Data” to Cut Costs, Improve Quality. Dallas/Fort
Worth Healthcare Daily. 2013. Available at:
http://healthcare.dmagazine.com/2013/06/13/health-systems-use-big-data-to-cut-costs-
improve-quality/.
36. Crockett D. 4 Essential Lessons for Adopting Predictive Analytics in Healthcare.
HealthCatalyst. 2013. Available at: https://www.healthcatalyst.com/wp-
content/uploads/2013/10/David-C-4-essential-lessons-final.pdf.
83
37. Hasselman D. Super-Utilizer Summit: Common Themes from Innovative Care Complex
Management Programs. Washington D.C.: Robert Wood Johnson Foundation.; 2013:1–
32. Available at: http://www.rwjf.org/content/dam/farm/reports/reports/2013/rwjf407990.
38. Mann C. CMCS Informational Bulletin: Targeting Medicaid Super-Utilizers to Decrease
Costs and Improve Quality. Baltimore, MD.: Center for Medicare and Medicaid Services.;
2013. Available at: http://medicaid.gov/federal-policy-guidance/downloads/cib-07-24-
2013.pdf.
39. Emeche U. Is a Strategy Focused on Super-Utilizers Equal to the Task of Health Care
System Transformation? Yes. Ann Fam Med. 2015;13(1):6–7.
40. Perla J. Colorado Super-Utilizer Activities : A Primer.; 2013. Available at:
https://www.colorado.gov/pacific/sites/default/files/Colorado Super-Utilizer Activities A
Primer.PDF.
41. MCO Special Populations (Super-Utilizers) Program: Initial Evaluation.; 2014:1–3.
Available at: http://www.hhsc.state.tx.us/hhsc_projects/ECI/docs/special-populations-
summary.pdf.
42. Manaugh B, Hochhalter A, Hospital WM, et al. DSRIP Statewide Learning Collaborative
Summit: Summit Highlights of DSRIP Projects. 2014. Available at:
https://www.hhsc.state.tx.us/1115-docs/DSRIP-summit/ProjectHighlightsPanel.pdf.
43. Pollastri AR, Epstein LD, Heath GH, Ablon JS. The Collaborative Problem Solving
approach: outcomes across settings. Harv Rev Psychiatry. 2013;21(4):188–99.
44. Knapp P, Chait A, Pappadopulos E, Crystal S, Jensen PS. Treatment of maladaptive
aggression in youth: CERT guidelines I. Engagement, assessment, and management.
Pediatrics. 2012;129(6):e1562–76.
45. Scotto Rosato N, Correll CU, Pappadopulos E, Chait A, Crystal S, Jensen PS. Treatment
of maladaptive aggression in youth: CERT guidelines II. Treatments and ongoing
management. Pediatrics. 2012;129(6):e1577–86.
46. Grimes KE, Mullin B. MHSPY : A Children ’ s Health Initiative for Maintaining At-Risk
Youth in the Community. J Behav Heal Serv Res. 2006;(April):196–212.
47. Grimes KE, Kapunan PE, Mullin B. Children ’ s Health Services in a “ System of Care ”:
Patterns of Mental Health , Primary and Specialty Use. Public Health Rep.
2006;121(June):311–323.
48. Callahan JJ, Shepard DS, Beinecke RH, Larson MJ, Cavanaugh D. Mental Health/
Substance Abuse Treatment In Managed Care: The Massachusetts Medicaid Experience
by James J. Callahan, Donald S. Shepard, Richard H. Beinecke, Mary Jo Larson, and
Doreen Cavanaugh. Health Aff. 1995;14(3).
84
49. Massachusetts Executive Office of Health and Human Services. CBHI Publications and
Reports. Available at: http://www.mass.gov/eohhs/gov/commissions-and-
initiatives/cbhi/cbhi-publications-and-reports.html.
50. Bremer RW, Scholle SH, Keyser D, Houtsinger JVK, Pincus HA. Pay for performance in
behavioral health. Psychiatr Serv. 2008;59(12):1419–29.
51. Liptzin B. Quality improvement, pay for performance, and “outcomes measurement”:
what makes sense? Psychiatr Serv. 2009;60(1):108–11.
52. Wampold BE, Brown G. Estimating variability in outcomes attributable to therapists: a
naturalistic study of outcomes in managed care. J Consult Clin Psychol. 2005;73(5):914–
23.
53. Phillips SD, Kramer TL, Compton SN, Burns BJ, Robbins JM. Case-Mix Adjustement of
Adolescent Mental Health Treatment Outcomes. J Behav Health Serv Res.
2003;30(1):125–136.
54. Ogles BM, Carlson B, Hatfield D, Karpenko V. Models of case mix adjustment for Ohio
Mental Health Consumer Outcomes among children and adolescents. Adm Policy Ment
Health. 2008;35(4):295–304.
55. Fontanella CA. The Influence of Clinical, Treatment, and Healthcare System
Characteristics on Psychiatric Readmission of Adolescents. Am J Orthopsychiatry.
2008;78(2):187–198.
56. Laughlin J. Behavioral Healthcare Goes Holistic: Pay-for-Performance in Philadelphia
Community Behavioral Health. Philadelphia Soc Innov J. 2015. Available at:
http://philasocialinnovations.org/site/index.php?option=com_content&view=article&id=5
75:behavioral-health-care-goes-holistic-pay-for-performances-growing-role-in-
philadelphia&catid=21:featured-social-innovations&Itemid=35.
57. Commonwealth of Pennsylvania Department of Public Welfare Offifce of Mental Health
and Substance Abuse Services. 2011 External Quality Review Report Community
Behavioral Health.; 2012. Available at:
http://www.dpw.state.pa.us/cs/groups/webcontent/documents/report/p_012461.pdf.
58. Fung CH, Lim Y, Mattke S, Damberg C, Shekelle PG. Systematic Review : The Evidence
That Publishing Patient Care Performance Data Improves Quality of Care. Ann Intern
Med. 2008;148:111–123.
59. Ketelaar NABM, Faber MJ, Flottorp S, Rygh LH, Ho K. Public release of performance
data in changing the behaviour of healthcare consumers , professionals or organisations.
Cochrane Database Syst Rev. 2014;(11).
85
60. Massachusetts Executive Office of Health and Human Services. Child and Adolescent
Needs and Strengths (CANS). Available at:
http://www.mass.gov/eohhs/gov/commissions-and-initiatives/cbhi/child-and-adolescent-
needs-and-strengths-cans/.
61. Melkote K, Wilson JB, Kamradt B. Bringing Kids Home: The Wraparound Milwaukee
Model. Cambridge, MA.: Harvard Kennedy School of Government.; 2010.
62. Kamradt B. Wraparound Milwaukee: Presentation to Harvard. 2009.
63. Interview with Bruce Kamradt, Director of Wraparound Milwaukee. February 2015.
64. Interview with Neil McQuarrie, Former Intern at Wraparound Milwaukee. January 2015.
65. Pelonero, Anthony L., Johnson RL. A Pay-for-Performance Program for Behavioral
Health Care Practitioners. Psychiatr Serv. 2007;58(4):2–4.
66. McLellan AT, Kemp J, Brooks A, Carise D. Improving public addiction treatment through
performance contracting: the Delaware experiment. Health Policy. 2008;87(3):296–308.
67. Commonwealth of Massachusetts. Bill S.499. An Act concerning Medicaid and
accountable care. Available at: https://malegislature.gov/Bills/188/Senate/S499.
68. Traylor T, Beck D. Health Policy Commission Care Delivery and Payment System
Transformation Committee.; 2015. Available at:
http://www.mass.gov/anf/docs/hpc/cdpsr/bmc-presentation-to-hpc-august-12-.
69. Gold J. FAQ on ACOs: Accountable Care Organizations, Explained. Kaiser Health News.
2015. Available at: http://kaiserhealthnews.org/news/aco-.
70. Hamblin A. State Options for Integrating Physical and Behavioral Health Care.
Baltimore, MD.: Centers for Medicare and Medicaid Services.; 2011. Available at:
http://www.medicaid.gov/State-Resource-Center/Medicaid-State-Technical-.
71. Children's Behavioral Health Initiative. MassHealth’s Home and Community Based
Mental Health Services for Children and Families. 2010. Available at:
http://www.mass.gov/eohhs/docs/masshealth/cbhi/home-community-based-bhs-children-
families-description-of-services.pdf. .
72. Children's Behavioral Health Initiative. Screening for Behavioral Health Conditions.
Available at: http://www.mass.gov/eohhs/gov/commissions-and-initiatives/cbhi/screening-
for-behavioral-health-conditions/.
73. Rosie D. v. Romney: Plaintiff’s Final Remedial Plan.; 2006. Available at:
http://www.clearinghouse.net/chDocs/public/MH-MA-0005-0011.pdf.
86
74. Massachusetts Executive Office of Health and Human Services. Department of Mental
Health. Available at: http://www.mass.gov/eohhs/gov/departments/dmh/about-the-
department-of-mental-health.html.
75. Massachusetts Executive Office of Health and Human Services. Department of Children
and Families. Available at: http://www.mass.gov/eohhs/gov/departments/dcf/. .
76. Massachusetts Executive Office of Health and Human Services. Department of Youth
Services. Available at: http://www.mass.gov/eohhs/gov/departments/dys.
77. Massachusetts Executive Office of Health and Human Services. Department of
Developmental Services. Available at: http://www.mass.gov/eohhs/gov/departments/dds/.
78. Massachusetts Executive Office of Health and Human Services. Massachusetts Chapter
766. Available at: http://www.mass.gov/eohhs/gov/laws-regs/mcb/mass-chapter-766.html.
79. Massachusetts Executive Office of Health and Human Services. Primary Care Clinician
Plan. Available at: http://www.mass.gov/eohhs/provider/insurance/masshealth/provider-
enrollment/primary-care-clinician-plan.html.
80. Massachusetts Behavioral Health Partnership. Available at:
https://www.masspartnership.com/About/index.aspx.
81. Association of Behavioral Healthcare. Letter to David Seltz, Merger of Beacon Health
Strategies and ValueOptions.; 2014. Available at:
http://c.ymcdn.com/sites/www.masspsych.org/resource/resmgr/Seltzletter.pdf.
82. Bender D, Pande N. A Literature Review: Psychiatric Boarding. Washington D.C.: US
Department of Health and Human Services Office of the Assistant Secretary of Planning
and Evaluation.; 2008. Available at: http://aspe.hhs.gov/daltcp/reports/2008/PsyBdLR.pdf.
83. Bender D, Pande N. Psychiatric Boarding Interview Summary. Washington D.C.: US
Department of Health and Human Services Office of the Assistant Secretary of Planning
and Evaluation.; 2009. Available at http://aspe.hhs.gov/daltcp/reports/2009/psybdint.pdf.
84. Claudius, I, Donofrio JJ, Lan CN, Santillanes G. Impact of Boarding Pediatric Psychiatric
Patients on the Medical Ward. Hosp Pediatr. 2014;4(3):125–132.
85. Nelson KA, Boslaugh ÞSE, Iii DH. Risk Factors for Extremely Long Length-of-Stay
Among Pediatric Emergency Patients. Pediatr Emerg Care. 2009;25(12):835–840.
86. Sharfstein et. al. Clinical and Fiscal Implications of Using a Pediatric Inpatient Service as
a Psychiatric Unit. In: Ambulatory Pediatric Association Meeting. Boston, MA; 2000.
87. Mansbach JM, Wharff E, Austin SB, Ginnis K, Woods ER. Which psychiatric patients
board on the medical service? Pediatrics. 2003;111(6 Pt 1):e693–8.
87
88. Wharff EA, Ginnis KB, Ross AM, Blood EA. Predictors of Psychiatric Boarding in the
Pediatric. Pediatr Emerg Care. 2011;27(6):483–489.
89. Massachusetts Executive Office of Health and Human Services. Child Awaiting
Resolution and Disposition (CARD) Data. 2011-2014. Available at:
http://www.mass.gov/eohhs/gov/commissions-and-initiatives/children-awaiting-
resolution-and-disposition.html.
90. Interview with Laura Conrad, MBHP Progam Manager. November 2014.
91. Massachusetts Executive Office of Health and Human Services. Caring Together
Overview. Available at: http://www.mass.gov/eohhs/gov/commissions-and-
initiatives/caring-together/.
92. Massachustts Child Psychiatry Access Project. About MCPAP. Available at:
http://www.mcpap.com/about.asp.
93. Holt W. The Massachusetts Child Psychiatry Access Project: Supporting Mental Health in
Primary Care. The Commonwealth Fund; 2010. Available at:
http://www.commonwealthfund.org/~/media/Files/Publications/Case
Study/2010/Mar/1378_Holt_MCPAP_case_study_32.pdf.
94. Massachusetts Department of Youth Services. Department of Youth Services Guide to
New MassHealth Behavioral Health Services & Protocols. 2011. Available at:
http://www.mass.gov/eohhs/docs/masshealth/cbhi/agency-protocols-dys.pdf.
95. MCI Trends Report.; 2015:1–51. Available at:
http://www.mass.gov/eohhs/docs/masshealth/cbhi/mci-quarterly-mobile-crisis-
intervention-report.pdf.
96. Massachusetts Executive Office of Health and Human Services. Mental Health Reports.
Available at: http://www.mass.gov/eohhs/gov/commissions-and-initiatives/cbhi/cbhi-
publications-and-reports.html.
97. Kaiser Family Foundation. State Health Facts. Available at: http://kff.org/other/state-
indicator/children-0-18/.


