CORRESPONDENCEAleksey V. Pyatunin [email protected]
© 2016 Pyatunin et al. Open Access terms of the Creative Commons Attribution 4.0 International License (http://creativecommons.org/licenses/by/4.0/) apply. The license permits unrestricted use, distribution, and reproduction in any medium, on the condition that users give exact credit to the original author(s) and the source,
provide a link to the Creative Commons license, and indicate if they made any changes.
Introduction
Football is the most popular sport in the world. In the past two decades,
football clubs have become more than just sport organizations – they have
INTERNATIONAL JOURNAL OF ENVIRONMENTAL & SCIENCE EDUCATION
2016, VOL. 11, NO. 15, 7515-7534
The Economic Efficiency of European Football Clubs –
Data Envelopment Analysis (DEA) Approach
Aleksey V. Pyatunina, Angelina B. Vishnyakovaa, Natalia L. Sherstnevaa, Svetlana P. Mironovab, Sergey A. Dneprovb and Yuriy P.
Grabozdinc
aSamara State University of Economics, Samara, RUSSIA; bRussian State Vocational
Pedagogical University, Ekaterinburg, RUSSIA; cSamara State University of Social Sciences and
Education, Samara, RUSSIA
ABSTRACT The relevance of this paper lies in the fact that football business has grown significantly in the past 20 years and football clubs have become large companies, which in an effort
to be profitable and successful on the field need to improve the efficiency of their business. The aim of this article is to measure economic efficiency of 48 big European
football clubs and assess the relationship between efficiency and different financial and
sportive indicators (variables). To measure efficiency, we used both widely used Data Envelopment Analysis (DEA) method and its extensions: DEA Super-efficiency and DEA
Cross-efficiency models. The results showed that these methods can successively be applied to football clubs’ efficiency measurement and the analysis of the them can help
to explain why some clubs are efficient or inefficient and which factors affects the efficiency. This paper will be interesting football clubs’ managers, football analytics,
economists and other people interested in football business because we combine in it the
most interesting ideas and methods about football clubs’ efficiency measurement.
KEYWORDS ARTICLE HISTORY
Efficiency, football clubs, economic efficiency, data
envelopment analysis (DEA), spearman's rank correlation coefficient
Received 14 May 2016
Revised 23 June 2016 Accepted 10 July 2016
OPEN ACCESS
7516 A. V. PYATUNIN ET AL.
become large commercial companies with revenues of hundreds of millions euro.
According to Deloitte Football Money League report, top 30 European football
clubs generate revenues equal to 6,6b (Deloitte, 2016).
Unlike most other studies, in this paper we decided to measure efficiency of
football clubs in 2014 not from one country, but efficiency of the richest and
strongest football clubs across Europe in 2012-2014. This choice can be
explained by the fact that these clubs draw maximum media and football fans
attention, these clubs together control the bigger part of revenues in European
football industry, and they are the most successful ones on the field. So, it is
very interesting to understand how efficiently such clubs spend their resources
to achieve sportive and financial goals (these clubs really have something to
spend).
In scientific literature there are two main approaches to study efficiency of
professional football clubs: financial efficiency measurement and sports
efficiency measurement (Kulikova & Goshunova, 2014). Financial efficiency
refers to the ability of a football club to make profit, sports efficiency – to be
successful on the field.
In our paper we consider both types of efficiency. We think that if a
researcher wants to get the all-round understanding of a football club’s
efficiency, he must consider both main areas of activity of any football club:
finance and sportive performance.
Because of the fact that we needed enough football clubs for measurement
(30-50 football clubs), we decided to apply 4 criteria for selecting them. The first
one is “Staff costs” (staff costs refer to wages of football players, technical staff,
medical staff, management and administrative staff ) which must be at average
(in 2012-2014) over 30m. The second criterion is “Market value of a squad”
(calculated by summing up market values of each player in a club) which must
be at average (in seasons 2012 -2014) over 50m. The third one is participating
in the strongest domestic divisions in 2012-2014. The fourth criterion is
availability of data (all of the variables for a football club which used in DEA
must be publicly available). According to these four criteria, we selected 48
football clubs from eight countries.
All the methods used to measure efficiency of football club can be divided
into two large groups: Parametric methods and Non-parametric methods.
Parametric methods are the methods, which use tools of deterministic
correlation and regression analysis. They identify type of relationship between
the variables and the functional dependence (Kulikova & Goshunova, 2014).
Non-parametric methods are focused primarily on the overall assessment of
the efficiency, which is based on the analysis of a set of inputs and outputs
which characterize the activity of the object under review (Kulikova &
Goshunova, 2014).
The main method used in our paper is the most popular non-parametric
method of clubs’ efficiency measurement – Data Envelopment Analysis (DEA),
which have some advantages over parametric methods. Also we used the Super-
Efficiency as a ranking methodology introduced by P. Andersen & N. Petersen
(1993) to differentiate the performance of extreme-efficient DMUs ((Decision
Making Units) with the efficiency scores more than 100%.

INTERNATIONAL JOURNAL OF ENVIRONMENTAL & SCIENCE EDUCATION 7517
Also, for comparison, we calculated efficiency using one of the extensions of
DEA - DEA Cross Efficiency method. It provides an ordering among DMUs
(Decision Making Units), and it eliminates unrealistic weight schemes without
requiring the elicitation of weight restrictions from application area experts
(Andersen, Hollingsworth & Inman, 2002). In the literature DEA Cross
Efficiency method has not been used before.
The second stage of our study was to assess the strength of the relationship
between the football clubs’ efficiency and their variables. The purpose was to
find out which variables correlates with the efficiency results best. Strong
positive correlation means that such a variable is important for a club aiming to
be efficient. To assess the relationship, we calculated Spearman's rank
correlation coefficient with the use of Gretl software.
Relevance and uniqueness of our paper consist of the following factors:
we analyze football clubs not from one country, but the richest and most
influential football clubs from eight countries;
we used not only DEA method (and Super-Efficiency method), but also
its extension - DEA Cross Efficiency method and compared the results to find
out which one is more reliable and logical;
we consider both types od efficiency: financial and sportive;
we used the combination of inputs and outputs that never used before.
Materials and Methods
Data envelopment Analysis
Data envelopment analysis (DEA) approach involves the use of linear
programming methods to construct a non-parametric frontier (piece-wise
surface) over the data. Efficiency measures are then calculated relative to this
surface.
This piece-wise-linear convex hull approach was proposed by M. Farrell
(1957) and was considered by only a few authors in the two decades following
Farrell’s research. DEA did not receive much attention until the paper by A.
Charnes, W. Cooper & E. Rhodes (1978), in which the term data envelopment
analysis (DEA) was first used. Since then a large number of papers have
appeared, which have extended and applied the DEA methodology (Coelly et al.,
2005; Lukinova, Smarchkova& Pisarenko (2014).
A. Charnes, W. Cooper & E. Rhodes (1978) proposed a model that was
input-oriented and assumed constant returns to scale (CRS). After that paper, R.
Banker, A. Charnes & W. Cooper (1984) and R. Faere, S. Grosskopf & J. Logan
(1983) considered alternative sets of assumptions, in which variable returns to
scale (VRS) models was proposed.
First, we describe DEA using the input-oriented CRS model because this
model was the first to be widely applied.
T. Coelli, D. Prosada Rao, C. O’Donnel & G. Battese (2005) illustrated this
model assuming there are data on N inputs and M outputs for each of I firms.
For i-th firm these are represented by the column vectors xi (inputs) and qi
(outputs) respectively. The N*I input matrix, X, and the M*I output matrix, Q,
represent the data for all I firms.

7518 A. V. PYATUNIN ET AL.
For each firm, we need to obtain a measure of the ratio of all outputs over
all inputs, such as u’qi / v’xi, where u is an M*1 vector of output weights and v is
a N*1 vector of input weights. The optimal weights are obtained by solving the
mathematical programming problem:
Maxu,v (u’qi/v’xi),
subject to u’qj/v’xj<= 1, j=1,2,3…,I,
u, v >= 0
This involves finding values for u, v, such that the efficiency measure for
the i-th firm is maximized, subject to the constraints that all efficiency measures
must be less than or equal one. One problem with this particular ratio
formulation is that it has an infinite number of solutions. To avoid this, one can
impose the constraint v’xi = 1, which provides:
Maxu,v (’qi),
subject to ’xi =1
u’qj - ’xj <= 0, j=1,2,3…,I,
u, >= 0,
where the change of notation from u and v to u and is used to stress that
this is a different linear programming problem (Coelly et al., 2005).
Using the duality in linear programming, we can derive an equivalent
envelopment form of this problem:
min,,
subject to –qi + Q>= 0,
xi - X>= 0,
>= 0,
where is a scalar and is a I*1 vector of constraints. This envelopment
form involves fewer constraints than the multiplier (N+M < I+1), and hence is
generally the preferred from to solve. The value of obtained is the efficiency
score for the i-th firm. It satisfies: <= , with a value 1 indicating a point on the
frontier and hence technically efficient firm, according to M. Farrell (1957)
definition (Coelly et al., 2005).
There are some difficulties in efficiency measurement because of the form of
the non-parametric frontier in DEA. The problem arises because of the sections
of the piece-wise linear frontier which run parallel to the axes (see Figure 16). In
Figure 1 we can see, that there are two efficient firms C and D and two
inefficient firms A and B. According to Farrell (1957), technical efficiency of
firms A and B is 0A’/0A and 0B’/0B, respectively. However, it is questionable as
to whether the point A’ is an efficient point since one could reduce the amount of
input x2 used (by the amount CA’) and still produce the same output. This is
known as input slack.

INTERNATIONAL JOURNAL OF ENVIRONMENTAL & SCIENCE EDUCATION 7519
Figure 1. Efficiency measurement and input slacks
That’s why any non-zero input or output slacks should be reported to
provide an accurate technical efficiency of a firm in DEA. T. Koopmans (1951)
defines technical efficiency more strictly stating, that a firm is only technically
efficient if it operates on the frontier and furthermore that all associated slacks
are zero.
For the i-th firm, the output slacks are equal to zero if Q – qi = 0 and input
slacks are equal to zero if xi - X = 0.
The CRS assumption is appropriate when all the firms are operating at an
optimal scale. Some authors, such as R. Faere, S. Grosskopf & J. Logan (1983)
and R. Banker, A. Charnes & W. Cooper (1984) proposed adjusting the CRS
DEA model to account for variable returns to scale (VRS) situations. The use of
the VRS specifications permits the calculation of TE devoid of the situation
when not all firms are operating at the optimal scale (Coelly et al., 2005).
The CRS linear programming problem can be easily modified to account for
VRS by adding the convexity constraint I1’ = 1:
min,,
subject to –qi + Q>= 0,
xi - X>= 0,
I1’ = 1
>= 0,
where I1 is an I*1 vector of ones (Coelly et al., 2005).
The advantages of DEA are that:
- it can be used with multiple inputs and outputs simultaneously;
- it is capable of being used with any input-output measurements;
- it only requires information on output and input quantities (not prices) to
calculate technical efficiency;
- it allows technical efficiency to be decomposed into scale effects;
The limitations of DEA are that:

7520 A. V. PYATUNIN ET AL.
- it produces results that are particularly sensitive to measurement error
because it is deterministic technique rather than a statistical technique: if one
DMU’s inputs are understated or its outputs overstated, then that DMU can
become an outlier that significantly affects the shape of the frontier
(Karaduman, 2006);
- it only measures efficiency relative to best practice within the observed
DMUs;
- DEA scores are sensitive to input and output specification and the size of
the sample.
Super-efficiency DEA model
Since the early 1980s, DEA has been widely used for measuring the
efficiency of independent homogenous units which use the same inputs to
produce the same outputs. However, a serious inconvenience in the utilisation of
DEA is the possibility of having units tied with efficiency equal to 100 percent.
That is, units at the frontier of relative efficiency (Yawe, 2010). According to the
DMUs’ efficiency scores, DEA classifies the DMUs into two diverse efficient and
inefficient groups. Unlike the inefficient DMUs, the efficient ones cannot be
ranked based on their efficiencies because of having the same efficiency score of
unity. However, it is clear that the efficient DMUs don’t have the same
performance in actual practice. The question is how to rank the efficient DMUs.
P. Andersen & N. Petersen (1993) introduced the super-efficiency as a
ranking methodology to differentiate the performance of extreme-efficient
DMUs.
The super-efficiency ranking enables one to distinguish between the
efficient observations. For example, the super-efficiency measure examines the
maximal radial change in inputs and /or outputs for a DMU to remain efficient,
i.e. hoe much can the inputs be increased (or the outputs decreased) while not
become inefficient. Super-efficiency measures can be calculated for both
inefficient and efficient DMUs. In the case of inefficient DMUs the values of the
efficiency measure do not change, while efficient DMUs may obtain values > 1
(Yawe, 2010).
P. Andersen & N. Petersen (1993) considered the DEA score for the
inefficient unit as its rank scale. In order to rank the efficient DMUs they allow
the efficient units to receive an efficiency score greater than 100 percent by
dropping the constraint that bounds the score of the evaluated unit (Cooper,
Seiford & Tone, 2000). For input-oriented DEA model with the assumption of
VRS technology:
Min (,, s+,s-) z0 = 0 - s+ - s-
subject to Y -s+ = Y0
0X0 - X - s- = 0
0 = 0 and
, s+, s->= 0
The efficiency score 0 is transformed into the so-called slack-augmented
score z0 by adding output slacks s+ and input slacks s- multiplied by - the non-
Archimedean infinitesimal.
INTERNATIONAL JOURNAL OF ENVIRONMENTAL & SCIENCE EDUCATION 7521
A standard DEA specification results when a constraint is ignored with the
hospitals in the efficient set get a score that exceeds unity. This determines the
factor by which the inputs of an efficient DMU can radially be expanded such
that the DMU under consideration just stays efficient (Yawe, 2010).
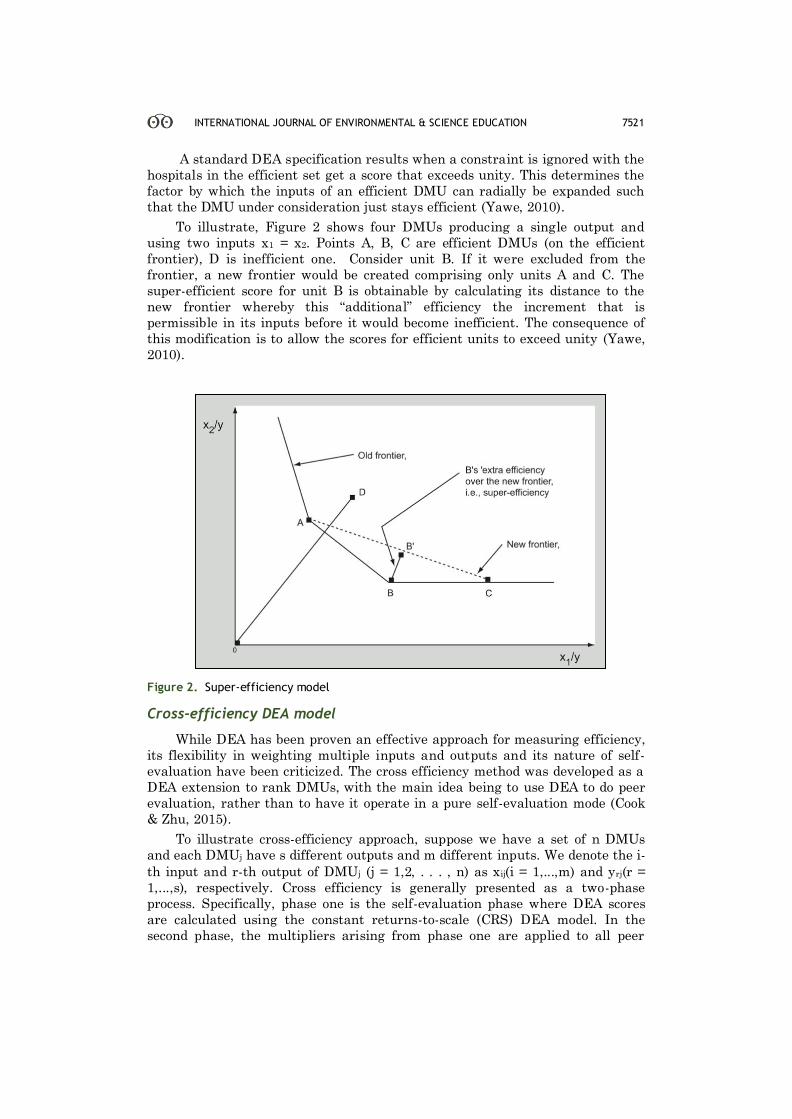
To illustrate, Figure 2 shows four DMUs producing a single output and
using two inputs x1 = x2. Points A, B, C are efficient DMUs (on the efficient
frontier), D is inefficient one. Consider unit B. If it were excluded from the
frontier, a new frontier would be created comprising only units A and C. The
super-efficient score for unit B is obtainable by calculating its distance to the
new frontier whereby this “additional” efficiency the increment that is
permissible in its inputs before it would become inefficient. The consequence of
this modification is to allow the scores for efficient units to exceed unity (Yawe,
2010).
Figure 2. Super-efficiency model
Cross-efficiency DEA model
While DEA has been proven an effective approach for measuring efficiency,
its flexibility in weighting multiple inputs and outputs and its nature of self-
evaluation have been criticized. The cross efficiency method was developed as a
DEA extension to rank DMUs, with the main idea being to use DEA to do peer
evaluation, rather than to have it operate in a pure self-evaluation mode (Cook
& Zhu, 2015).
To illustrate cross-efficiency approach, suppose we have a set of n DMUs
and each DMUj have s different outputs and m different inputs. We denote the i-
th input and r-th output of DMUj (j = 1,2, . . . , n) as xij(i = 1,...,m) and yrj(r =
1,...,s), respectively. Cross efficiency is generally presented as a two-phase
process. Specifically, phase one is the self-evaluation phase where DEA scores
are calculated using the constant returns-to-scale (CRS) DEA model. In the
second phase, the multipliers arising from phase one are applied to all peer
7522 A. V. PYATUNIN ET AL.
DMUs to arrive at the so-called cross evaluation score for each of those DMUs
(Cook & Zhu, 2015).
Phase 1: Suppose DMUd is under evaluation by the CRS model (Charnes,
Cooper & Rhodes,1978). Then that DMU’s (self-evaluation) efficiency score is
determined by the following DEA model:
Max Edd = sr=1(urd * yrd) / mi=1(vid * xid)
subject to Edj = sr=1(urd * yrj) / mi=1(vid * xij) <= 1, j = 1,2, …, n
ur,d>= 0, r =1,2, …, s.
vi,d >= 0, i = 1,2, …, m.
where vid and urd represent i-th input and r-th output weights for
DMUd(Cook & Zhu, 2015).
Phase2: The cross efficiency of DMUj, using the weights that DMUd has
chosen in model above, is given by
Edj = sr=1(u*rd * yrj) / mi=1(vid * xij), d, j= 1,2, …, n
where (*) denotes optimal values in model. For DMUj (j = 1, 2, · · · , n), an
average of all Edj(d = 1,2,..,n),
Ej(average) = 1/n * nd=1(Ed,j), is referred to as the cross efficiency for DMUj.
There are six DMUs. Edj is the (cross) efficiency of DMUj based upon a set of
DEA weights calculated for DMUd. This set of DMU weights gives the best
efficiency score for DMUd under evaluation by a DEA model, and Edd (in the
leading diagonal) is the DEA efficiency for DMUk. The cross efficiency for a given
DMUj is defined as the arithmetic average down column j, given by Ej(average).
Data
To select variables for efficiency measurement, we looked for the data which
must be publicly available, both sportive and financial and related to football
clubs. As inputs we selected five variables such as:
Staff costs (SC) (m). This variable is used by many authors in their
studies because it reflects how a club is capable to attract good players,
managers and technical stuff for achieving its aims for a football season. It is
obvious that the more you spend, the more you want to achieve, and amount of
spending on staff (which is the main result maker) affects the outcome very
much. Because of the fact that the wage cost figure and notes disclosed within
the financial statements of professional football clubs generally does not allow
any further breakdown and analysis (football players, technical staff, medical
staff, management and administrative staff wages), there is only publicly data
available relating to total staff costs. So, in our paper we assume that Staff costs
are total staff costs. We collected Staff costs data from the database of Internet
portal “Football Benchmark” (https://www.footballbenchmark.com) which is
maintained by KPMG – a professional service company, being one of the Big
Four auditors, along with Deloitte, EY and PwC. They have large amount of
financial and sportive data which is taken from publicly available resources.
Financial data are acquired from official Financial statements of professional
football clubs from the relevant public sources in each country or from a club’s
official website. So, this data is absolutely trustworthy.
Market value of a squad (MV) (£m). This variable is similar to Staff
costs, but reflects not amount of money spent for staff, but the pure strength of a

INTERNATIONAL JOURNAL OF ENVIRONMENTAL & SCIENCE EDUCATION 7523
team which is calculated by summing up market value of each player in a club.
Players is one of the main assets of a club which also affects the outcome much.
This data was acquired from the site Transfermarkt
(http://www.transfermarkt.co.uk/) which specializes on football transfers news.
Country strength coefficient (CST). As we selected football clubs from
different National leagues, we needed to find the way to put them in equal
starting conditions. It is obvious that, for example, for Manchester, which plays
in English Premier League, to finish at the first place and qualify for UEFA
Champions League is much harder than, for example, for Fenerbahce which
plays in Turkish League, because the sportive strength of the football clubs from
England is much higher than from Turkey. Considering that this coefficient
must be logical, and not too artificial, we decided to use such method: we found
the data of market value of all the football clubs for 2012-2014 for each country
on Transfermarkt site, then we summed up all the market values for each
league for years 2012-2014, in other words we calculated the strength of a
league in terms of market value of clubs in it. It is obvious that the more value of
input, the more the better. For example, a football club is in a preferred position,
if it spends more on wages and has a stronger squad. It has the right to expect
more outcome than a club which spends less money and has a weaker squad.
That is why, football clubs from the weakest league have the highest Country
strength coefficient. In this case it reflects the fact that it is easier to achieve
success in that league. In all three seasons 2012-2014 the Dutch football league
was the weakest one and the Dutch football clubs have Country strength
coefficient equal to 1. Coefficient for other countries is calculated by dividing
market value of the Dutch league by the market value of other league in the
corresponding season. The strongest league – English Premier League has the
lowest Country strength coefficient.
Participating in the European Cups (EU). This variable is used to
separate football clubs, which participate only in domestic tournaments from the
clubs, which participate also in UEFA Champions League or UEFA Europe
League and have better opportunities to earn more revenues. The the data was
found on the official UEFA site (www.uefa.com/).
Participating in UEFA Champions League (CL). This variable is used to
separate clubs which participate in UEFA Champions League and UEFA
Europa League, because the starting conditions for the clubs which participate
in UEFA Champions League are more preferable to the clubs which in UEFA
Europa League. There is no point in expecting from a club participating in
UEFA Europa League to get as much money as it would get if it reached the
same stage in UEFA Champions League. The the data was found on the official
UEFA site (www.uefa.com/).
As outputs we selected five variables such as:
Revenues (REV). This variable is widely used in the studies as output
because it is the main indicator of financial success of a club at the end of a
football season and of course it affects financial efficiency much. Due to the fact
that this variable intended for Domestic efficiency I found the data for Total
revenues and deducted from them Prize money (for promoting to the next stage
of a tournament) and Market pool money (distributed according to the
proportional value of each TV market represented by the clubs taking part in
tournament) which football clubs received for successful performance in UEFA

7524 A. V. PYATUNIN ET AL.
Champions League and UEFA Europa League. The data for total revenues I
found on Internet portal Football Benchmark and the data for prize money and
market pool money I found in the official reports published by UEFA yearly.
Points per a game in a National League (PGD). This variable is also
widely used as output indicating sportive success of a club in a domestic
championship. The points per game a club receives, the more chances to win the
championship, qualify for UEFA European tournaments, and attract more fans.
This variable is calculated by dividing the points points obtained by a football
club during the whole season by number of games played by a club. I found the
data for points per game on website Soccerway (http://int.soccerway.com/) which
publishes football results and other football statistical data for every country in
the world.
Qualification for the European Cups for the next season (ECQ). This
variable affects domestic efficiency very much because participating in the
European Cups allows a football club to become more popular among football
fans, get prize money for good sportive performance in a tournament and
improve its reputation in European football. If a club qualified for a European
Cup for the next year, then the variable is equal to 1, if not – 0. I found the data
on the official UEFA site (www.uefa.com/).
Qualification for UEFA Champions League for the next season (CLQ).
This variable has even more impact on efficiency than the previous one, because
UEFA Champions League is the strongest and most prestigious European
tournament for football clubs. Clubs which participate in that tournament get
many times more money as if they participated in UEFA Europa League. That is
why this variable reflects high expectations for the next football season for a
football club which qualified in that tournament. If a club qualified for UEFA
Champions League for the next year, then the variable is equal to 1, if not – 0.
The data was found on the official UEFA site (www.uefa.com/).
Prize money for sportive performance in a European Cup (PM) (£m).
This variable reflects financial success of a football club in a European Cup. A
football club receives Prize money for playing and further promoting to the nest
stage of a tournament. So, amount of Prize money is solely dependent on
sportive performance of a football club. The further a club goes in a tournament;
the more money it gets. That is why this variable is a very important indicator of
efficiency of a football club in the European Cups. The data was obtained from
the official reports published by UEFA yearly.
All the inputs and outputs for all 48 clubs are shown in Table 1.
Table 1. Football clubs’ inputs and outputs
SC MV CST EU
CL
REV
PGD ECQ
CLQ
PM
Fenerbahce 69 117,99 0,562 1 1 108 2,18 1 1 2,10
Galatasaray 97 133,67 0,562 1 1 74 1,91 1 1 14,60
Besiktas 49 88,50 0,562 1 0 49 1,82 1 1 0,00
Ajax 48 79,46 1,000 1 1 83 2,09 1 1 11,80
PSV 29 71,06 1,000 1 1 58 1,74 1 0 3,90
Benfica 63 180,34 0,627 1 1 85 2,47 1 1 16,60
Porto 49 135,60 0,627 1 1 58 2,03 1 1 11,60

INTERNATIONAL JOURNAL OF ENVIRONMENTAL & SCIENCE EDUCATION 7525
Real Madrid 269 454,95 0,241 1 1 490 2,29 1 1 36,90
Barcelona 248 465,26 0,241 1 1 443 2,29 1 1 20,50
Atletico Madrid 113 196,58 0,241 1 1 120 2,37 1 1 32,90
Valencia 58 135,49 0,241 1 0 85 1,29 0 0 4,60
Sevilla 59 110,33 0,241 1 0 56 1,66 1 0 9,60
Manchester United 263 383,81 0,159 1 1 474 1,68 0 0 21,00
Chelsea 230 437,23 0,159 1 1 346 2,16 1 1 24,90
Arsenal 199 249,53 0,159 1 1 331 2,08 1 1 18,20
Manchester City 246 359,25 0,159 1 1 382 2,26 1 1 17,10
Liverpool 172 204,38 0,159 0 0 306 2,21 1 1 0,00
Tottenham Hotspur 126 222,00 0,159 1 0 210 1,82 1 0 3,45
Everton 83 163,13 0,159 0 0 144 1,89 1 0 0,00
Newcastle United 93 141,64 0,159 0 0 155 1,29 0 0 0,00
Aston Villa 83 87,23 0,159 0 0 133 1,00 0 0 0,00
Fulham 82 111,26 0,159 0 0 110 0,84 0 0 0,00
Sunderland 83 113,44 0,159 0 0 125 1,00 0 0 0,00
Stoke City 73 94,50 0,159 0 0 118 1,32 0 0 0,00
West Bromwich 79 68,96 0,159 0 0 104 0,95 0 0 0,00
Swansey City 76 88,93 0,159 1 0 114 1,11 0 0 2,30
Bayern Munich 215 362,98 0,279 1 1 443 2,65 1 1 25,90
Schalke 04 114 140,21 0,279 1 1 190 1,88 1 1 17,70
Borussia D. 108 213,86 0,279 1 1 227 2,09 1 1 20,00
Hamburger SV 59 83,78 0,279 0 0 125 0,79 0 0 0,00
SV Werder Bremen 48 55,84 0,279 0 0 96 1,15 0 0 0,00
Hannover 96 36 62,66 0,279 0 0 77 1,24 0 0 0,00
TSG 1899 Hoffenheim
49 57,81 0,279 0 0 65 1,29 0 0 0,00
Paris Saint-Germain 244 278,18 0,386 1 1 407 2,34 1 1 20,50
Olympique de Marseille
80 110,74 0,386 1 1 97 1,58 0 0 8,60
Olympique Lyonnais 74 84,19 0,386 1 1 92 1,61 1 0 5,70
LOSC Lille 59 56,40 0,386 0 0 69 1,87 1 1 0,00
FC Girondins de Bordeux
48 47,51 0,386 1 0 53 1,39 0 0 1,50
Montpellier HSC 34 42,60 0,386 0 0 38 1,11 0 0 0,00
AC Milan 155 218,51 0,233 1 1 174 1,50 0 0 17,70
FC Inter Milan 117 204,60 0,233 0 0 155 1,58 1 0 0,00
Juventus FC 184 301,54 0,233 1 1 234 2,68 1 1 13,10
SSC Napoli 89 174,36 0,233 1 1 126 2,05 1 1 13,15
AS Roma 107 160,91 0,233 0 0 128 2,24 1 1 0,00
SS Lazio 52 120,99 0,233 1 0 75 1,47 0 0 2,60
ACF Fiorentina 75 166,95 0,233 1 0 78 1,71 1 0 3,00
Udinese Calcio 30 90,11 0,233 1 0 50 1,16 0 0 0,09
Genoa CFC 47 78,21 0,233 0 0 58 1,16 0 0 0,00
Results
The efficiency and super-efficiency measurement was conducted by using
EMS (Efficiency Measurement System) Data Envelopment Analysis Software.
This software can be downloaded for free (http://www.holger-scheel.de/ems/) and
very popular among researchers. The advantage of EMS is that it can measure
not only normal efficiency, but also super-efficiency for clubs which have

7526 A. V. PYATUNIN ET AL.
efficiency more than 1. The correlation between the variables and efficiency was
conducted by using Gretl software - open-source software for econometric
analysis (http://gretl.sourceforge.net/index.html).
We used the input-oriented model of DEA for efficiency measurement
because this model tries to find out how to improve the input characteristics of
the DMU concerned for it to become efficient, in other words, the model tries to
minimize inputs without changing outputs. It can be applied to football clubs’
efficiency, because a football club can not control the outputs which it wants to
achieve, even it has made some forecasts and plans for the future before the
start of a season; and many outputs which I used in my thesis can not be
increased constantly, growth for them is limited. For example, a football club
can not have points per a game more than 3 (because a win is awarded 3 points)
or to win Prize money for participating in UEFA Champions League more than
it is established by the rules of the tournament, or Qualification in a European
Cup for the next season would be equal to 1 for a club which spent for the staff
€300m or €30m. In contrast to outputs, most inputs can be controlled: a football
club can reduce spending on its staff or sell some players. That is why more
logical in this case to find the ways for increasing efficiency by reducing the
amount of inputs while achieving the same outputs. Input-oriented model of
DEA can be more useful in this case.
We used both Constant returns to scale (CRS) and Variable returns to scale
(VRS) models to find out scale effect and calculate scale efficiency.
The results for football clubs’ efficiency in 2014 are shown in Table 2.
Table 2. Football clubs’ efficiency results in 2014
Football clubs Cross Efficiency
Super Efficiency Normal Efficiency
CRS Rank
CRS Rank VRS CRS VRS Scale
Liverpool 0,824 1 2,616 3 big 1,000 1,000 1,000
LOSC Lille 0,780 2 2,853 2 2,853 1,000 1,000 1,000
Atletico Madrid 0,768 3 1,749 4 2,108 1,000 1,000 1,000
Real Madrid 0,739 4 1,331 8 big 1,000 1,000 1,000
Bayern Munich 0,724 5 1,092 24 big 1,000 1,000 1,000
Borussia D. 0,713 6 1,190 16 1,190 1,000 1,000 1,000
Everton 0,708 7 1,401 7 1,401 1,000 1,000 1,000
Sevilla 0,698 8 3,157 1 big 1,000 1,000 1,000
Arsenal 0,697 9 1,194 15 1,194 1,000 1,000 1,000 Schalke 04 0,690 10 1,232 11 1,232 1,000 1,000 1,000
AS Roma 0,658 11 1,198 14 big 1,000 1,000 1,000
Chelsea 0,641 12 1,186 17 1,186 1,000 1,000 1,000
Manchester City 0,630 13 1,089 25 1,197 1,000 1,000 1,000
Paris Saint-Germain 0,624 14 1,060 27 1,159 1,000 1,000 1,000
Barcelona 0,613 15 0,958 36 0,962 0,958 0,962 0,996
Tottenham Hotspur 0,611 16 1,186 18 1,186 1,000 1,000 1,000
SSC Napoli 0,608 17 1,139 20 1,139 1,000 1,000 1,000
Manchester United 0,585 18 1,243 10 1,443 1,000 1,000 1,000
Benfica 0,560 19 1,109 22 2,154 1,000 1,000 1,000 SV Werder Bremen 0,556 20 1,212 12 1,232 1,000 1,000 1,000
Hannover 96 0,554 21 1,272 9 1,274 1,000 1,000 1,000
Ajax 0,543 22 1,480 6 1,486 1,000 1,000 1,000

INTERNATIONAL JOURNAL OF ENVIRONMENTAL & SCIENCE EDUCATION 7527
Juventus FC 0,539 23 0,952 38 big 0,952 1,000 0,952
Stoke City 0,530 24 0,986 31 1,077 0,986 1,000 0,986
Aston Villa 0,513 25 0,982 32 1,053 0,982 1,000 0,982
Porto 0,512 26 1,139 19 1,139 1,000 1,000 1,000 FC Inter Milan 0,506 27 0,774 46 0,774 0,774 0,774 1,000
Besiktas 0,504 28 1,204 13 1,204 1,000 1,000 1,000
Newcastle United 0,501 29 0,915 39 1,000 0,915 1,000 0,915
Hamburger SV 0,488 30 1,074 26 1,094 1,000 1,000 1,000
ACF Fiorentina 0,482 31 0,904 41 0,904 0,904 0,904 1,000
Galatasaray 0,474 32 0,841 43 0,841 0,841 0,841 1,000
West Bromwich 0,467 33 0,958 37 1,165 0,958 1,000 0,958
Swansey City 0,453 34 1,031 28 1,106 1,000 1,000 1,000
TSG 1899 Hoffenheim
0,452 35 0,910 40 1,026 0,910 1,000 0,910
Sunderland 0,451 36 0,816 44 1,000 0,816 1,000 0,816
Fenerbahce 0,448 37 0,999 29 1,057 0,999 1,000 0,999
Valencia 0,422 38 0,977 33 0,999 0,977 0,999 0,977
AC Milan 0,421 39 0,730 47 0,809 0,730 0,809 0,902
Olympique Lyonnais 0,417 40 0,966 34 0,966 0,966 0,966 1,000
SS Lazio 0,401 41 0,962 35 0,966 0,962 0,966 0,996
Genoa CFC 0,399 42 0,858 42 1,026 0,858 1,000 0,858
Fulham 0,397 43 0,723 48 1,000 0,723 1,000 0,723
Montpellier HSC 0,376 44 0,997 30 1,342 0,997 1,000 0,997
PSV 0,374 45 1,655 5 1,655 1,000 1,000 1,000 FC Girondins de
Bordeux 0,365 46 1,102 23 1,214 1,000 1,000 1,000
Olympique de Marseille
0,340 47 0,804 45 0,819 0,804 0,819 0,981
Udinese Calcio 0,324 48 1,124 21 1,206 1,000 1,000 1,000
According to the Cross-efficiency results Liverpool (2nd in English Premier
League (the strongest championship in Europe), did not participate in the
European Cups), LOSC Lille (3rd in Ligue 1 with relatively weak inputs, did not
participate in the European Cups), Atletico Madrid (the winner of La Liga, the
finalist of UEFA Champions League). The worst performers are Udinese Calcio
(13th in Serie A, eliminated in the preliminary stage of UEFA Europa League),
Olympique de Marseille (6th in Ligue 1 with the relatively strong inputs, 4th in
the group stage of UEFA Champions League loosing all the matches), FC
Girondins de Bordeux (only 7th in Ligue 1, 4th in the group stage of URFA
Europa League). The Cross-efficiency results look very logical and they are more
trustworthy than Super-efficiency results. The Spearman's rank correlation
coefficient between them is good - 63,8%, but there is relatively a large number
of clubs with the big difference in the ranks for the Cross- and Super-efficiency,
such as Bayern Munich (Cross-efficiency rank -5th, Super-efficiency rank – 24th),
Barcelona (Cross-efficiency rank -15th, Super-efficiency rank – 36th), PSV (Cross-
efficiency rank -45th, Super-efficiency rank – 5th) and Ajax (Cross-efficiency rank
-22nd, Super-efficiency rank – 6th) and others. Super-efficiency results of those
clubs are very strange – Barcelona and Bayern Munich performed very good in
the national championships and in UEFA Champions League, earned much
revenues, but are only 36th and 24th respectively, while PSV did not even qualify
for UEFA Champions League having very strong squad for the Dutch
Championship and performed bad in the European Cups.
7528 A. V. PYATUNIN ET AL.
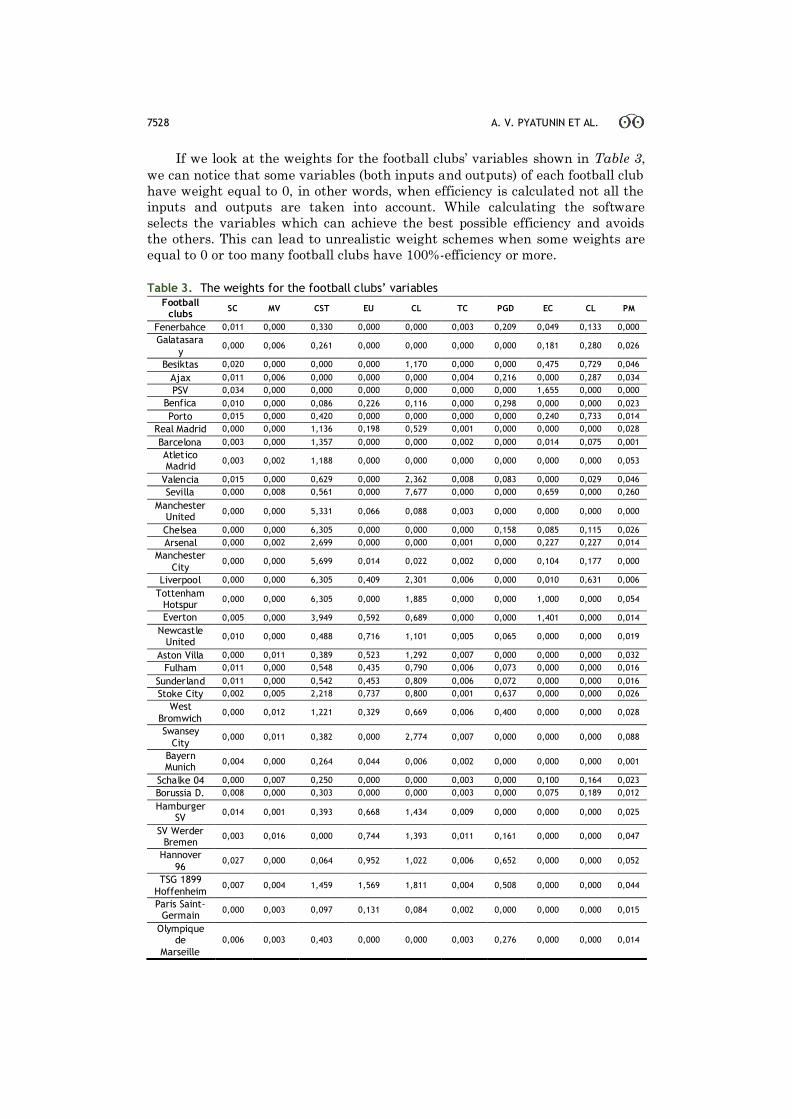
If we look at the weights for the football clubs’ variables shown in Table 3,
we can notice that some variables (both inputs and outputs) of each football club
have weight equal to 0, in other words, when efficiency is calculated not all the
inputs and outputs are taken into account. While calculating the software
selects the variables which can achieve the best possible efficiency and avoids
the others. This can lead to unrealistic weight schemes when some weights are
equal to 0 or too many football clubs have 100%-efficiency or more.
Table 3. The weights for the football clubs’ variables
Football clubs
SC MV CST EU CL TC PGD EC CL PM
Fenerbahce 0,011 0,000 0,330 0,000 0,000 0,003 0,209 0,049 0,133 0,000
Galatasara
y 0,000 0,006 0,261 0,000 0,000 0,000 0,000 0,181 0,280 0,026
Besiktas 0,020 0,000 0,000 0,000 1,170 0,000 0,000 0,475 0,729 0,046
Ajax 0,011 0,006 0,000 0,000 0,000 0,004 0,216 0,000 0,287 0,034
PSV 0,034 0,000 0,000 0,000 0,000 0,000 0,000 1,655 0,000 0,000
Benfica 0,010 0,000 0,086 0,226 0,116 0,000 0,298 0,000 0,000 0,023
Porto 0,015 0,000 0,420 0,000 0,000 0,000 0,000 0,240 0,733 0,014
Real Madrid 0,000 0,000 1,136 0,198 0,529 0,001 0,000 0,000 0,000 0,028
Barcelona 0,003 0,000 1,357 0,000 0,000 0,002 0,000 0,014 0,075 0,001
Atletico Madrid
0,003 0,002 1,188 0,000 0,000 0,000 0,000 0,000 0,000 0,053
Valencia 0,015 0,000 0,629 0,000 2,362 0,008 0,083 0,000 0,029 0,046
Sevilla 0,000 0,008 0,561 0,000 7,677 0,000 0,000 0,659 0,000 0,260
Manchester United
0,000 0,000 5,331 0,066 0,088 0,003 0,000 0,000 0,000 0,000
Chelsea 0,000 0,000 6,305 0,000 0,000 0,000 0,158 0,085 0,115 0,026
Arsenal 0,000 0,002 2,699 0,000 0,000 0,001 0,000 0,227 0,227 0,014
Manchester
City 0,000 0,000 5,699 0,014 0,022 0,002 0,000 0,104 0,177 0,000
Liverpool 0,000 0,000 6,305 0,409 2,301 0,006 0,000 0,010 0,631 0,006
Tottenham Hotspur
0,000 0,000 6,305 0,000 1,885 0,000 0,000 1,000 0,000 0,054
Everton 0,005 0,000 3,949 0,592 0,689 0,000 0,000 1,401 0,000 0,014
Newcastle United
0,010 0,000 0,488 0,716 1,101 0,005 0,065 0,000 0,000 0,019
Aston Villa 0,000 0,011 0,389 0,523 1,292 0,007 0,000 0,000 0,000 0,032
Fulham 0,011 0,000 0,548 0,435 0,790 0,006 0,073 0,000 0,000 0,016
Sunderland 0,011 0,000 0,542 0,453 0,809 0,006 0,072 0,000 0,000 0,016
Stoke City 0,002 0,005 2,218 0,737 0,800 0,001 0,637 0,000 0,000 0,026
West
Bromwich 0,000 0,012 1,221 0,329 0,669 0,006 0,400 0,000 0,000 0,028
Swansey
City 0,000 0,011 0,382 0,000 2,774 0,007 0,000 0,000 0,000 0,088
Bayern Munich
0,004 0,000 0,264 0,044 0,006 0,002 0,000 0,000 0,000 0,001
Schalke 04 0,000 0,007 0,250 0,000 0,000 0,003 0,000 0,100 0,164 0,023
Borussia D. 0,008 0,000 0,303 0,000 0,000 0,003 0,000 0,075 0,189 0,012
Hamburger SV
0,014 0,001 0,393 0,668 1,434 0,009 0,000 0,000 0,000 0,025
SV Werder Bremen
0,003 0,016 0,000 0,744 1,393 0,011 0,161 0,000 0,000 0,047
Hannover
96 0,027 0,000 0,064 0,952 1,022 0,006 0,652 0,000 0,000 0,052
TSG 1899
Hoffenheim 0,007 0,004 1,459 1,569 1,811 0,004 0,508 0,000 0,000 0,044
Paris Saint-Germain
0,000 0,003 0,097 0,131 0,084 0,002 0,000 0,000 0,000 0,015
Olympique de
Marseille
0,006 0,003 0,403 0,000 0,000 0,003 0,276 0,000 0,000 0,014

INTERNATIONAL JOURNAL OF ENVIRONMENTAL & SCIENCE EDUCATION 7529
Olympique Lyonnais
0,005 0,006 0,438 0,000 0,000 0,002 0,000 0,654 0,000 0,027
LOSC Lille 0,000 0,018 0,000 1,412 1,373 0,000 0,000 1,743 1,110 0,075
FC Girondins
de Bordeux
0,000 0,021 0,000 0,000 2,344 0,008 0,328 0,000 0,000 0,136
Montpellier
HSC 0,025 0,003 0,000 0,856 1,141 0,000 0,898 0,000 0,000 0,071
AC Milan 0,000 0,003 0,487 0,120 0,043 0,002 0,000 0,000 0,000 0,021
FC Inter Milan
0,006 0,001 0,000 0,314 0,541 0,004 0,000 0,183 0,000 0,011
Juventus
FC 0,001 0,000 3,201 0,000 0,000 0,000 0,330 0,000 0,018 0,004
SSC Napoli 0,006 0,000 1,818 0,000 0,000 0,001 0,000 0,258 0,788 0,002
AS Roma 0,005 0,000 1,953 0,323 0,687 0,000 0,388 0,000 0,330 0,013
SS Lazio 0,014 0,000 1,119 0,000 1,464 0,004 0,425 0,000 0,068 0,019
ACF
Fiorentina 0,007 0,000 2,045 0,000 0,447 0,000 0,000 0,904 0,039 0,000
Udinese
Calcio 0,028 0,000 0,699 0,000 1,278 0,000 0,967 0,000 0,000 0,022
Genoa CFC 0,013 0,000 1,493 1,017 0,806 0,000 0,739 0,000 0,000 0,037
For example, PSV’s Country strength coefficient variable’s weight is equal
to 0, but this variable indicates how easy to get points in the championship and
qualify for the European Cups. Given that the Dutch championship was the
weakest in 2014, while measuring the efficiency good ratio of points/games was
not offset by the weakness of the championship. All the clubs in 2014 have some
weights equal to 0, but in different combinations. That is why some clubs have
unrealistic weights and this situation leads to unrealistic efficiency results for
them. If we look at the Cross-efficiency results, we can notice that there are no
strange or illogical results for any football club, all the results correspond to the
variables.
As mentioned above, one of the aims of our paper was to compare Cross-
efficiency and Normal- (Super-) efficiency results and check whether the Cross-
efficiency method is more logical by providing an ordering among football clubs
by eliminating unrealistic weight schemes. Given that disadvantage of normal
DEA and based on logical reasoning (by comparing the Cross- and Super-
efficiency for all the football clubs), we conclude that the results for Cross-
efficiency look more logical with taking into account all the variables given. DEA
Cross-efficiency method really eliminates unrealistic weight schemes, which can
occur if a researcher uses simple DEA method.
If we look at Table 2 we can see that the richest and strongest third part of
48 clubs (16 top clubs such as Real Madrid, Barcelona, Bayern and others) are
more efficient than others. It can be explained by the fact that with the help of
the strongest inputs they achieve high (expected) results more consistently: they
finish almost always in top 4 of the national championships (with rare
exceptions), participate in UEFA Champions League and their revenues
continue to grow (also with rare exceptions). The most vulnerable part of their
performance was only participation in the European Cups because unlike the
national championships where all the points are taken into account for
determining the winner, in the European Cups, there is a playoff system, which
introduces an element of randomness and performance of football clubs much
depends on the sportive form of the clubs at that particular moment. However,
even if a top club does not perform well in the European Cups, its revenues will
7530 A. V. PYATUNIN ET AL.
not drop dramatically because, besides this source of revenues, there are many
other sources of revenues for a top club, which will not be much affected by the
poor performance in the European Cups. Of course, there are always exceptions
like extremely inefficient FC Inter Milan or AC Milan, which even with very
strong inputs did not perform well nor in Serie A, or in the European Cups.
Moreover, it is important to point out that some clubs, which strongly
dominate in their national championships, like Real Madrid and Barcelona in
Spain, Paris Saint-Germain in France, the strongest clubs from Portugal,
Netherlands, and Turkey, even if they win the championships, they are not the
most efficient clubs because of the excess of the inputs. Their inputs are stronger
than enough to be very successful on the national level. However, the reason
why these clubs continue this situation is mainly because they want to be
successful on the European level where the competitors are much stronger. And
if such a club is successful in the European Cups too, then its efficiency is very
good (Real Madrid, Barcelona), otherwise their efficiency can decrease much
(Fenerbahce, Besiktas, PSV, and Ajax).
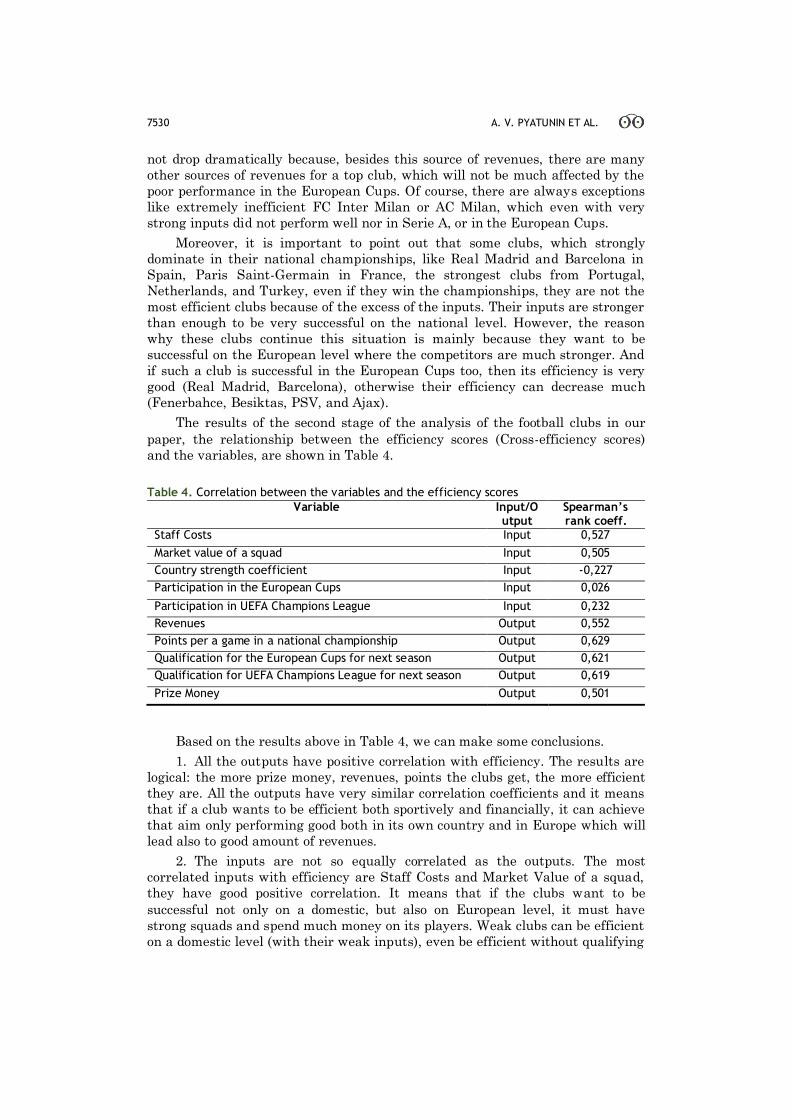
The results of the second stage of the analysis of the football clubs in our
paper, the relationship between the efficiency scores (Cross-efficiency scores)
and the variables, are shown in Table 4.
Table 4. Correlation between the variables and the efficiency scores
Based on the results above in Table 4, we can make some conclusions.
1. All the outputs have positive correlation with efficiency. The results are
logical: the more prize money, revenues, points the clubs get, the more efficient
they are. All the outputs have very similar correlation coefficients and it means
that if a club wants to be efficient both sportively and financially, it can achieve
that aim only performing good both in its own country and in Europe which will
lead also to good amount of revenues.
2. The inputs are not so equally correlated as the outputs. The most
correlated inputs with efficiency are Staff Costs and Market Value of a squad,
they have good positive correlation. It means that if the clubs want to be
successful not only on a domestic, but also on European level, it must have
strong squads and spend much money on its players. Weak clubs can be efficient
on a domestic level (with their weak inputs), even be efficient without qualifying
Variable Input/Output
Spearman’s rank coeff.
Staff Costs Input 0,527
Market value of a squad Input 0,505
Country strength coefficient Input -0,227
Participation in the European Cups Input 0,026
Participation in UEFA Champions League Input 0,232
Revenues Output 0,552
Points per a game in a national championship Output 0,629
Qualification for the European Cups for next season Output 0,621
Qualification for UEFA Champions League for next season Output 0,619
Prize Money Output 0,501

INTERNATIONAL JOURNAL OF ENVIRONMENTAL & SCIENCE EDUCATION 7531
for the European Cups, but when we consider all possible tournaments and ways
of earning revenues, not participating in the European Cups decreases efficiency
of a football club. That is why stronger clubs are more efficient than the weak
ones, of course with some exceptions (we can see it in Table 2).
3. Participation in UEFA Champions League input have quite weak positive
correlation. It means that participation UEFA Champions League has positive
effect on efficiency, but only the fact of participation in them does not mean that
the club is efficient.
4. Participation in the European Cups input does not correlate with
efficiency. It means that only fact of participation in the European Cups does not
lead a football club to efficiency. To be efficient, a football club must perform well
in any tournament.
5. Country strength coefficient input has weak negative correlation with
efficiency. It means that the stronger championship a football club from (input
has less value in this case), the more this club is efficient. It quite well
corresponds to Staff Costs and Market Value of a squad correlations results
because the strongest and richest clubs (which are more Total efficient than the
weakest clubs) play in the strongest championships.
Discussions
Nowadays understanding of football economy is becoming more important.
In the economic literature many researches are devoted to the analysis of the
efficiency of professional football club as business unit. The variety of tools of
economic analysis provides the assessment of the clubs’ efficiency from different
points of view (Kulikova & Goshunova, 2013).
In terms of objects of study, most researches analyzed English football
clubs. The popularity of choosing English football clubs as objects of analysis is
mainly because they were the first ones floated on the stock market and
therefore, there is a lot of publicly available information about them. The
Premier League is the most popular football league in the world, that many
strong clubs and players play in. Also there are several researches of football
clubs from Spain, mainly because football super clubs Real Madrid and
Barcelona and some other strong clubs play in this country, and the information
needed for analysis is also available. There are not so many researches from
another particular country conducted, only 1-2 researches for each country:
Germany, France, Brazil, Denmark, Iran, Japan, India, Turkey, Greece,
Portugal, Norway, Netherlands. There are only a few researches about football
clubs not from one, but from several countries.
In terms of methods of study, the researches used parametric or non-
parametric methods (more often). Non-parametric methods were used by
different authors such as A.S. Ribeiro & F. Lima (2012), C. Barros & J. Douvis
(2009), F. Gonzalez-Gomez (2010), C. Barros & P. Garcia-del-Barrio (2008), P.
Dawson & S. Dobson (2002), B. Frick & R. Simmons (2007), I. Garcia-Sanchez
(2007), I. Guzman & S. Morrow (2007), L. Kulikova & A. Goshunova (2013,
2014), D. Haas (2003), G. Halkos & N. Tzeremes (2011), M. Jardin (2009), M.
Kern & B. Sussmuth (2003), J. Soleimani-Damaneh, M. Hamidi & N. Sajadi, L.
(2011), Garcia-Cebrian & M. Espitia-Escuer (2004, 2014, 2015a, 2015b), D. Zhao
(2013).

7532 A. V. PYATUNIN ET AL.
In the literature, researchers consider the efficiency of football club from
different points of view- according to the aims of football clubs. The are two main
approaches are developed to study the efficiency of a football club in the
scientific literature: evaluation of pure economic (or financial) efficiency and
evaluation of pure sportive efficiency. Also, there are some researches, which
combine evaluation both financial and sportive efficiencies.
Some of the variables used in our paper (like points per a game, revenues,
staff costs) are widely used in other researches, but many of the variables used
in our paper not used by others. There are no researches on football clubs’
efficiency, which include measurement efficiency using DEA Super-efficiency or
DEA Cross-efficiency. Also, there are many researches, which include
measurement of correlation between two or more variables, but not between
variables and efficiency scores.
In our paper we combined different interesting methods and ideas on
football clubs’ efficiency and it makes it unique and relevant.
Conclusion
Summing up the results, we can make some important conclusions.
The use of simple DEA method for the football clubs’ measurement proved
to be effective, but the known disadvantages of this method were also
discovered. DEA Cross-efficiency method really improved the results of simple
DEA method by eliminating unrealistic weights for the variables, the results are
logical, reasonable. The efficiency results showed that richest clubs more
efficient than the poor clubs, because they have access to all the tournaments
and sources of revenues, which help them to be efficient in the future even if
they don’t perform good in one particular season.
Also, some clubs, which strongly dominate in their national championships,
like Real Madrid and Barcelona in Spain, Paris Saint-Germain in France, the
strongest clubs from Portugal, Netherlands, and Turkey, even if they win the
championships, they are not the most efficient clubs because of the excess of the
inputs. Their inputs are stronger than enough to be very successful on the
national level. However, the reason why these clubs continue this situation is
mainly because they want to be successful on the European level where the
competitors are much stronger. And it is important for them to find the balance
of remaining dominant in the national championships and being successful in
Europe with the least possible inputs.
The results of the correlation analysis are also logical and showed that for
being efficient, football clubs must succeed in all areas of activity: domestic,
European competitions, finance. As for the inputs, the correlation results for
Staff Costs and Market Value confirmed the conclusions that richest clubs are
more efficient: the stronger these inputs, the more efficient football clubs.
Thus, we can make a conclusion that these methods proved to be useful and
informative regarding football clubs’ efficiency measurement. Our paper will be
interesting for football clubs’ managers, football analytics, economists and other
people interested in football business.
Disclosure statement
No potential conflict of interest was reported by the authors.

INTERNATIONAL JOURNAL OF ENVIRONMENTAL & SCIENCE EDUCATION 7533
Notes on contributors
Aleksey V. Pyatunin is Graduate Studentof Samara State Universiry of
Economics, Samara, Russia.
Angelina B. Vishnyakova is Associate professor of Samara State Universiry of Economics, Samara, Russia.
Natalia L. Sherstneva is Associate professor of Samara State Universiry of
Economics, Samara, Russia.
Svetlana P. Mironova is Associate professor of Russian State Vocational
Pedagogical University, Ekaterinburg, Russia.
Sergey A. Dneprov is Professor of Russian State Vocational Pedagogical University, Ekaterinburg, Russia.
Yuriy P. Grabozdin is Senior Lecturer of. Samara State University of Social
Sciences and Education, Samara, Russia.
References
Andersen, P. & Petersen, N. (1993). A Procedure for Ranking Efficient Units in Data Envelopment
Analysis. Management Science, 39(10), 132-143.
Andersen, T., Hollingsworth, K. & Inman, L. (2002). The fixed weighting nature of a cross-evaluation
model. Journal of Productivity Analysis,1, 249-255.
Banker, R., Charnes, A. & Cooper, W. (1984). Some Models for Estimating Technical and Scale
Inefficiencies in Data Envelopment Analysis. Management Science, 30, 1078-1092.
Barros, C. & Douvis, J. (2009). Comparative analysis of football efficiency among two small
European countries: Portugal and Greece . International Journal of Sport Management and
Marketing, 6, 183-199.
Barros, C. & Garcia-del-Barrio, P. (2008). Efficiency Measurement of the English Football Premier
League with a Random Frontier Model. Economic Modelling, 25, 994-1002.
Charnes, A., Cooper, W. & Rhodes, E. (1978). Measuring the efficiency of decision making units.
European Journal of Operational Research, 2, 429-444.
Coelly, T., Prasada Rao, D., O'Donnel, C. & Battese, G. (2005).An Introduction to Efficiency and
Productivity Analysis. New York: Springer, 242 p.
Cook, D. & Zhu, J. (2015).Data Envelopment Analysis. New York: Springer, 364 p.
Cooper, W., Seiford, L. & Tone, K. (2000).Data Envelopment Analysis: A Comprehensive Text with
Models, Applications, References and DEA- Solver Software. Norwell, Massachusetts: Kluwer
Academic Publishers, 311 p.
Dawson, P. & Dobson, S. (2002). Managerial efficiency and human capital: an application to English
association football. Managerial and Decision Economics, 23, 471-486.
Deloitte. (2016).Deloitte Football Money League 2016.Direct access:
http://www2.deloitte.com/uk/en/pages/sports-business-group/articles/deloitte-football-money-
league.html
Espitia-Escuer, M. & García-Cebrián, L. (2004). Measuring the Efficiency of Spanish First-Division
Soccer Teams. Journal of Sports Economics, 5, 329-346.
Espitia-Escuer, M. & García-Cebrián, L. (2014). Comparison of efficiency measures for Spanish first
division football teams using data envelopment and stochastic frontier analyses. Atlantic
Review of Economics, 2, 66-74.
Espitia-Escuer, M. & García-Cebrián, L. (2015a).Organisational Design Factors and the Efficiency of
Spanish First Division Football Teams. Direct access:
https://zaguan.unizar.es/record/47391/files/texto_completo.pdf
Espitia-Escuer, M. & García-Cebrián, L. (2015b).Technical progress and efficiency changes in football
teams participating in the UEFA Champions League.Direct access::
https://zaguan.unizar.es/record/47390/files/texto_completo.pdf
Faere, R. & Lovell, C. (1978). Measuring the technical efficiency of production. Journal of Economic
Theory, 19, 150-162.
7534 A. V. PYATUNIN ET AL.
Faere, R., Grosskopf, S. & Logan, J. (1983). The Relative Efficiency of Illinois Electric Utilities.
Resources and Energy, 5, 349-367.
Farrel, M. (1957). The Measurement of Productive Efficiency. Journal of Royal Statistical Society,
120, 253-290.
Frick, B. & Simmons, R. (2007). The Impact of Managerial Quality on Organizational Performance:
Evidence from German Soccer. Working Paper Series,3, 1-20.
Garcia-Sanchez, I. (2007). Efficiency and effectiveness of Spanish football teams: a three- stage-DEA
approach. Central European Journal of Operations Research, 15, 21-45.
González-Gómez, F. (2010).Can we be satisfied with our football team? Evidence from Spanish
professional football. Direct access: http://www.ugr.es/~teoriahe/RePEc/gra/wpaper/thepape-
s08_11.pdf
Guzman, I. & Morrow, S. (2007). Measuring efficiency and productivity in professional football
teams: evidence from the English Premier League. Central European Journal of Operations
Research, 15, 309-328.
Guzman, I. (2006). Measuring Efficiency and Sustainable Growth in Spanish Football Teams.
European Sport Management Quarterly, 6, 267-287.
Haas, D. (2003). Productive efficiency of English 16. football teams-a data envelopment analysis
approach. Managerial and Decision Economics, 24, 403-410.
Haas, D., Kocher, M. & Sutter, M. (2004). Measuring Efficiency of German Football Teams by Data
Envelopment Analysis. Central European Journal of Operations Research, 12, 251-268.
Halkos, G. & Tzeremes, N. (2011). A non-parametric analysis of the efficiency of the top European
football clubs. Direct access: https://mpra.ub.uni-muenchen.de/31173/1/MPRA_paper_311-
73.pdf
Jardin, M. (2009).Efficiency of French football clubs and its dynamics.Direct access:
https://mpra.ub.uni-muenchen.de/19828/
Karaduman, A. (2006).Data Envelopment Analysis and Malmquist Total Factor Productivity (TFP)
Index: An application to Turkish automotive industry.Direct access:
https://etd.lib.metu.edu.tr/upload/12607821/index.pdf
Kern, M. & Su ssmuth, B. (2003).Managerial Efficiency in German Top League Soccer. Direct access:
https://epub.ub.uni-muenchen.de/5/
Koopmans, T. (1951).An analysis of production as an efficient combination of activities.London: John
Wiley and Sons, 352 p.
Kulikova, L. & Goshunova, A. (2013). Measuring Efficiency of Professional Football Club in
Contemporary Researches. World Applied Sciences Journal, 25, 247-257.
Kulikova, L. & Goshunova, A. (2014). Efficiency measurement of professional football clubs: a non-
parametric approach. Life Science Journal, 11, 117-122.
Lukinova, O.A., Smarchkova, L.V. & Pisarenko, N.D. (2014). Assessment and management of social
and economic efficiency of activity of economic agents. Vestnik Samara State University of
Economics, 12(122), 74-78.
Ribeiro, A. & Lima, F. (2012). Portuguese football league efficiency and players' wages. Applied
Economics Letters, 19, 599-602.
Soleimani-Damaneh, J., Hamidi, M. & Sajadi, N. (2011). Evaluating the Performance of Iranian
Football Teams Utilizing Linear Programming. American Journal of Operations Research, 1,
65-72.
Yawe, B. (2010). Hospital Performance Evaluation in Uganda: A Super-Efficiency Data Envelope
Analysis Model. Zambia Social Science Journal, 1, 153-165.
Zhao, D. (2013). Measuring Technical Efficiency of the Japanese Professional Football.Direct access:
http://scholarcommons.usf.edu/cgi/viewcontent.cgi?article=6168&context=etd


