financial analysis of football clubs
TRANSCRIPT


Comparative Balance Sheet
ParticularsAssets
1. Non current Assets
2. Current Assets
Total Assets
Liabilities1. Equity
2. Non current liabilities
3. Current liabilities
Total Liabilities

ARSENAL HOLDINGS PLC
COMPARITIVE INCOME STATEMENT
Operating Profit(Loss)
Profit on Ordinary items before finance charges (EBIT
Profit on Ordinary items before tax
charges ((EBT)
Profit After Tax retained for the current
year (EAT)

Arsenal Holdings PLC
Cash flows summary
Particulars
Net cash flows from
operating activities
Net cash flows from
Investing activities
Net cash flow from
financing activities
Cash and cash
equivalents at the
start of period
Change in cash and
cash equivalents
Cash and cash
equivalents at the
end of year

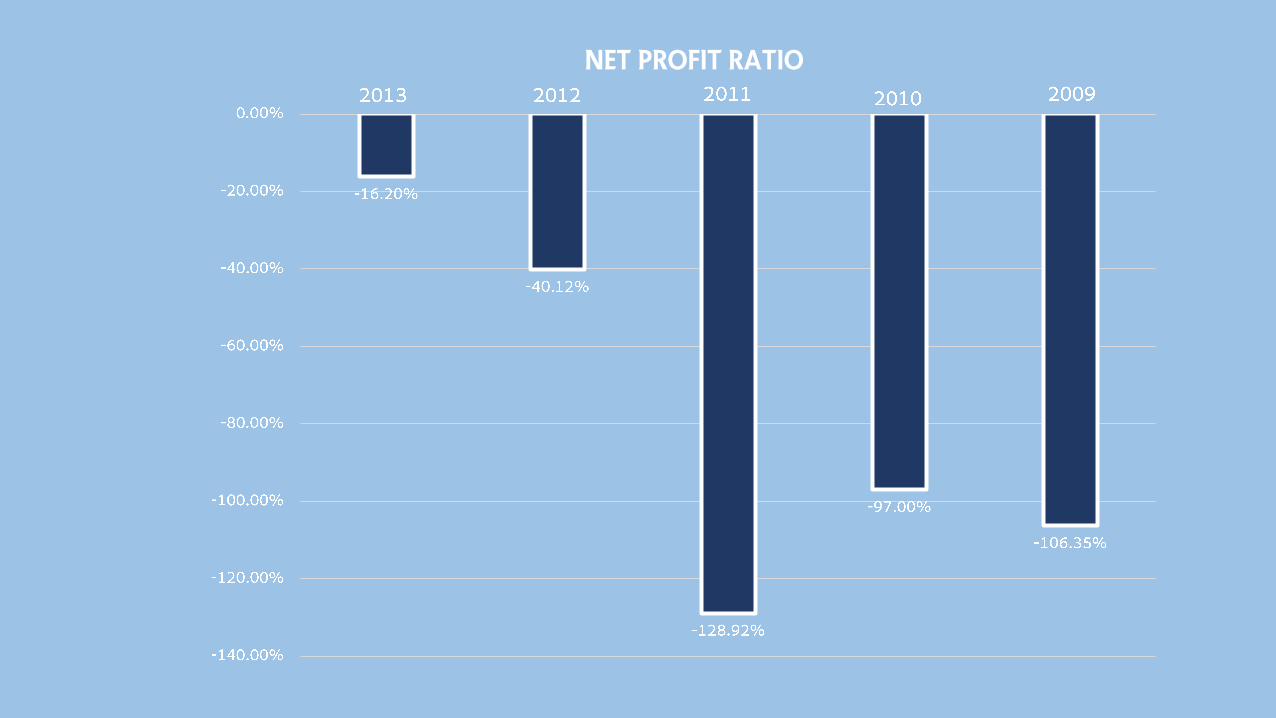
Net Profit Ratio

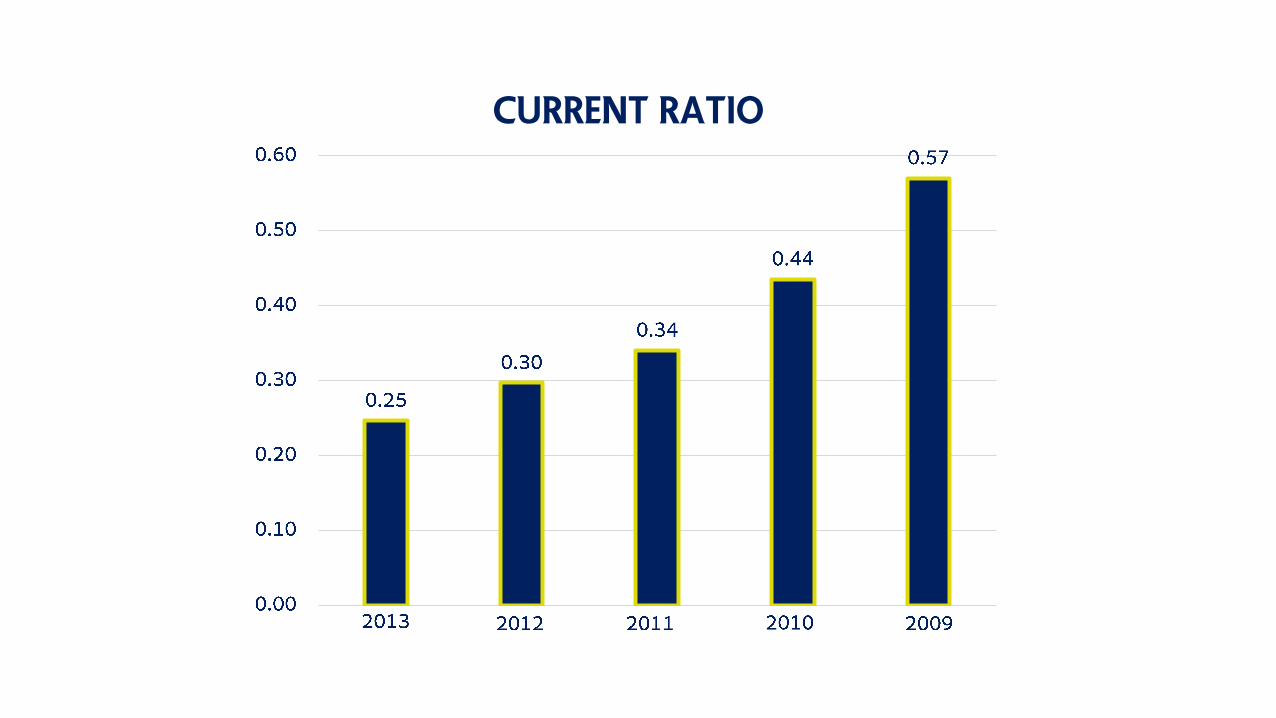
Current Ratio

Debt-Equity Ratio


EVERTON FC COMPANY LIMITEDComparative balance sheet
PARTICULARS
ASSETS1. Non Current Assets
2. CURRENT ASSETS
TOTAL ASSETS
liabilities1. Equity
2. NON CURRENT LIABILITIES
3 .CURRENT LIABILITIES
TOTAL LIABILITIES

EVERTON FC COMPANY LIMITED
COMPARATIVE INCOME STATEMENT
particulars
TURNOVER
OPERATING EXPENSES
OPERATING PROFIT LOSS
PROFIT ON DISPOSAL OF PLAYERS’ REGISTRATIONS
PROFIT ON DISPOSAL OF TANGIBLE FIXED ASSETS
PROFIT LOSS) BEFORE INTEREST AND TAXATION
INTEREST RECEIVABLE AND SIMILAR INCOME
INTEREST PAYABLE AND SIMILAR Charges
PROFIT LOSS) ON ORDINARY ACTIVITIES BEFORE
TAXATION
TAX ON PROFIT LOSS) ON ORDINARY ACTIVITIES
PROFIT LOSS) AFTER TAXATION

EVERTON FC COMPANY LIMITED.
CASH FLOW SUMMARY
Particulars
Net cash flows from
operating activities
Net cash flows from investing activities
Net cash flow from financing activities
Change in cash equivalents during year *

Net Profit Ratio

Debt Equity Ratio

Current Ratio


Comparative Balance Sheet
Assets
1.Non current Assets
2.Current Assets
Total Assets
Liabilities
1. Equity
2. Non current liabilities
3. Current liabilities
Total Liabilities

TOTTENHAM HOTSPUR PLC
Comparative income statement
Particulars
Revenue
Operating expenses
Operating profit loss
Profit on disposal of intangible fixed
assets
Profit loss) from operations
Finance income
Finance cost
Profit loss) on ordinary activities before
taxation
Tax
Profit loss) for the year

TOTTENHAM HOTSPURS PLC
Cash flows summary
Particulars
Net cash flows from
operating activities
Net cash flows from
investing activities
Net cash flow from
financing activities
Cash and cash equivalents
at the start of period
Change In cash and cash
equivalents
Cash and cash equivalents
at the end of year

Net Profit Ratio

Debt Equity Ratio
Current Ratio


COMPARATIVE BALANCE SHEET
Particulars
Assets1.Non current Assets
2.Current Assets
Total Assets
Liabilities1. Equity
2. Non current liabilities
3. Current liabilities
Total Liabilities

MANCHESTER CITY LIMITED.
Comparative Income Statement
Particulars
Revenue
Operating expenses
Operating profit loss
Profit loss) on disposal of players
Profit loss) before interest and taxation
Interest receivable and similar income
Interest payable and similar charges
Stadium finance lease charges
Profit loss) on ordinary activities before
taxation
Tax
Profit loss) for the year

MANCHESTER CITY LIMITED.
Cash flows summary
Particulars
Net cash flows from
operating activities
Net cash flows from
investing activities
Net cash flow from
financing activities
Cash and cash equivalents
at the start of period
Total change in cash and
cash equivalents during the
year
Cash and cash equivalents
at the end of year
Net Profit Ratio

Current Ratio

Debt Equity Ratio


Profit After Tax
Profit After Tax (‘ 000)

Degree of Operating Leverage
Degree Of Operating Leverage

Degree Of Financial Leverage
2013 2012 2011 2010
Degree of Financial Leverage

Defensive interval ratio (in days)
2013 2012 2011 2010 2009
Defensive Interval Ratio

Net Profit Ratio
Net Profit Ratios

Cash Flow from operations ratio
Cash Flow from Operations Ratio

Turnovers (in £’000)
Turnover


