Targets and potentials in leading wind power markets
Jacopo MocciaMember State LiaisonEuropean Wind Energy Association 21 April 2010
Outline
• 2009 installations• Cumulative analysis• Targets and potentials in
– France– Spain– Sweden
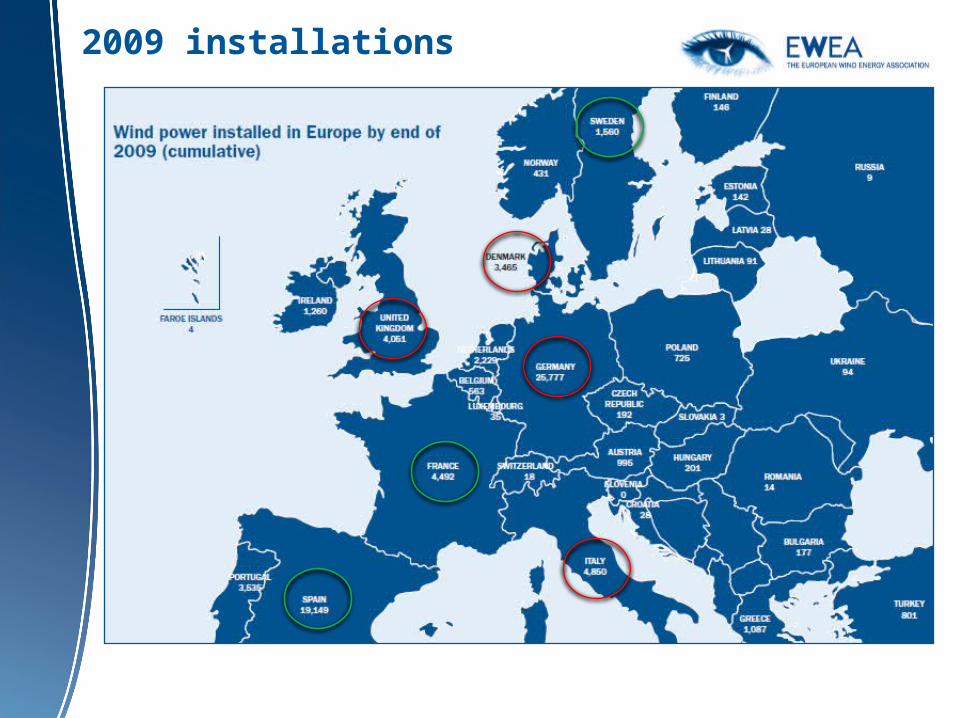
2009 installations

2009 installations
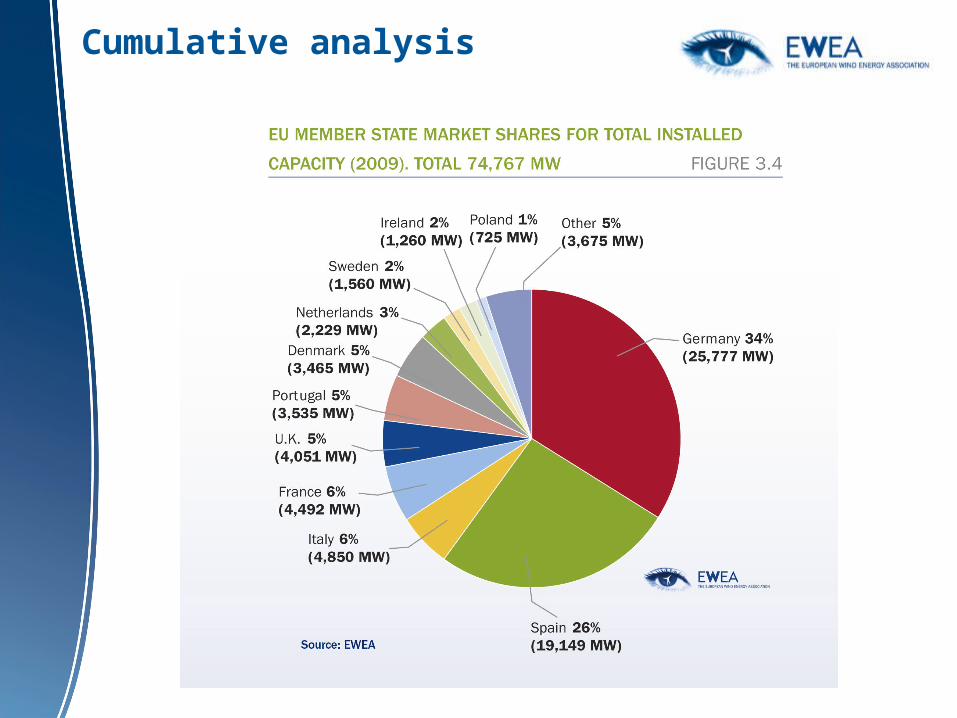
Biggest EU markets:
Cumulative:n°1 Germanyn°2 Spainn°3 Italyn°4 Francen°5 United Kingdomn°6 Portugaln°7 Denmarkn°8 Swedenn°9 Ireland
Annual (2009):n°1 Spainn°2 Germanyn°3 Italyn°4 Francen°5 United Kingdomn°6 Portugaln°7 Swedenn°8 Denmarkn°9 Ireland
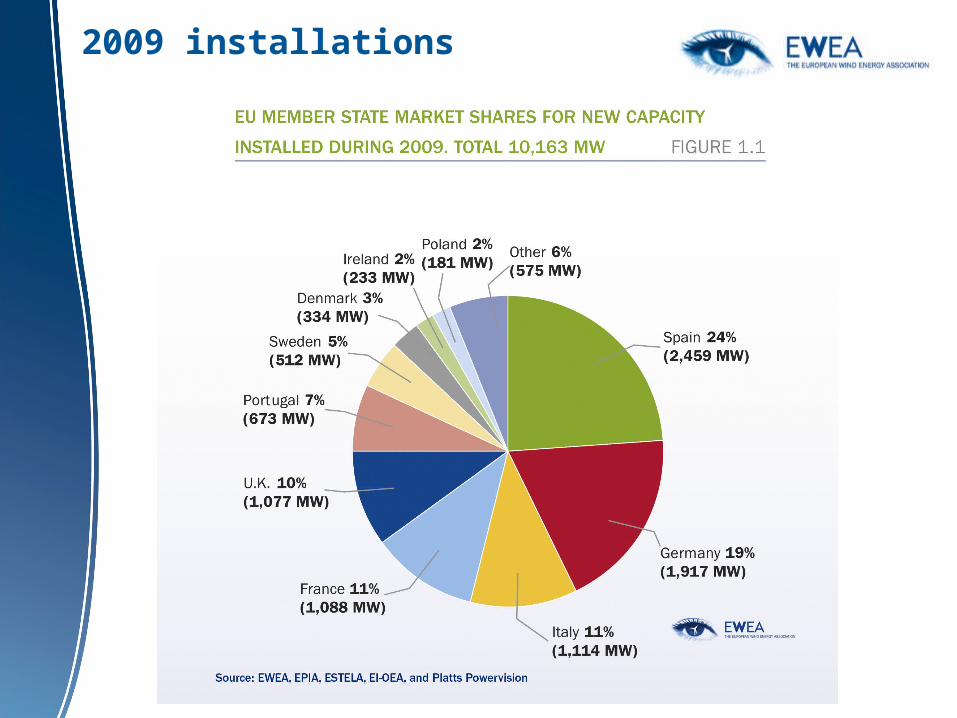
2009 installations
Cumulative analysis
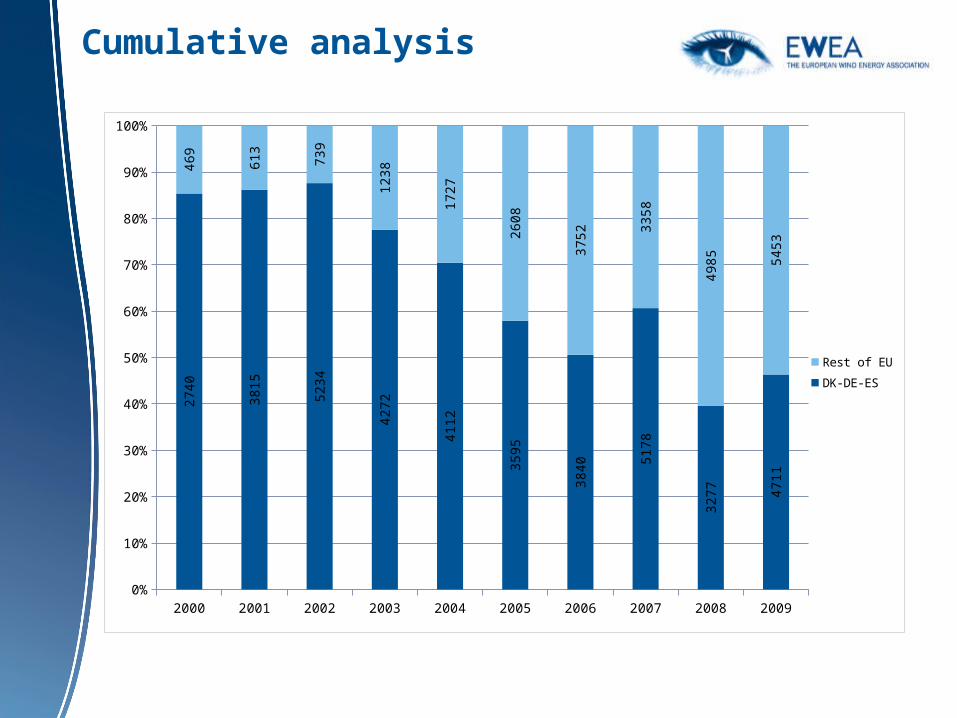
Cumulative analysis
2000 2001 2002 2003 2004 2005 2006 2007 2008 20090%
10%
20%
30%
40%
50%
60%
70%
80%
90%
100%
2740
3815
5234
4272
4112
3595
3840
5178
3277 47
11
469
613
739
1238
1727
2608
3752
3358
4985 54
53
Rest of EUDK-DE-ES
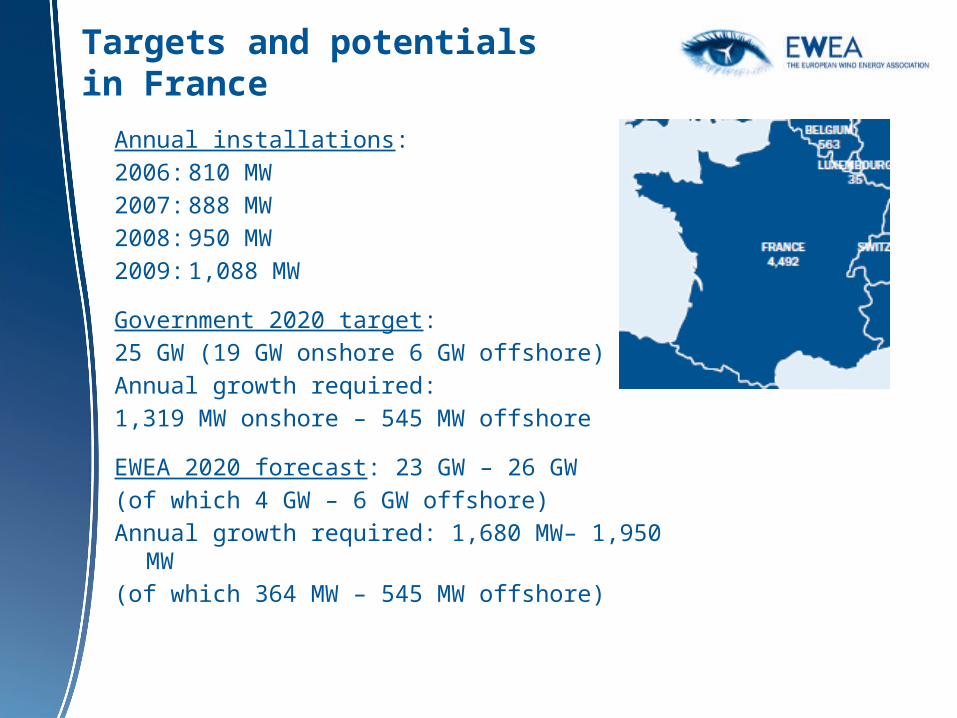
Targets and potentials in France
Annual installations:2006: 810 MW2007: 888 MW2008: 950 MW2009: 1,088 MW
Government 2020 target: 25 GW (19 GW onshore 6 GW offshore)Annual growth required: 1,319 MW onshore – 545 MW offshore
EWEA 2020 forecast: 23 GW – 26 GW(of which 4 GW – 6 GW offshore)Annual growth required: 1,680 MW– 1,950
MW(of which 364 MW – 545 MW offshore)
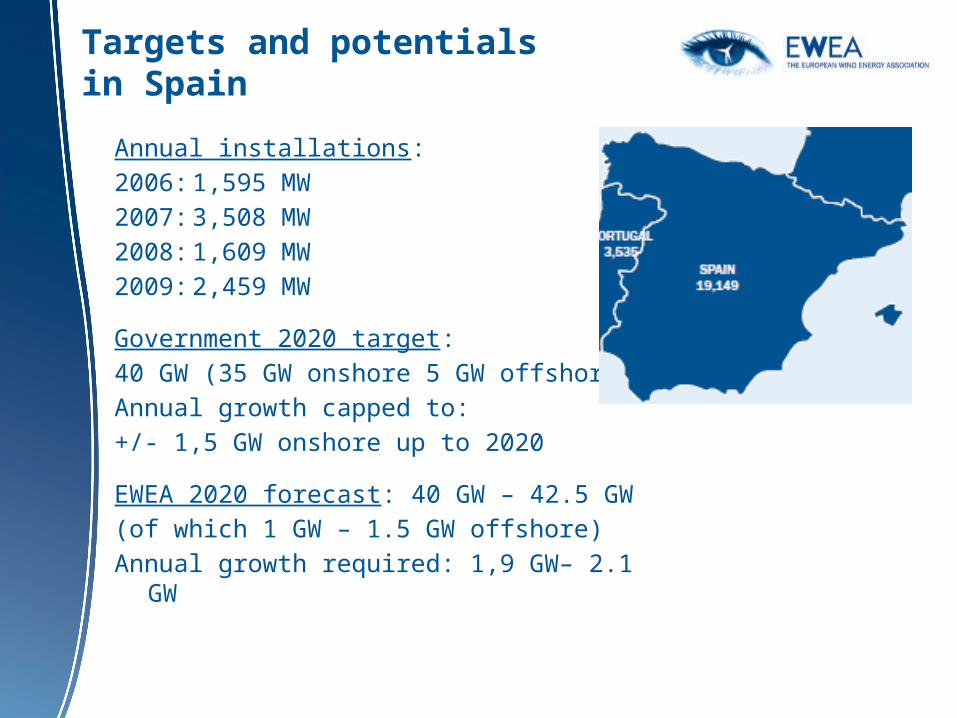
Targets and potentials in Spain
Annual installations:2006: 1,595 MW2007: 3,508 MW2008: 1,609 MW2009: 2,459 MW
Government 2020 target: 40 GW (35 GW onshore 5 GW offshore)Annual growth capped to: +/- 1,5 GW onshore up to 2020
EWEA 2020 forecast: 40 GW – 42.5 GW(of which 1 GW – 1.5 GW offshore)Annual growth required: 1,9 GW– 2.1 GW
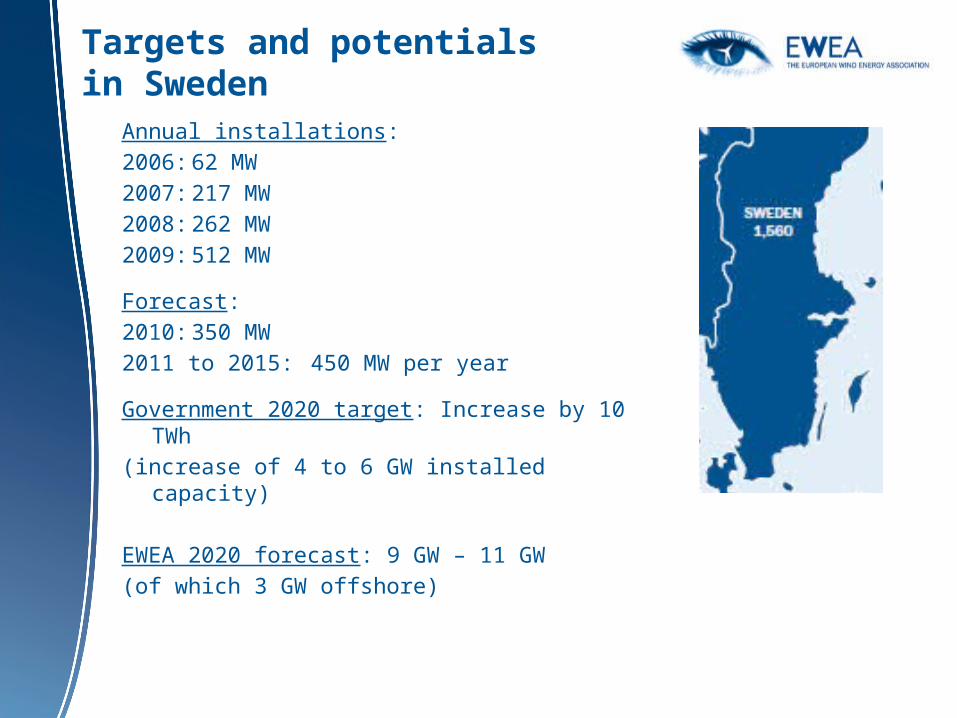
Targets and potentials in Sweden
Annual installations:2006: 62 MW2007: 217 MW2008: 262 MW2009: 512 MW
Forecast:2010: 350 MW2011 to 2015: 450 MW per year
Government 2020 target: Increase by 10 TWh
(increase of 4 to 6 GW installed capacity)
EWEA 2020 forecast: 9 GW – 11 GW(of which 3 GW offshore)
Thank You
www.ewea.org
RENEWABLE ENERGY HOUSE63-65 RUE D’ARLONB-1040 BRUSSELS
T: +32 2 546 1940F: +32 2 546 1944E: [email protected]


