
Strategic Planning Session
Fourth Quarter – Fiscal Year 2014
April – June 2014
AGENDA
Fiscal Year 2014 Accomplishments
Employee Satisfaction Survey Action Plans
Strategic Planning Metrics and Actions Plans
Fiscal Year 2015 Challenges
Look Ahead
Facilities Management
…Creating a Campus of Distinction
Strategic Planning Session
Fourth Quarter – Fiscal Year 2014
April – June 2014
Goal 1 - Continuously Improve Operation of Campus Facilities
Goal 2 - Create a Reliable and Sustainable Physical Infrastructure
Goal 3 - Foster a Customer Focused Organization
Goal 4 - Recruit, Develop, and Retain Quality Employees
Goal 5 - Promote Good Stewardship
Facilities Management
…Creating a Campus of Distinction
Facilities Management …Creating a Campus of Distinction
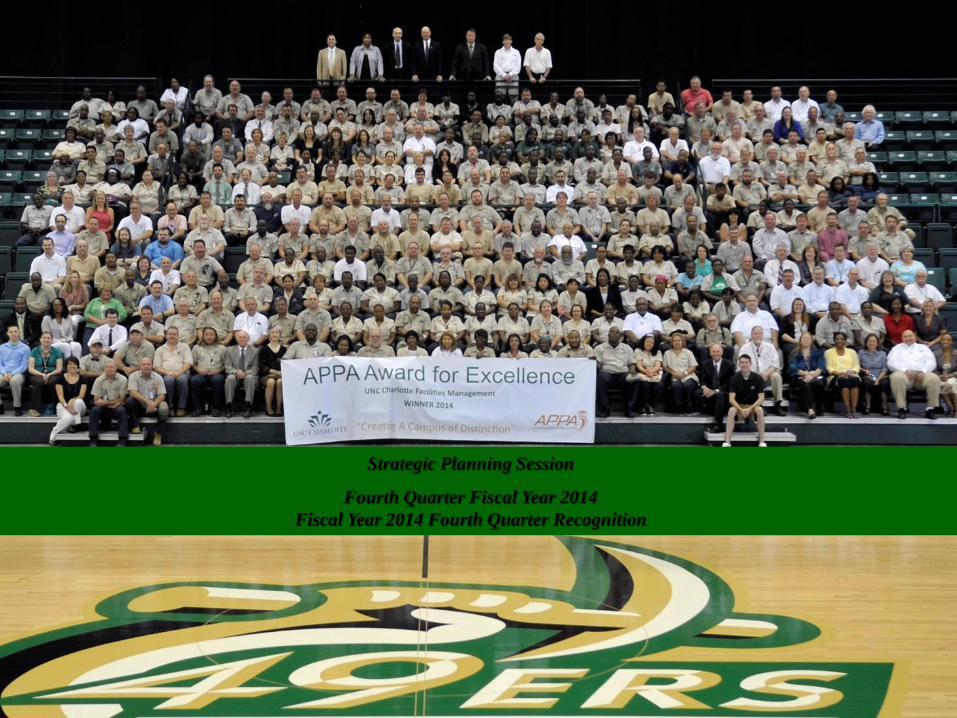
Strategic Planning Session
Fourth Quarter Fiscal Year 2014
Fiscal Year 2014 Fourth Quarter Recognition

GOAL #1
Continuously Improve Operations of Campus
"In business, words are
words, explanations are
explanations, promises are
promises, but only
performance is reality."
-- Harold Geneen, industrialist
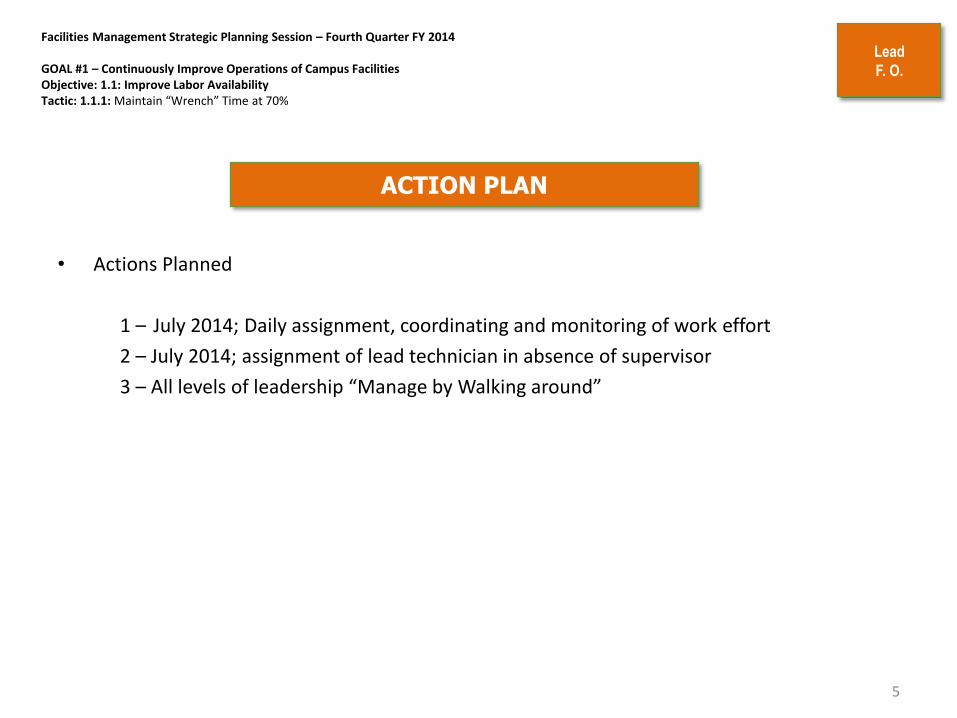
Facilities Management Strategic Planning Session – Fourth Quarter FY 2014 GOAL #1 – Continuously Improve Operations of Campus Facilities Objective: 1.1: Improve Labor Availability Tactic: 1.1.1: Maintain “Wrench” Time at 70%
ACTION PLAN
• Actions Planned
1 – July 2014; Daily assignment, coordinating and monitoring of work effort
2 – July 2014; assignment of lead technician in absence of supervisor
3 – All levels of leadership “Manage by Walking around”
5
Lead
F. O.
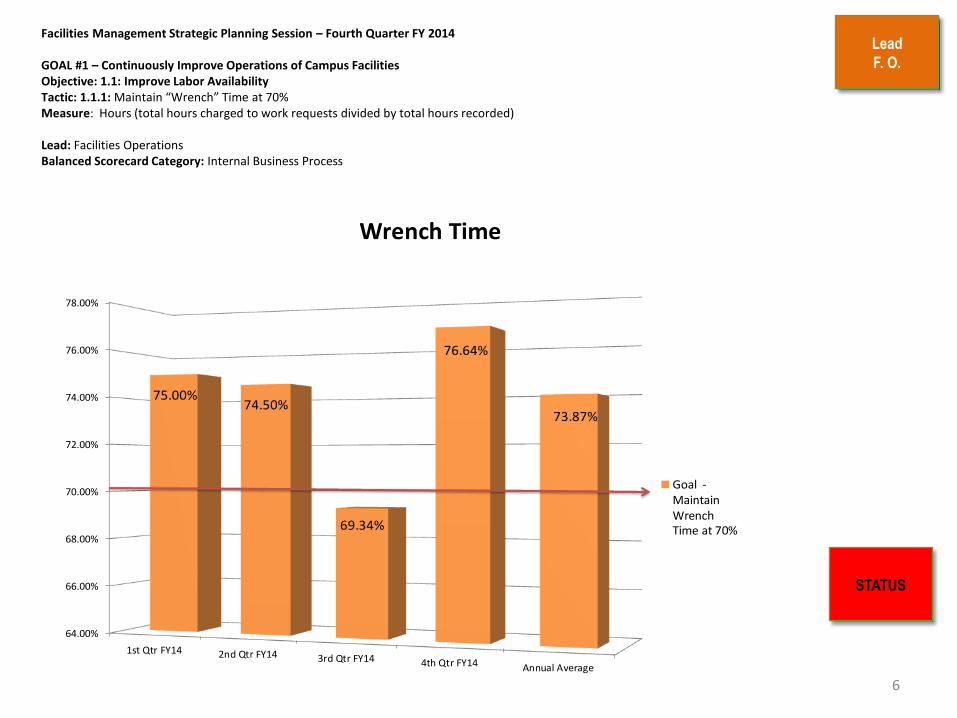
Facilities Management Strategic Planning Session – Fourth Quarter FY 2014 GOAL #1 – Continuously Improve Operations of Campus Facilities Objective: 1.1: Improve Labor Availability Tactic: 1.1.1: Maintain “Wrench” Time at 70% Measure: Hours (total hours charged to work requests divided by total hours recorded) Lead: Facilities Operations Balanced Scorecard Category: Internal Business Process
Lead
F. O.
6
STATUS
64.00%
66.00%
68.00%
70.00%
72.00%
74.00%
76.00%
78.00%
1st Qtr FY14 2nd Qtr FY14 3rd Qtr FY14 4th Qtr FY14 Annual Average
75.00%74.50%
69.34%
76.64%
73.87%
Wrench Time
Goal -MaintainWrenchTime at 70%

Facilities Management Strategic Planning Session – Fourth Quarter FY 2014
GOAL #1 – Continuously Improve Operations of Campus Facilities Objective: 1.2: Improve Logistics Efficiency Tactic: 1.2.1: Improve Non-stock on-time delivery to 95% Tactic: 1.2.2: Reduce Average Non-stock Requisition to Receipt Time to 3.5 Days
ACTION PLAN
• Actions Planned
1 – Weekly review of items that have been ordered repeatedly as non-stock items to stock as order-on-request items (carried at an inventory level of “zero” but pre-sourced for faster ordering and delivery).
2 – Specifically track long lead items and spikes in usage (historically the main causes for inability to fill).
3 – Send out daily email reminders for approvers (Supervisors, Admins and Managers)
4 - Monitor the req to PO processing time and discuss weekly.
5 – Promote the use of SDI Punch-out; conduct lunch and learn July 2014.
7
Lead
F. O.

Facilities Management Strategic Planning Session – Fourth Quarter FY 2014
GOAL #1 – Continuously Improve Operations of Campus Facilities Objective: 1.2: Improve Logistics Efficiency Tactic: 1.2.1: Improve Non-stock on-time delivery to 95% Measure: Percent of non-stock orders received on or before delivery due date (SDI Key Performance Indicator (KPI)) Lead: Facilities Operations Balance Scorecard Category: Internal Business Process
8
Lead
F. O.
STATUS
40.00%
45.00%
50.00%
55.00%
60.00%
65.00%
70.00%
75.00%
80.00%
85.00%
90.00%
95.00%
100.00%
1st Qtr FY14 2nd Qtr FY14 3rd Qtr FY14 4th Qtr FY14 Annual Average
97.00%93.00% 95.37%
82.00%
91.84%
Improve Non-stock On-time Delivery
Goal to 95%

Facilities Management Strategic Planning Session – Fourth Quarter FY 2014
GOAL #1 – Continuously Improve Operations of Campus Facilities Objective: 1.2: Improve Logistics Efficiency Tactic: 1.2.2: Reduce Average Non-stock Requisition to Receipt Time to 3.5 Days Measure: Average Days from requisition to receipt (SDI KPI – Non-stock Requisition to Receipt Time) Lead: Facilities Operations Balance Scorecard Category: Internal Business Process
9
Lead
F. O.
STATUS 0.00
0.50
1.00
1.50
2.00
2.50
3.00
3.50
4.00
4.50
5.00
5.50
6.00
1st Qtr FY14 2nd Qtr FY14 3rd Qtr FY14 4th Qtr FY14 Annual Average
3.88
4.70
5.72
4.00
4.58
Reduce Average Non-stock Requisition to Receipt Time
Goal 3.5 days

Facilities Management Strategic Planning Session – Fourth Quarter FY 2014
GOAL #1 – Continuously Improve Operations of Campus Facilities Objective: 1.3: Improve Work Request Process Tactic: 1.3.1: Decrease Number of Work Orders Over 14 Days Old by 15% Tactic: 1.3.2: Decrease Work Request Cycle Time by 10% Measure: Hours from Work Request Submitted to Work Complete (APPA Benchmark)
ACTION PLAN
• Actions Planned
1 – Review of recurring services and scheduled services currently being completed using PM work request – Aug 2014
2 – Emphasize Facilities Operations OP-16 Timely and Accurate Handling/Processing of WRs.
3 – Weekly meeting with UPA and Managers to monitor 14 day report.
4 - Communicate work order priorities (Quarterly Customer, Building Liaison and specific College Meetings); implemented July 2014
10
Lead
F. O.

Facilities Management Strategic Planning Session – Fourth Quarter FY 2014
GOAL #1 – Continuously Improve Operations of Campus Facilities Objective: 1.3: Improve Work Request Process Tactic: 1.3.1: Decrease Number of Work Orders Over 14 Days Old by 15% Measure: Number of open reactive work orders over 14 Days from request (excluding scheduled work orders)
Lead: Facilities Operations Balance Scorecard Category: Customer Perspective
11
Lead
F. O.
STATUS
0
300
600
900
1200
1500
1800
2100
2400
2700
3000
1st Qtr FY142nd Qtr FY14
3rd Qtr FY144th Qtr FY14
Annual Average
825 786
2836
13471449
Number of Work Orders Over 14 Days
Goal < 15%(701)
Facilities Management Strategic Planning Session – Fourth Quarter FY 2014
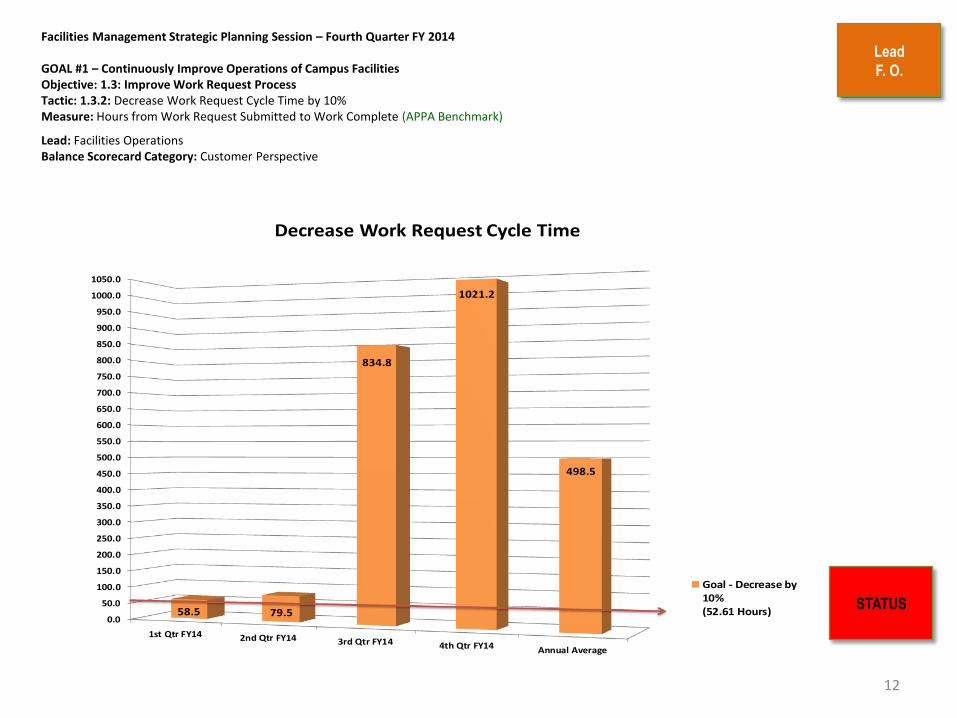
GOAL #1 – Continuously Improve Operations of Campus Facilities Objective: 1.3: Improve Work Request Process Tactic: 1.3.2: Decrease Work Request Cycle Time by 10% Measure: Hours from Work Request Submitted to Work Complete (APPA Benchmark)
Lead: Facilities Operations Balance Scorecard Category: Customer Perspective
12
STATUS
Lead
F. O.
0.0
50.0
100.0
150.0
200.0
250.0
300.0
350.0
400.0
450.0
500.0
550.0
600.0
650.0
700.0
750.0
800.0
850.0
900.0
950.0
1000.0
1050.0
1st Qtr FY14 2nd Qtr FY14 3rd Qtr FY14 4th Qtr FY14 Annual Average
58.5 79.5
834.8
1021.2
498.5
Decrease Work Request Cycle Time
Goal - Decrease by10%(52.61 Hours)
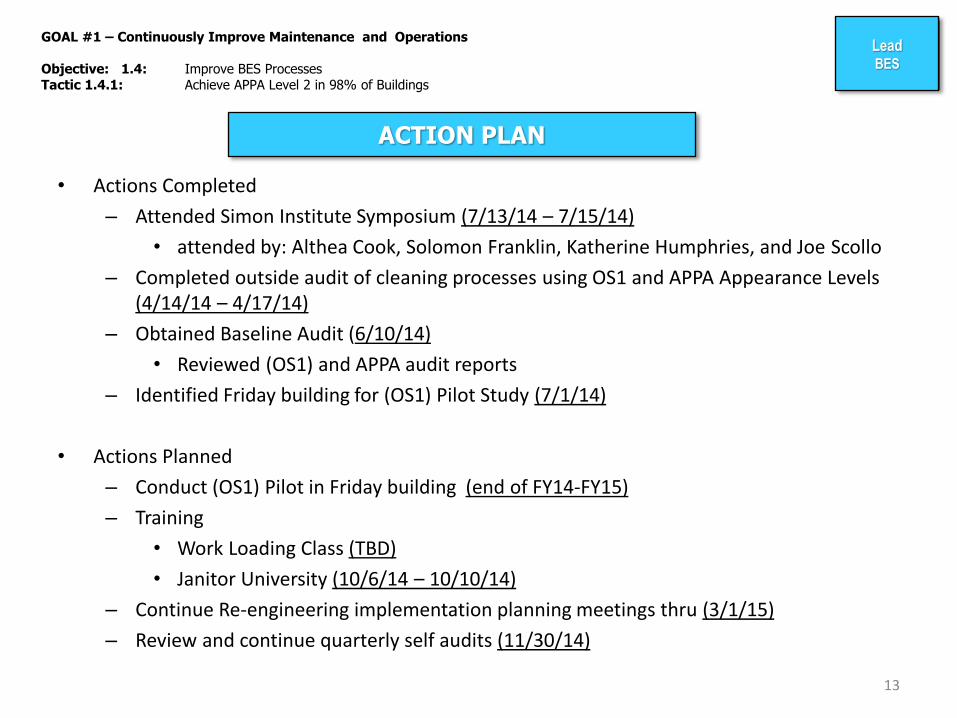
GOAL #1 – Continuously Improve Maintenance and Operations Objective: 1.4: Improve BES Processes Tactic 1.4.1: Achieve APPA Level 2 in 98% of Buildings
ACTION PLAN
• Actions Completed
– Attended Simon Institute Symposium (7/13/14 – 7/15/14)
• attended by: Althea Cook, Solomon Franklin, Katherine Humphries, and Joe Scollo
– Completed outside audit of cleaning processes using OS1 and APPA Appearance Levels (4/14/14 – 4/17/14)
– Obtained Baseline Audit (6/10/14)
• Reviewed (OS1) and APPA audit reports
– Identified Friday building for (OS1) Pilot Study (7/1/14)
• Actions Planned
– Conduct (OS1) Pilot in Friday building (end of FY14-FY15)
– Training
• Work Loading Class (TBD)
• Janitor University (10/6/14 – 10/10/14)
– Continue Re-engineering implementation planning meetings thru (3/1/15)
– Review and continue quarterly self audits (11/30/14)
13
Lead BES

Facilities Management Strategic Planning Session – Fourth Quarter FY 2014 GOAL #1 – Continuously Improve Maintenance and Operations of the Campus Objective: 1.4: Improve BES Processes Tactic 1.4.1: Achieve APPA Level 2 in 98% of Buildings Measure: Percentage of buildings meeting APPA Level 2 cleanliness standards during quarterly inspection (APPA Benchmark) Lead: Building Environmental Services Balanced Scorecard Category: Customer Perspective
Lead BES
14
STATUS
Percentage = 74%
0%
20%
40%
60%
80%
100%
FY14-1st QTRFY14-2nd QTR
FY14-3rd QTRFY14-4th QTR
74% 91%
79%
74%
APPA LEVELS

Lead BES
15
0%
1%
2%
3%
4%
5%
6%
7%
8%
9% 8% 8%
9%
6%
9%
8%
Pe
rce
nta
ge
(OS1) Baseline Audit Scores - Job Category
Cleaning Wrkr.
Training
Safety
Workloading/Logistics
Supervision/Management
Benchmarking

Lead BES
16
0
10
20
30
40
50
60
70
80
13 8
12 12 11 6 8
80
Pe
rce
nta
ge
(OS1) Baseline Audit Scores - Organization Comparison
UNC Chapel Hill
U Mich
WFU
MSU
MT SAC
Provo School District
UNC Charlotte
STANDARD

Facilities Management Strategic Planning Session – Fourth Quarter FY 2014
GOAL #1 – Continuously Improve Operation of Campus Facilities Objective: 1.5: Improve Facility Systems Reliability Tactic: 1.5.1: Improve Completion of Preventative Maintenance Work Requests to 90% Tactic: 1.5.2: Decrease number of Unscheduled Equipment Replacement Projects to less than 2 incidents per quarter Tactic: 1.5.3: Fewer than 5 unscheduled outages per quarter Tactic: 1.5.4: Improve Ratio of Preventive/Predictive work requests to reactive request to 50%
ACTION PLAN
• Actions Planned
1 – Complete conversion from old PM Module to new PM Module. (Goal for completion August 2015) UPA and Managers to monitor status.
3 – Continue expansion of PM Program and predictive maintenance program. Work with key customers.
4 – Identify and prioritize equipment conditions and needs for replacement.
5 – Review system projects identified on the R&R list and prioritize. Indicate urgency and recommend future funding dates.
6 – Re-emphasize the Customer Handbook, get out and see the customer; swiftly and accurately report outages.
17
Lead
F. O.

Facilities Management Strategic Planning Session – Fourth Quarter FY 2014 GOAL #1 – Continuously Improve Operations of Campus Facilities Objective: 1.5: Improve Facility Systems Reliability Tactic: 1.5.1: Improve Completion of Preventative Maintenance Work Requests to 90% Measure: Percentage of Preventive Maintenance Work Requests Completed
Lead: Facilities Operations Balance Scorecard Category: Internal Business Process
18
Lead
F. O.
STATUS 78.0%
80.0%
82.0%
84.0%
86.0%
88.0%
90.0%
92.0%
94.0%
96.0%
1st Qtr FY14 2nd Qtr FY14 3rd Qtr FY14 4th Qtr FY14 Annual Average
94.8%
87.5% 87.3%
84.3%
88.5%
Improve Completion of PM Work Orders
Goal to 90%

Facilities Management Strategic Planning Session – Fourth Quarter FY 2014
GOAL #1 – Continuously Improve Operations of Campus Facilities Objective: 1.5: Improve Facility Systems Reliability Tactic: 1.5.2: Decrease number of Unscheduled Equipment Replacement Projects to less than 2 incidents per quarter Measure: Number of Unscheduled Equipment Replacement Projects
Lead: Facilities Operations Balance Scorecard Category: Internal Business Process
19
Lead
F. O.
STATUS
0
0.5
1
1.5
2
2.5
3
3.5
4
1st Qtr FY14 2nd Qtr FY14 3rd Qtr FY14 4th Qtr FY14 Annual Average
4
0
2
0
1.5
Unscheduled Equipment Replacement Projects
Less than 2 incidentsper quarter

Facilities Management Strategic Planning Session – Fourth Quarter FY 2014
GOAL #1 – Continuously Improve Operations of Campus Facilities Objective: 1.5: Improve Facility Systems Reliability Tactic: 1.5.3: Fewer than 5 unscheduled outages per quarter Measure: Number of Occurrences ; Electric, Water, Sewer, HVAC, (Roofs, Lots, Decks, Roads measured separately). Lead: Facilities Operations Balance Scorecard Category: Customer Perspective
20
Lead
F. O.
STATUS
0
1
2
3
4
5
6
7
8
1st Qtr FY14 2nd Qtr FY14 3rd Qtr FY14 4th Qtr FY14 Annual Average
7
5
1
8
5.25
Unscheduled Utility Outages
Goal Fewer than 5outages

Facilities Management Strategic Planning Session – Fourth Quarter FY 2014
GOAL #1 – Continuously Improve Operations of Campus Facilities Objective: 1.5: Improve Facility Systems Reliability Tactic: 1.5.4: Improve Ratio of Preventive/Predictive work requests to reactive request to 50% Measure: Percentage (Number of completed reactive work requests divided by total number of completed work requests including PM and Predictive work requests) (APPA Benchmark)
Lead: Facilities Operations Balance Scorecard Category: Customer Perspective
21
Lead
F. O.
STATUS
0.00%
10.00%
20.00%
30.00%
40.00%
50.00%
60.00%
70.00%
80.00%
1st Qtr FY14 2nd Qtr FY14 3rd Qtr FY14 4th Qtr FY14 Annual Average
32.82%27.66%
56.33%
77.80%
48.65%
Improve Ratio of Preventive/Predictive Work Requests
Goal to improveratio to 50%

GOAL #2
Create a Reliable and Sustainable Physical Infrastructure
"People with goals
succeed because they
know where they're going"
-- Earl Nightingale,
Motivational Speaker

Facilities Management Strategic Planning Session – Fourth Quarter FY 2014 GOAL #2 - Create a Reliable and Sustainable Physical Infrastructure Objective 2.8: Develop a comprehensive plan for strategic real estate acquisition Tactic 2.8.1: Balanced Scorecard Category: Internal Business Process
23
STATUS
(Purchase) ACTION PLAN
Actions Planned:
• Complete acquisitions by the State by end of Calendar Year 2014
• Activate Strategic Acquisition Subcommittee within the Property Review Committee (PRC) not started – Determine strategic acquisitions
– Continue to work with Business Affairs and the Cabinet to establish Funds to acquire real estate
Lead
REAL
ESTATE
• Completed
– Acquired one Medical Office (Foundation)
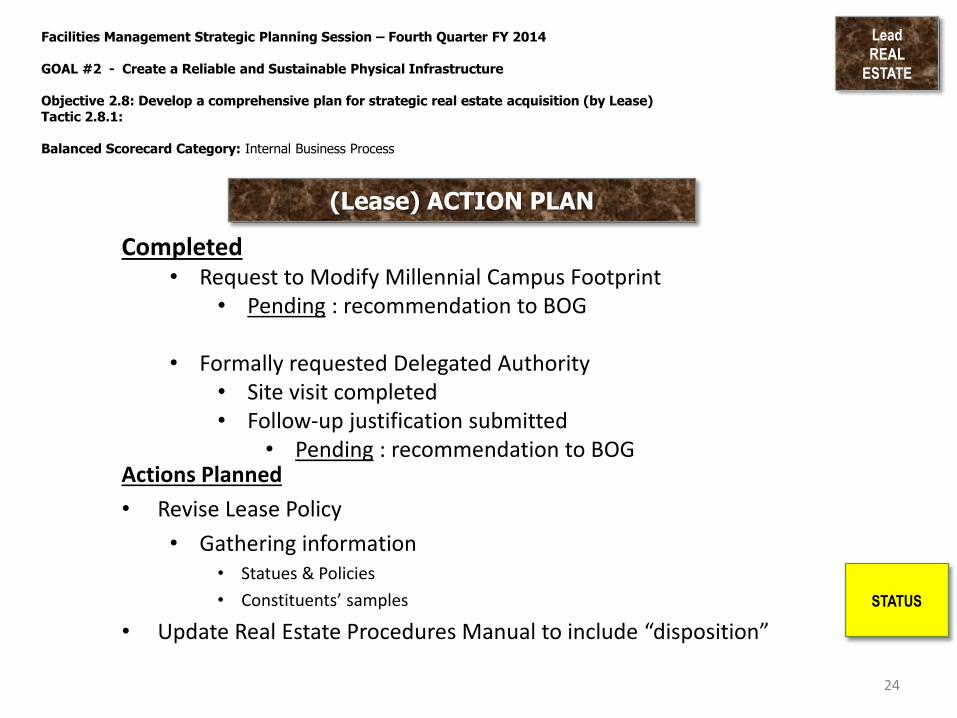
Facilities Management Strategic Planning Session – Fourth Quarter FY 2014 GOAL #2 - Create a Reliable and Sustainable Physical Infrastructure Objective 2.8: Develop a comprehensive plan for strategic real estate acquisition (by Lease) Tactic 2.8.1: Balanced Scorecard Category: Internal Business Process
24
STATUS
(Lease) ACTION PLAN
Actions Planned
• Revise Lease Policy
• Gathering information • Statues & Policies
• Constituents’ samples
• Update Real Estate Procedures Manual to include “disposition”
Lead
REAL
ESTATE
Completed • Request to Modify Millennial Campus Footprint
• Pending : recommendation to BOG
• Formally requested Delegated Authority • Site visit completed • Follow-up justification submitted
• Pending : recommendation to BOG
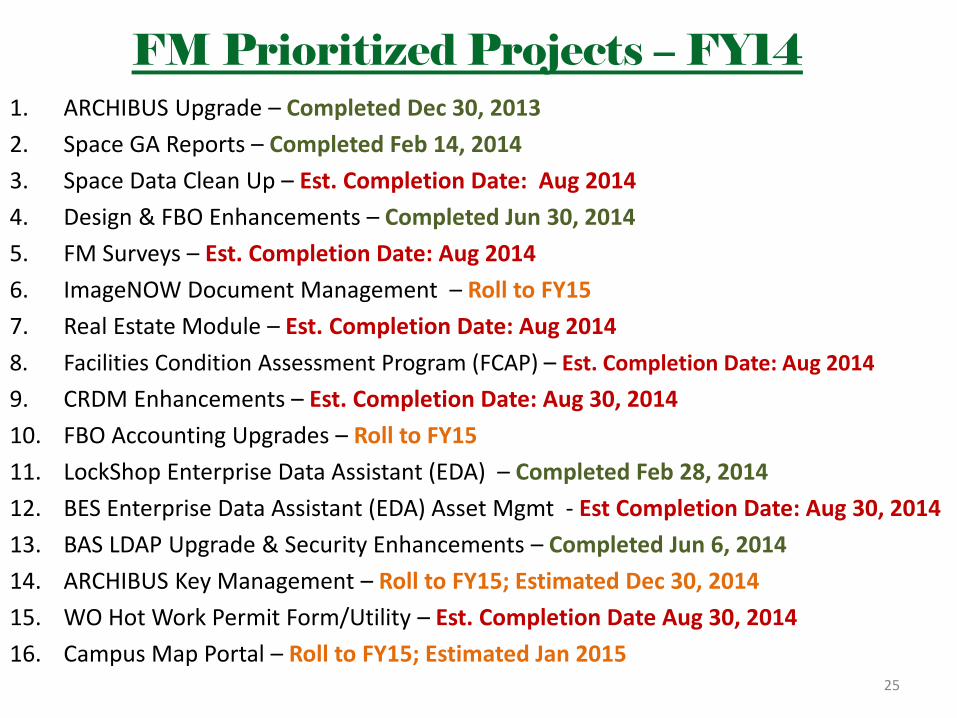
FM Prioritized Projects – FY14 1. ARCHIBUS Upgrade – Completed Dec 30, 2013
2. Space GA Reports – Completed Feb 14, 2014
3. Space Data Clean Up – Est. Completion Date: Aug 2014
4. Design & FBO Enhancements – Completed Jun 30, 2014
5. FM Surveys – Est. Completion Date: Aug 2014
6. ImageNOW Document Management – Roll to FY15
7. Real Estate Module – Est. Completion Date: Aug 2014
8. Facilities Condition Assessment Program (FCAP) – Est. Completion Date: Aug 2014
9. CRDM Enhancements – Est. Completion Date: Aug 30, 2014
10. FBO Accounting Upgrades – Roll to FY15
11. LockShop Enterprise Data Assistant (EDA) – Completed Feb 28, 2014
12. BES Enterprise Data Assistant (EDA) Asset Mgmt - Est Completion Date: Aug 30, 2014
13. BAS LDAP Upgrade & Security Enhancements – Completed Jun 6, 2014
14. ARCHIBUS Key Management – Roll to FY15; Estimated Dec 30, 2014
15. WO Hot Work Permit Form/Utility – Est. Completion Date Aug 30, 2014
16. Campus Map Portal – Roll to FY15; Estimated Jan 2015 25

0.00%
10.00%
20.00%
30.00%
40.00%
50.00%
60.00%
70.00%
80.00%
90.00%
100.00%
Qtr 1 FY14 Qtr 2 FY14 Qtr 3 FY14 Qtr 4 FY14
10.44%
29.69% 25.00%
50.00%
100.00%
FIS Project Task CumulativeCompletion Avg.
Qtrly Metric: Cumulative Avg.
75.00%
69.69%
Facilities Management Strategic Planning Session – Fourth Quarter FY 2014 GOAL #2 – Create a Reliable and Sustainable Physical Infrastructure Objective: 2.1 Maximize Facilities Management Effectiveness and Efficiency through Information Technology Tactic: 2.1.1 Complete 40% of the Facilities Management Five-Year Technology Plan Measure: Percent Completion of Five-Year Technology Projects Based upon Cumulative Average of Project Completion Balanced Scorecard Category: Internal Business Processes
Lead
FIS
STATUS
49.06%

Facilities Management Strategic Planning Session – Fourth Quarter FY 2014
GOAL #2 – Create a Reliable and Sustainable Physical Infrastructure
Objective: 2.1 Maximize Facilities Management Effectiveness and Efficiency through Information Technology Tactic: 2.1.1 Complete 40% of the Facilities Management Five-Year Technology Plan Measure: Percent Completion of Five-Year Technology Projects Project Status Completion Percentage Balanced Scorecard Category: Internal Business Processes
Lead
FIS
27
0.00%
10.00%
20.00%
30.00%
40.00%
50.00%
60.00%
70.00%
80.00%
90.00%
100.00%
100.00%
90.00%
25.00%
75.00%
100.00% 100.00%
FY14 Q4
FY14 Q3
FY14 Q2
FY14 Q1
95.00% 100.00%
5.00%
75.00% 75.00%
STATUS
Total Projects at 100% Completion as of June 2014 FY14/ 1st Qtr Status: 0 FY14/ 2nd Qtr Status: 1 FY14/ 3rd Qtr Status: 3 FY14/ 4th Qtr Status: 5
90.00%
100.00%
25.00%
60.00%

Lead
FIS
GOAL #2 – Create a Reliable and Sustainable Physical Infrastructure Objective: 2.1 Maximize Facilities Management Effectiveness and Efficiency through Information Technology Tactic: 2.1.1 Complete 40% of the Facilities Management Five-Year Technology Plan
ACTION PLAN
Actions Planned:
1. Launch 100% FCAP module and complete integration with CRDM for FO use by Aug 30, 2014.
2. Begin and Complete FM Campus Map by Jan 2015.
3. Complete 100% of testing for Asset Module for BES by Aug 30, 2014.
4. Hire vacant Temp Survey Technician position by Dec 30, 2014.
5. Finalize 100% of FM Surveys Project and Go Live with Survey Reports for Design Services by Aug 2014.
6. Establish ARCHIBUS training initiatives via Moodle (Ongoing).
Lead
FIS
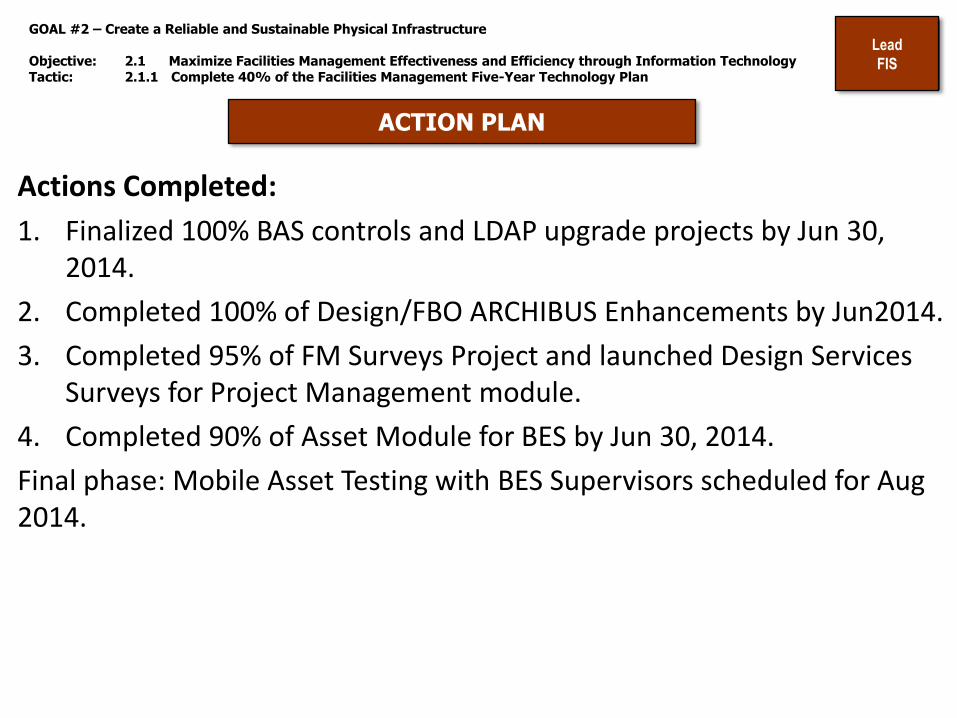
GOAL #2 – Create a Reliable and Sustainable Physical Infrastructure Objective: 2.1 Maximize Facilities Management Effectiveness and Efficiency through Information Technology Tactic: 2.1.1 Complete 40% of the Facilities Management Five-Year Technology Plan
ACTION PLAN
Actions Completed:
1. Finalized 100% BAS controls and LDAP upgrade projects by Jun 30, 2014.
2. Completed 100% of Design/FBO ARCHIBUS Enhancements by Jun2014.
3. Completed 95% of FM Surveys Project and launched Design Services Surveys for Project Management module.
4. Completed 90% of Asset Module for BES by Jun 30, 2014.
Final phase: Mobile Asset Testing with BES Supervisors scheduled for Aug 2014.

NEW IMPROVEMENTS
Reduce and Eliminate Paper Processes – Requires interface assistance with FIS: Convert Scope & Budget to format in Archibus similar to Estimating Workbook.
Timeline: FY15 QTR 2 - FY15 QTR 3 Convert Excel Purchase Requisition (PR) to Archibus PR.
Timeline: FY15 QTR 2 - FY15 QTR 4 Updates to Estimating Workbook to improve Contingency and Fee calculations.
Timeline: FY15 QTR 2 - FY15 QTR 4
30
ACTION PLANS FOR IMPROVEMENT
Facilities Management Strategic Planning Session – Fourth Quarter FY 2014 GOAL #2 – Create a Reliable and Sustainable Physical Infrastructure Objective: 2.2: Improve Informal Project Design and Construction Process Lead: Design Services Balanced Scorecard Category: Internal Business Process
Customer Orientation for Design Services Processes and Archibus Design Services Project Management: Customer meetings to help our Customers understand our processes – Project entry, approvals, timelines, SCO, etc.
Timeline: FY15 QTR 2 - FY15 QTR 4 Project Priority List to include new column designating “true” Project Customer.
Timeline: Success – It works.
Tactic 2.2.1: 95% of All Construction Projects Meet Scheduled Beneficial Occupancy Date (BOD) Measure: Percentage (Number of Construction Projects completed on or before delivery date divided by total number of project completed.) Tactic 2.2.2: Increase Project Capacity by 10 projects per year. Measure: Number of Projects Completed (Annual Goal)
Archibus - Design Services Customer Survey: Started testing viable format for Customer responses via Lime-Survey – Success to date. FIS performing ARCHIBUS testing.
Continue ongoing efforts to assign Classroom Capacity and provide ADA egress information per building.
ONGOING IMPROVEMENTS
Lead Design Services

Facilities Management Strategic Planning Session – Fourth Quarter FY 2014 GOAL #2 – Create a Reliable and Sustainable Physical Infrastructure Objective: 2.2: Improve Informal Project Design and Construction Process Lead: Design Services Balanced Scorecard Category: Internal Business Process
31
Lead Design Services
Tactic 2.2.1: 95% of All Construction Projects Meet Scheduled Beneficial Occupancy Date (BOD) Measure: Percentage (Number of Construction Projects completed on or before delivery date divided by total number of project completed.)
QUARTERLY
REVIEWNo. Of Projects
Projects Occupied
by scheduled date
Projects not
Occupied by
scheduled date
Percent
FY '09 115 100 15 87.0%
FY '10 182 168 14 92.3%
FY '11 224 200 24 89.3%
FY '12 240 231 9 96.3%
FY '13 139 134 5 96.4%
QTR 1 31 30 1 96.8%
QTR 2 45 42 3 93.3%
QTR 3 32 30 2 93.8%
QTR 4 113 109 4 96.5%
FY '14 STATUS 221 211 10 95.5%
95% of All Construction Projects Meet Scheduled
Beneficial Occupancy Date (BOD)
87.0%
92.3%
89.3%
96.3% 96.4% 96.8%
93.3%
93.8%
96.5%95.5%
85%
FY '09 FY '10 FY '11 FY '12 FY '13 QTR 1 QTR 2 QTR 3 QTR 4 FY '14
STATUS
GOAL ALERT
GOAL STATUS95.0% 96.5%

Facilities Management Strategic Planning Session – Fourth Quarter FY 2014 GOAL #2 – Create a Reliable and Sustainable Physical Infrastructure Objective: 2.2: Improve Informal Project Design and Construction Process Lead: Design Services Balanced Scorecard Category: Internal Business Process
32
Lead Design Services
Increase Project Volume by 5-10 Projects Per Year
GOAL STATUS
100% 88.4%
Tactic 2.2.2: Increase Project Capacity by 10 projects per year Measure: Number of Projects Completed
150160
170180
190200
210220
230240
250 250
136
161173
194205
190 193
278
177
286
218 221
48
FY 2003 FY 2004 FY 2005 FY 2006 FY 2007 FY 2008 FY 2009 FY 2010 FY 2011 FY 2012 FY 2013 FY 2014 FY 2014
$2,060,000$2,609,000
$3,450,000
$8,480,000 $8,875,000$8,200,000
$7,745,678
$9,935,384
$17,944,564$19,393,759
$13,589,752
$13,648,336
FY 2003 FY 2004 FY 2005 FY 2006 FY 2007 FY 2008 FY 2009 FY 2010 FY 2011 FY 2012 FY 2013 FY 2014 FY 2014
150 160 170 180 190 200 210 220 230 240 250 250 In Construction
136 161 173 194 205 190 193 278 177 286 218 221 48
$2,060,000 $2,609,000 $3,450,000 $8,480,000 $8,875,000 $8,200,000 $7,745,678 $9,935,384 $17,944,564 $19,393,759 $13,589,752 $13,648,336 $3,886,720

Facilities Management Strategic Planning Session – Fourth Quarter FY 2014 GOAL #2 - Create a Reliable and Sustainable Physical Infrastructure Objective 2.3: Develop a Comprehensive Capital Renewal/Deferred Maintenance (CRDM) Program Tactic 2.3.1: Improve the Facilities Condition Index (FCI) for buildings on campus by 5% NLT July 2015. Measure: Average Building FCI for campus Lead: Facilities Planning Balanced Scorecard Category: Internal Business Process
33
STATUS
ACTION PLAN
• Actions Planned:
o Complete CRDM update including revision of Second Section of SOP
by August 2014
o Complete Phase 2, CRDM, for FCI capability (FIS) by August 2014
o Determine O/A FCI of buildings (work begun by FO) July 2015
o Recommend a plan/ prioritize projects to improve FCI by
5% by July 2015.
Lead
Facilities
Planning

Facilities Management Strategic Planning Session – Fourth Quarter FY 2014 GOAL #2 - Create a Reliable and Sustainable Physical Infrastructure Objective 2.3: Develop a Comprehensive Capital Renewal/Deferred Maintenance (CRDM) Program Tactic 2.3.1: Improve the Facilities Condition Index (FCI) for buildings on campus by 5% NLT July 2015. Measure: Average Building FCI for campus Lead: Facilities Planning Balanced Scorecard Category: Internal Business Process
Lead
Facilities
Planning
34
Status
Percentage of Completion
4th
Qtr
FY
14
1st
Qtr
FY
14
2n
d Q
tr
FY 1
4
3rd
Qtr
FY
14
1.0 .9 .8 .7 .6 .5 .4 .3 .2 .1 0
20% 25% 30%

Facilities Management Strategic Planning Session – Fourth Quarter FY 2014 GOAL #2 - Create a Reliable and Sustainable Physical Infrastructure Objective 2.4: Improve Campus Space Planning and Utilization Tactic 2.4.1: 80% of Departments/Colleges within +/- 5% of System-wide space standards NLT end of July 15. Measure: Percentage of Departments/Colleges meeting System-wide space standards as measured in gross square feet (GSF occupied divided by GSF required based on UNC System standards for each applicable room category) Lead: Facilities Planning Balanced Scorecard Category: Internal Business Process
35
ACTION PLAN
o There is not a “System Wide Standard”. Reference UNC Charlotte
Approved Standard by January 2015
o Complete space allocations/ inventory by room category in Archibus
(Ongoing)
o Compare inventory to standard and report % difference by January 2015
o Work with FIS to generate report by room use (Ongoing)
o Recommend a plan/ prioritize projects to improve allocations to
within 5% of the standard by end of July 2015.
Lead
Facilities
Planning

Lead
Facilities
Planning
36
Status
Percentage of Completion
4th
Qtr
FY
14
1st
Qtr
FY
14
2n
d Q
tr
FY 1
4
3rd
Qtr
FY
14
1.10 Space Standard 1.0
.9
.8
.7
.6
.5
.4
.3
.2
.1
Facilities Management Strategic Planning Session – Fourth Quarter FY 2014 GOAL #2 - Create a Reliable and Sustainable Physical Infrastructure Objective 2.4: Improve Campus Space Planning and Utilization Tactic 2.4.1: 80% of Departments/Colleges within +/- 5% of System-wide space standards NLT end of July 15. Measure: Percentage of Departments/Colleges meeting System-wide space standards as measured in gross square feet (GSF occupied divided by GSF required based on UNC System standards for each applicable room category) Lead: Facilities Planning Balanced Scorecard Category: Internal Business Process
40% 45% 50%
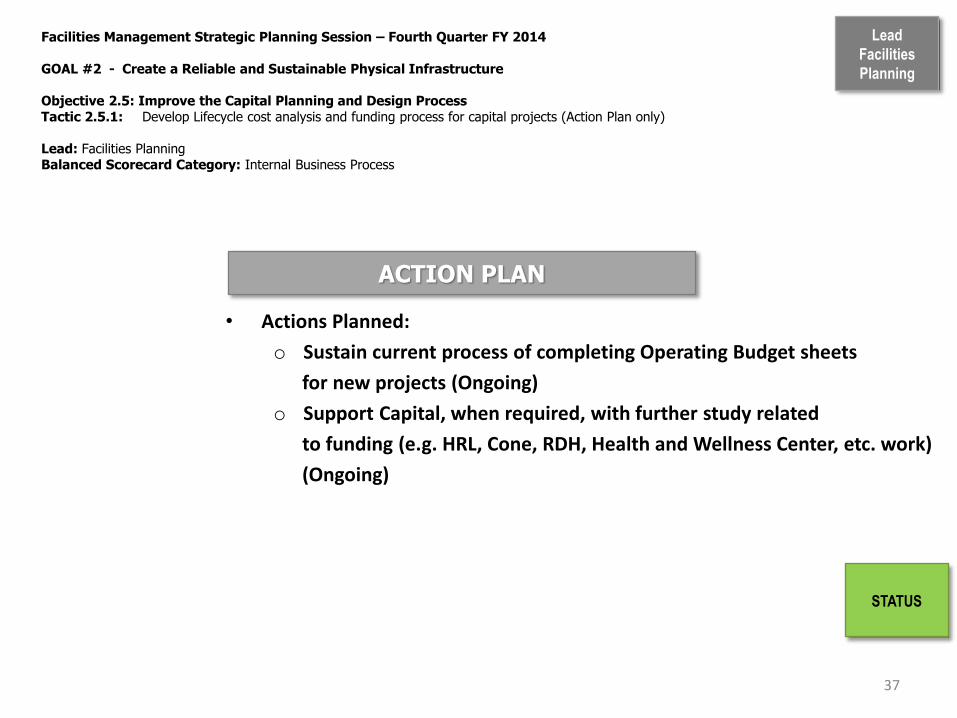
Facilities Management Strategic Planning Session – Fourth Quarter FY 2014 GOAL #2 - Create a Reliable and Sustainable Physical Infrastructure Objective 2.5: Improve the Capital Planning and Design Process Tactic 2.5.1: Develop Lifecycle cost analysis and funding process for capital projects (Action Plan only) Lead: Facilities Planning Balanced Scorecard Category: Internal Business Process
37
STATUS
ACTION PLAN
• Actions Planned:
o Sustain current process of completing Operating Budget sheets
for new projects (Ongoing)
o Support Capital, when required, with further study related
to funding (e.g. HRL, Cone, RDH, Health and Wellness Center, etc. work)
(Ongoing)
Lead
Facilities
Planning

Lead
Capital
GOAL #2 – Create a Reliable and Sustainable Physical Infrastructure Objective 2.5 Improve the Capital Planning and Design Process Tactic 2.5.2 90% of designers under contract within 120 days of the Project posting in CAPSTAT 2.5.3 90% of Designs complete by the scheduled completion date 2.5.4 90% of designs complete within design budgeted fee ACTION PLAN
Actions Completed • Burson Renovation AP under contract. • Campus Wide Roofs and CID 1 Roadway designs complete and within budgeted fee.
Actions Planned • PMs, prior to executing the design agreement, arrange a meeting between capital projects, design team, and user group to
plan / agree on a design production schedule to be reflected in the designer’s agreement. • Baseline (BL) schedules –
– PMs to update the BL schedules when design agreements are received reflecting the contractual dates for each project phase.(design, bidding, construction).
– PMs to communicate at project design meetings these design phase critical dates. – PMs must carry project datasheets with the accurate baselines dates to every project meeting.
• PMs print project budget / financial sheets. Have them on hand for all design meetings. PMs must know their project authorization, current source of funding, available balances.
• Develop a standardized design meeting agenda and make budget, contingency, scope creep, and design production schedule required topics for updating the project team.
• Report monthly to AVC FM status of changes relating to designer fees, scope creep, schedule misses, etc.. • Protect contingency limit uses for unforeseen conditions, inflation
38

Facilities Management Strategic Planning Session – Fourth Quarter FY 2014 GOAL #2 – Create a Reliable and Sustainable Physical Infrastructure Objective 2.5 Improve the Capital Planning and Design Process Tactic 2.5.2 90% of designers under contract within 120 days of the Project posting in CAPSTAT Measure: Percentage of designers under contract within 120 days. Balanced Scorecard Category: Internal Business Process
Lead
Capital
39
Tactic Measurement for 4th Quarter is 100%
Status
STRATEGIC REVIEW by Fiscal Year (July-June)
No. of projects
authorized in Capstat
Designer under
contract w/in 120 days
Designer not under contract w/in 120
days
% Designers
under contract
w/in
Summary FY-13 14 3 6 33%
Summary FY-14 7 4 1 80%
1st Qtr. FY-14 1 1 1 50%
2nd Qtr. FY-14 4 1 n/a 100%
3rd Qtr. FY-14 2 1 0 100%
4th Qtr. FY-14 1 1 0 100% 33%
80%
50%
100% 100% 100%
Goal 90%

Facilities Management Strategic Planning Session – Fourth Quarter FY 2014 GOAL #2 – Create a Reliable and Sustainable Physical Infrastructure Objective 2.5 Improve the Capital Planning and Design Process Tactic 2.5.3 90% of designs complete by the scheduled completion date Measure: Percentage of designs completed on or before the original completion time Balanced Scorecard Category: Internal Business Process
Lead
Capital
40
Tactic Measurement for 4th Quarter is 100%
Status
STRATEGIC REVIEW by Fiscal Year (July-June)
No. of projects
completed by scheduled
time
#not completed
by scheduled
time
%Designs complete by completion
time
Summary FY-13 3 1 75%
Summary FY-14 8 0 100%
1st Qtr. FY-14 1 0 100%
2nd Qtr. FY-14 n/a n/a n/a
3rd Qtr. FY-14 5 0 100%
4rd Qtr. FY-14 2 0 100%
0%
10%
20%
30%
40%
50%
60%
70%
80%
90%
100%
Goal 90%

Facilities Management Strategic Planning Session – Fourth Quarter FY 2014 GOAL #2 – Create a Reliable and Sustainable Physical Infrastructure Objective 2.5 Improve the Capital Planning and Design Process Tactic 2.5.4 90% of designs complete within design budgeted fee Measure: Percentage of designs completed within the original design contract amount Balanced Scorecard Category: Internal Processes
Lead
Capital
41
Status
Tactic Measurement is 100%
STRATEGIC REVIEW by Fiscal Year (July-June)
# of designs with original budgeted fee
# of designs not within original
budgeted fee
%Designs complete w/in original design budgeted fee
Summary FY-13 3 1 75%
Summary FY-14 6 1 85%
1st Qtr. FY-14 1 0 100%
2nd Qtr. FY-14 n/a n/a n/a
3rd Qtr. FY-14 3 1 75%
4th Qtr. FY-14 2 0 100%
0
10
20
30
40
50
60
70
80
90
100
Goal 90%

Lead
Capital
GOAL #2 – Create a Reliable and Sustainable Physical Infrastructure Objective 2.6 Improve the Capital Construction Process Tactic 2.6.1 90% of capital construction Projects completed on time 2.6.2 95% of Capital Projects completed within the original construction contract amount or Guaranteed Maximum Price (GMP) plus 3% new construction 5% renovation (contingency)
ACTION PLAN
• CMs keep baseline schedules current & refer to them regularly, focus on design and construction end dates. • PMs & CMs discuss schedule (baseline & current) with end users, designers & contractors
– Use 3rd party construction scheduling consultant to evaluate contractor’s schedules – CMs dedicate a portion of each weekly construction meeting to compare 5-day look ahead with current construction
schedule to make sure the two are in sync • Inform designers and contractors of each other’s contractual schedule dates • PMs & CMs maintain & print project budgets & account reports monthly (have at all project meetings) • PMs share budgets with AVC and end users. • Hold contingency for unforeseen conditions, project requirements, inflation, etc.
– CMs schedule & facilitate systematic construction site visits with end users and FM staff – CMs communicate status of project contingency, change orders, etc.
• Manage construction scope creep – PMs use alternatives during bidding process to identify basis project needs. – PMs & CMs refer to advance planning document/SD/DD deliverables when assessing a change item request.
• Select qualified/experienced construction management teams – Field staff resumes need to identify similar projects (size, scale, complexity) experience and roles member played. – CMR Staffing proposals must clearly identify personnel with specific role and percentage of time to be assigned to our
project (TBD is not acceptable).
42

Facilities Management Strategic Planning Session – Fourth Quarter FY 2014 GOAL #2 – Create a Reliable and Sustainable Physical Infrastructure Objective 2.6 Improve the Capital Construction Process Tactic 2.6.1 90% of capital construction Projects completed on time Measure: Percentage of construction projects completed on or before the contract completion date (CCD) Balanced Scorecard Category: Customer Perspective
Lead
Capital
43
Tactic Measurement for 100%
Status
STRATEGIC
REVIEW by Fiscal
Year (July-June)
#
completed
on schedule
not
completed
on
schedule
%
completed
on time
Summary FY-13 1 2 33%
Summary FY-14 6 3 67%
1st Qtr. FY-14 4 3 57%
2nd Qtr. FY-14 0 0 N/A
3rd Qtr. FY-14 1 0 100%
4th Qtr. FY-14 1 0 100%
33%
67%
57%
0%
100% 100%
0%
10%
20%
30%
40%
50%
60%
70%
80%
90%
100% Goal 90%

Facilities Management Strategic Planning Session – Fourth Quarter FY 2014 GOAL #2 – Create a Reliable and Sustainable Physical Infrastructure Objective 2.6 Improve the Capital Construction Process Tactic 2.6.2 95% of Capital Projects completed within the original construction contract amount or Guaranteed Maximum Price (GMP) plus 3% new construction 5% renovation (contingency) Measure: Percentage of projects completed within the original contract amount or GMP plus 3% (contingency). Balanced Scorecard Category: Internal Business Process
Lead
Capital
44
Status
Tactic Measurement for 4th Quarter is 100%
Goal is 95%
STRATEGIC REVIEW by Fiscal Year (July-
June)
# completed on schedule
not completed on schedule
% of construction completed
within budget
Summary FY-13 1 2 33%
Summary FY-14 6 3 67%
1st Qtr. FY-14 4 3 57%
2nd Qtr. FY-14 0 0 N/A
3rd Qtr. FY-14 1 0 100%
4th Qtr. FY-14 1 0 100%
0%
20%
40%
60%
80%
100%
120%
0
10
20
30
40
50
60
70
80
90
100 90% 95%
GOAL #3
Foster a Customer Focused Organization
“People don’t want to
communicate with an
organization or a computer.
They want to talk to a real, live,
responsive, responsible person
who will listen and help them
get satisfaction.”
- Theo Michelson, State Farm
Insurance
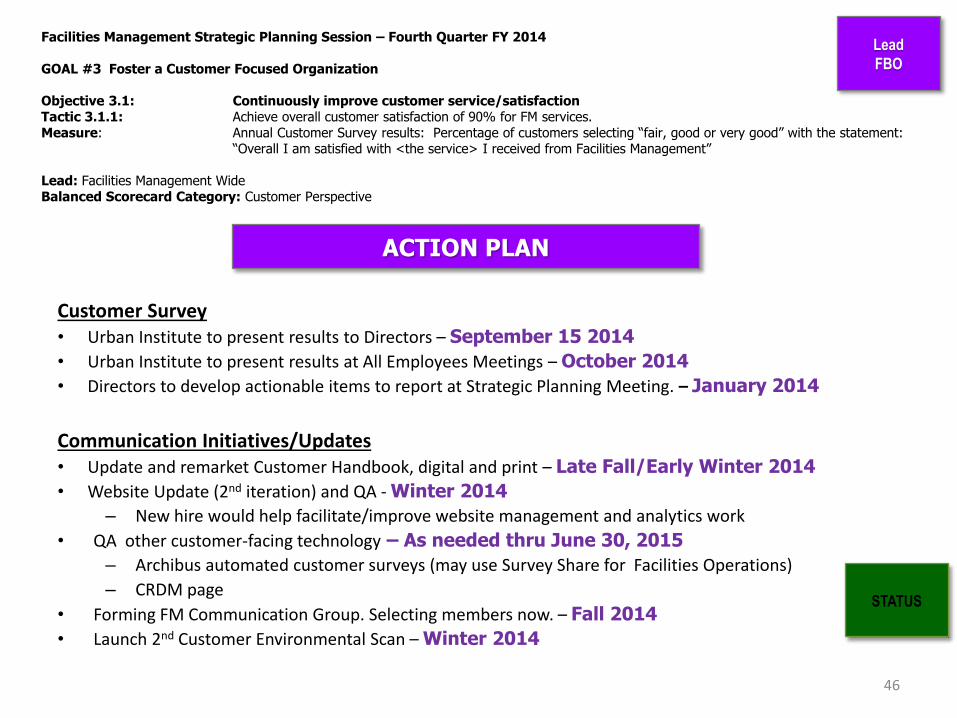
Facilities Management Strategic Planning Session – Fourth Quarter FY 2014 GOAL #3 Foster a Customer Focused Organization Objective 3.1: Continuously improve customer service/satisfaction Tactic 3.1.1: Achieve overall customer satisfaction of 90% for FM services. Measure: Annual Customer Survey results: Percentage of customers selecting “fair, good or very good” with the statement: “Overall I am satisfied with <the service> I received from Facilities Management” Lead: Facilities Management Wide Balanced Scorecard Category: Customer Perspective
Customer Survey • Urban Institute to present results to Directors – September 15 2014
• Urban Institute to present results at All Employees Meetings – October 2014
• Directors to develop actionable items to report at Strategic Planning Meeting. – January 2014
Communication Initiatives/Updates • Update and remarket Customer Handbook, digital and print – Late Fall/Early Winter 2014
• Website Update (2nd iteration) and QA - Winter 2014
– New hire would help facilitate/improve website management and analytics work
• QA other customer-facing technology – As needed thru June 30, 2015
– Archibus automated customer surveys (may use Survey Share for Facilities Operations)
– CRDM page
• Forming FM Communication Group. Selecting members now. – Fall 2014
• Launch 2nd Customer Environmental Scan – Winter 2014
46
STATUS
Lead
FBO
ACTION PLAN

Facilities Management Strategic Planning Session – Fourth Quarter FY 2014 GOAL #3 Foster a Customer Focused Organization Objective 3.1: Continuously improve customer service/satisfaction Tactic 3.1.1: Achieve Measure: Lead: FBO Balanced Scorecard Category: Customer Perspective
47
Lead
FBO
ACTION PLAN
External Marketing Campaign: “Creating A Campus of Distinction”
• Solicit feedback/input from Directors and Employees – Fall 2014
• Execute campaign tactics (testimonials, LCD signage, website, etc.) – Winter 2014
Branding As opportunities arise through June 30, 2015
• All external customer-facing materials
Internal Communication As opportunities arise through June 30, 2015
• Communications workshop added to FM Leadership Academy. Operations Writing Workshops completed June 2014.
• Expand FM audience and subject materials – Fall/Winter2014
STATUS

Facilities Management Strategic Planning Session - Fourth Quarter FY 2014 GOAL #3 Foster a Customer Focused Organization Objective 3.1: Continuously improve customer service/satisfaction Tactic 3.1.1: Achieve Measure: Lead: FBO Balanced Scorecard Category: Customer Perspective
48
STATUS
Lead
FBO
ACTION PLAN
Customer Communications Plan
• Solicit input/feedback from customers, Directors and other key players - Fall 2014
• Execute tactics (SOPs - dependent on situations, forms, etc.) - Fall/Winter 2014
Publicity/Public Relations - As opportunities arise through June 30, 2015
• For FY 2014, 82 documented mass-view FM news items in varying media channels:
UNC Charlotte Magazine
University homepage website
University FB and Twitter
Inside UNC Charlotte
Local news, magazines, interviews
Trade publications
• Campus Construction Reports, Campus-Wide notifications, etc. STATUS

Facilities Management Strategic Planning Session – Fourth Quarter FY 2014
Communications - Special Projects
49
STATUS
Lead
FBO
ACTION PLAN
• APPA Award for Excellence Publicity - Summer 2014
• Sustainability Magazine Launch– Early Fall 2014
– Writing 100% completed; editing 85% completed – Everything turned over to U Marketing/Graphic Designer -< 5 business days – Final editing & proofing – Late Summer/Early Fall 2014
• Editing FM award submissions, announcements, etc. – As needed through June 30, 2015
• Intranet – Spring 2015
STATUS
Facilities Management Strategic Planning Session – Fourth Quarter FY 2014
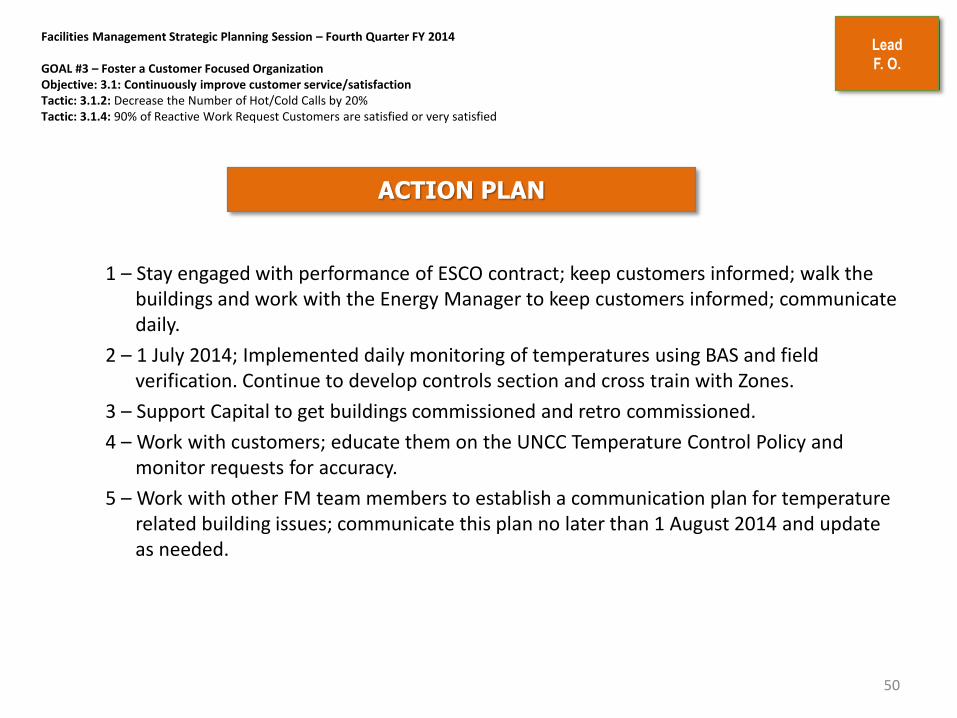
GOAL #3 – Foster a Customer Focused Organization Objective: 3.1: Continuously improve customer service/satisfaction Tactic: 3.1.2: Decrease the Number of Hot/Cold Calls by 20% Tactic: 3.1.4: 90% of Reactive Work Request Customers are satisfied or very satisfied
ACTION PLAN
1 – Stay engaged with performance of ESCO contract; keep customers informed; walk the buildings and work with the Energy Manager to keep customers informed; communicate daily.
2 – 1 July 2014; Implemented daily monitoring of temperatures using BAS and field verification. Continue to develop controls section and cross train with Zones.
3 – Support Capital to get buildings commissioned and retro commissioned.
4 – Work with customers; educate them on the UNCC Temperature Control Policy and monitor requests for accuracy.
5 – Work with other FM team members to establish a communication plan for temperature related building issues; communicate this plan no later than 1 August 2014 and update as needed.
50
Lead
F. O.

Facilities Management Strategic Planning Session – Fourth Quarter FY 2014
GOAL #3 – Foster a Customer Focused Organization Objective: 3.1: Continuously improve customer service/satisfaction Tactic: 3.1.2: Decrease the Number of Hot/Cold Calls by 20% Measure: Number of Hot/Cold Calls submitted on work requests Lead: Facilities Operations Balance Scorecard Category: Customer Perspective
51
Lead
F. O.
STATUS
0
20
40
60
80
100
120
140
160
180
200
220
1st Qtr FY14 2nd Qtr FY14 3rd Qtr FY14 4th Qtr FY14 Annual Average
Total162
Total173
Total205
Total133
Total
168.25
Hot101 Hot
91Hot86
Hot106 Hot
96
Cold61
Cold82
Cold119
Cold27
Cold72.25
Decrease the Number of Hot/Cold Calls
Goal Decreasethe Number by20%(138.4)
Total
Hot
Cold

GOAL #4
Recruit, Develop, and Retain Quality Employees
"All growth depends upon activity.
There is no development
physically or intellectually without
effort, and effort means work."
-- Calvin Coolidge,
30th U.S. president

Facilities Management Strategic Planning Session – Fourth Quarter FY 2014 GOAL #4 Recruit, Develop and Retain Quality Employees Objective 4.1: Recruit a Qualified Workforce in a Timely Fashion Tactic 4.1.1: Vacancy time of no longer than 80 calendar days – Nonexempt Vacancy time of no longer than 120 calendar days - Exempt Tactic 4.1.2: Reduce Number of Employees Terminated During Probationary Period to less than 5% Lead: Facilities Business Office Balanced Scorecard Category: Innovation & Learning
53
Lead
FBO
ACTION PLAN
• Monitor position vacancies and hiring processes to ensure 6- month abolishment threshold is not reached - As appropriate through June 30, 2015
• Ensure all position descriptions/postings contains verbiage that request necessary communication skills, computer skills, English
language comprehension skills and skills that demonstrate an employee’s ability to work/interact with others to increase qualified applicant pools - As appropriate through June 30, 2015
• Monitor timeframe of applicant referral to interview to hire. Maintain communications with hiring supervisors requesting status
updates. Provide assistance as needed and/or request to keep the process moving - As appropriate through June 30, 2015 • Develop resources that result in increased applicant pools, resulting in a more diverse and qualified pool of applicants for referral and
selection - As appropriate through June 30, 2015 • With the new 24-Month Probationary Period, monitor separation data that allows accurate reporting of employee turnover during the
probationary period – August 22, 2015
• Provide assistance to hiring supervisors on appropriate verbiage when establishing selection criteria and non-selection rationale in postings and hiring proposals to ensure an efficient turnaround on approvals of both - As appropriate through June 30, 2015
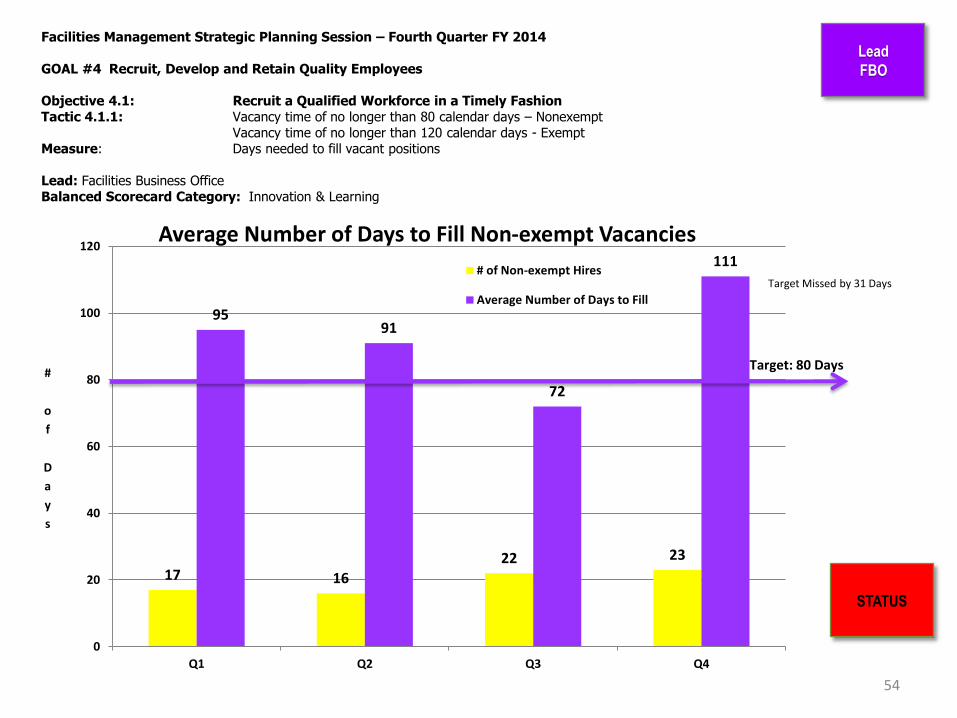
Facilities Management Strategic Planning Session – Fourth Quarter FY 2014 GOAL #4 Recruit, Develop and Retain Quality Employees Objective 4.1: Recruit a Qualified Workforce in a Timely Fashion Tactic 4.1.1: Vacancy time of no longer than 80 calendar days – Nonexempt Vacancy time of no longer than 120 calendar days - Exempt Measure: Days needed to fill vacant positions Lead: Facilities Business Office Balanced Scorecard Category: Innovation & Learning
54
STATUS
Lead
FBO
17 16
22 23
95 91
72
111
0
20
40
60
80
100
120
Q1 Q2 Q3 Q4
#
o
f
D
a
y
s
Average Number of Days to Fill Non-exempt Vacancies
# of Non-exempt Hires
Average Number of Days to Fill
Target: 80 Days
Target Missed by 31 Days

Facilities Management Strategic Planning Session – Fourth Quarter FY 2014 GOAL #4 Recruit, Develop and Retain Quality Employees Objective 4.1: Recruit a Qualified Workforce in a Timely Fashion Tactic 4.1.1: Vacancy time of no longer than 80 calendar days – Nonexempt Vacancy time of no longer than 120 calendar days - Exempt Measure: Days needed to fill vacant positions Lead: Facilities Business Office Balanced Scorecard Category: Innovation & Learning
55
STATUS
Lead
FBO
3 4 3 2
86
97
120
92
0
10
20
30
40
50
60
70
80
90
100
110
120
Q1 Q2 Q3 Q4
#
o
f
D
a
y
s
Average Number of Days to Fill Exempt (Salaried) Vacancies
# of Exempt Hires
Average Number of Days to Fill
Below Target by 28 Days
Target 120 Days

Facilities Management Strategic Planning Session – Fourth Quarter FY 2014 GOAL #4 Recruit, Develop and Retain Quality Employees Objective 4.1: Recruit a Qualified Workforce in a Timely Fashion Tactic 4.1.2: Reduce Number of Employees Terminated During Probationary Period to less than 5% Measure: Percent Employees Terminated before end of probationary period Lead: Facilities Business Office Balanced Scorecard Category: Innovation & Learning
STATUS
Lead
FBO
2
5
2
1
3
1
0 0
10
7 7
5
0
2
4
6
8
10
12
Q1 Q2 Q3 Q4
#
o
f
S
e
p
a
r
a
t
i
o
n
s
Employee's Separated During FY 14 # of SeparationsRETIREMENT
# of SeparationsINVOLUNTARY
# of SeparationsRESIGNATIONS
0 Terminated During
Probationary Period
Total Separations Q1 = 14 Q2 = 13 Q3 = 10 Q4 = 6
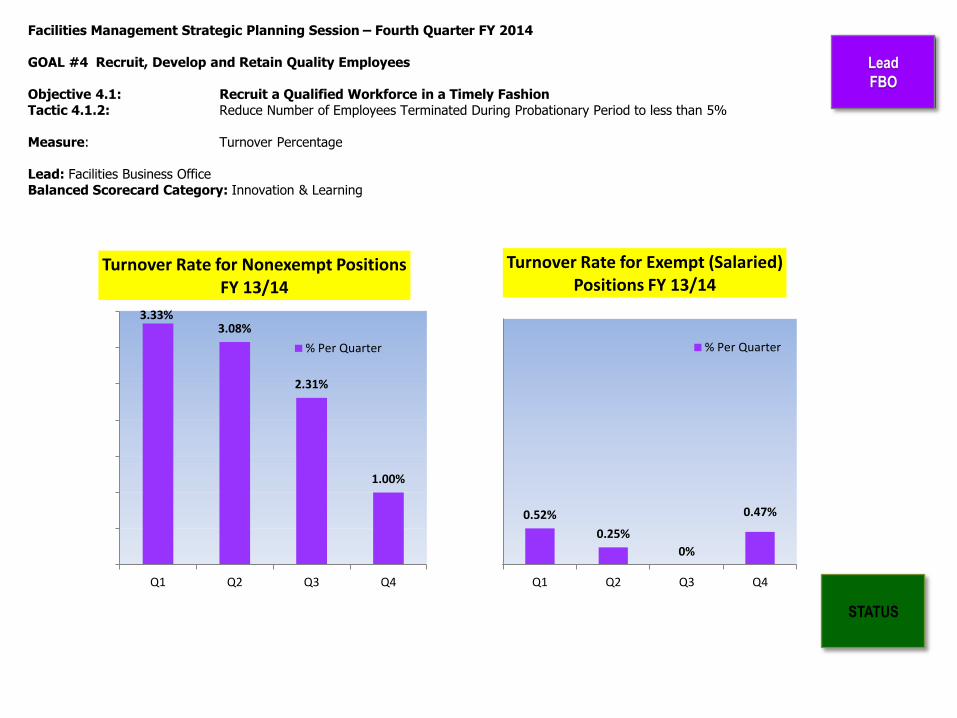
Facilities Management Strategic Planning Session – Fourth Quarter FY 2014 GOAL #4 Recruit, Develop and Retain Quality Employees Objective 4.1: Recruit a Qualified Workforce in a Timely Fashion Tactic 4.1.2: Reduce Number of Employees Terminated During Probationary Period to less than 5% Measure: Turnover Percentage Lead: Facilities Business Office Balanced Scorecard Category: Innovation & Learning
STATUS
Lead
FBO
3.33% 3.08%
2.31%
1.00%
Q1 Q2 Q3 Q4
Turnover Rate for Nonexempt Positions FY 13/14
% Per Quarter
0.52%
0.25%
0%
0.47%
Q1 Q2 Q3 Q4
Turnover Rate for Exempt (Salaried) Positions FY 13/14
% Per Quarter

Facilities Management Strategic Planning Session – Fourth Quarter FY 2014 GOAL #4 Recruit, Develop and Retain Quality Employees Objective 4.1: Recruit a Qualified Workforce in a Timely Fashion Tactic 4.1.2: Reduce Number of Employees Terminated During Probationary Period to less than 5% Measure: Lead: Facilities Business Office Balanced Scorecard Category: Innovation & Learning
Meet with FM Departments and identify training needs in the area of Employee Relations – December, 2014
SPA Employee Grievance Policy - effective 5/1/2014
The 3 causes for disciplinary action
Steps in the progressive discipline process
Required/Appropriate documentation in the disciplinary process
Complete individual training sessions specific to departmental needs – June 30, 2015
Discipline is not an independent event. It is part of a larger process.
We need to think of documentation as a roadmap showing how you got to a certain stage in the discipline process. Why document… because memory is selective and unreliable … because in the event of a grievance or lawsuit you will be required to provide a written record supporting your actions… because if you didn’t document it, then it didn’t happen!
Increase employee awareness regarding (their) access to our HRMS (PeopleAdmin) – Started July, 2014 and ongoing
Position Description
Work Plan
Performance Evaluation
ACTION PLAN
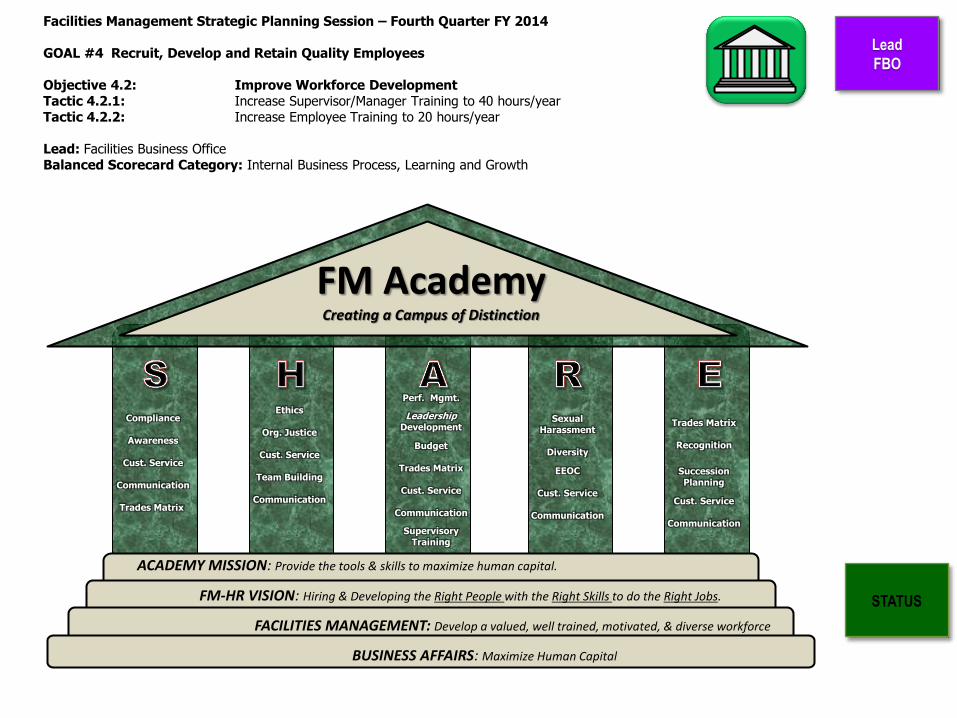
Facilities Management Strategic Planning Session – Fourth Quarter FY 2014 GOAL #4 Recruit, Develop and Retain Quality Employees Objective 4.2: Improve Workforce Development Tactic 4.2.1: Increase Supervisor/Manager Training to 40 hours/year Tactic 4.2.2: Increase Employee Training to 20 hours/year Lead: Facilities Business Office Balanced Scorecard Category: Internal Business Process, Learning and Growth
Lead
FBO
STATUS
Compliance
Awareness
Cust. Service
Communication
Trades Matrix
Ethics
Org. Justice
Cust. Service
Team Building
Communication
Perf. Mgmt.
Leadership Development
Budget
Trades Matrix
Cust. Service
Communication
Supervisory Training
Sexual Harassment
Diversity
EEOC
Cust. Service
Communication
Trades Matrix
Recognition
Succession Planning
Cust. Service
Communication
FM Academy Creating a Campus of Distinction
FM-HR VISION: Hiring & Developing the Right People with the Right Skills to do the Right Jobs.
ACADEMY MISSION: Provide the tools & skills to maximize human capital.
BUSINESS AFFAIRS: Maximize Human Capital
FACILITIES MANAGEMENT: Develop a valued, well trained, motivated, & diverse workforce

FM ACADEMY
Technical
– VFD Training Completed - July 2013
– Pump Repair & Maintenance Completed - December 2013
– PLCs for Non-programmers Completed - February 2014
– EPA 608 Technician Certification Exam Completed - May 2014
– HVAC Matrix development August 2014
– “Preparing for the NC SP-FA/LV Electrical Examination” Completed - June 2014
“Mini-Series” training sessions (partnering with Grainger)
– LED lighting Completed - September 2013
– FIRE STOP Completed - October 2013
Safety Awareness – Supervisor Safety Talks Monthly
– OSHA 30-hour certification/training Completed - June 2014
Leadership – APPA Supervisor Toolkit workshop (UNCC hosted) Completed - March 2014
– “Supervisory Communication & the Art of Eating Pizza” Completed - June 2014
– Documentation & Disciplinary Process Fall 2014
– Cultural Awareness/Inclusion Program June 2015
– Administrative Developmental Matrix Completed - February 2014
– NEO redesign June 2015
Facilities Management Strategic Planning Session – Fourth Quarter FY 2014 GOAL #4 Recruit, Develop and Retain Quality Employees Objective 4.2: Improve Workforce Development Tactic 4.2.1: Increase Supervisor/Manager Training to 40 hours/year Tactic 4.2.2: Increase Employee Training to 20 hours/year Lead: Facilities Business Office Balanced Scorecard Category: Internal Business Process, Learning and Growth
60
STATUS
Lead
FBO
ACTION PLAN
Action Item Completed

Facilities Management Strategic Planning Session – Fourth Quarter FY 2014 GOAL #4 Recruit, Develop and Retain Quality Employees Objective 4.2: Improve Workforce Development Tactic 4.2.1: Increase Supervisor/Manager Training to 40 hours/year Tactic 4.2.2: Increase Employee Training to 20 hours/year Lead: Facilities Business Office Balanced Scorecard Category: Internal Business Process, Learning and Growth
Lead
FBO
Technical
• Pump Repair & Maintenance 480 hours
• VFDs (Variable Frequency Drives) 384 hours
• PLC’s for Non-Programmers 480 hours
Leadership
• APPA Supervisors Toolkit Workshop 640 hours
• Supervisory Communication & the Art of Eating Pizza 30 hours
Professional Development
• Women's Summit 115 hours
• APPA Institute, State Construction Conf. 125 hours
Safety Awareness
• OSHA 30 Hour training/certification 1,200 hours
• Fire Stop Training 58 hours
Administrative
• Microsoft Office training 40 hours
Learning & Development With Examples Hours Completed
NOTE: meetings are being scheduled with department heads to discuss learning & development needs for FY 15. FM-
HR will develop the FM Academy “Lending Library” to provide a variety of learning resources for FM employees.

Facilities Management Strategic Planning Session – Fourth Quarter FY 2014 GOAL #4 Recruit, Develop and Retain Quality Employees Objective 4.2: Improve Workforce Development Tactic 4.2.1: Increase Supervisor/Manager Training to 40 hours/year Measure: Average Hours of Training completed by Supervisors and Managers Lead: Facilities Business Office Balanced Scorecard Category: Internal Business Process, Learning and Growth
62
Lead
FBO
Annual Target = 40 hrs ea (49 X 40 hrs ea = 1,960 hrs)
0
400
800
1200
1600
2000
Q1 Q2 Q3 Q4
FY 14 Training Hours for Supervisors & Managers by Quarter
Training Hours by QTR
YTD Training Hours
Training Hours
FY 2014 Results: Target - 1,960 hrs
----------------------------- Actual YTD
1,884 hrs (96%)
127.75 hrs
250.75 hrs
378.5 hrs
182.5 hrs
561.00 hrs
1,322.5 hrs
1,884 hrs
STATUS

Facilities Management Strategic Planning Session – Fourth Quarter FY 2014 GOAL #4 Recruit, Develop and Retain Quality Employees Objective 4.2: Improve Workforce Development Tactic 4.2.2: Increase Employee Training to 20 hours/year Measure: Average Hours of Training completed by front line employees Lead: Facilities Business Office Balanced Scorecard Category: Internal Business Process. Learning and Growth
63
STATUS
Lead
FBO
Training Hours
Annual Target - 20 hrs ea (388 x 20 hrs ea = 7,760 hrs)
0
1000
2000
3000
4000
5000
6000
7000
8000
Q1 Q2 Q3 Q4
FY 14 Training Hours for front line employees by Quarter
Training Hours by QTR
YTD Training Hours
1,263.25 hrs
0
1000
2000
3000
4000
5000
6000
7000
8000
Q1 Q2 Q3 Q4
Training Hours by QTR
YTD Training Hours
1,263.25 hrs
1,356.4 hrs
2,619.65 hrs
1,420.15 hrs
4,040.15 hrs
Fiscal 2014 Results: Annual Target- 7,760 hrs
--------------------------- Actual YTD
5,231 hrs (67 %)
5,231.4 hrs
1191.25 hrs STATUS

Facilities Management Strategic Planning Session – Fourth Quarter FY 2014 GOAL #4 Recruit, Develop and Retain Quality Employees Objective 4.3: Create and Maintain a Quality Work Environment Tactic 4.3.1: 90% of Employees satisfied or very satisfied working in FM Tactic 4.3.2: 87% of Employees satisfied or very satisfied in each unit of FM Lead: Facilities Business Office Balanced Scorecard Category: Customer Perspective
Survey Results and Data Review:
• Preliminary results were presented to the Directors on January 15th and to FM at the January 2014 AEM meeting.
• Survey report distributed to all Directors (February/March 2014).
• Directors to develop actionable items based on survey feedback for report out during April SP Meeting.
Survey Logistics:
• Continue to improve practice of working with BES and FO leadership to schedule use of computer lab for employees in their respective areas for FY 15 survey - October 2014.
• Update survey instrument based on feedback from employees (add progress bar, investigate adding a comment box after each section or field for employees to provide feedback, etc.) – October 2014
• Next survey should be administered in November 2014.
64
Lead
F. O.
Lead
FBO
ACTION PLAN

Facilities Management Strategic Planning Session – Fourth Quarter FY 2014 GOAL #4 Recruit, Develop and Retain Quality Employees Objective 4.3: Create and Maintain a Quality Work Environment Tactic 4.3.1: 90% of Employees satisfied or very satisfied working in FM Measure: Annual Employee Work Climate Survey Lead: Facilities Business Office Balanced Scorecard Category: Customer Perspective
65
Lead
F. O.
STATUS
Lead
FBO
ON HOLD

Facilities Management Strategic Planning Session – Fourth Quarter FY 2014 GOAL #4 Recruit, Develop and Retain Quality Employees Objective 4.3: Create and Maintain a Quality Work Environment Tactic 4.3.2: 87% of Employees satisfied or very satisfied in each unit of FM Measure: Annual Employee Work Climate Survey Lead: Facilities Business Office Balanced Scorecard Category: Customer Perspective
66
Lead
F. O.
STATUS
Lead
FM
Operational
Units
ON HOLD
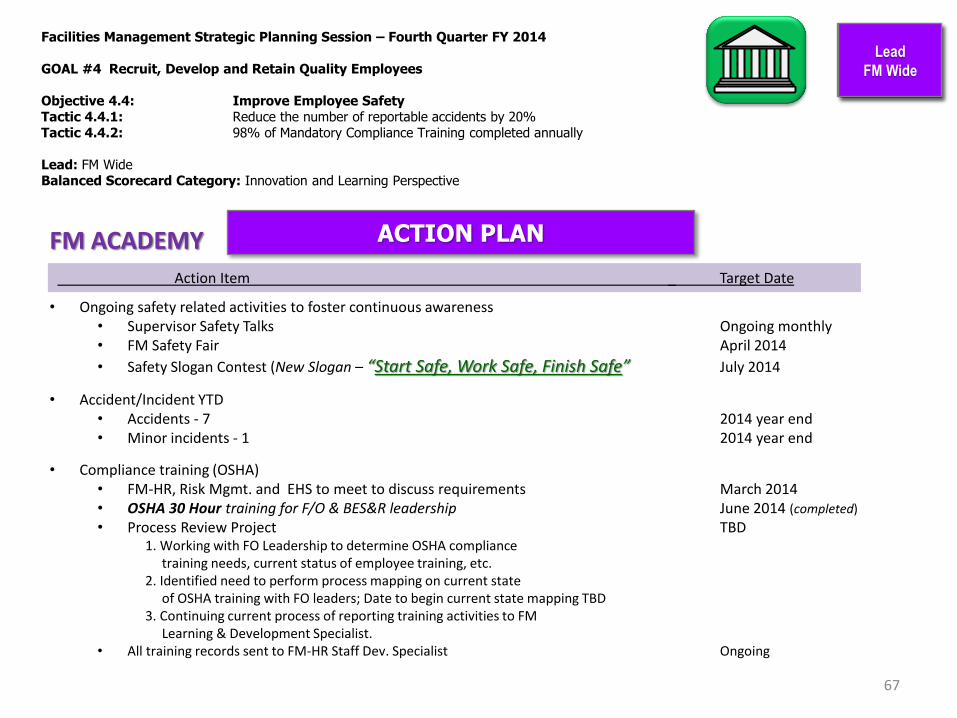
Facilities Management Strategic Planning Session – Fourth Quarter FY 2014 GOAL #4 Recruit, Develop and Retain Quality Employees Objective 4.4: Improve Employee Safety Tactic 4.4.1: Reduce the number of reportable accidents by 20% Tactic 4.4.2: 98% of Mandatory Compliance Training completed annually Lead: FM Wide Balanced Scorecard Category: Innovation and Learning Perspective
67
Lead
F. O.
Lead
FM Wide
ACTION PLAN FM ACADEMY
Action Item _ Target Date
• Ongoing safety related activities to foster continuous awareness • Supervisor Safety Talks Ongoing monthly • FM Safety Fair April 2014
• Safety Slogan Contest (New Slogan – “Start Safe, Work Safe, Finish Safe” July 2014
• Accident/Incident YTD • Accidents - 7 2014 year end • Minor incidents - 1 2014 year end
• Compliance training (OSHA) • FM-HR, Risk Mgmt. and EHS to meet to discuss requirements March 2014 • OSHA 30 Hour training for F/O & BES&R leadership June 2014 (completed)
• Process Review Project TBD 1. Working with FO Leadership to determine OSHA compliance training needs, current status of employee training, etc. 2. Identified need to perform process mapping on current state of OSHA training with FO leaders; Date to begin current state mapping TBD 3. Continuing current process of reporting training activities to FM Learning & Development Specialist.
• All training records sent to FM-HR Staff Dev. Specialist Ongoing

Facilities Management Strategic Planning Session – Fourth Quarter FY 2014 GOAL #4 Recruit, Develop and Retain Quality Employees Objective 4.4: Improve Employee Safety Tactic 4.4.1: Reduce the number of reportable accidents by 20% Measure: Number of Reportable Accidents (Measured by Calendar Year) Lead: FM Wide Balanced Scorecard Category: Innovation and Learning Perspective
68
STATUS
Lead
FM Wide
45
37
40
2826
24
17
24
19
11
77 64
20
1
57
1 1
0
5
10
15
20
25
30
35
40
45
50
2004 2005 2006 2007 2008 2009 2010 2011 2012 2013 2014
Accidents (Long Form) First Aid Only
FM Accident Trends
YTD
Target ≤ 9

Facilities Management Strategic Planning Session – Fourth Quarter FY 2014 GOAL #4 Recruit, Develop and Retain Quality Employees Objective 4.4: Improve Employee Safety Tactic 4.4.2: 98% of Mandatory Compliance Training completed annually Measure: Percent of employees completing mandatory compliance training Lead: Facilities Business Office Balanced Scorecard Category: Innovation and Learning Perspective
69
Lead
F. O.
STATUS
Lead
FM Wide
Mandatory compliance training (OSHA)
• Periodic meetings with EH&S to review needs, processes, etc. • OSHA 30 Hour training delivered in June 2014 • Identified need to perform process mapping on current OSHA training with FO Leaders;
Date to begin current state mapping TBD. First meeting to be tentatively held in mid-May.
• Research training providers/vendors to help fill training gaps, as needed.
20%

Facilities Management Strategic Planning Session – Fourth Quarter FY 2014 GOAL #4 Recruit, Develop and Retain Quality Employees Objective 4.5: Improve Workforce Performance (Action Plan Only) Lead: Facilities Business Office Balanced Scorecard Category: Innovation and Learning Perspective
70
Lead
F. O.
Lead
FM Wide
ACTION PLAN
• Further development of FM Academy
– Marketing Strategy & Website Development July 2014
– Content Development Ongoing
– Vendor Selection and Delivery As Needed/As Funded
• HVAC Matrix Development – meetings ongoing August 2014
Action Item Target Date
GOAL #5
Promote Good Stewardship
"The more positive you are
when you think and work
toward your goals, the faster
you achieve them.”
-- Brian Tracy, Speaker, Author,
Consultant
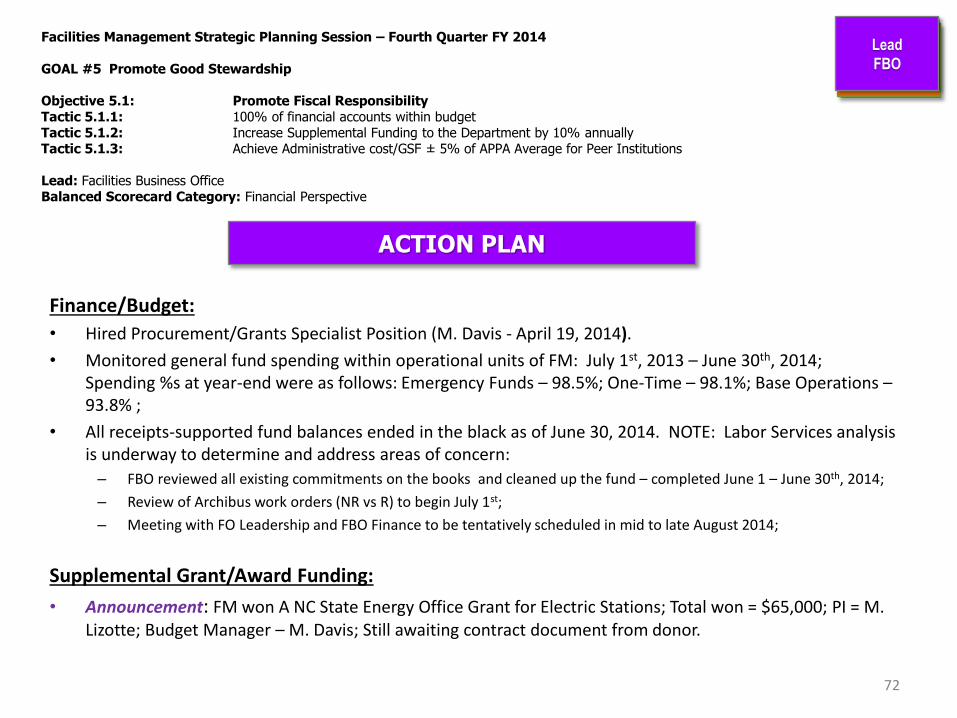
Facilities Management Strategic Planning Session – Fourth Quarter FY 2014 GOAL #5 Promote Good Stewardship Objective 5.1: Promote Fiscal Responsibility Tactic 5.1.1: 100% of financial accounts within budget Tactic 5.1.2: Increase Supplemental Funding to the Department by 10% annually Tactic 5.1.3: Achieve Administrative cost/GSF ± 5% of APPA Average for Peer Institutions Lead: Facilities Business Office Balanced Scorecard Category: Financial Perspective
Finance/Budget:
• Hired Procurement/Grants Specialist Position (M. Davis - April 19, 2014).
• Monitored general fund spending within operational units of FM: July 1st, 2013 – June 30th, 2014; Spending %s at year-end were as follows: Emergency Funds – 98.5%; One-Time – 98.1%; Base Operations – 93.8% ;
• All receipts-supported fund balances ended in the black as of June 30, 2014. NOTE: Labor Services analysis is underway to determine and address areas of concern:
– FBO reviewed all existing commitments on the books and cleaned up the fund – completed June 1 – June 30th, 2014;
– Review of Archibus work orders (NR vs R) to begin July 1st;
– Meeting with FO Leadership and FBO Finance to be tentatively scheduled in mid to late August 2014;
Supplemental Grant/Award Funding:
• Announcement: FM won A NC State Energy Office Grant for Electric Stations; Total won = $65,000; PI = M. Lizotte; Budget Manager – M. Davis; Still awaiting contract document from donor.
72
Lead
F. O.
Lead
FBO
ACTION PLAN

Facilities Management Strategic Planning Session – Fourth Quarter FY 2014 GOAL #5 Promote Good Stewardship Objective 5.1: Promote Fiscal Responsibility Tactic 5.1.1: 100% of financial accounts within budget Tactic 5.1.2: Increase Supplemental Funding to the Department by 10% annually Tactic 5.1.3: Achieve Administrative cost/GSF ± 5% of APPA Average for Peer Institutions Lead: Facilities Business Office Balanced Scorecard Category: Financial Perspective
Supplemental Grant/Award Funding con’t:
• Search for grant and award possibilities for Facilities Management organizations. For those grants requiring “matching funds”, ensure buy-in from AVC prior to submitting proposals – thru June 2015;
• Submit Award application for APPA Effective and Innovative Practices; Due November 2014;
• Submit Campus Tree USA application – Due December 31, 2014.
Cost Accounting:
• Devise strategy to improve cost accounting measures within all areas of Facilities Management (org code usage, account code usage, budget revisions, etc.) – July – September 2014;
• Request an entry-level accountant position for FY 15 to assist in this area – May 2014.
• Improve use of account codes across FM; Currently addressing on the front end with 49er Mart, but other issues are occurring where there is no upfront oversight by FBO (i.e., Archibus NR work orders); increase monitoring efforts July 1, 2014 thru June 30, 2015 close out.
73
Lead
F. O.
Lead
FBO
ACTION PLAN

Facilities Management Strategic Planning Session – Fourth Quarter FY 2014 GOAL #5 Promote Good Stewardship Objective 5.1: Promote Fiscal Responsibility Tactic 5.1.1: 100% of financial accounts within budget Measure: Main Operating Fund Variance Report Lead: Facilities Business Office Balanced Scorecard Category: Financial Perspective
74
Lead
F. O.
STATUS
Lead
FBO

Facilities Management Strategic Planning Session – Fourth Quarter FY 2014 GOAL #5 Promote Good Stewardship Objective 5.1: Promote Fiscal Responsibility Tactic 5.1.2: Increase Supplemental Funding to the Department by 10% annually Measure: Percent increase in supplemental funding Lead: Facilities Business Office Balanced Scorecard Category: Financial Perspective
75
Lead
F. O.
STATUS
Lead
FBO

Facilities Management Strategic Planning Session – Fourth Quarter FY 2014 GOAL #5 Promote Good Stewardship Objective 5.1: Promote Fiscal Responsibility Tactic 5.1.3: Achieve Administrative cost/GSF ± 5% of APPA Average for Peer Institutions Measure: Administrative cost/GSF from annual APPA Facilities Performance Indicators Report (APPA Benchmark) Lead: Facilities Business Office Balanced Scorecard Category: Financial Perspective
76
Lead
F. O.
STATUS
Lead
FBO
$0.00
$0.10
$0.20
$0.30
$0.40
$0.50
$0.60
$0.70
East CarolinaUniversity
Portland StateUniversity
University ofNew Mexico
UNC Charlotte University ofTexas SanAntonio
SRAPPA Region
$0.50 $0.50
$0.60
$0.40 $0.40
$0.50
$ p
er
GSF
FY 13 Administrative Total Cost per GSF
Overall APPA Avg. = $0.48 Target = $0.456 UNC Charlotte = $0.40

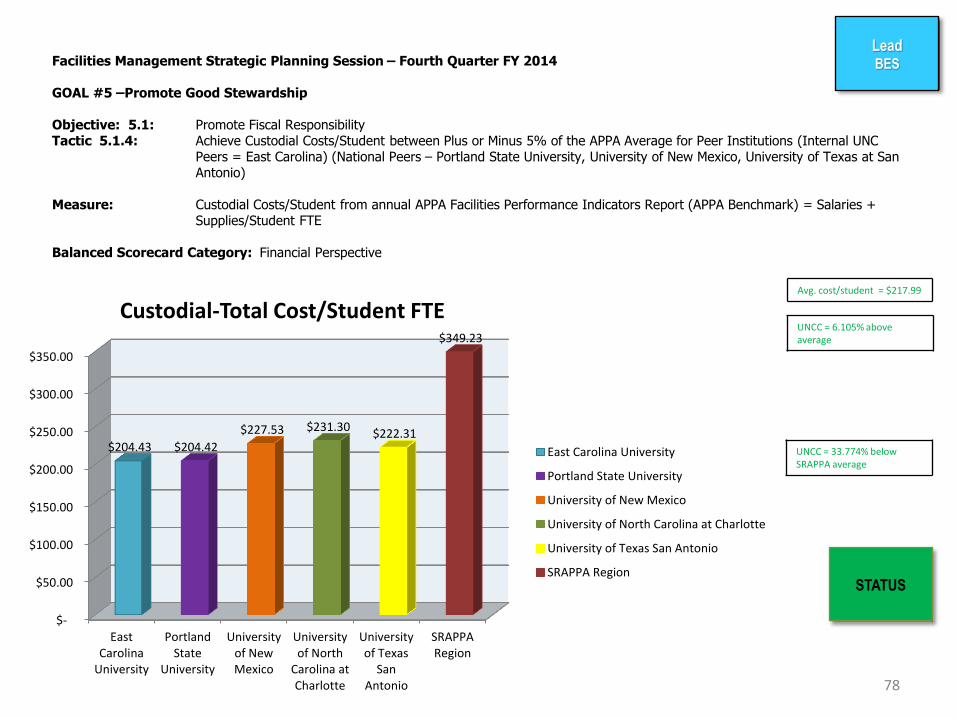
GOAL #5 – Promote Good Stewardship Objective: 5.1: Promote Fiscal Responsibility Tactic 5.1.4: Achieve Custodial Costs/Student FTE Plus or Minus 5% of the APPA Average for Peer Institutions (Internal UNC Peers = East Carolina) (National Peers – Portland State University, University of New Mexico, University of Texas at San Antonio)
ACTION PLAN
• Actions Completed
– Submitted square footage cleaned by BES to FBO for inclusion in the annual APPA survey
– Received one-time funds for supply chain management project (project underway)
– Completed hand dryer pilot study paper count in Fretwell
– Completed hand dryer pilot study survey (of building occupants) in Fretwell
• Actions Planned
– Complete supply chain management project in McEniry (one-time funds)
– Review February paper use count in Fretwell
– Review Hand dryer survey (of building occupants) in Fretwell
– Make recommendation to continue or stop hand dryer installations
– Develop a BES strategic dashboard that tracks cost, quality, and process data points over time
– Monitor and report custodial cost/student FTE on an annual basis using data from APPA survey
77
Lead BES
78
Avg. cost/student = $217.99
UNCC = 6.105% above average
Facilities Management Strategic Planning Session – Fourth Quarter FY 2014 GOAL #5 –Promote Good Stewardship
Objective: 5.1: Promote Fiscal Responsibility Tactic 5.1.4: Achieve Custodial Costs/Student between Plus or Minus 5% of the APPA Average for Peer Institutions (Internal UNC
Peers = East Carolina) (National Peers – Portland State University, University of New Mexico, University of Texas at San Antonio)
Measure: Custodial Costs/Student from annual APPA Facilities Performance Indicators Report (APPA Benchmark) = Salaries + Supplies/Student FTE Balanced Scorecard Category: Financial Perspective
Lead BES
STATUS
UNCC = 33.774% below SRAPPA average
$-
$50.00
$100.00
$150.00
$200.00
$250.00
$300.00
$350.00
EastCarolina
University
PortlandState
University
Universityof NewMexico
Universityof North
Carolina atCharlotte
Universityof Texas
SanAntonio
SRAPPARegion
$204.43 $204.42
$227.53 $231.30 $222.31
$349.23
Custodial-Total Cost/Student FTE
East Carolina University
Portland State University
University of New Mexico
University of North Carolina at Charlotte
University of Texas San Antonio
SRAPPA Region

Facilities Management Strategic Planning Session – Fourth Quarter FY 2014
GOAL #5 – Promote Good Stewardship Objective: 5.1: Promote Fiscal Responsibility Tactic: 5.1.5: Achieve total Maintenance cost/GSF ± 5% of APPA Average for Peer Institutions Tactic: 5.1.6: Achieve total Landscape cost/acre ± 5% of APPA Average for Peer Institutions Tactic: 5.1.7: All Receipt Supported Funds Accounts have a positive balance at the end of the fiscal year
ACTION PLAN
1 – Establish guidelines for qualifying reimbursable vs non-reimbursable work requests (To Charge or Not To Charge) by 30 September 2014.
2 – Identify opportunities to expand reimbursable work in an effort to support labor services funds 25 November 2014
3 – Realign the labor services positions to ensure maximum utilization of resources by 28 October 2014.
4 – Weekly review of Facilities Operations Labor pool before going outside for additional staff support.
5 – Monthly review of Labor Services accounts with FBO to identify gaps and improve processes.
79
Lead
F. O.

Facilities Management Strategic Planning Session – Fourth Quarter FY 2014
GOAL #5 – Promote Good Stewardship Objective: 5.1: Promote Fiscal Responsibility Tactic: 5.1.5: Achieve total Maintenance cost/GSF ± 5% of APPA Average for Peer Institutions Measure: Maintenance cost/GSF from annual APPA Facilities Performance Indicators Report (APPA Benchmark) Lead: Facilities Operations Balance Scorecard: Financial Perspective
80
Lead
F. O.
STATUS $0.00
$0.50
$1.00
$1.50
$2.00
$2.50
East CarolinaUniversity
Portland StateUniversity
University ofNew Mexico
UNC Charlotte427 Acres
University ofTexas SanAntonio
SRAPPARegion
$1.90
$1.10$1.00
$2.10 $2.10
$1.40
Maintenance Total per GSF
East Carolina University
Portland State University
University of New Mexico
UNC Charlotte427 Acres
University of Texas San Antonio
SRAPPA Region
Avg. cost/student = $1.64Goal = $1.56UNC Charlotte = 28.05% above

Facilities Management Strategic Planning Session – Fourth Quarter FY 2014
GOAL #5 – Promote Good Stewardship Objective: 5.1: Promote Fiscal Responsibility Tactic: 5.1.6: Achieve total Landscape cost/acre ± 5% of APPA Average for Peer Institutions Measure: Landscape cost/acre from annual APPA Facilities Performance Indicators Report (APPA Benchmark) Lead: Facilities Operations Balance Scorecard: Financial Perspective
81
Lead
F. O.
STATUS $0.00
$1.00
$2.00
$3.00
$4.00
$5.00
$6.00
$7.00
ECU Portland StateUniversity
University of NewMexico
UNC Charlotte427 Acres
University of TexasSan Antonio
SRAPPA Region
$5.10
$6.70
$3.20 $3.30
$1.70
$4.40
Grounds - Total Cost per Acre
ECU
Portland State University
University of New Mexico
UNC Charlotte427 Acres
University of Texas San Antonio
SRAPPA Region
Average Cost = $4.00Goal = $3.80UNC Charlotte = 17.5% below average

Facilities Management Strategic Planning Session – Fourth Quarter FY 2014
GOAL #5 – Promote Good Stewardship Objective: 5.1: Promote Fiscal Responsibility Tactic: 5.1.7: All Receipt Supported Funds Accounts have a positive balance at the end of the fiscal year Measure: Dollars in account at end of fiscal year Lead: Facilities Operations Balance Scorecard: Financial Perspective
82
Lead
F. O.
STATUS
($34,079.00)
($22,656.00)($19,200.00)
($90,000.00)($95,000.00)
($87,500.00)
($80,000.00)
($72,500.00)
($65,000.00)
($57,500.00)
($50,000.00)
($42,500.00)
($35,000.00)
($27,500.00)
($20,000.00)
($12,500.00)
($5,000.00)
$2,500.00
$10,000.00
1st Qtr FY14 2nd Qtr FY14 3rd Qtr FY14 4th Qtr FY14
Dollars In Account at end of Fiscal Year
Goal to be positive at end of fiscal year
Lead
Recycling
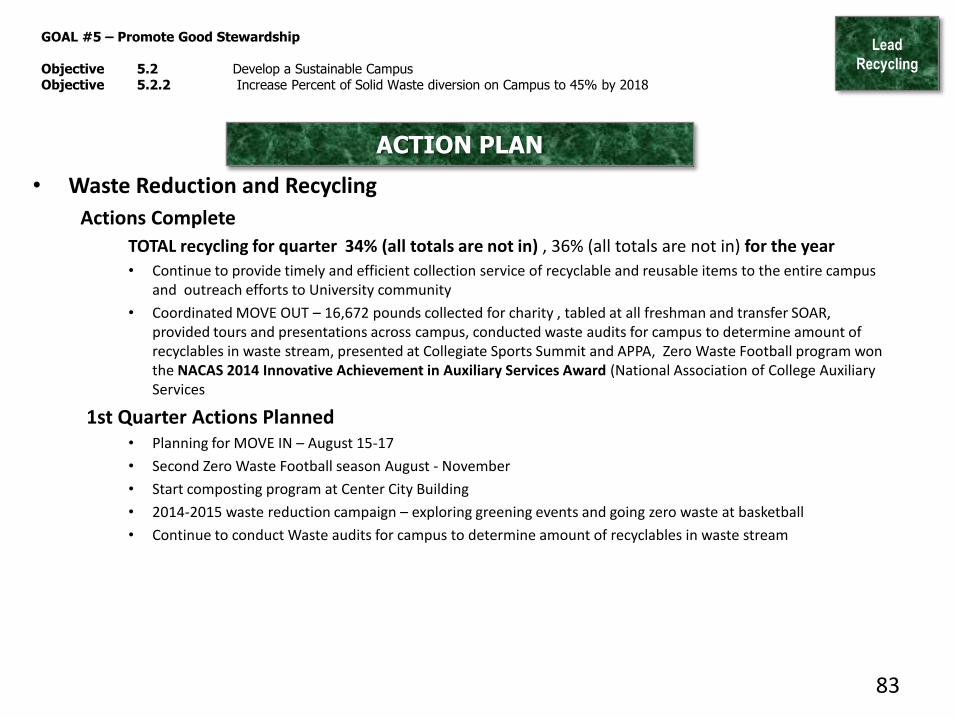
GOAL #5 – Promote Good Stewardship Objective 5.2 Develop a Sustainable Campus Objective 5.2.2 Increase Percent of Solid Waste diversion on Campus to 45% by 2018
ACTION PLAN
• Waste Reduction and Recycling
Actions Complete
TOTAL recycling for quarter 34% (all totals are not in) , 36% (all totals are not in) for the year
• Continue to provide timely and efficient collection service of recyclable and reusable items to the entire campus and outreach efforts to University community
• Coordinated MOVE OUT – 16,672 pounds collected for charity , tabled at all freshman and transfer SOAR, provided tours and presentations across campus, conducted waste audits for campus to determine amount of recyclables in waste stream, presented at Collegiate Sports Summit and APPA, Zero Waste Football program won the NACAS 2014 Innovative Achievement in Auxiliary Services Award (National Association of College Auxiliary Services
1st Quarter Actions Planned • Planning for MOVE IN – August 15-17
• Second Zero Waste Football season August - November
• Start composting program at Center City Building
• 2014-2015 waste reduction campaign – exploring greening events and going zero waste at basketball
• Continue to conduct Waste audits for campus to determine amount of recyclables in waste stream
83
Facilities Management Strategic Planning Session – Fourth Quarter FY 2014 Objective 5.2: Develop a Sustainable Campus Tactic 5.2.1 Increase Recycling of Construction and Demolition Materials on Capital Projects to 80% of Total C&D Waste Measure: Pounds of C & D Waste Recycled divided by Total Pounds of C & D Waste Balanced Scorecard Category: Innovation and Learning Perspective
Lead
Recycling
84
60.4% 60.4%
44.4%
0
200
400
600
800
1,000
1,200
FY 13 FY 14 Total Qtr
Ton
s
Construction & Demolition Debris Diversion 4th Quarter FY14
Tons Landfilled
Tons Recycled
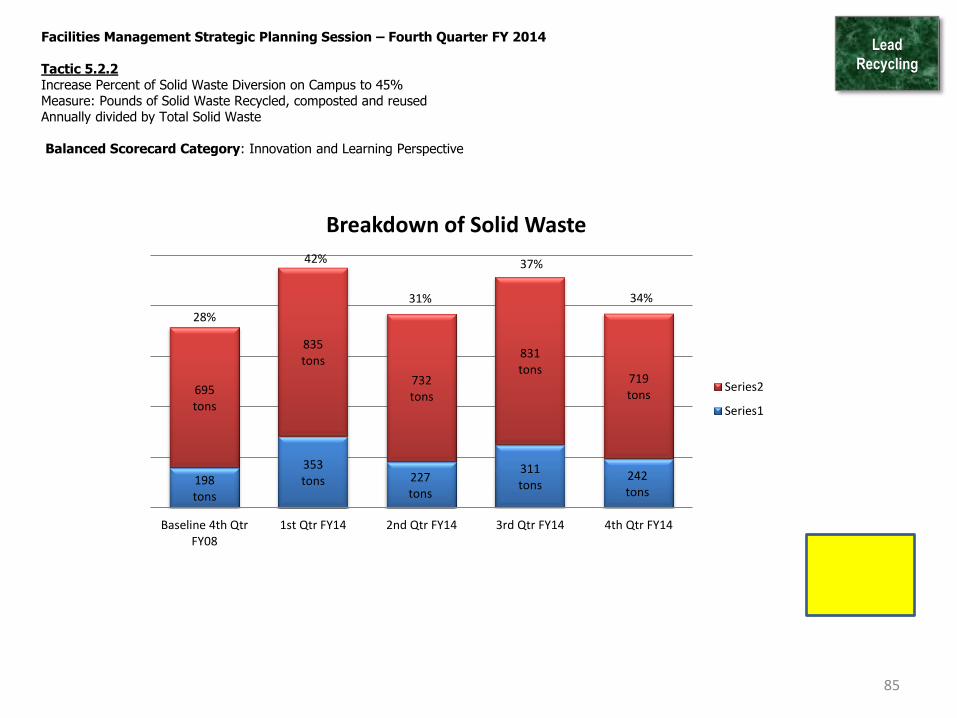
Facilities Management Strategic Planning Session – Fourth Quarter FY 2014 Tactic 5.2.2 Increase Percent of Solid Waste Diversion on Campus to 45% Measure: Pounds of Solid Waste Recycled, composted and reused Annually divided by Total Solid Waste Balanced Scorecard Category: Innovation and Learning Perspective
Lead
Recycling
85
198 tons
353 tons 227
tons
311 tons
242 tons
695 tons
835 tons
732 tons
831 tons
719 tons
28%
42%
31%
37%
34%
Baseline 4th QtrFY08
1st Qtr FY14 2nd Qtr FY14 3rd Qtr FY14 4th Qtr FY14
Breakdown of Solid Waste
Series2
Series1
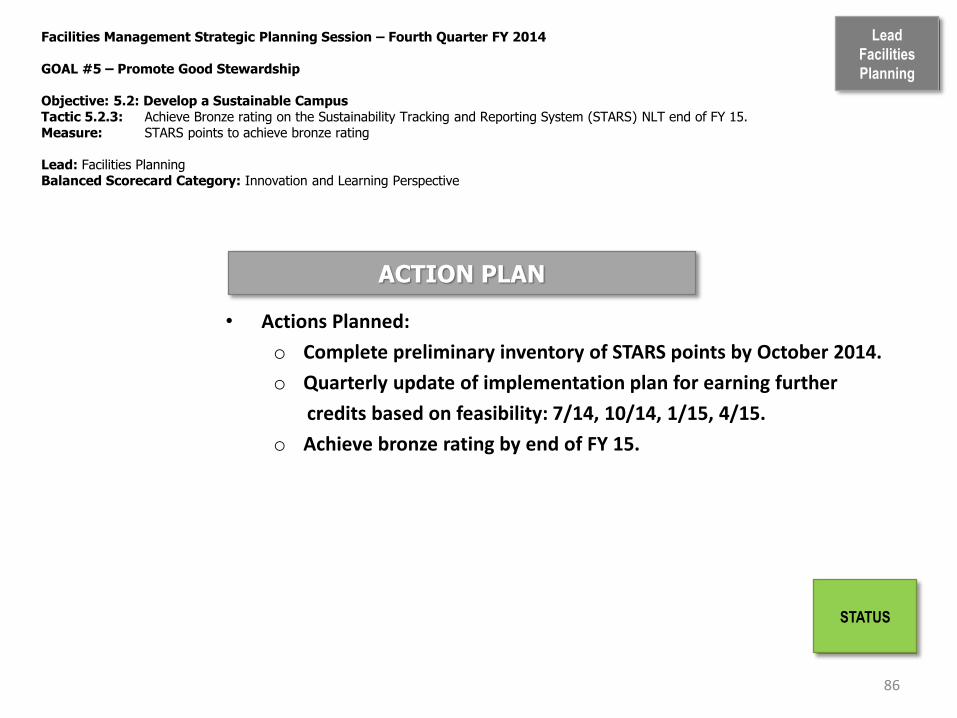
Facilities Management Strategic Planning Session – Fourth Quarter FY 2014 GOAL #5 – Promote Good Stewardship Objective: 5.2: Develop a Sustainable Campus Tactic 5.2.3: Achieve Bronze rating on the Sustainability Tracking and Reporting System (STARS) NLT end of FY 15. Measure: STARS points to achieve bronze rating Lead: Facilities Planning Balanced Scorecard Category: Innovation and Learning Perspective
86
ACTION PLAN
• Actions Planned:
o Complete preliminary inventory of STARS points by October 2014.
o Quarterly update of implementation plan for earning further
credits based on feasibility: 7/14, 10/14, 1/15, 4/15.
o Achieve bronze rating by end of FY 15.
Lead
Facilities
Planning
STATUS
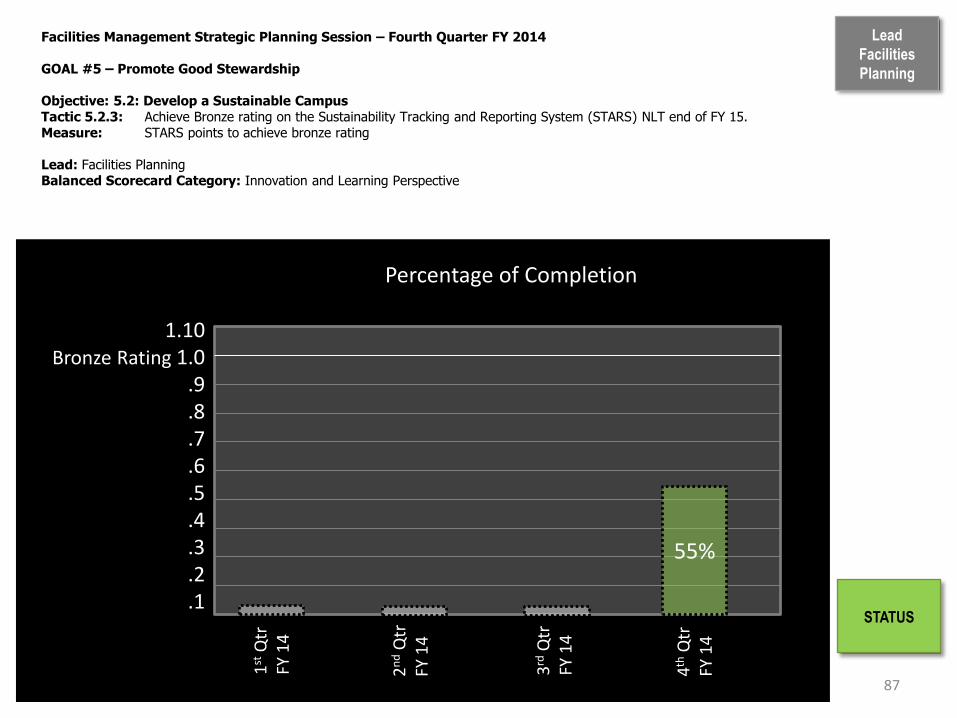
Lead
Facilities
Planning
87
Percentage of Completion
4th
Qtr
FY
14
1st
Qtr
FY
14
2n
d Q
tr
FY 1
4
3rd
Qtr
FY
14
1.10 Bronze Rating 1.0
.9
.8
.7
.6
.5
.4
.3
.2
.1
Facilities Management Strategic Planning Session – Fourth Quarter FY 2014 GOAL #5 – Promote Good Stewardship Objective: 5.2: Develop a Sustainable Campus Tactic 5.2.3: Achieve Bronze rating on the Sustainability Tracking and Reporting System (STARS) NLT end of FY 15. Measure: STARS points to achieve bronze rating Lead: Facilities Planning Balanced Scorecard Category: Innovation and Learning Perspective
55%
STATUS

Facilities Management Strategic Planning Session – Fourth Quarter FY 2014 GOAL #5 – Promote Good Stewardship Objective: 5.2: Develop a Sustainable Campus Tactic 5.2.4: Implement 60% of the Campus Sustainability Plan best practices NLT end of FY 15. Measure: Percent of Campus Sustainability Plan best practices implemented Lead: Facilities Planning Balanced Scorecard Category: Innovation and Learning Perspective
88
ACTION PLAN
• Actions Planned:
o Assess use of identified best practices (from Sustainability and Climate Action Plans, completed in May), including timeline and probable costs for additional implementation, by October 2014.
o Draft annual plan and budget by January 2015 to achieve implementation of 60% of identified best practices.
o Demonstrate 60% of best practices implemented by October 2015.
Lead
Facilities
Planning
STATUS

Lead
Facilities
Planning
89
Percentage of Completion
4th
Qtr
FY
14
1st
Qtr
FY
14
2n
d Q
tr
FY 1
4
3rd
Qtr
FY
14
1.0 .9 .8 .7
Best Practices .6 .5 .4 .3 .2 .1 0
Facilities Management Strategic Planning Session – Fourth Quarter FY 2014 GOAL #5 – Promote Good Stewardship Objective: 5.2: Develop a Sustainable Campus Tactic 5.2.4: Implement 60% of the Campus Sustainability Plan best practices NLT end of FY 15. Measure: Percent of Campus Sustainability Plan best practices implemented Lead: Facilities Planning Balanced Scorecard Category: Innovation and Learning Perspective
33%
STATUS

Lead
Capital
GOAL #5 – Promote Good Stewardship Objective 5.3 Conserve Natural Resources Tactics 5.3.1 Decrease Energy Usage 30% by FY2015
ACTIONS TO REDUCE CAMPUS ENERGY USAGE
90
• Performance Contract wrapping up
• Will reduce campus consumption by another 4%
• System Wide Lighting Performance Contract - scheduled to go into
construction Nov 2014
• Continue retro-commissioning program
• Exterior Lighting upgrades to LED
• Street light replacements fixtures to be finalized by end of
August – lights to be replaced by end of year.
• Pedestrian Lights to be replaced as funds become available –
start with campus core.

Facilities Management Strategic Planning Session – 4th QTR FY 2014 GOAL #5 – Promote Good Stewardship Objective 5.3 Conserve Natural Resources Tactics 5.3.1 Decrease Energy Usage by 30% by FY2015 Measure: BTUs/GSF/Year consumed on campus
Balanced Scorecard Category: Financial Perspective
Lead
Capital
STATUS
CAMPUS ENERGY USAGE
Kbtu/GSF
Base Year FY 2003 Current Reduction 28% Mandated Reduction 30% BY FY 15
124
111 117
120 125
120 124
117 113
109
93 90
87
0
20
40
60
80
100
120
140
FY03 FY04 FY05 FY06 FY07 FY08 FY09 FY10 FY11 FY12 FY13 FY14 FY15GOAL

Facilities Management Strategic Planning Session – 4th QTR FY 2014 GOAL #5 – Promote Good Stewardship Objective 5.3 Conserve Natural Resources Tactics 5.3.2 Decrease Water Usage by 20% by FY2010 Measure: Gallons/GSF/Year consumed on campus
Balanced Scorecard Category: Financial Perspective
Lead
Capital
92
STATUS
Still need to reduce water usage to help preserve valuable resources
Goal 43 Gal/GSF
Actual 19 Gal/GSF
54
40
36 36
32 34
29
32
43
34 34
24
19
-
10
20
30
40
50
60
FY03 FY04 FY05 FY06 FY07 FY08 FY09 FY10 GOAL FY11 FY12 FY13 FY14

Lead
Capital
GOAL #5 – Promote Good Stewardship Objective 5.4: Improve Historically Underutilized Businesses (HUB) Participation Tactic 5.4.1: 12% HUB participation on 80% of Capital Projects Tactic 5.4.2: 5% African American Participation on Capital Projects
ACTION PLAN
Conduct/participate in events promoting utilization of HUB firms
• Construction “Meet & Greet” – October 7, 2014
• Charlotte MED Week – TBD
Establish/emphasize project specific HUB participation goals for single prime projects Campus-wide Roof Replacements
CID Roadway Improvements – 15% goal / 11.4% achieved
Review GFE documentation for compliance before 1st tier subcontracts are awarded
Work with internal/external groups to identify qualified contractors
93

Facilities Management Strategic Planning Session – Fourth Quarter FY2014 GOAL #5 – Promote Good Stewardship Objective: 5.4: Improve Historically Underutilized Businesses (HUB) Participation Tactic 5.4.1: 12% HUB participation on 80% of Capital Projects Measure: Number of Individual Capital Projects achieving 12% HUB participation divided into Total Projects Completed Lead: Capital Projects
Balanced Scorecard Category: Financial Perspective
Lead
Capital
94
STATUS
0
1
2
3
4
5
6
7
8
9
10
HUB Participation Capital Projects > $500,000
Total Projects Completed
Projects with 12% HUBParticipation
70% 78%
100%
100%
80% GOAL
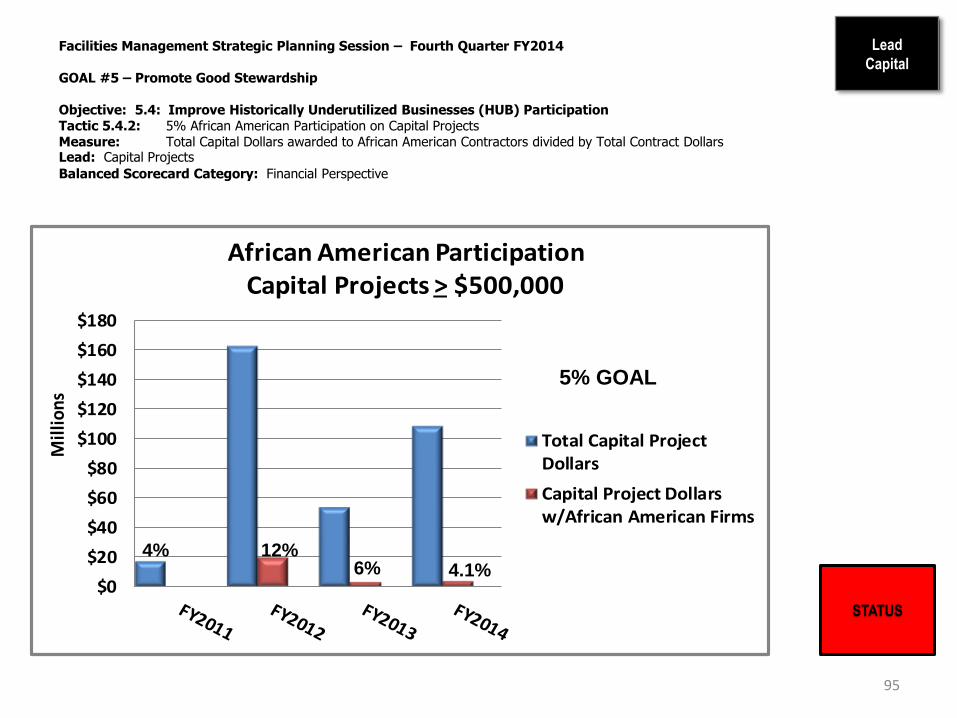
Facilities Management Strategic Planning Session – Fourth Quarter FY2014 GOAL #5 – Promote Good Stewardship Objective: 5.4: Improve Historically Underutilized Businesses (HUB) Participation Tactic 5.4.2: 5% African American Participation on Capital Projects Measure: Total Capital Dollars awarded to African American Contractors divided by Total Contract Dollars Lead: Capital Projects
Balanced Scorecard Category: Financial Perspective
Lead
Capital
95
STATUS
$0
$20
$40
$60
$80
$100
$120
$140
$160
$180
Mill
ions
African American Participation Capital Projects > $500,000
Total Capital ProjectDollars
Capital Project Dollarsw/African American Firms
4% 12% 6% 4.1%
5% GOAL
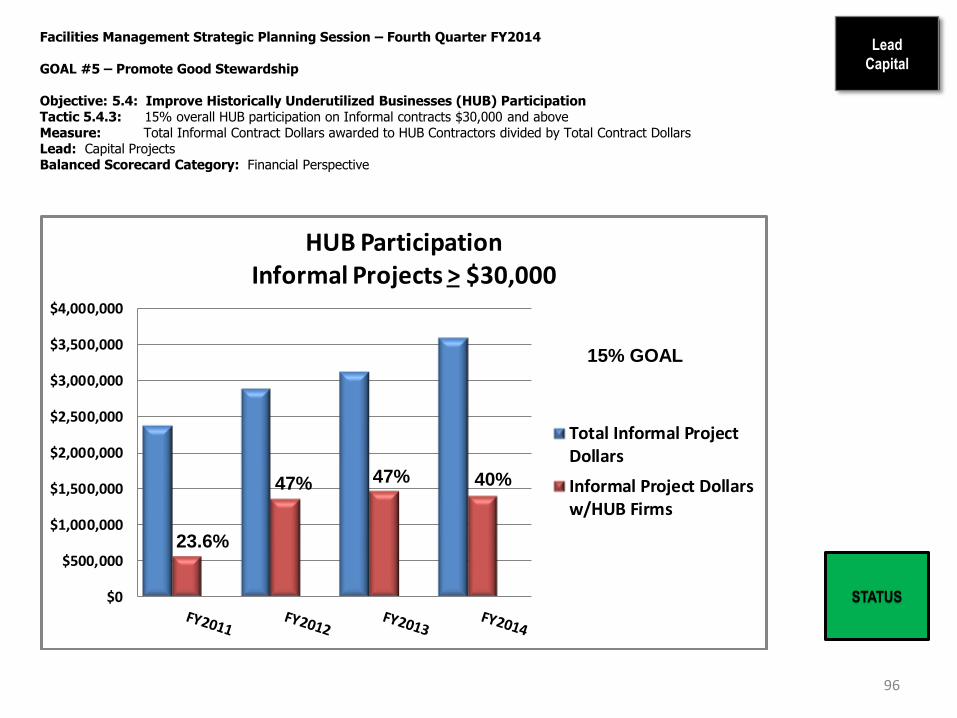
Facilities Management Strategic Planning Session – Fourth Quarter FY2014 GOAL #5 – Promote Good Stewardship Objective: 5.4: Improve Historically Underutilized Businesses (HUB) Participation Tactic 5.4.3: 15% overall HUB participation on Informal contracts $30,000 and above Measure: Total Informal Contract Dollars awarded to HUB Contractors divided by Total Contract Dollars Lead: Capital Projects Balanced Scorecard Category: Financial Perspective
Lead
Capital
96
STATUS $0
$500,000
$1,000,000
$1,500,000
$2,000,000
$2,500,000
$3,000,000
$3,500,000
$4,000,000
HUB Participation Informal Projects > $30,000
Total Informal ProjectDollars
Informal Project Dollarsw/HUB Firms
23.6%
47% 47% 40%
15% GOAL

Facilities Management Strategic Planning Session – Fourth Quarter FY 2014 GOAL #5 – Promote Good Stewardship Objective: 5.4: Improve Historically Underutilized Business (HUB) Participation Lead: Design Services Balanced Scorecard Category: Internal Business Process
97
Lead Design Services
Tactic 5.4.4: 13% overall HUB participation on informal projects below $30,000 including 3% African American Measure: Total Percentage of HUB participation on all Informal Projects below $30,000 (Construction only) divided by Total Contracts Tactic 5.4.5: 3% African American participation on Informal projects below $30,000 Measure: Total African American contract dollars (Construction only) divided by Total Contract Dollars
Design Services’ HUB participation improvement is currently focused on expanding our outreach to new African American contractors & vendors.
All Coordinators are encouraged to reach out to new vendors for work on our Under $30K projects - Ongoing.
ACTION PLANS FOR IMPROVEMENT
ONGOING IMPROVEMENTS
NEW IMPROVEMENTS
Added new HUB Electric Supply Company : Mayer Electric Supply Company, Inc. – Woman owned.
Project Coordinators continue to review and discuss HUB contractors and vendors at Design Services weekly meetings.
Amanda Caudle acts as advisor for other Coordinators.
Design Services and Facilities Information Systems are working to improve HUB reporting of contractors & vendors via ARCHIBUS Strategic Quarterly Reports.
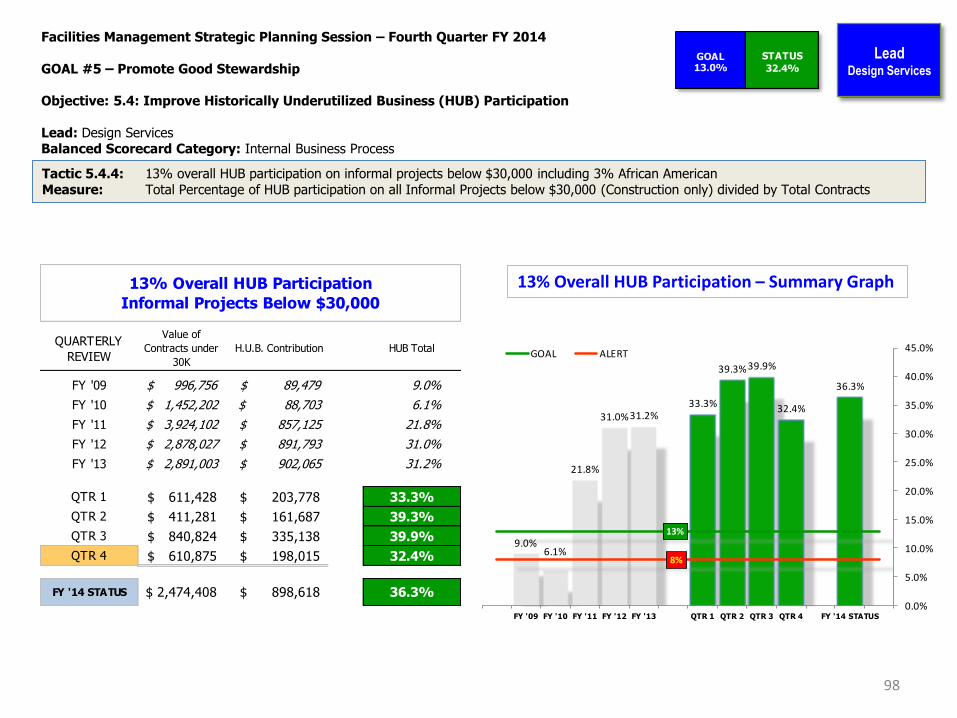
Facilities Management Strategic Planning Session – Fourth Quarter FY 2014 GOAL #5 – Promote Good Stewardship Objective: 5.4: Improve Historically Underutilized Business (HUB) Participation Lead: Design Services Balanced Scorecard Category: Internal Business Process
STATUS
32.4%GOAL13.0%
98
Lead Design Services
QUARTERLY
REVIEW
Value of
Contracts under
30K
H.U.B. Contribution HUB Total
FY '09 $ 996,756 $ 89,479 9.0%
FY '10 1,452,202$ 88,703$ 6.1%
FY '11 3,924,102$ 857,125$ 21.8%
FY '12 2,878,027$ 891,793$ 31.0%
FY '13 2,891,003$ 902,065$ 31.2%
QTR 1 611,428$ 203,778$ 33.3%
QTR 2 411,281$ 161,687$ 39.3%
QTR 3 840,824$ 335,138$ 39.9%
QTR 4 610,875$ 198,015$ 32.4%
FY '14 STATUS 2,474,408$ 898,618$ 36.3%
13% Overall HUB Participation
Informal Projects Below $30,000
9.0%6.1%
21.8%
31.0%31.2%33.3%
39.3%39.9%
32.4%
36.3%
13%
8%
0.0%
5.0%
10.0%
15.0%
20.0%
25.0%
30.0%
35.0%
40.0%
45.0%
FY '09 FY '10 FY '11 FY '12 FY '13 QTR 1 QTR 2 QTR 3 QTR 4 FY '14 STATUS
GOAL ALERT
13% Overall HUB Participation – Summary Graph
Tactic 5.4.4: 13% overall HUB participation on informal projects below $30,000 including 3% African American Measure: Total Percentage of HUB participation on all Informal Projects below $30,000 (Construction only) divided by Total Contracts

Facilities Management Strategic Planning Session – Fourth Quarter FY 2014 GOAL #5 – Promote Good Stewardship Objective: 5.4: Improve Historically Underutilized Business (HUB) Participation Lead: Design Services Balanced Scorecard Category: Internal Business Process
STATUS
4.9%GOAL3.0%
99
Lead Design Services
QUARTERLY
REVIEW
Value of
Contracts under
30K
African Am.
ContributionAfrican Am. Total
FY '09 $ 996,756 $ 40,894 4.1%
FY '10 1,452,202$ 73,987$ 5.1%
FY '11 3,924,102$ 77,377$ 2.0%
FY '12 2,878,027$ 46,475$ 1.6%
FY '13 2,891,003$ 115,219$ 4.0%
QTR 1 611,428$ 42,900$ 7.0%
QTR 2 411,281$ 25,172$ 6.1%
QTR 3 840,824$ 35,441$ 4.2%
QTR 4 610,875$ 29,914$ 4.9%
FY '14 STATUS 2,474,408$ 133,427$ 5.4%
3% African American Participation
Informal Projects Below $30,000
4.1%
5.1%
2.0% 1.6%
4.0%
7.0%
6.1%
4.2%
4.9%
5.4%
3%
2%
0.0%
1.0%
2.0%
3.0%
4.0%
5.0%
6.0%
7.0%
8.0%
FY '09 FY '10 FY '11 FY '12 FY '13 QTR 1 QTR 2 QTR 3 QTR 4 FY '14 STATUS
GOAL ALERT
3% African American Participation – Summary Graph
Tactic 5.4.5: 3% African American participation on Informal projects below $30,000 Measure: Total African American contract dollars divided by Total Contract Dollars


