facilities management quarterly strategic planning session
TRANSCRIPT

Facilities Management
Quarterly Strategic Planning Session
January 30, 2015
Second Quarter – Fiscal Year 2015
October - December 2014
AGENDA Three Facilities Challenges: A Status Report – Phil Jones
Campus Interactive Map – Fred Brillante
Strategic Planning Metrics and Actions Plans
Special Presentation: Department Demographics – Melanie Witherspoon
Employee Satisfaction Survey Action Plans
Look Ahead – Phil Jones
…Creating a Campus of Distinction

Goal 1 - Continuously Improve Operation of Campus Facilities
Goal 2 - Create a Reliable and Sustainable Physical Infrastructure
Goal 3 - Foster a Customer Focused Organization
Goal 4 - Recruit, Develop, and Retain Quality Employees
Goal 5 - Promote Good Stewardship
Facilities Management
…Creating a Campus of Distinction
Strategic Planning Session
Second Quarter – Fiscal Year 2015 October – December 2014
Facilities Management’s Goals
GOAL #1
Continuously Improve Operations of Campus
"In business, words are
words, explanations are
explanations, promises are
promises, but only
performance is reality."
-- Harold Geneen, industrialist
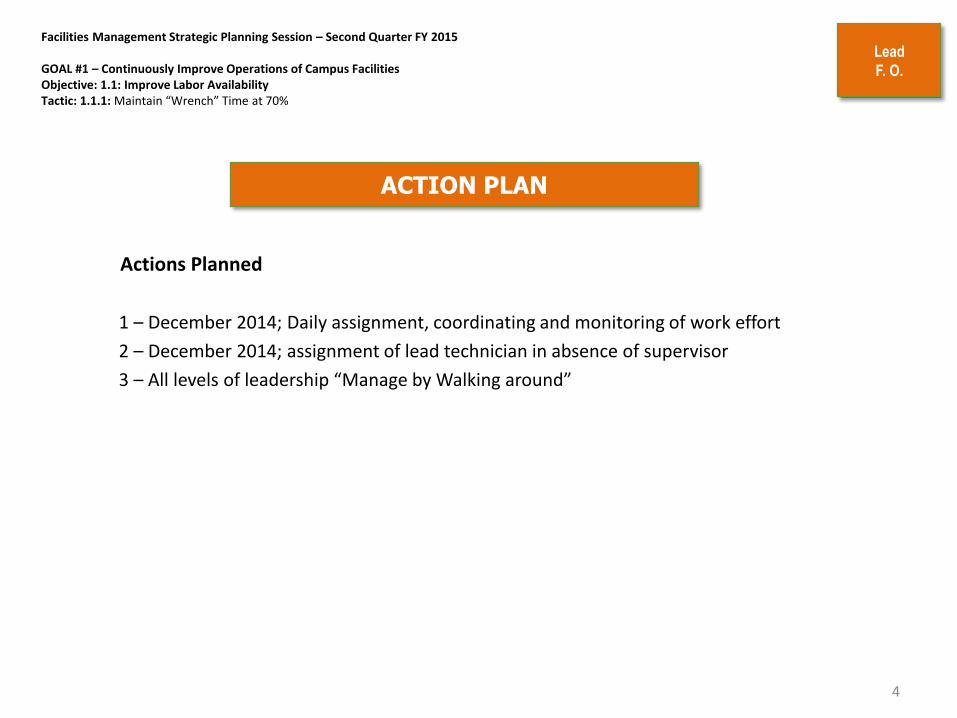
Facilities Management Strategic Planning Session – Second Quarter FY 2015 GOAL #1 – Continuously Improve Operations of Campus Facilities Objective: 1.1: Improve Labor Availability Tactic: 1.1.1: Maintain “Wrench” Time at 70%
ACTION PLAN
Actions Planned
1 – December 2014; Daily assignment, coordinating and monitoring of work effort
2 – December 2014; assignment of lead technician in absence of supervisor
3 – All levels of leadership “Manage by Walking around”
4
Lead
F. O.

Facilities Management Strategic Planning Session – Second Quarter FY 2015 GOAL #1 – Continuously Improve Operations of Campus Facilities Objective: 1.1: Improve Labor Availability Tactic: 1.1.1: Maintain “Wrench” Time at 70% Measure: Hours (total hours charged to work requests divided by total hours recorded) Lead: Facilities Operations Balanced Scorecard Category: Internal Business Process
Lead
F. O.
5
STATUS
81.5% 77.8%
0.0% 0.0%0.0%
10.0%
20.0%
30.0%
40.0%
50.0%
60.0%
70.0%
80.0%
90.0%
1st Qtr FY15 2nd Qtr FY15 3rd Qtr FY15 4th Qtr FY15
Wrench Time
Goal = MaintainWrench Time at70%

Facilities Management Strategic Planning Session – Second Quarter FY 2015
GOAL #1 – Continuously Improve Operations of Campus Facilities Objective: 1.2: Improve Logistics Efficiency Tactic: 1.2.1: Improve Non-stock on-time delivery to 95% Tactic: 1.2.2: Reduce Average Non-stock Requisition to Receipt Time to 3.5 Days
ACTION PLAN
Actions Planned
1 – Weekly review of items that have been ordered repeatedly as non-stock items to stock as order-on-request items (carried at an inventory level of “zero” but pre-sourced for faster ordering and delivery).
2 – Specifically track long lead items and spikes in usage (historically the main causes for inability to fill).
3 – Send out daily email reminders for approvers (Supervisors, Admins and Managers)
4 - Monitor the req to PO processing time and discuss weekly.
Actions Completed
1 - Promote the use of SDI Punch-out; conduct lunch and learn July 2014.
6
Lead
F. O.

Facilities Management Strategic Planning Session – Second Quarter FY 2015
GOAL #1 – Continuously Improve Operations of Campus Facilities Objective: 1.2: Improve Logistics Efficiency Tactic: 1.2.2: Reduce Average Non-stock Requisition to Receipt Time to 3.5 Days Measure: Average Days from requisition to receipt (SDI KPI – Non-stock Requisition to Receipt Time) Lead: Facilities Operations Balance Scorecard Category: Internal Business Process
7
Lead
F. O.
STATUS
4.47
5.35
3
3.5
4
4.5
5
5.5
1st Qtr FY15 2nd Qtr FY15 3rd Qtr FY15 4th Qtr FY15
REDUCE AVERAGE NON-STOCK REQUISITION TO RECEIPT TIME
Goal 3.5Days

Facilities Management Strategic Planning Session – Second Quarter FY 2015
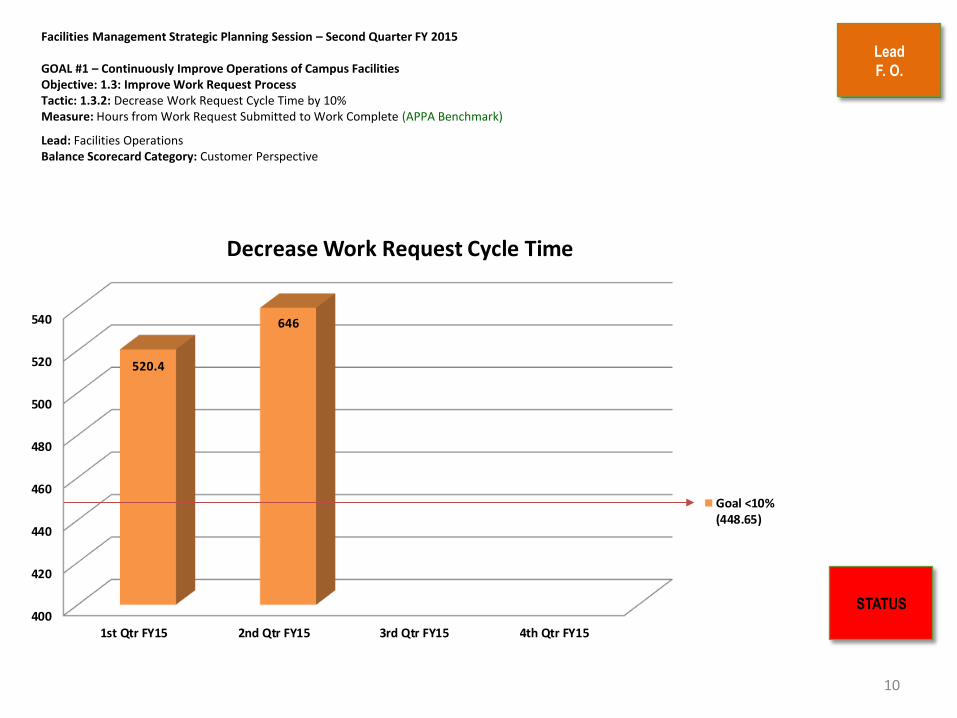
GOAL #1 – Continuously Improve Operations of Campus Facilities Objective: 1.3: Improve Work Request Process Tactic: 1.3.1: Decrease Number of Work Orders Over 14 Days Old by 15% Tactic: 1.3.2: Decrease Work Request Cycle Time by 10% Measure: Hours from Work Request Submitted to Work Complete (APPA Benchmark)
ACTION PLAN
Actions Planned
1 – Review of recurring services and scheduled services currently being completed using PM work request – Aug 2014
2 – Emphasize Facilities Operations OP-16 Timely and Accurate Handling/Processing of WRs.
3 – Weekly meeting with UPA and Managers to monitor 14 day report.
4 - Communicate work order priorities (Quarterly Customer, Building Liaison and specific College Meetings); implemented July 2014
8
Lead
F. O.

Facilities Management Strategic Planning Session – Second Quarter FY 2015
GOAL #1 – Continuously Improve Operations of Campus Facilities Objective: 1.3: Improve Work Request Process Tactic: 1.3.1: Decrease Number of Work Orders Over 14 Days Old by 15% Measure: Number of open reactive work orders over 14 Days from request (excluding scheduled work orders)
Lead: Facilities Operations Balance Scorecard Category: Customer Perspective
9
Lead
F. O.
STATUS
50
200
350
500
650
800
950
1100
1250
1400
1st Qtr FY15 2nd Qtr FY15 3rd Qtr FY15 4th Qtr FY15
862
953
Number of Work Orders Over 14 Days
Goal equals<15% (1232)
Facilities Management Strategic Planning Session – Second Quarter FY 2015
GOAL #1 – Continuously Improve Operations of Campus Facilities Objective: 1.3: Improve Work Request Process Tactic: 1.3.2: Decrease Work Request Cycle Time by 10% Measure: Hours from Work Request Submitted to Work Complete (APPA Benchmark)
Lead: Facilities Operations Balance Scorecard Category: Customer Perspective
10
STATUS
Lead
F. O.
400
420
440
460
480
500
520
540
1st Qtr FY15 2nd Qtr FY15 3rd Qtr FY15 4th Qtr FY15
520.4
646
Decrease Work Request Cycle Time
Goal <10%(448.65)

GOAL #1 – Continuously Improve Maintenance and Operations Objective: 1.4: Improve BES Processes Tactic 1.4.1: Achieve APPA Level 2 in 98% of Buildings
ACTION PLAN
• Actions Completed
– BES Lead Technicians identified (11/2014)
– Determined Zone and Shift assignments for all technicians and informed all BES Technicians of new assignments (12/2014)
– Conducted (OS1) volunteer meeting and Pilot Building walk-through (11/2014)
– Conducted interviews for Recycling Coordinator position (1/2015)
• Actions Planned
– Develop new task cards for all BES Zones (3/1/15)
– Conduct (OS1) Boot Camp and begin (OS1) Pilot in Friday building (end of FY14-FY15)
– Continue Re-engineering implementation planning meetings thru (3/1/15)
– Review and continue quarterly self audits (3/1/15)
11
Lead BES

Facilities Management Strategic Planning Session – Second Quarter FY 2015 GOAL #1 – Continuously Improve Maintenance and Operations of the Campus Objective: 1.4: Improve BES Processes Tactic 1.4.1: Achieve APPA Level 2 in 98% of Buildings Measure: Percentage of buildings meeting APPA Level 2 cleanliness standards during quarterly inspection (APPA Benchmark) Lead: Building Environmental Services Balanced Scorecard Category: Customer Perspective
Lead BES
12
STATUS
Percentage = 82%
70%
72%
74%
76%
78%
80%
82%
FY14-3rd QTRFY14-4th QTR
FY15-1st QTRFY15-2nd QTR
79%
74% 78%
82%
APPA LEVELS

Lead BES
13
0%
1%
2%
3%
4%
5%
6%
7%
8%
9% 8% 8%
9%
6%
9%
8%
Pe
rce
nta
ge
(OS1) Baseline Audit Scores - Job Category
Cleaning Wrkr.
Training
Safety
Workloading/Logistics
Supervision/Management
Benchmarking

Lead BES
14
0
10
20
30
40
50
60
70
80
13 8
12 12 11 6 8
80
Pe
rce
nta
ge
(OS1) Baseline Audit Scores - Organization Comparison
UNC Chapel Hill
U Mich
WFU
MSU
MT SAC
Provo School District
UNC Charlotte
STANDARD

Facilities Management Strategic Planning Session – Second Quarter FY 2015
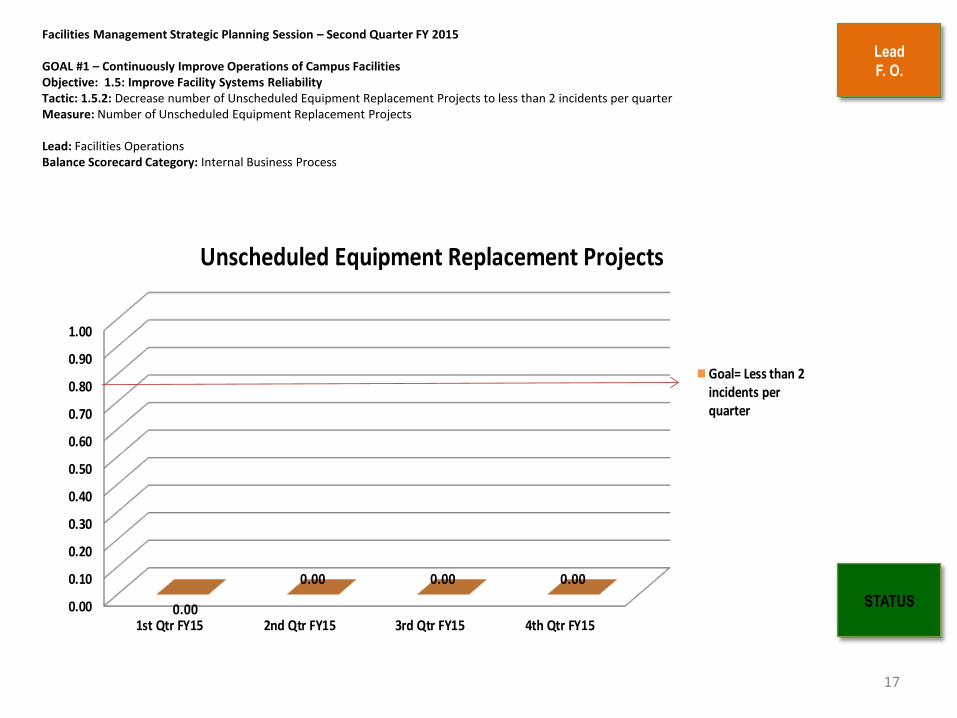
GOAL #1 – Continuously Improve Operation of Campus Facilities Objective: 1.5: Improve Facility Systems Reliability Tactic: 1.5.1: Improve Completion of Preventative Maintenance Work Requests to 90% Tactic: 1.5.2: Decrease number of Unscheduled Equipment Replacement Projects to less than 2 incidents per quarter Tactic: 1.5.3: Fewer than 5 unscheduled outages per quarter Tactic: 1.5.4: Improve Ratio of Preventive/Predictive work requests to reactive request to 50%
ACTION PLAN
Actions Planned
1 – Complete conversion from old PM Module to new PM Module. (Goal for completion August 2015) UPA and Managers to monitor status.
3 – Continue expansion of PM Program and predictive maintenance program. Work with key customers.
4 – Identify and prioritize equipment conditions and needs for replacement.
5 – Review system projects identified on the R&R list and prioritize. Indicate urgency and recommend future funding dates.
6 – Re-emphasize the Customer Handbook, get out and see the customer; swiftly and accurately report outages.
7 – Reorganize PM Program; PM Supervisor report to Area Manager.
15
Lead
F. O.

Facilities Management Strategic Planning Session – Second Quarter FY 2015 GOAL #1 – Continuously Improve Operations of Campus Facilities Objective: 1.5: Improve Facility Systems Reliability Tactic: 1.5.1: Improve Completion of Preventative Maintenance Work Requests to 90% Measure: Percentage of Preventive Maintenance Work Requests Completed
Lead: Facilities Operations Balance Scorecard Category: Internal Business Process
16
Lead
F. O.
STATUS
80%
81%
82%
83%
84%
85%
86%
87%
88%
89%
90%
1st Qtr FY15 2nd Qtr FY15 3rd Qtr FY15 4th Qtr FY15
84%
87%
Improve Completion of PM Work Orders
Goal to 90%
Facilities Management Strategic Planning Session – Second Quarter FY 2015
GOAL #1 – Continuously Improve Operations of Campus Facilities Objective: 1.5: Improve Facility Systems Reliability Tactic: 1.5.2: Decrease number of Unscheduled Equipment Replacement Projects to less than 2 incidents per quarter Measure: Number of Unscheduled Equipment Replacement Projects
Lead: Facilities Operations Balance Scorecard Category: Internal Business Process
17
Lead
F. O.
STATUS 0.00
0.10
0.20
0.30
0.40
0.50
0.60
0.70
0.80
0.90
1.00
1st Qtr FY15 2nd Qtr FY15 3rd Qtr FY15 4th Qtr FY150.00
0.00 0.00 0.00
Unscheduled Equipment Replacement Projects
Goal= Less than 2incidents perquarter
Facilities Management Strategic Planning Session – Second Quarter FY 2015
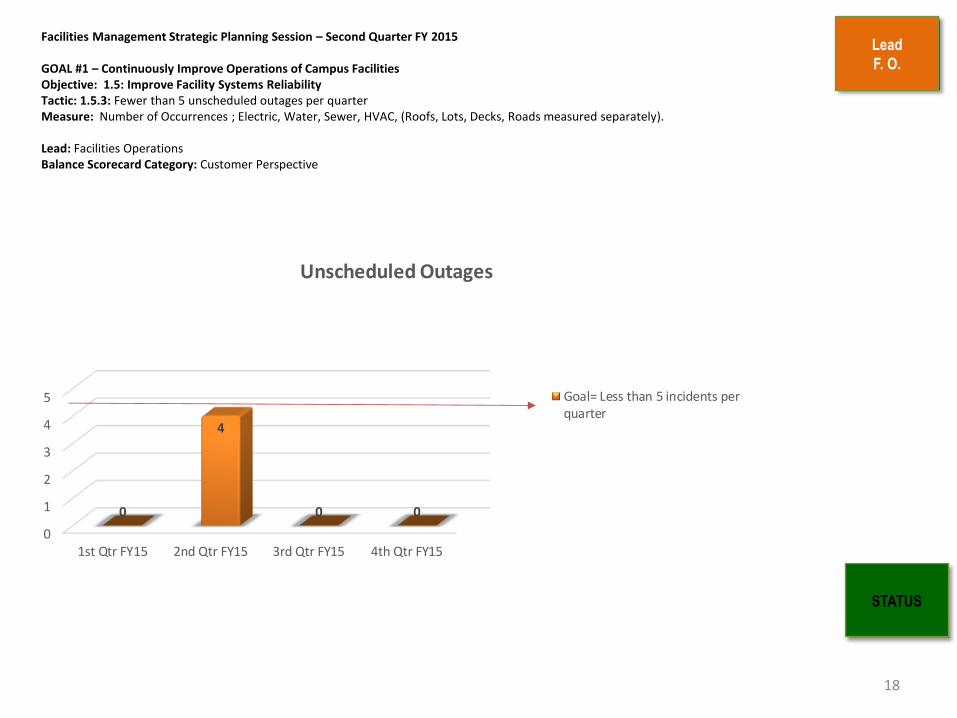
GOAL #1 – Continuously Improve Operations of Campus Facilities Objective: 1.5: Improve Facility Systems Reliability Tactic: 1.5.3: Fewer than 5 unscheduled outages per quarter Measure: Number of Occurrences ; Electric, Water, Sewer, HVAC, (Roofs, Lots, Decks, Roads measured separately). Lead: Facilities Operations Balance Scorecard Category: Customer Perspective
18
Lead
F. O.
STATUS
0
1
2
3
4
5
1st Qtr FY15 2nd Qtr FY15 3rd Qtr FY15 4th Qtr FY15
0
4
0 0
Unscheduled Outages
Goal= Less than 5 incidents perquarter

Facilities Management Strategic Planning Session – Second Quarter FY 2015
GOAL #1 – Continuously Improve Operations of Campus Facilities Objective: 1.5: Improve Facility Systems Reliability Tactic: 1.5.4: Improve Ratio of Preventive/Predictive work requests to reactive request to 50% Measure: Percentage (Number of completed reactive work requests divided by total number of completed work requests including PM and Predictive work requests) (APPA Benchmark)
Lead: Facilities Operations Balance Scorecard Category: Customer Perspective
19
Lead
F. O.
STATUS 0.00%
10.00%
20.00%
30.00%
40.00%
50.00%
60.00%
1st Qtr FY15 2nd Qtr FY15 3rd Qtr FY15 4th Qtr FY15
51.10% 52.00%
0.00% 0.00%
Improve Ratio of Preventive/Predictive Work Requests
Goal =ImproveRatio to50%

GOAL #2
Create a Reliable and Sustainable Physical Infrastructure
"People with goals
succeed because they
know where they're going"
-- Earl Nightingale,
Motivational Speaker

FM Prioritized Projects – FY15 1. Campus Map – Roll over from FY14; Estimated Completion Jun 2015
2. Access and Key Management – Roll over from FY14; Estimated Completion Feb 2014
3. Space Audit, Approvals and Occupancy – Estimated Completion May 2015
4. BES ReOrg – Completion March 2015
5. ARCHIBUS 21.3 Upgrade – Estimated Completion Jan 2015
6. Capital Projects Requests and BANNER Integration - Estimated Completion Apr 2014
7. CRDM Parent Child – Estimated Completion Jun 2015
8. BAS Niagara 3.8 Upgrade – Estimated Completion Jun 2015
9. ImageNOW (Archive drawings) – Roll over from FY14; Estimated Completion Feb 2015
10. FO Craftsperson Timesheet/Whiteboard/Split Fund PM – Estimated Completion Jan 2015
11. Project Billing Console – Estimated Completion Mar 2015
12. Design Services Phase 2 Requests – Estimated Completion Date Jun 2015
13. BES EDA Asset Mgmt - Roll over from FY14; Estimated Completion Dec 2014
14. WO Hot /Utility Form – Roll over from FY14; Estimated Completion Dec 2014
15. ARCHIBUS Mobile Proof of Concept – Estimated Completion Feb 2015
16. Mobile Equipment Survey – Estimated Completion Mar 2015
17. Mobile Space Inventory - Estimated Completion Apr 2015
18. Mobile Map Utilities Field Units - Estimated Completion Jun 2015

Lead
FIS
GOAL #2 – Create a Reliable and Sustainable Physical Infrastructure Objective: 2.1 Maximize Facilities Management Effectiveness and Efficiency through Information Technology Tactic: 2.1.1 Complete 40% of the Facilities Management Five-Year Technology Plan
ACTION PLAN
Actions Planned:
1. Hire temporary Survey Technician position by Feb 28, 2015.
2. Hire vacant Mobile Technology position by April 30, 2015.
3. Complete/Finalize Campus Map review changes and officially “Go Live” by March 2015.
4. Complete ARCHIBUS 21.3 upgrade by April 15, 2015.
5. Begin Capital Upgrades and BANNER Integration Project by March 15, 2015.
6. Begin Archive Drawing data upload to ImageNOW production database by Feb. 1, 2015.
7. Complete BES Manager/Supervisor Training by March 2015.

Lead
FIS
GOAL #2 – Create a Reliable and Sustainable Physical Infrastructure Objective: 2.1 Maximize Facilities Management Effectiveness and Efficiency through Information Technology Tactic: 2.1.1 Complete 40% of the Facilities Management Five-Year Technology Plan
ACTION PLAN
Actions Completed:
1. Completed BES Re-Org System Changes.
2. Completed development of New FO Utility Form for FO.
3. Finalized testing and went live with Beginner Work Request Customer role online training module.
4. Completed Facilities Operations Craftsperson Timesheet and Whiteboard/Schedule test views for FO Pilot testing.
5. Completed Split-Funded Preventive Maintenance functionality for Facilities Operations.
6. Completed 1st phase and testing for FM Print Server Transition project.

Facilities Management Strategic Planning Session – Second Quarter FY 2015 GOAL #2 – Create a Reliable and Sustainable Physical Infrastructure Objective: 2.1 Maximize Facilities Management Effectiveness and Efficiency through Information Technology Tactic: 2.1.1 Complete 40% of the Facilities Management Five-Year Technology Plan Measure: Percent Completion of Five-Year Technology Projects Based upon Cumulative Average of Project Completion Balanced Scorecard Category: Internal Business Processes
Lead
FIS
STATUS
0.00%
10.00%
20.00%
30.00%
40.00%
50.00%
60.00%
70.00%
80.00%
90.00%
100.00%
Qtr 1 FY15 Qtr 2 FY15 Qtr 3 FY15 Qtr 4 FY15
29.17%
FIS Project Task Cumulative Completion Avg.
Qtrly Metric Goal: Cumulative Avg.
2nd QTR GOAL
2nd Qtr. Average

Facilities Management Strategic Planning Session – Second Quarter FY 2015
GOAL #2 – Create a Reliable and Sustainable Physical Infrastructure
Objective: 2.1 Maximize Facilities Management Effectiveness and Efficiency through Information Technology Tactic: 2.1.1 Complete 40% of the Facilities Management Five-Year Technology Plan Measure: Percent Completion of Five-Year Technology Projects Project Status Completion Percentage Balanced Scorecard Category: Internal Business Processes
Lead
FIS
25
0.00%
10.00%
20.00%
30.00%
40.00%
50.00%
60.00%
70.00%
80.00%
90.00%
100.00%
FY15 Q4
FY15 Q3
FY15 Q2
FY15 Q1
STATUS

NEW IMPROVEMENTS
Reduce and Eliminate Paper Processes – Requires interface assistance with FIS: Convert Scope & Budget to format in Archibus similar to Estimating Workbook.
Timeline: FY15 QTR 3 - FY15 QTR 4
Convert Excel Purchase Requisition to Archibus Purchase Requisition. Timeline: FY15 QTR 3 - FY15 QTR 4
Update Estimating Workbook to improve Contingency and Fee calculations. Timeline: FY15 QTR 3 - FY15 QTR 4
26
ACTION PLANS FOR IMPROVEMENT
Facilities Management Strategic Planning Session – Second Quarter FY 2015 GOAL #2 – Create a Reliable and Sustainable Physical Infrastructure Objective: 2.2: Improve Informal Project Design and Construction Process Lead: Design Services Balanced Scorecard Category: Internal Business Process
Customer Orientation for Design Services Processes and Archibus Design Services Project Management: Customer meetings to help our Customers understand our processes – Project entry, approvals, timelines, SCO, etc.
Timeline: FY15 QTR 3 - FY15 QTR 4
Tactic 2.2.1: 95% of All Construction Projects Meet Scheduled Beneficial Occupancy Date (BOD) Measure: Percentage (Number of Construction Projects completed on or before delivery date divided by total number of project completed.) Tactic 2.2.2: Review Project Capacity - Goal 250 projects per year. Measure: Number of Projects Completed (Annual Goal)
Continue ongoing efforts on Classroom Capacity and ADA egress information per building.
ONGOING IMPROVEMENTS
Lead Design Services
STATUS

Facilities Management Strategic Planning Session – Second Quarter FY 2015 GOAL #2 – Create a Reliable and Sustainable Physical Infrastructure Objective: 2.2: Improve Informal Project Design and Construction Process Lead: Design Services Balanced Scorecard Category: Internal Business Process
27
Tactic 2.2.1: 95% of All Construction Projects Meet Scheduled Beneficial Occupancy Date (BOD) Measure: Percentage (Number of Construction Projects completed on or before delivery date divided by total number of project completed.)
Lead Design Services
QUARTERLY
REVIEWNo. Of Projects
Projects Occupied
by scheduled date
Projects not
Occupied by
scheduled date
Percent
FY '09 115 100 15 87.0%
FY '10 182 168 14 92.3%
FY '11 224 200 24 89.3%
FY '12 240 231 9 96.3%
FY '13 139 134 5 96.4%
FY '14 221 211 10 95.5%
QTR 1 18 17 1 94.4%
QTR 2 28 27 1 96.4%
QTR 3 0 0 0 0.0%
QTR 4 0 0 0 0.0%
FY '15 STATUS 46 44 2 95.7%
95% of All Construction Projects Meet Scheduled
Beneficial Occupancy Date (BOD)
87.0% 92.3% 89.3% 96.3% 96.4% 95.5% 94.4% 96 .4% 95.7%
95%
85%
FY '09 FY '10 FY '11 FY '12 FY '13 FY '14 QTR 1 QTR 2 QTR 3 QTR 4 FY '15
STATUS
GOAL ALERT
GOAL STATUS95.0% 96.4%
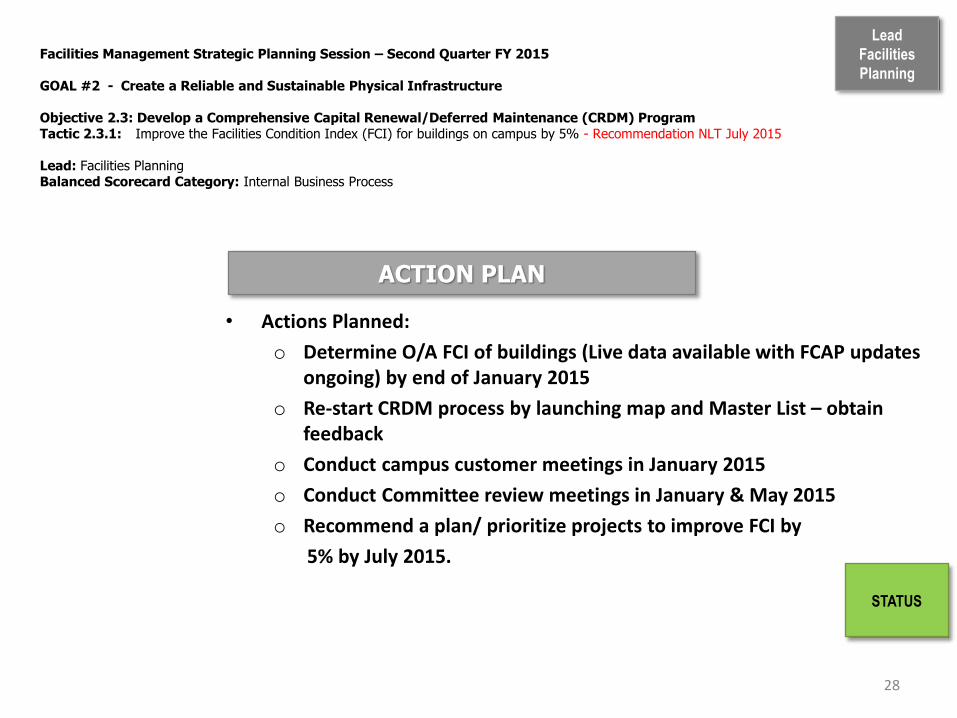
Facilities Management Strategic Planning Session – Second Quarter FY 2015 GOAL #2 - Create a Reliable and Sustainable Physical Infrastructure Objective 2.3: Develop a Comprehensive Capital Renewal/Deferred Maintenance (CRDM) Program Tactic 2.3.1: Improve the Facilities Condition Index (FCI) for buildings on campus by 5% - Recommendation NLT July 2015 Lead: Facilities Planning Balanced Scorecard Category: Internal Business Process
28
STATUS
ACTION PLAN
• Actions Planned:
o Determine O/A FCI of buildings (Live data available with FCAP updates ongoing) by end of January 2015
o Re-start CRDM process by launching map and Master List – obtain feedback
o Conduct campus customer meetings in January 2015
o Conduct Committee review meetings in January & May 2015
o Recommend a plan/ prioritize projects to improve FCI by
5% by July 2015.
Lead
Facilities
Planning

Facilities Management Strategic Planning Session – Second Quarter FY 2015 GOAL #2 - Create a Reliable and Sustainable Physical Infrastructure Objective 2.3: Develop a Comprehensive Capital Renewal/Deferred Maintenance (CRDM) Program Tactic 2.3.1: Improve the Facilities Condition Index (FCI) for buildings on campus by 5% - Recommendation NLT July 2015. Measure: Average Building FCI for campus Lead: Facilities Planning Balanced Scorecard Category: Internal Business Process
Lead
Facilities
Planning
29
Status
Percentage of Completion
4th
Qtr
FY
14
3rd
Qtr
FY
14
1.0
.9
.8
.7
.6
.5
.4
.3
.2
.1 0
25% 30%
2n
d Q
tr
FY 1
5
50% 40%
1st
Qtr
FY
15

Facilities Management Strategic Planning Session – Second Quarter FY 2015 GOAL #2 - Create a Reliable and Sustainable Physical Infrastructure Objective 2.4: Improve Campus Space Planning and Utilization Tactic 2.4.1: 80% of Departments/Colleges within +/- 5% of System-wide space standards NLT end of July 15. Measure: Percentage of Departments/Colleges meeting System-wide space standards as measured in gross square feet (GSF occupied divided by GSF required based on UNC System standards for each applicable room category) Lead: Facilities Planning Balanced Scorecard Category: Internal Business Process
30
STATUS
ACTION PLAN
• Actions Planned:
o Compose comparative analysis of actual spaces vs UNC Charlotte
Approved Standard by March 2015, working with AA
o Complete space allocations/ inventory by room category in Archibus
(Ongoing)
o Compare inventory to standard and report % difference by March 2015
o Work with FIS to generate report by room use (NLT February, 2015)
o Recommend a plan/ prioritize projects to improve allocations to
within 5% of the standard by end of July 2015.
Lead
Facilities
Planning

Lead
Facilities
Planning
31
Status
Percentage of Completion
4th
Qtr
FY
14
3rd
Qtr
FY
14
1.10 Space Standard 1.0
.9
.8
.7
.6
.5
.4
.3
.2
.1
Facilities Management Strategic Planning Session – Second Quarter FY 2015 GOAL #2 - Create a Reliable and Sustainable Physical Infrastructure Objective 2.4: Improve Campus Space Planning and Utilization Tactic 2.4.1: 90% of Departments/Colleges within +/- 5% of System-wide space standards NLT end of July 15. Measure: Percentage of Departments/Colleges meeting System-wide space standards as measured in gross square feet (GSF occupied divided by GSF required based on UNC System standards for each applicable room category) Lead: Facilities Planning Balanced Scorecard Category: Internal Business Process
45% 60%
1st
Qtr
FY
15
80%
2n
d Q
tr
FY 1
5
90%

Facilities Management Strategic Planning Session – Second Quarter FY 2015 GOAL #2 - Create a Reliable and Sustainable Physical Infrastructure Objective 2.5: Improve the Capital Planning and Design Process Tactic 2.5.1: Develop Lifecycle cost analysis and funding process for capital projects (Action Plan only) Lead: Facilities Planning Balanced Scorecard Category: Internal Business Process
32
STATUS
ACTION PLAN
• Actions Planned:
o Sustain current process of completing Operating Budget sheets
for new projects (Ongoing)
o Support Capital, when required, with further study related
to funding (e.g. HRL, Cone, RDH, Health and Wellness Center, etc. work)
(Ongoing)
Lead
Facilities
Planning

Lead
Capital
GOAL #2 – Create a Reliable and Sustainable Physical Infrastructure Objective 2.5 Improve the Capital Planning and Design Process Tactic 2.5.2 90% of designers under contract within 120 days of the Project posting in CAPSTAT 2.5.3 90% of Designs complete by the scheduled completion date 2.5.4 90% of designs complete within design budgeted fee ACTION PLAN
Actions Completed • CID 2—Elevator Upgrades • CID 2—Outdoor Events Shelter • CID 2—SAC Chiller
Actions Planned • PMs, prior to executing the design agreement, arrange a meeting between capital projects, design team,
and user group to plan / agree on a design production schedule to be reflected in the designer’s agreement.
• Baseline (BL) schedules – accurate, used weekly by PMs & CMs • PMs print project budget / financial sheets. Have them on hand for all design meetings. PMs must know
their project authorization, current source of funding, available balances. • Develop a standardized design meeting agenda and make budget, contingency, scope creep, and design
production schedule required topics for updating the project team. • Report monthly to AVC FM status of changes relating to designer fees, scope creep, schedule misses, etc.. • Protect contingency limit uses for unforeseen conditions, inflation
33

Facilities Management Strategic Planning Session – Second Quarter FY 2015 GOAL #2 – Create a Reliable and Sustainable Physical Infrastructure Objective 2.5 Improve the Capital Planning and Design Process Tactic 2.5.2 90% of designers under contract within 120 days of the Project posting in CAPSTAT Measure: Percentage of designers under contract within 120 days. Balanced Scorecard Category: Internal Business Process
Lead
Capital
34
Tactic Measurement for 2nd Quarter is 100% Year to Date is 75%
Status
STRATEGIC
REVIEW by Fiscal
Year (July-June)
No. of
projects
authorized in
Capstat
Designer
under
contract
w/in 120
days
Designer not
under
contract
w/in 120
days
% Designers
under
contract
w/in
Summary FY-13 14 3 6 33%
Summary FY-14 7 4 1 80%
Summary FY-15 1 1 1 50%
1st Qtr. FY-15 1 1 1 50%
2nd Qtr. FY-15 4 3 0 100%
3rd Qtr. FY-15 0 0 0 n/a
4th Qtr. FY-15 0 0 0 n/a
33%
80%
50% 50%
100%
0% 0%
Goal 90%

Facilities Management Strategic Planning Session – Second Quarter FY 2015 GOAL #2 – Create a Reliable and Sustainable Physical Infrastructure Objective 2.5 Improve the Capital Planning and Design Process Tactic 2.5.3 90% of designs complete by the scheduled completion date Measure: Percentage of designs completed on or before the original completion time Balanced Scorecard Category: Internal Business Process
Lead
Capital
35
Tactic Measurement for 2nd Quarter is 100%
Status
STRATEGIC
REVIEW by
Fiscal Year (July-
June)
No. of
projects
completed by
scheduled
#not
completed by
scheduled
time
% Designs
complete by
completion
timeSummary FY-13 3 1 75%Summary FY-14 8 0 100%Summary FY-15 1 0 100%1st Qtr. FY-15 1 0 100%2nd Qtr. FY-15 1 0 100%3rd Qtr. FY-15 n/a n/a n/a4th Qtr. FY-15 n/a n/a n/a
75%
100% 100% 100% 100%
0% 0%
Goal 90%

Facilities Management Strategic Planning Session – Second Quarter FY 2015 GOAL #2 – Create a Reliable and Sustainable Physical Infrastructure Objective 2.5 Improve the Capital Planning and Design Process Tactic 2.5.4 90% of designs complete within design budgeted fee Measure: Percentage of designs completed within the original design contract amount Balanced Scorecard Category: Internal Processes
Lead
Capital
36
Status Tactic Measurement for 2nd Quarter is 100%
STRATEGIC
REVIEW by
Fiscal Year (July-
June)
# of designs
with original
budgeted
fee
# designs
complete
not within
budget
% Designs
not
complete
w/in
Summary FY-13 3 1 75%Summary FY-14 6 1 85%Summary FY-15 1 0 100%1st Qtr. FY-15 1 0 100%2nd Qtr. FY-15 0 1 100%3rd Qtr. FY-15 n/a n/a n/a
4th Qtr. FY-15 n/a n/a n/a
75
85
100 100 100
0 00
10
20
30
40
50
60
70
80
90
100
Goal
Lead
Capital
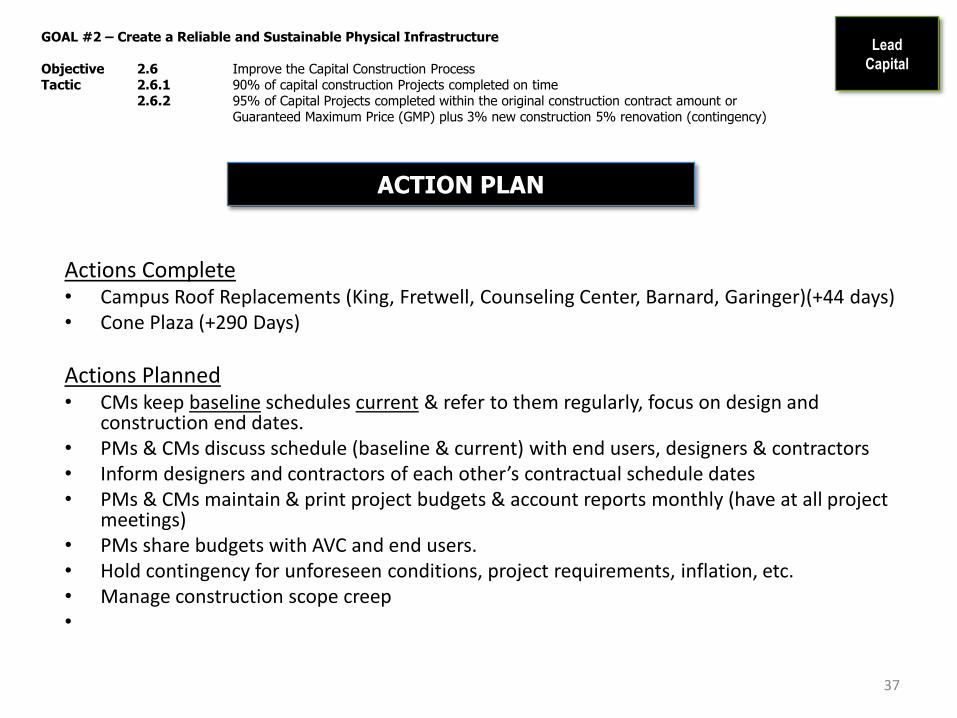
GOAL #2 – Create a Reliable and Sustainable Physical Infrastructure Objective 2.6 Improve the Capital Construction Process Tactic 2.6.1 90% of capital construction Projects completed on time 2.6.2 95% of Capital Projects completed within the original construction contract amount or Guaranteed Maximum Price (GMP) plus 3% new construction 5% renovation (contingency)
ACTION PLAN
Actions Complete • Campus Roof Replacements (King, Fretwell, Counseling Center, Barnard, Garinger)(+44 days) • Cone Plaza (+290 Days)
Actions Planned • CMs keep baseline schedules current & refer to them regularly, focus on design and
construction end dates. • PMs & CMs discuss schedule (baseline & current) with end users, designers & contractors • Inform designers and contractors of each other’s contractual schedule dates • PMs & CMs maintain & print project budgets & account reports monthly (have at all project
meetings) • PMs share budgets with AVC and end users. • Hold contingency for unforeseen conditions, project requirements, inflation, etc. • Manage construction scope creep •
37

Facilities Management Strategic Planning Session – Second Quarter FY 2015 GOAL #2 – Create a Reliable and Sustainable Physical Infrastructure Objective 2.6 Improve the Capital Construction Process Tactic 2.6.1 90% of capital construction Projects completed on time Measure: Percentage of construction projects completed on or before the contract completion date (CCD) Balanced Scorecard Category: Customer Perspective
Lead
Capital
38
Tactic Measurement for 2nd Quarter is 0%
Status
STRATEGIC
REVIEW by Fiscal
Year (July-June)
# completed
on schedule
not
completed on
schedule
%
completed
on timeSummary FY-13 1 2 33%Summary FY-14 6 3 67%Summary FY-15 2 0 100%1st Qtr. FY-15 2 0 100%2nd Qtr. FY-15 0 2 0%3rd Qtr. FY-15 n/a n/a n/a4th Qtr. FY-15 n/a n/a n/a
33%
67%
100% 100%
0% 0% 0%
Goal 90%

Facilities Management Strategic Planning Session – Second Quarter FY 2015 GOAL #2 – Create a Reliable and Sustainable Physical Infrastructure Objective 2.6 Improve the Capital Construction Process Tactic 2.6.2 95% of Capital Projects completed within the original construction contract amount or Guaranteed Maximum Price (GMP) plus 3% new construction 5% renovation (contingency) Measure: Percentage of projects completed within the original contract amount or GMP plus 3% (contingency). Balanced Scorecard Category: Internal Business Process
Lead
Capital
39
Status
Tactic Measurement for 2nd Quarter is 50%
STRATEGIC
REVIEW by Fiscal
Year (July-June)
# completed
on schedule
not
completed on
schedule
%
completed
on timeSummary FY-13 1 2 33%Summary FY-14 6 3 67%Summary FY-15 2 0 100%1st Qtr. FY-15 2 2 100%2nd Qtr. FY-15 1 1 50%
3rd Qtr. FY-15 n/a n/a n/a
4th Qtr. FY-15 n/a n/a n/a
33%
67%
100% 100%
50%
0% 0%
Goal 95%

GOAL #3
Foster a Customer Focused Organization
“People don’t want to
communicate with an
organization or a computer.
They want to talk to a real, live,
responsive, responsible person
who will listen and help them
get satisfaction.”
- Theo Michelson, State Farm
Insurance

Facilities Management Strategic Planning Session – Second Quarter FY 2015 GOAL #3 Foster a Customer Focused Organization Objective 3.1: Continuously improve customer service/satisfaction Tactic 3.1.1: Achieve overall customer satisfaction of 93% (proposed) for FM services. Measure: Annual Customer Survey results: Percentage of customers selecting “fair, good or very good” with the statement: “Overall I am satisfied with <the service> I received from Facilities Management” Lead: Facilities Management Wide Balanced Scorecard Category: Customer Perspective
41
Lead
FBO
ACTION PLAN
Customer Survey
• Customer interview feedback to be shared with Directors Spring 2015
Questions will relate to how FM can help customers get their work done better and/or faster
Ask feedback for following scenario: a customer service center entering and managing work requests
• Action plans, based on interviews and 2014 Customer Survey to be developed by Directors. Tent. date July 1 or as directed by AVC
• Next Urban Institute survey projected: FY 2016

Facilities Management Strategic Planning Session – Second Quarter FY 2015 GOAL #3 Foster a Customer Focused Organization Objective 3.1: Continuously improve customer service/satisfaction Tactic 3.1.1: Achieve overall customer satisfaction of 93% (proposed) for FM services. Measure: Annual Customer Survey results: Percentage of customers selecting “fair, good or very good” with the statement: “Overall I am satisfied with <the service> I received from Facilities Management” Lead: Facilities Management Wide Balanced Scorecard Category: Customer Perspective
42
Lead
FBO
2014 Survey Overall Satisfaction: 93%
STATUS
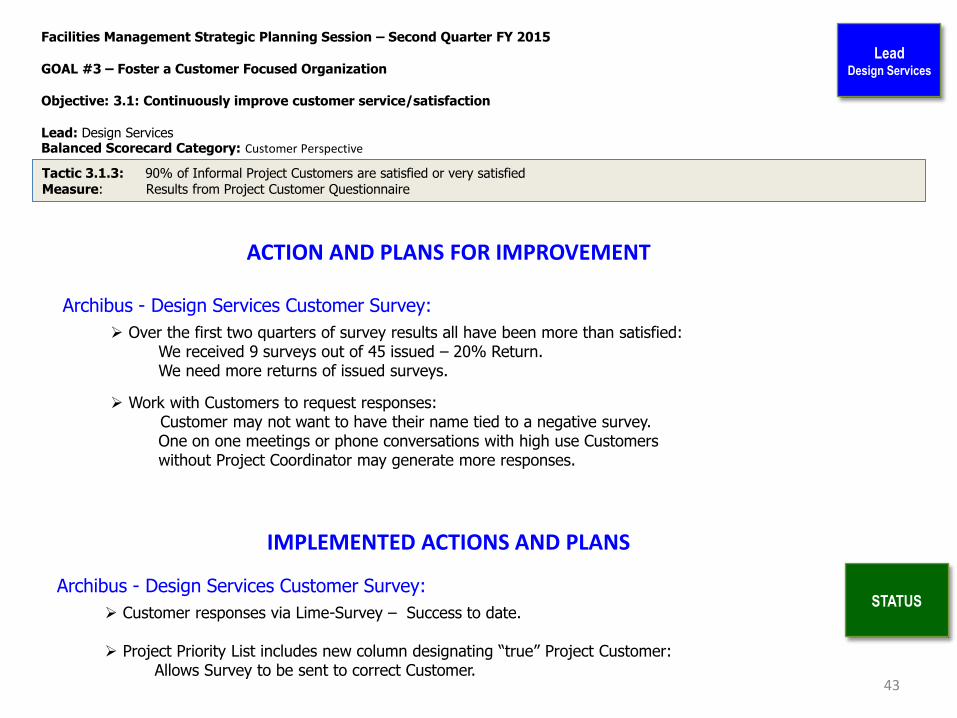
Facilities Management Strategic Planning Session – Second Quarter FY 2015 GOAL #3 – Foster a Customer Focused Organization Objective: 3.1: Continuously improve customer service/satisfaction Lead: Design Services Balanced Scorecard Category: Customer Perspective
43
Lead Design Services
STATUS
Tactic 3.1.3: 90% of Informal Project Customers are satisfied or very satisfied Measure: Results from Project Customer Questionnaire
IMPLEMENTED ACTIONS AND PLANS
Archibus - Design Services Customer Survey:
Customer responses via Lime-Survey – Success to date. Project Priority List includes new column designating “true” Project Customer: Allows Survey to be sent to correct Customer.
ACTION AND PLANS FOR IMPROVEMENT
Archibus - Design Services Customer Survey:
Over the first two quarters of survey results all have been more than satisfied: We received 9 surveys out of 45 issued – 20% Return. We need more returns of issued surveys.
Work with Customers to request responses: Customer may not want to have their name tied to a negative survey. One on one meetings or phone conversations with high use Customers without Project Coordinator may generate more responses.
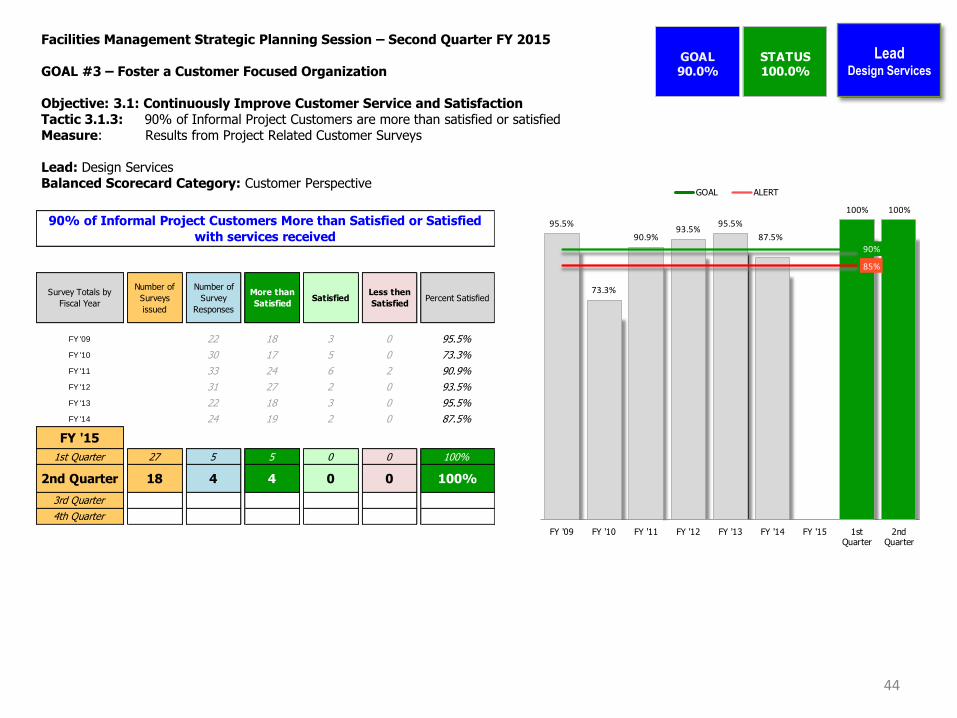
Facilities Management Strategic Planning Session – Second Quarter FY 2015 GOAL #3 – Foster a Customer Focused Organization Objective: 3.1: Continuously Improve Customer Service and Satisfaction Tactic 3.1.3: 90% of Informal Project Customers are more than satisfied or satisfied Measure: Results from Project Related Customer Surveys Lead: Design Services Balanced Scorecard Category: Customer Perspective
44
Lead Design Services
GOAL STATUS90.0% 100.0%
Survey Totals by
Fiscal Year
Number of
Surveys
issued
Number of
Survey
Responses
More than
Satisfied Satisfied
Less then
Satisfied Percent Satisfied
FY '09 22 18 3 0 95.5%
FY '10 30 17 5 0 73.3%
FY '11 33 24 6 2 90.9%
FY '12 31 27 2 0 93.5%
FY '13 22 18 3 0 95.5%
FY '14 24 19 2 0 87.5%
FY '15
1st Quarter 27 5 5 0 0 100%
2nd Quarter 18 4 4 0 0 100%
3rd Quarter
4th Quarter
90% of Informal Project Customers More than Satisfied or Satisfied
with services received95.5%
73.3%
90.9%93.5%
95.5%
87.5%
100% 100%
90%
85%
FY '09 FY '10 FY '11 FY '12 FY '13 FY '14 FY '15 1stQuarter
2ndQuarter
GOAL ALERT

Facilities Management Strategic Planning Session – Second Quarter FY 2015
GOAL #3 – Foster a Customer Focused Organization Objective: 3.1: Continuously improve customer service/satisfaction Tactic: 3.1.2: Decrease the Number of Hot/Cold Calls by 20% Tactic: 3.1.4: 90% of Reactive Work Request Customers are satisfied or very satisfied
ACTION PLAN
Actions Planned
1 – Stay engaged with performance of ESCO contract; keep customers informed; walk the buildings and work with the Energy Manager to keep customers informed; communicate daily.
2 – Support Capital to get buildings commissioned and retro commissioned.
3 – Work with customers; educate them on the UNCC Temperature Control Policy and monitor requests for accuracy.
Actions Completed
1 - Implemented daily monitoring of temperatures using BAS and field verification. Continue to develop controls section and cross train with Zones.
2 - Work with other FM team members to establish a communication plan for temperature related building issues; communicate this plan no later than 1 August 2014 and update as needed.
3 - Include Energy Manager in Bi-Weekly Operations’ meetings.
4 - Implemented Customer Satisfaction Survey.
45
Lead
F. O.

Facilities Management Strategic Planning Session – Second Quarter FY 2015
GOAL #3 – Foster a Customer Focused Organization Objective: 3.1: Continuously improve customer service/satisfaction Tactic: 3.1.2: Decrease the Number of Hot/Cold Calls by 20% Measure: Number of Hot/Cold Calls submitted on work requests Lead: Facilities Operations Balance Scorecard Category: Customer Perspective
46
Lead
F. O.
STATUS 1
TooHot65
TooHot81
0 0
TooCold161
TooCold65
0 0
Total226
Total146
0 00
50
100
150
200
250
1st Qtr FY15 2nd Qtr FY15 3rd Qtr FY15 4th Qtr FY15
Decrease the Number of Hot/Cold Calls
Goal=DecreaseNumber by 20%(138.4)

Facilities Management Strategic Planning Session – Second Quarter FY 2015 GOAL #3 – Foster a Customer Focused Organization Objective: 3.1: Continuously improve customer service/satisfaction Tactic: 3.1.4: 90% of Reactive Work Request Customers are satisfied or very satisfied Measure: Percent satisfied or very satisfied on SurveyShare email Survey Results Lead: Facilities Operations Balance Scorecard Category: Customer Perspective
Lead
F. O.
STATUS
47
0.00%
10.00%
20.00%
30.00%
40.00%
50.00%
60.00%
70.00%
VERY
SATISFIED
SATISFIED DISSATISFIED VERY
DISSATISFIED
YES NO
Very Satisfied Satisfied DissatisfiedVery
DissatisfiedYes No
How satisfied were you with the time it takes forFac Ops staff to respond to you issue?
63.16% 28.95% 7.89% 0.00% 0 0
How satisfied were you with the resolution ofyour issue or concern?
47.37% 50.00% 2.63% 0.00% 0 0
Was there follow-up?Yes/No
60.53% 39.47%
How satisfied were you with our staff'scourteousness and professionalism?
68.42% 31.58% 0.00% 0.00%
How satisfied were you with your overallexperience?
57.89% 36.84% 2.63% 2.63%
Improve Customer Service Satisfaction

Facilities Management Strategic Planning Session – Second Quarter FY 2015 GOAL #3 Foster a Customer Focused Organization Objective 3.1: Continuously improve customer service/satisfaction Tactic 3.1.5: Build Brand Awareness Measure: Action Plan Only Lead: Facilities Business Office - Communications Balanced Scorecard Category: Customer Perspective
48
Lead
FBO
ACTION PLAN
Publicity/Public Relations:
• Campus Construction Reports*: Goal to prepare and distribute approx. every six weeks. Feb. 16 week
• Press Releases: Write and distribute through several media channels. Continual through June 30, 2015
Clean fuel grants, energy savings, Aperture sculpture, etc.
• Publicity documentation and analytics*: Will report annually. Next is summer, 2015
Internal Communications:
• Intranet Begin content review and user feedback. (note: level 0 security information) Spring 2015
• Regularly scheduled communications meetings with BES and Operations
Bimonthly meetings for both
• Focus group meeting facilitator for employee communications survey review. Group participants being identified.
Meeting: March, 2015; Completion and results: April, 2015
• Workshops*: Expand FM audience and subject materials Through June 30, 2015

Facilities Management Strategic Planning Session – Second Quarter FY 2015 GOAL #3 Foster a Customer Focused Organization Objective 3.1: Continuously improve customer service/satisfaction Tactic 3.1.5: Build brand awareness Measure: Action Plan Only Lead: Facilities Business Office - Communications Balanced Scorecard Category: Customer Perspective
49
Lead
FBO
ACTION PLAN
Customer Communication Initiatives (interrelated): • Launch 2nd customer feedback interviews Winter 2015
Share results with Directors Spring 2015 Results will assist with customer survey action plans to be developed by Directors Tent. date July 1 or as directed by
AVC
• External Marketing Campaign*: “Creating A Campus of Distinction” Signage launch Winter 2015 Solicit feedback/input from Directors Spring 2015 Execute campaign tactics (testimonials, LCD signage, website, etc.) Spring/Summer 2015
• SOP review, development Winter/Spring 2015 • Customer Handbook* update, launch and remarket; digital and print Spring 2015 • Website and QA* Spring/Summer 2015
Review web comm. key QA issues/reminders Review requested pages from different units for content/QA User testing
• Customer Facing technology Spring 2015 Communication plans and user testing assistance with Campus Map and CRDM report

Facilities Management Strategic Planning Session – Second Quarter FY 2015 GOAL #3 Foster a Customer Focused Organization Objective 3.1: Continuously improve customer service/satisfaction Tactic 3.1.5: Build Brand Awareness Measure: Action Plan Only Lead: Facilities Business Office - Communications Balanced Scorecard Category: Customer Perspective
50
Lead
FBO
ACTION PLAN
Special Projects:
• Sustainability Magazine Launch w/o Feb 2 Final editing & proof completed; reviewed by Jones, Dubois and Hardin Limited print to occur in Feb/Mar.
• Traffic communications committee (joint partnership with U. Communications): Research, write and provide upcoming and current campus and perimeter traffic/transportation-related projects to campus stakeholders. Quarterly e-newsletter, articles, announcements, etc. Varying dates through June 30.
• Editing/writing award submissions. As requested Campus Tree USA Designation/Award: Submitted Dec. 2014; anticipated response March 2015.
Communication plan will be developed and launched inline with Arbor Day if award won. April 2015.
• Presentation assistance as requested
• Communication Plans: BES and Operations key announcements, FIS new campus map, CRDM program, customer handbook Spring and Summer, 2015, depending on assignment
• Personnel: Temporary position request submitted through FY 15 budget process Spring 2015
** = Areas where position would assist to help meet timeframes and deliverables.

GOAL #4
Recruit, Develop, and Retain Quality Employees
"All growth depends upon activity.
There is no development
physically or intellectually without
effort, and effort means work."
-- Calvin Coolidge,
30th U.S. president

Facilities Management Strategic Planning Session – Second Quarter FY 2015 GOAL #4 Recruit, Develop and Retain Quality Employees Objective 4.1: Recruit a Qualified Workforce in a Timely Fashion Tactic 4.1.1: Vacancy time of no longer than 80 calendar days – Nonexempt Vacancy time of no longer than 120 calendar days - Exempt Tactic 4.1.2: Reduce Number of Employees Terminated During Probationary Period to less than 5% Lead: Facilities Business Office Balanced Scorecard Category: Innovation & Learning
52
Lead
FBO
ACTION PLAN
1. Increase the pool of qualified applicants. As appropriate through June 30, 2015
2. Ensure a qualified diverse applicant pool. As appropriate through June 30, 2015
3. Ensure efficiency in processing position vacancies and position management activities. As appropriate through June 30, 2015
4. Ensure FM maintains current on budgeted positions. As appropriate through June 30, 2015
5. Monitor and reporting of separation data. August 22, 2015
6. Increase/improve efficiency with Main HR in processing HRMS actions. As appropriate through June 30, 2015
7. Provide additional HR-related support and assistance to FM units. January, 2016.

Facilities Management Strategic Planning Session – Second Quarter FY 2015 GOAL #4 Recruit, Develop and Retain Quality Employees Objective 4.1: Recruit a Qualified Workforce in a Timely Fashion Tactic 4.1.1: Vacancy time of no longer than 80 calendar days – Nonexempt Vacancy time of no longer than 120 calendar days - Exempt Measure: Days needed to fill vacant positions Lead: Facilities Business Office Balanced Scorecard Category: Innovation & Learning
53
STATUS
Lead
FBO
0
20
40
60
80
100
120
140
Q1 Q2 Q3 Q4
14
121
Average Number of Days to Fill Non-Exempt Vacancies FY 2015
# of Non-Exempt Hires
AverageNumber ofDays
Target: 80 days or less
Actual:

Facilities Management Strategic Planning Session – Second Quarter FY 2015 GOAL #4 Recruit, Develop and Retain Quality Employees Objective 4.1: Recruit a Qualified Workforce in a Timely Fashion Tactic 4.1.1: Vacancy time of no longer than 80 calendar days – Nonexempt Vacancy time of no longer than 120 calendar days - Exempt Measure: Days needed to fill vacant positions Lead: Facilities Business Office Balanced Scorecard Category: Innovation & Learning
54
Lead
FBO
Target 120 Days
0
20
40
60
80
100
120
Q1 Q2 Q3 Q4
#
o
f
D
a
y
s
Average Number of Days to Fill Exempt (Salaried) Positions 1st Quarter FY 2015
# of ExemptHires
Average Numberof Days
Target = 120 Days
Exempt
Hires = 0
STATUS

Facilities Management Strategic Planning Session – Second Quarter FY 2015 GOAL #4 Recruit, Develop and Retain Quality Employees Objective 4.1: Recruit a Qualified Workforce in a Timely Fashion Tactic 4.1.2: Reduce Number of Employees Terminated During Probationary Period to less than 5% Measure: Lead: Facilities Business Office Balanced Scorecard Category: Innovation & Learning
ACTION PLAN
Recruitment / Retention thru 06/30/15
Ensure all new hiring supervisors attend “targeted selection” training. There are many steps in recruitment. Interviewing and reference verifications are essential practices that help eliminate problem performers from being hired.
Culture of engagement
Increase employee awareness regarding (their) access to HRMS Started July, 2014 and ongoing (Position Description - Work Plan Performance Evaluation
Professional Development
Learning & Development Coordinator meeting with Units on training. Supervisor’s responsibility to provide training and development opportunities for employees.
Position description
Ensure position descriptions and competencies up to date. Accurate position description, classification and salary are crucial to effective management. All new hires, transferred employees, promotions receive an updated position description.
Mentioning
Good relations with employees prevent many disciplinary situations from beginning or worsening.
Employee Relations thru 06/30/15
Discipline Closely tied to performance management process. Not an independent event - part of a larger process. Difficult to argue that an employee should be dismissed for
performance when he/she has three years of “outstanding performance management ratings on file
Documentation Roadmap that shows how us how we got to a certain stage in
the discipline process. Why document… Selective and unreliable memory Grievance or lawsuit If you didn’t document it, then it didn’t happen! Supervisors Need to Know
SPA Employee Grievance Policy - effective 5/1/2014
The 3 causes for disciplinary action
Unsatisfactory job performance
Unacceptable personal conduct
Grossly inefficient performance
Steps in the progressive discipline process

Facilities Management Strategic Planning Session – Second Quarter FY 2015 GOAL #4 Recruit, Develop and Retain Quality Employees Objective 4.1: Recruit a Qualified Workforce in a Timely Fashion Tactic 4.1.2: Reduce Number of Employees Terminated During Probationary Period to less than 5% Measure: Percent Employees Terminated before end of probationary period Lead: Facilities Business Office Balanced Scorecard Category: Innovation & Learning
Lead
FBO
0
1
2
3
4
5
6
7
8
9
Q1 Q2 Q3 Q4
9
2 1 1
#
o
f
S
e
p
a
r
a
t
i
o
n
s
Employee’s Separated During 1st Quarter FY 2015
RESIGNATIONS
INVOLUNTARY
RETIREMENT
DEATH
Total Separations 1st Qtr = 13 Employees Separated During
Probationary Period 1st Qtr = 5
Target = <5% Actual = 1.3% Employees Separated during Probationary Period
STATUS

Facilities Management Strategic Planning Session – Second Quarter FY 2015 GOAL #4 Recruit, Develop and Retain Quality Employees Objective 4.2: Improve Workforce Development Tactic 4.2.1: Increase Supervisor/Manager Training to 40 hours/year Tactic 4.2.2: Increase Employee Training to 20 hours/year Lead: Facilities Business Office Balanced Scorecard Category: Internal Business Process, Learning and Growth
57
Lead
FBO
ACTION PLAN
Action Item Planned/Completed
FM ACADEMY
Technical
– EPA 608 Refrigerant Certifications (F/O) Complete
– HVAC Matrix Development Complete
– Computer Training for Recycling (ITS Partnership) Complete
– Computer Training for BES (ITS Partnership) Feb 2015
– Boiler Operation, Maintenance & Safety (F/O - onsite) Jan 2015
– Hands On Electrical Troubleshooting (F/O - onsite) Feb 2015
– Trouble Shooting Mechanical Drives Systems & Rotating Equipment Mar 2015
Safety Awareness
– Supervisor Safety Talks Monthly
– CPR/1st Aid Training (Innovative Solutions) Jan 2015
Leadership
– Documentation & Disciplinary Process Spring 2015
– Leadership Communication Workshop Completed
– Targeted Selection Training (External consultant) Completed
– Cultural IQ Training Course TBD
– NEO redesign June 2015
Externally Driven Initiatives
– Kronos implementation/training (Financial services) Jan 2015
– Niner Talent (formerly People Admin) version 7.35 upgrade/training (Campus HR) July 2015

Facilities Management Strategic Planning Session – Second Quarter FY 2015 GOAL #4 Recruit, Develop and Retain Quality Employees Objective 4.2: Improve Workforce Development Tactic 4.2.1: Increase Supervisor/Manager Training to 40 hours/year Tactic 4.2.2: Increase Employee Training to 20 hours/year Lead: Facilities Business Office Balanced Scorecard Category: Internal Business Process, Learning and Growth
Lead
FBO
- Met with each director to discuss staff learning & development needs for FY 15.
- Biweekly attendance at F/O staff meetings for timely information exchange on training, licensure, etc.
- Monthly meetings with BES/R Education Coordinator to discuss upcoming plans, new strategies, etc.
- Developing relationship with consultant Joanna Roop on future training opportunities.
- Reviewed DDI courses and requested list of potential deliverables. - Fall 2014
- Schedule meeting with consultant to discuss course details – January 2015
- Developing new Cultural IQ course; Details to be presented to AVC - January 2015
- FM-HR continuing to develop FM Academy “Lending Library” to provide learning resources for FM employees.
- Developing check-out procedures – February 2015 - Determine best feasible location to house materials – March 2015
ACTION PLAN
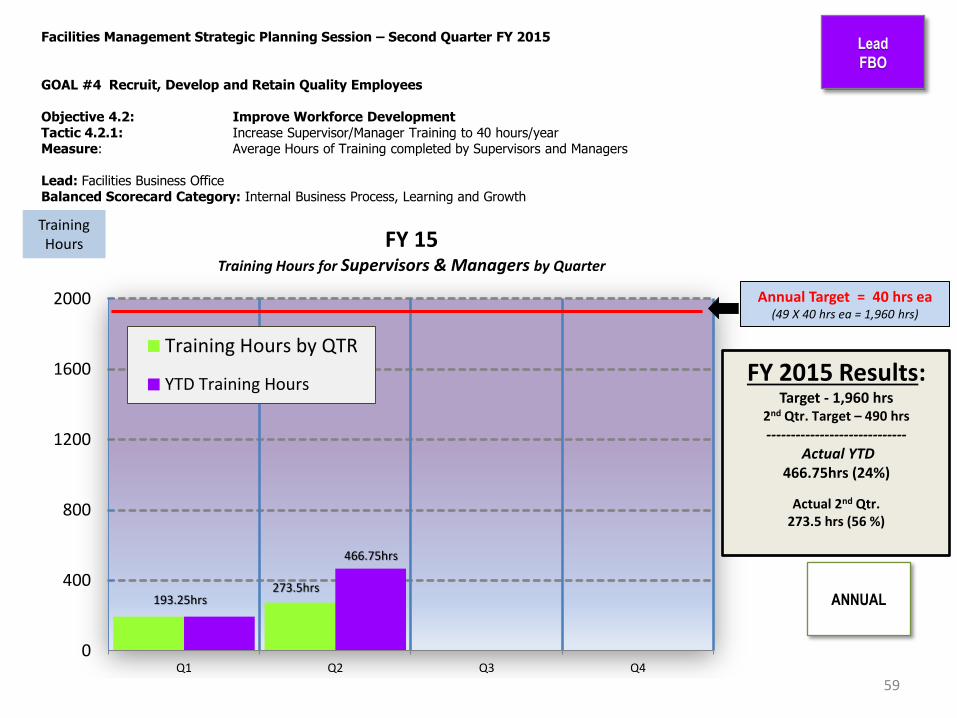
Facilities Management Strategic Planning Session – Second Quarter FY 2015 GOAL #4 Recruit, Develop and Retain Quality Employees Objective 4.2: Improve Workforce Development Tactic 4.2.1: Increase Supervisor/Manager Training to 40 hours/year Measure: Average Hours of Training completed by Supervisors and Managers Lead: Facilities Business Office Balanced Scorecard Category: Internal Business Process, Learning and Growth
59
Lead
FBO
Annual Target = 40 hrs ea (49 X 40 hrs ea = 1,960 hrs)
0
400
800
1200
1600
2000
Q1 Q2 Q3 Q4
FY 15 Training Hours for Supervisors & Managers by Quarter
Training Hours by QTR
YTD Training Hours
Training Hours
FY 2015 Results: Target - 1,960 hrs
2nd Qtr. Target – 490 hrs
----------------------------- Actual YTD
466.75hrs (24%)
Actual 2nd Qtr. 273.5 hrs (56 %)
193.25hrs ANNUAL 273.5hrs
466.75hrs

Facilities Management Strategic Planning Session – Second Quarter FY 2015 GOAL #4 Recruit, Develop and Retain Quality Employees Objective 4.2: Improve Workforce Development Tactic 4.2.2: Increase Employee Training to 20 hours/year Measure: Average Hours of Training completed by front line employees Lead: Facilities Business Office Balanced Scorecard Category: Internal Business Process. Learning and Growth
60
Lead
FBO
Training Hours
Annual Target - 20 hrs ea (388 x 20 hrs ea = 7,760 hrs)
0
1000
2000
3000
4000
5000
6000
7000
8000
Q1 Q2 Q3 Q4
Training Hours by QTR
YTD Training Hours
496.5 hrs
0
1000
2000
3000
4000
5000
6000
7000
8000
Q1 Q2 Q3 Q4
FY 15 Training Hours for front line employees by Quarter
Training Hours by QTR
YTD Training Hours
478.5 hrs
Fiscal 2015 Results: Annual Target - 7,760 hrs 2nd Qtr. Target – 1,940 hrs
--------------------------- Actual YTD
1,263 hrs (16.3 %)
Actual 2nd Qtr. 784.5 hrs (40.4 %)
ANNUAL 784.5 hrs
1,263 hrs

Facilities Management Strategic Planning Session – Second Quarter FY 2015 GOAL #4 Recruit, Develop and Retain Quality Employees Objective 4.3: Create and Maintain a Quality Work Environment Tactic 4.3.1: 90% of Employees satisfied or very satisfied working in FM Tactic 4.3.2: 87% of Employees satisfied or very satisfied in each unit of FM Lead: Facilities Business Office Balanced Scorecard Category: Customer Perspective
Survey Results and Data Review: • Directors developing actionable items based on survey feedback for report out - Fall 2014;
• Demographic data provided by HR – every two weeks; Frequencies and crosstabulations of the data have been performed and shared with AVC-FM; will be shared with leadership- Winter 2015
Survey Logistics: • Update survey instrument based on feedback from employees (add progress bar, investigate adding a comment box after
each section or field for employees to provide feedback, etc.) – Summer 2015
– Creation of a survey focus group consisting of non-supervisory employees from each of the major depts. to provide feedback on the questions as currently presented – i.e., are the questions clearly phrased for understanding, are we asking the right questions, etc. approved by AVC-FM 01/20/15
– Focus group members to be notified in February 2015; Work/meetings anticipated to begin in March 2015 with a proposed 3 week maximum time commitment by members;
• Next survey to be administered in October/November 2015.
61
Lead
FBO
ACTION PLAN

Facilities Management Strategic Planning Session – Second Quarter FY 2015 GOAL #4 Recruit, Develop and Retain Quality Employees Objective 4.3: Create and Maintain a Quality Work Environment Tactic 4.3.1: 90% of Employees satisfied or very satisfied working in FM Measure: Annual Employee Work Climate Survey Lead: Facilities Business Office Balanced Scorecard Category: Customer Perspective
62
Lead
F. O.
STATUS
Lead
FBO
ON HOLD
FY 2014 Annual Satisfaction: 89%

Facilities Management Strategic Planning Session – Second Quarter FY 2015 GOAL #4 Recruit, Develop and Retain Quality Employees Objective 4.3: Create and Maintain a Quality Work Environment Tactic 4.3.2: 87% of Employees satisfied or very satisfied in each unit of FM Measure: Annual Employee Work Climate Survey Lead: Facilities Business Office Balanced Scorecard Category: Customer Perspective
63
Lead
F. O.
Lead
FM
Operational
Units
88 90 92 84
96 88 87 90
86
67
100
0
20
40
60
80
100
120
Design Services Other Facilities Ops BES Recycling Capital
Unit Customer Satisfaction Survey FY Rating Comparison (%)
2012 Rating (%)
2014 Rating %
Goal = 87%
STATUS
All units are not at 87% satisfied
Unit 2014 Rating Extremely Satisfied Very Satisfied Satisfied
Design Services 88 0 44 44
Other 87 0 56 31
Facilities Ops 90 16 35 39
BES 86 16 33 40
Recycling 67 17 25 25
Capital 100 25 63 12
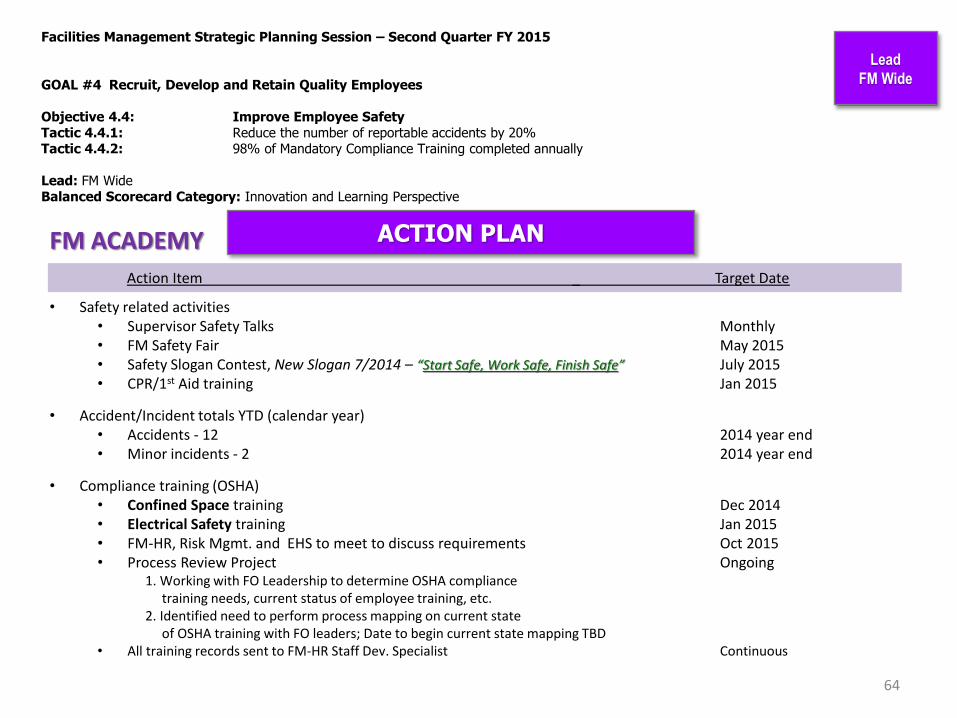
Facilities Management Strategic Planning Session – Second Quarter FY 2015 GOAL #4 Recruit, Develop and Retain Quality Employees Objective 4.4: Improve Employee Safety Tactic 4.4.1: Reduce the number of reportable accidents by 20% Tactic 4.4.2: 98% of Mandatory Compliance Training completed annually Lead: FM Wide Balanced Scorecard Category: Innovation and Learning Perspective
64
Lead
FM Wide
ACTION PLAN FM ACADEMY
Action Item _ Target Date
• Safety related activities • Supervisor Safety Talks Monthly • FM Safety Fair May 2015 • Safety Slogan Contest, New Slogan 7/2014 – “Start Safe, Work Safe, Finish Safe” July 2015 • CPR/1st Aid training Jan 2015
• Accident/Incident totals YTD (calendar year) • Accidents - 12 2014 year end • Minor incidents - 2 2014 year end
• Compliance training (OSHA) • Confined Space training Dec 2014 • Electrical Safety training Jan 2015 • FM-HR, Risk Mgmt. and EHS to meet to discuss requirements Oct 2015 • Process Review Project Ongoing
1. Working with FO Leadership to determine OSHA compliance training needs, current status of employee training, etc. 2. Identified need to perform process mapping on current state of OSHA training with FO leaders; Date to begin current state mapping TBD
• All training records sent to FM-HR Staff Dev. Specialist Continuous

Facilities Management Strategic Planning Session – Second Quarter FY 2015 GOAL #4 Recruit, Develop and Retain Quality Employees Objective 4.4: Improve Employee Safety Tactic 4.4.1: Reduce the number of reportable accidents by 20% Measure: Number of Reportable Accidents (Measured by Calendar Year) Lead: FM Wide Balanced Scorecard Category: Innovation and Learning Perspective
65
Lead
FM Wide
45
37
40
2826
24
17
24
19
11 12
7 64
20
1
57
12
0
5
10
15
20
25
30
35
40
45
50
2004 2005 2006 2007 2008 2009 2010 2011 2012 2013 2014
Accidents (Long Form) First Aid Only
FM Accident Trends
2014 Target ≤ 9
2013 = 11 accidents Target 20% Reduction = 9 2014 = 12 accidents
STATUS

Facilities Management Strategic Planning Session – Second Quarter FY 2015 GOAL #4 Recruit, Develop and Retain Quality Employees Objective 4.4: Improve Employee Safety Tactic 4.4.2: 98% of Mandatory Compliance Training completed annually Measure: Percent of employees completing mandatory compliance training Lead: Facilities Business Office Balanced Scorecard Category: Innovation and Learning Perspective
66
Lead
FM Wide
Reduce the number of reportable accidents by 20% - Improve Safety Awareness • Supervisor Safety Talks (SST) - monthly
• Annual FM Safety Fair - Annually, May 2015
• Annual FM Safety Slogan Contest. “Start Safe – Work Safe – Finish Safe”
Compliance Training
• Periodic meetings with EH&S to review needs, processes, etc. – next meeting scheduled Oct. 22,
2014;
• Identified need to perform process mapping on current OSHA training with FO Leaders; Tentatively
planned for Winter 2014
• Research training providers/vendors to help fill training gaps, as needed
ACTION PLAN
ANNUAL

Facilities Management Strategic Planning Session – Second Quarter FY 2015 GOAL #4 Recruit, Develop and Retain Quality Employees Objective 4.5: Improve Workforce Performance (Action Plan Only) Lead: Facilities Business Office Balanced Scorecard Category: Innovation and Learning Perspective
67
Lead
F. O.
Lead
FM Wide
ACTION PLAN
• Continued development of FM Academy
– Marketing Strategy & Website Development Jan 2015
– Content Development Jan 2015
– Vendor Selection and Delivery As Needed/As Funded
• HVAC Developmental Matrix completed Dec 2014
• Targeted Selection Training Dec 2014
• Boiler Operation, Maintenance & Safety Jan 2015
• Computer Training for BES Feb 2015
• “First Time Manager/Supervisor” Training Feb 2015
• Hosting APPA Leadership Academy (Level one) Apr/May 2015
Action Item Target Date

GOAL #5
Promote Good Stewardship
"The more positive you are
when you think and work
toward your goals, the faster
you achieve them.”
-- Brian Tracy, Speaker, Author,
Consultant

Facilities Management Strategic Planning Session – Second Quarter FY 2015 GOAL #5 Promote Good Stewardship Objective 5.1: Promote Fiscal Responsibility Tactic 5.1.1: 100% of financial accounts within budget Tactic 5.1.2: Increase Supplemental Funding to the Department by 10% annually Tactic 5.1.3: Achieve Administrative cost/GSF ± 5% of APPA Average for Peer Institutions Lead: Facilities Business Office Balanced Scorecard Category: Financial Perspective
Finance/Budget: • Continue periodic review of Labor Services;
• Develop Budget Memo and Instructions for FY 15-16; Obtain approval from AVC-FM – 1/14/15; Distribute packages to Directors NLT 01/20/15; Add new concept of two-year budget request cycle (Personnel only) this FY;
• Conduct mid-year budget review with BES Director (1/21/15) and FO Leadership (1/22/15); Implement monthly budget review with BES beginning February 2015 through June 2015; Continue current monthly meetings with FO Director through June 2015;
Supplemental Grant/Award Funding: • NC State Energy Office Grant for Electric Stations; $13K in matching funds set aside for grant; Awaiting final
expenditure plan details to determine if set aside can be reallocated; February 2015?;
• Campus Tree USA Designation/Award Submittal; Submitted Dec. 31, 2014 (on-time) – Anticipated notification March 2015;
• Developed award submittal for innovative/effective practices: Submitted on-time (11/30/14; Anticipated notification March 2015;
• Search for grant and award possibilities for Facilities Management organizations. For those grants requiring “matching funds”, ensure buy-in from AVC prior to submitting proposals – thru June 2015;
69
Lead
FBO
ACTION PLAN

Facilities Management Strategic Planning Session – Second Quarter FY 2015 GOAL #5 Promote Good Stewardship Objective 5.1: Promote Fiscal Responsibility Tactic 5.1.1: 100% of financial accounts within budget Tactic 5.1.2: Increase Supplemental Funding to the Department by 10% annually Tactic 5.1.3: Achieve Administrative cost/GSF ± 5% of APPA Average for Peer Institutions Lead: Facilities Business Office Balanced Scorecard Category: Financial Perspective
Cost Accounting: • Devise strategy to improve cost accounting measures within all areas of Facilities Management – FY 2015
– Improve org code usage – July 2014 and July 2015, on-going when possible; Three part org code concerns being addressed to include home org, timesheet org and pay/funding org; Home Org completed for KRONOS pilot; other areas to be addressed; Pay/Funding org actions currently in PeopleAdmin to be processed;
– Understanding the impact of personnel decisions on budget – on-going through-out FY.
– Implement budget revision process through June 30, 2015.
• Review monthly position control reports to ensure that positions/budgets are appropriately aligned. - 1st of each month;
• Requested an entry-level accountant position for FY 15 to assist in this area – July 2014;
• Improve use of account codes across FM; Currently addressing on the front end with 49er Mart, but other issues are occurring where there is no upfront oversight by FBO (i.e., ARCHIBUS NR work orders); increase monitoring efforts July 1, 2014 thru June 30, 2015 close out.
70
Lead
FBO
ACTION PLAN

Facilities Management Strategic Planning Session – Second Quarter FY 2015 GOAL #5 Promote Good Stewardship Objective 5.1: Promote Fiscal Responsibility Tactic 5.1.3: Achieve Administrative cost/GSF ± 5% of APPA Average for Peer Institutions Measure: Administrative cost/GSF from annual APPA Facilities Performance Indicators Report (APPA Benchmark) Lead: Facilities Business Office Balanced Scorecard Category: Financial Perspective
71
Lead
FBO
FY 14 APPA Survey: • APPA Survey submitted on-time (12/14); • New NACUBO survey added– responses submitted on-time (12/14); • Survey results anticipated March 2015; • Preparations for data gathering process to begin Summer 2015.
ACTION PLAN

GOAL #5 – Promote Good Stewardship Objective: 5.1: Promote Fiscal Responsibility Tactic 5.1.4: Achieve Custodial Costs/Student FTE Plus or Minus 5% of the APPA Average for Peer Institutions (Internal UNC Peers = East Carolina) (National Peers – Portland State University, University of New Mexico, University of Texas at San Antonio)
ACTION PLAN
• Actions Completed
– Installation of new Von Drehle paper towel dispensers in Administrative and Academic buildings
– Submitted square footage cleaned by BES to FBO for inclusion in the annual APPA survey
• Actions Planned
– Complete supply chain management project in McEniry (one-time funds)
– Make recommendation to continue or stop hand dryer installations
– Develop a BES strategic dashboard that tracks cost, quality, and process data points over time
– Monitor and report custodial cost/student FTE on an annual basis using data from APPA survey
72
Lead BES

73
Avg. cost/student = $217.99
UNCC = 6.105% above average
Facilities Management Strategic Planning Session – Second Quarter FY 2014 GOAL #5 –Promote Good Stewardship
Objective: 5.1: Promote Fiscal Responsibility Tactic 5.1.4: Achieve Custodial Costs/Student between Plus or Minus 5% of the APPA Average for Peer Institutions (Internal UNC
Peers = East Carolina) (National Peers – Portland State University, University of New Mexico, University of Texas at San Antonio)
Measure: Custodial Costs/Student from annual APPA Facilities Performance Indicators Report (APPA Benchmark) = Salaries + Supplies/Student FTE Balanced Scorecard Category: Financial Perspective
Lead BES
STATUS
UNCC = 33.774% below SRAPPA average
$-
$50.00
$100.00
$150.00
$200.00
$250.00
$300.00
$350.00
EastCarolina
University
PortlandState
University
Universityof NewMexico
Universityof North
Carolina atCharlotte
Universityof Texas
SanAntonio
SRAPPARegion
$204.43 $204.42
$227.53 $231.30 $222.31
$349.23
Custodial-Total Cost/Student FTE
East Carolina University
Portland State University
University of New Mexico
University of North Carolina at Charlotte
University of Texas San Antonio
SRAPPA Region

Facilities Management Strategic Planning Session – Second Quarter FY 2015
GOAL #5 – Promote Good Stewardship Objective: 5.1: Promote Fiscal Responsibility Tactic: 5.1.5: Achieve total Maintenance cost/GSF ± 5% of APPA Average for Peer Institutions Tactic: 5.1.6: Achieve total Landscape cost/acre ± 5% of APPA Average for Peer Institutions Tactic: 5.1.7: All Receipt Supported Funds Accounts have a positive balance at the end of the fiscal year
ACTION PLAN
Actions Planned
1 – Establish guidelines for qualifying reimbursable vs non-reimbursable work requests (To Charge or Not To Charge) by 28 November 2014. 2 – Weekly review of Facilities Operations Labor pool before going outside for additional staff support. 3 – Monthly review of Labor Services accounts with FBO to identify gaps and improve processes.
Actions Completed
1 - Identify opportunities to expand reimbursable work in an effort to support labor services funds Nov2014 2 - Realign the labor services positions to ensure maximum utilization of resources by Jan 2015
3 – Monthly review of Labor Services accounts with FBO to identify gaps and improve processes.
74
Lead
F. O.
Facilities Management Strategic Planning Session – Second Quarter FY 2015
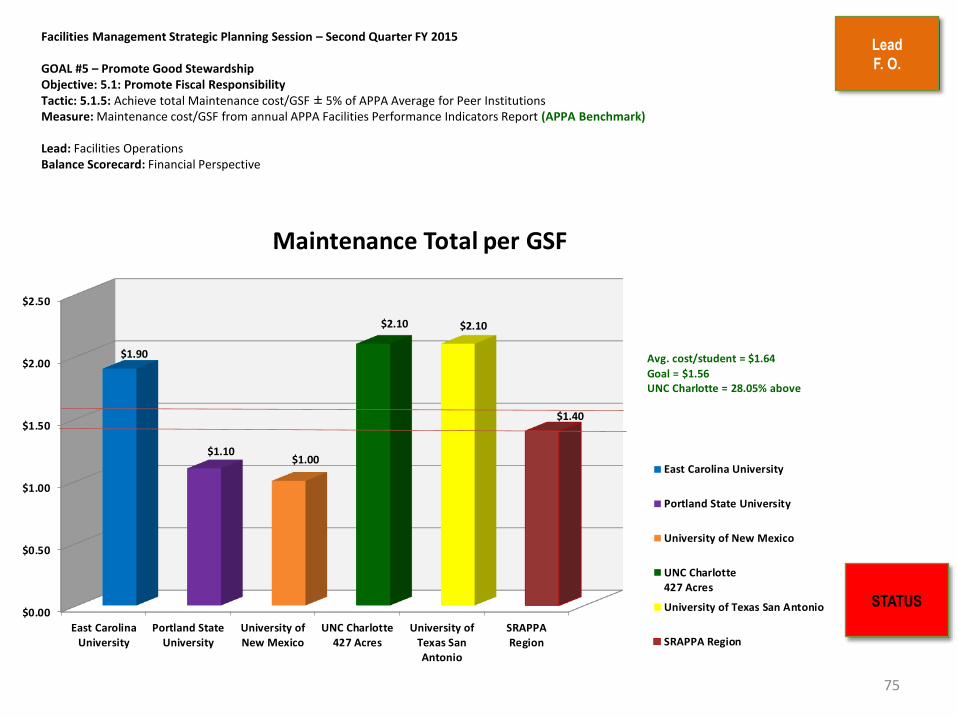
GOAL #5 – Promote Good Stewardship Objective: 5.1: Promote Fiscal Responsibility Tactic: 5.1.5: Achieve total Maintenance cost/GSF ± 5% of APPA Average for Peer Institutions Measure: Maintenance cost/GSF from annual APPA Facilities Performance Indicators Report (APPA Benchmark) Lead: Facilities Operations Balance Scorecard: Financial Perspective
75
Lead
F. O.
STATUS $0.00
$0.50
$1.00
$1.50
$2.00
$2.50
East CarolinaUniversity
Portland StateUniversity
University ofNew Mexico
UNC Charlotte427 Acres
University ofTexas SanAntonio
SRAPPARegion
$1.90
$1.10$1.00
$2.10 $2.10
$1.40
Maintenance Total per GSF
East Carolina University
Portland State University
University of New Mexico
UNC Charlotte427 Acres
University of Texas San Antonio
SRAPPA Region
Avg. cost/student = $1.64
Goal = $1.56UNC Charlotte = 28.05% above

Facilities Management Strategic Planning Session – Second Quarter FY 2015
GOAL #5 – Promote Good Stewardship Objective: 5.1: Promote Fiscal Responsibility Tactic: 5.1.6: Achieve total Landscape cost/acre ± 5% of APPA Average for Peer Institutions Measure: Landscape cost/acre from annual APPA Facilities Performance Indicators Report (APPA Benchmark) Lead: Facilities Operations Balance Scorecard: Financial Perspective
76
Lead
F. O.
STATUS
$0.00
$1.00
$2.00
$3.00
$4.00
$5.00
$6.00
$7.00
ECU Portland StateUniversity
University of NewMexico
UNC Charlotte427 Acres
University ofTexas SanAntonio
SRAPPA Region
$5.10
$6.70
$3.20 $3.30
$1.70
$4.40
Grounds - Total Cost per Acre
ECU
Portland State University
University of New Mexico
UNC Charlotte427 Acres
University of Texas SanAntonio
SRAPPA Region
Average Cost = $4.00
Goal = $3.80UNC Charlotte = 17.5% below average

Facilities Management Strategic Planning Session – Second Quarter FY 2015
GOAL #5 – Promote Good Stewardship Objective: 5.1: Promote Fiscal Responsibility Tactic: 5.1.7: All Receipt Supported Funds Accounts have a positive balance at the end of the fiscal year Measure: Dollars in account at end of fiscal year Lead: Facilities Operations Balance Scorecard: Financial Perspective
77
Lead
F. O.
STATUS
$494,748(21.3% Goal Met)
$300,58213% Goal Met)
$1,523,377(Balance to meet Goal)
$30,000 $330,000 $630,000 $930,000 $1,230,000 $1,530,000 $1,830,000 $2,130,000 $2,430,000
'
Dollars in Account at End of Fiscal Year
1st Qtr FY15 2nd Qtr FY15 Balance
$2.4M (100%)$1.2M (50%)
Lead
Recycling
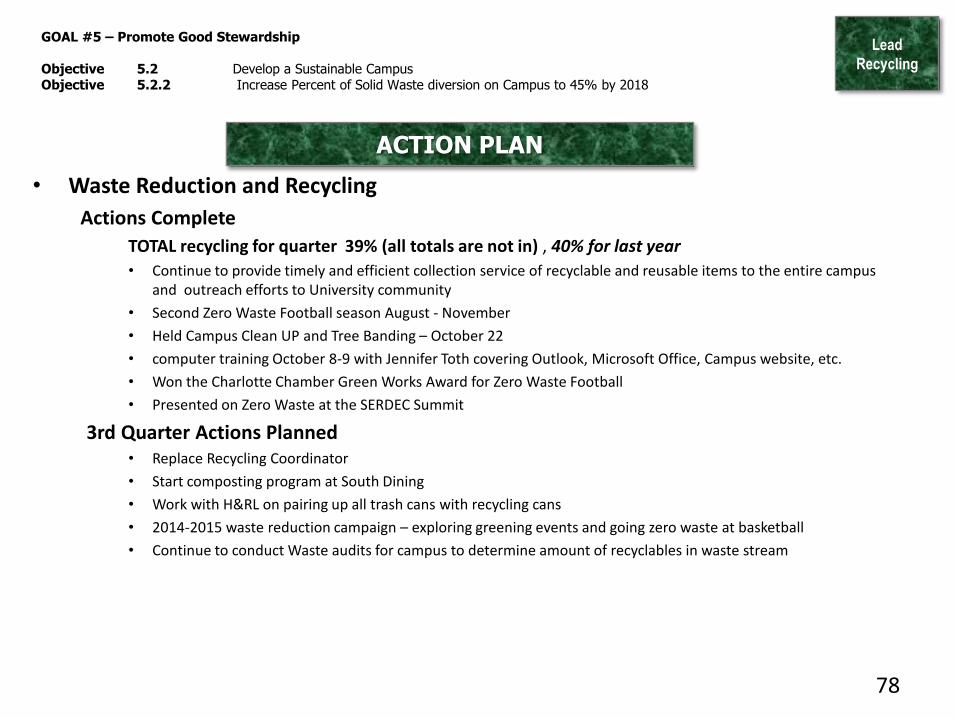
GOAL #5 – Promote Good Stewardship Objective 5.2 Develop a Sustainable Campus Objective 5.2.2 Increase Percent of Solid Waste diversion on Campus to 45% by 2018
ACTION PLAN
• Waste Reduction and Recycling
Actions Complete
TOTAL recycling for quarter 39% (all totals are not in) , 40% for last year
• Continue to provide timely and efficient collection service of recyclable and reusable items to the entire campus and outreach efforts to University community
• Second Zero Waste Football season August - November
• Held Campus Clean UP and Tree Banding – October 22
• computer training October 8-9 with Jennifer Toth covering Outlook, Microsoft Office, Campus website, etc.
• Won the Charlotte Chamber Green Works Award for Zero Waste Football
• Presented on Zero Waste at the SERDEC Summit
3rd Quarter Actions Planned • Replace Recycling Coordinator
• Start composting program at South Dining
• Work with H&RL on pairing up all trash cans with recycling cans
• 2014-2015 waste reduction campaign – exploring greening events and going zero waste at basketball
• Continue to conduct Waste audits for campus to determine amount of recyclables in waste stream
78

Facilities Management Strategic Planning Session – Second Quarter FY 2015 Objective 5.2: Develop a Sustainable Campus Tactic 5.2.1 Increase Recycling of Construction and Demolition Materials on Capital Projects to 80% of Total C&D Waste Measure: Pounds of C & D Waste Recycled divided by Total Pounds of C & D Waste Balanced Scorecard Category: Innovation and Learning Perspective
Lead
Recycling
79
60.4% 60.4%
76.3%
79.0%
0
200
400
600
800
1,000
1,200
FY 13 FY 14 FY 15 (YTD) Total Qtr
Ton
s
Construction & Demolition Debris Diversion 2nd Quarter FY15
Tons Landfilled
Tons Recycled

Facilities Management Strategic Planning Session – Second Quarter FY 2015 Tactic 5.2.2 Increase Percent of Solid Waste Diversion on Campus to 45% Measure: Pounds of Solid Waste Recycled, composted and reused Annually divided by Total Solid Waste Balanced Scorecard Category: Innovation and Learning Perspective
Lead
Recycling
80
198 tons
345 tons
287 tons
313 tons
303 tons
695 tons
865 tons 764
tons
765 tons
780 tons
28%
40%
38% 41% 39%
Baseline 4th QtrFY08
3rd Qtr FY14 4th Qtr FY14 1st Qtr FY15 2nd Qtr FY15
Breakdown of Solid Waste
Total Waste
Diverted Waste

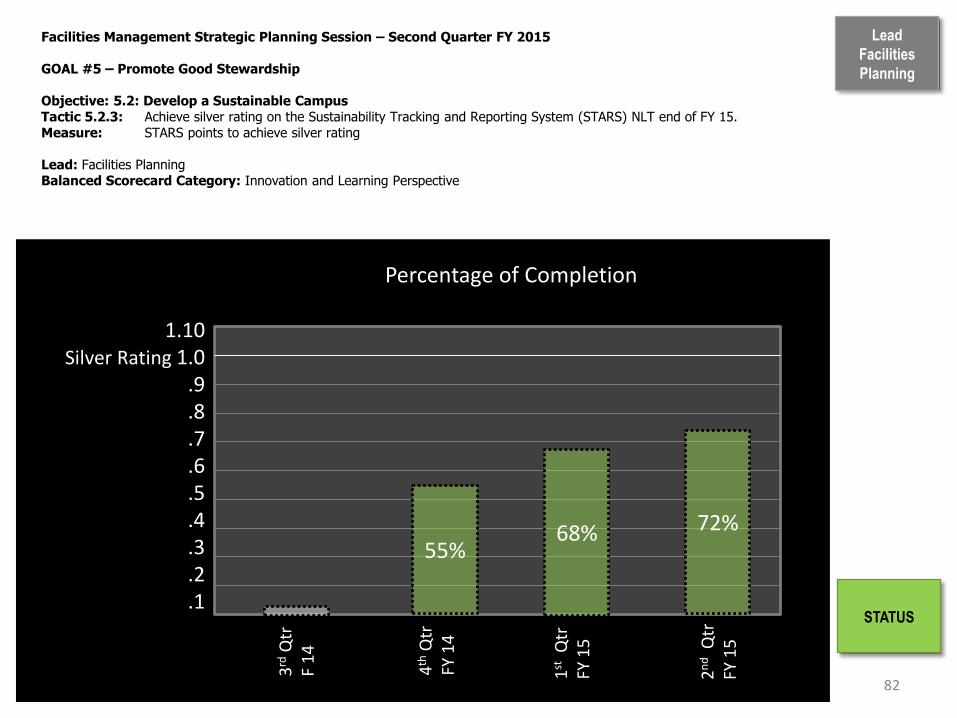
Facilities Management Strategic Planning Session – Second Quarter FY 2015 GOAL #5 – Promote Good Stewardship Objective: 5.2: Develop a Sustainable Campus Tactic 5.2.3: Achieve silver rating on the Sustainability Tracking and Reporting System (STARS) NLT end of FY 15. Measure: STARS points to achieve silver rating Lead: Facilities Planning Balanced Scorecard Category: Innovation and Learning Perspective
81
ACTION PLAN
• Actions Planned:
o Assess additional actions list for achieving STARS Silver; by 2/15.
o Quarterly update of implementation plan for earning further
credits based on feasibility: 2/15, 5/15.
o Achieve silver rating by end of FY 15.
Lead
Facilities
Planning
STATUS
Lead
Facilities
Planning
82
Percentage of Completion 3
rd Q
tr
F 1
4
4th
Qtr
FY
14
1.10 Silver Rating 1.0
.9
.8
.7
.6
.5
.4
.3
.2
.1
Facilities Management Strategic Planning Session – Second Quarter FY 2015 GOAL #5 – Promote Good Stewardship Objective: 5.2: Develop a Sustainable Campus Tactic 5.2.3: Achieve silver rating on the Sustainability Tracking and Reporting System (STARS) NLT end of FY 15. Measure: STARS points to achieve silver rating Lead: Facilities Planning Balanced Scorecard Category: Innovation and Learning Perspective
55%
STATUS
2n
d Q
tr
FY 1
5
68% 1
st Q
tr
FY 1
5
72%

Facilities Management Strategic Planning Session – Second Quarter FY 2015 GOAL #5 – Promote Good Stewardship Objective: 5.2: Develop a Sustainable Campus Tactic 5.2.4: Implement 60% of the Campus Sustainability Plan best practices NLT end of FY 15. Measure: Percent of Campus Sustainability Plan best practices implemented Lead: Facilities Planning Balanced Scorecard Category: Innovation and Learning Perspective
83
ACTION PLAN
• Actions Planned:
o Develop 7 themes for implementing best practices by May 2015. 1. Assessment
2. Faculty Development for Curriculum
3. Campus as a “Living Laboratory” for Research
4. Outreach Communications
5. Design Standards
6. Standard Operating Procedures
7. Purchasing Practices
o Draft annual plan and budget by February 2015 to achieve implementation of 60% of identified best practices.
o Demonstrate 60% of best practices implemented by October 2015.
Lead
Facilities
Planning
STATUS

Lead
Facilities
Planning
84
Percentage of Completion
4th
Qtr
FY
14
1.0 .9 .8 .7
Best Practices .6 .5 .4 .3 .2 .1 0
Facilities Management Strategic Planning Session – Second Quarter FY 2015 GOAL #5 – Promote Good Stewardship Objective: 5.2: Develop a Sustainable Campus Tactic 5.2.4: Implement 60% of the Campus Sustainability Plan best practices NLT end of FY 15. Measure: Percent of Campus Sustainability Plan best practices implemented Lead: Facilities Planning Balanced Scorecard Category: Innovation and Learning Perspective
STATUS
2n
d Q
tr
FY 1
5
47%
3rd
Qtr
FY
14
1st
Qtr
FY
15
33%
47%

Lead
Capital
GOAL #5 – Promote Good Stewardship Objective 5.3 Conserve Natural Resources Tactics 5.3.1 Decrease Energy Usage 30% by FY2015
ACTIONS TO REDUCE CAMPUS ENERGY USAGE
85
• Performance Contract complete
• System Wide Lighting Performance Contract
• Continue retro-commissioning program
• Exterior Lighting upgrades to LED
• Street light replacements fixtures have been finalized project to
be complete by May.
• Pedestrian Lights to be replaced as funds become available –
start with campus core.

Facilities Management Strategic Planning Session – 2nd QTR FY 2015 GOAL #5 – Promote Good Stewardship Objective 5.3 Conserve Natural Resources Tactics 5.3.1 Decrease Energy Usage by 30% by FY2015 Measure: BTUs/GSF/Year consumed on campus
Balanced Scorecard Category: Financial Perspective
Lead
Capital
STATUS
CAMPUS ENERGY USAGE
Kbtu/GSF
Base Year FY 2003 Current Reduction 30.2% Mandated Reduction 30% BY FY 15
124
111 117
120 125
120 124
117 113
109
93 90
86.6 87
0
20
40
60
80
100
120
140
FY03 FY04 FY05 FY06 FY07 FY08 FY09 FY10 FY11 FY12 FY13 FY14 FY15 FY15GOAL

Facilities Management Strategic Planning Session – 2nd QTR FY 2015 GOAL #5 – Promote Good Stewardship Objective 5.3 Conserve Natural Resources Tactics 5.3.2 Decrease Water Usage by 20% by FY2010 Measure: Gallons/GSF/Year consumed on campus
Balanced Scorecard Category: Financial Perspective
Lead
Capital
87
STATUS
Still need to reduce water usage to help preserve valuable resources
Goal 43 Gal/GSF Actual 21 Gal/GSF
54
40
36 36
32 34
29
32
43
34 34
24
19 21
-
10
20
30
40
50
60
FY03 FY04 FY05 FY06 FY07 FY08 FY09 FY10 GOAL FY11 FY12 FY13 FY14 FY15
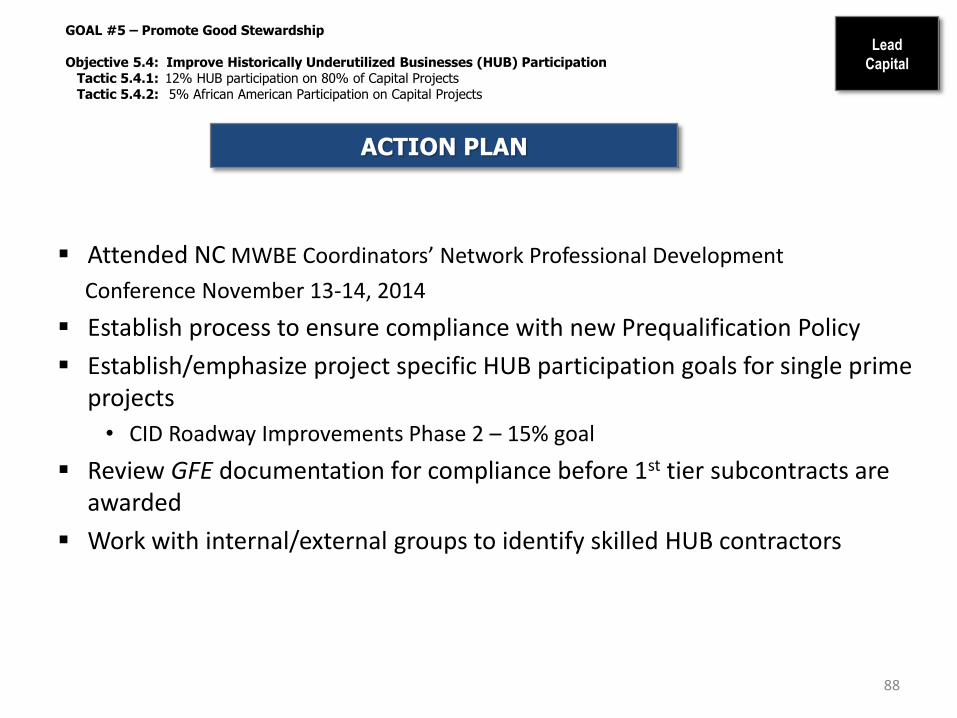
Lead
Capital
GOAL #5 – Promote Good Stewardship Objective 5.4: Improve Historically Underutilized Businesses (HUB) Participation Tactic 5.4.1: 12% HUB participation on 80% of Capital Projects Tactic 5.4.2: 5% African American Participation on Capital Projects
ACTION PLAN
Attended NC MWBE Coordinators’ Network Professional Development
Conference November 13-14, 2014
Establish process to ensure compliance with new Prequalification Policy
Establish/emphasize project specific HUB participation goals for single prime projects
• CID Roadway Improvements Phase 2 – 15% goal
Review GFE documentation for compliance before 1st tier subcontracts are awarded
Work with internal/external groups to identify skilled HUB contractors
88

Facilities Management Strategic Planning Session – Second Quarter FY2015 GOAL #5 – Promote Good Stewardship Objective: 5.4: Improve Historically Underutilized Businesses (HUB) Participation Tactic 5.4.1: 12% HUB participation on 80% of Capital Projects Measure: Number of Individual Capital Projects achieving 12% HUB participation divided into Total Projects Completed Lead: Capital Projects
Balanced Scorecard Category: Financial Perspective
Lead
Capital
89
STATUS
0
1
2
3
4
5
6
7
PR
OJE
CTS
HUB Participation Capital Projects > $500,000
Total Projects Completed
Projects with 12% HUBParticipation
100%
100%
67%
20%
80% GOAL
Cone Plaza - 26.4% HUB Campus-wide Roofing Projects - 4% HUB

Facilities Management Strategic Planning Session – Second Quarter FY2015 GOAL #5 – Promote Good Stewardship Objective: 5.4: Improve Historically Underutilized Businesses (HUB) Participation Tactic 5.4.2: 5% African American Participation on Capital Projects Measure: Total Capital Dollars awarded to African American Contractors divided by Total Contract Dollars Lead: Capital Projects
Balanced Scorecard Category: Financial Perspective
Lead
Capital
90
STATUS
$0
$20
$40
$60
$80
$100
$120
Mill
ion
s
Capital Projects African American Participation
Total Capital Project Dollars
Capital Project Dollarsw/African American Firms
6% 4% 8% 4%
5% GOAL

Facilities Management Strategic Planning Session – Second Quarter FY2015 GOAL #5 – Promote Good Stewardship Objective: 5.4: Improve Historically Underutilized Businesses (HUB) Participation Tactic 5.4.3: 15% overall HUB participation on Informal contracts $30,000 and above Measure: Total Informal Contract Dollars awarded to HUB Contractors divided by Total Contract Dollars Lead: Capital Projects Balanced Scorecard Category: Financial Perspective
Lead
Capital
91
STATUS
$0
$500,000
$1,000,000
$1,500,000
$2,000,000
$2,500,000
$3,000,000
$3,500,000
$4,000,000
HUB Participation Informal Projects > $30,000
Total Informal Project Dollars
Informal Project Dollars w/HUBFirms
47% 39%
38%
56%
15% GOAL

Facilities Management Strategic Planning Session – Second Quarter FY 2015 GOAL #5 – Promote Good Stewardship Objective: 5.4: Improve Historically Underutilized Business (HUB) Participation Lead: Design Services Balanced Scorecard Category: Internal Business Process
92
Lead Design Services
Tactic 5.4.4: 13% overall HUB participation on informal projects below $30,000 including 3% African American Measure: Total Percentage of HUB participation on all Informal Projects below $30,000 (Construction only) divided by Total Contracts Tactic 5.4.5: 3% African American participation on Informal projects below $30,000 Measure: Total African American contract dollars (Construction only) divided by Total Contract Dollars
Currently focused on expanding our outreach to new African American contractors & vendors. Timeline: FY15 QTR 3 - FY15 QTR 4
All Coordinators are encouraged to reach out to new vendors for work on our Under $30K projects - Ongoing.
ACTION PLANS FOR IMPROVEMENT
ONGOING IMPROVEMENTS
NEW IMPROVEMENTS
Continue to review and discuss HUB contractors and vendors at Design Services weekly meetings.
Design Services and FIS are working to improve HUB reporting via ARCHIBUS Strategic Quarterly Reports.
Timeline: FY15 QTR 3 - FY15 QTR 4
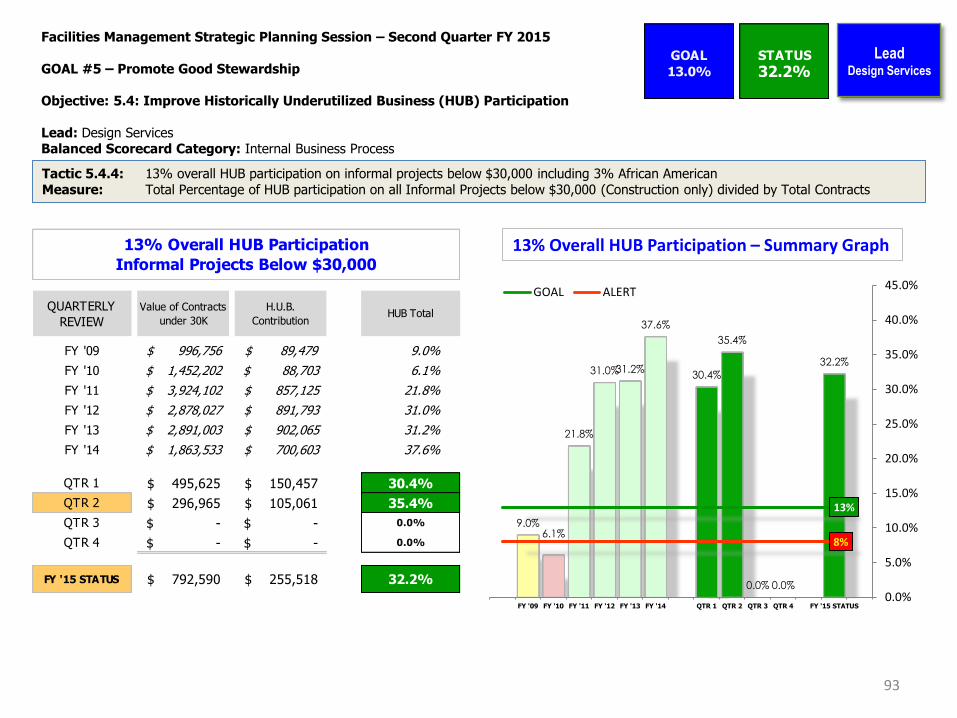
Facilities Management Strategic Planning Session – Second Quarter FY 2015 GOAL #5 – Promote Good Stewardship Objective: 5.4: Improve Historically Underutilized Business (HUB) Participation Lead: Design Services Balanced Scorecard Category: Internal Business Process
GOAL STATUS
13.0% 32.2%
93
Lead Design Services
13% Overall HUB Participation – Summary Graph
Tactic 5.4.4: 13% overall HUB participation on informal projects below $30,000 including 3% African American Measure: Total Percentage of HUB participation on all Informal Projects below $30,000 (Construction only) divided by Total Contracts
QUARTERLY
REVIEW
Value of Contracts
under 30K
H.U.B.
ContributionHUB Total
FY '09 $ 996,756 $ 89,479 9.0%
FY '10 1,452,202$ 88,703$ 6.1%
FY '11 3,924,102$ 857,125$ 21.8%
FY '12 2,878,027$ 891,793$ 31.0%
FY '13 2,891,003$ 902,065$ 31.2%
FY '14 1,863,533$ 700,603$ 37.6%
QTR 1 495,625$ 150,457$ 30.4%
QTR 2 296,965$ 105,061$ 35.4%
QTR 3 -$ -$ 0.0%
QTR 4 -$ -$ 0.0%
FY '15 STATUS 792,590$ 255,518$ 32.2%
13% Overall HUB Participation
Informal Projects Below $30,000
9.0% 6.1%
21.8%
31.0% 31.2%
37.6%
30.4%
35.4%
0.0% 0.0%
32.2%
13%
8%
0.0%
5.0%
10.0%
15.0%
20.0%
25.0%
30.0%
35.0%
40.0%
45.0%
FY '09 FY '10 FY '11 FY '12 FY '13 FY '14 QTR 1 QTR 2 QTR 3 QTR 4 FY '15 STATUS
GOAL ALERT

Facilities Management Strategic Planning Session – Second Quarter FY 2015 GOAL #5 – Promote Good Stewardship Objective: 5.4: Improve Historically Underutilized Business (HUB) Participation Lead: Design Services Balanced Scorecard Category: Internal Business Process
4.1%
5.1%
2.0%
1.6%
4.0%
5.6%
0.0%
2.6%
1.0%
3%
2%
0.0%
1.0%
2.0%
3.0%
4.0%
5.0%
6.0%
FY '09 FY '10 FY '11 FY '12 FY '13 FY '14 QTR 1 QTR 2 QTR 3 QTR 4 FY '15 STATUS
GOAL ALERT
3% African American Participation – Summary Graph
94
Lead Design Services
Tactic 5.4.5: 3% African American participation on Informal projects below $30,000 Measure: Total African American contract dollars divided by Total Contract Dollars
QUARTERLY
REVIEW
Value of Contracts
under 30K
African Am.
ContributionAfrican Am. Total
FY '09 $ 996,756 $ 40,894 4.1%
FY '10 1,452,202$ 73,987$ 5.1%
FY '11 3,924,102$ 77,377$ 2.0%
FY '12 2,878,027$ 46,475$ 1.6%
FY '13 2,891,003$ 115,219$ 4.0%
FY '14 1,863,533$ 103,513$ 5.6%
QTR 1 495,625$ -$ 0.0%
QTR 2 296,965$ 7,695$ 2.6%
QTR 3 -$ -$
QTR 4 -$ -$
FY '15 STATUS 792,590$ 7,695$ 1.0%
3% African American Participation
Informal Projects Below $30,000
GOAL STATUS
3.0% 2.6%