Vodacom Vodacom Group Annual Results
18th June 2003
2
Outline• Strategic Highlights
• Group Financial Review
2

This presentation has been prepared and published by Vodacom Group (Proprietary) Limited.
Vodacom Group (Proprietary) Limited is a private company and as such is not required by the Companies Act of 61 of 1973, as amended, to publish its results.
Vodacom Group (Proprietary) Limited makes no guarantee, assurance, representation and/or warranty as to the accuracy of the information contained in this presentation and will not be held liable for any reliance placed on the information contained in this presentation.
The information contained in this presentation is subject to change without notice and may be incomplete or condensed. In addition, this presentation may not contain all material information pertaining to Vodacom Group (Proprietary) Limited and its subsidiaries.
Without in anyway derogating from the generality of the foregoing, it should be noted that:
• Many of the statements included in this presentation are forward-looking statements that involve risks and/or uncertainties and caution must be exercised in placing any reliance on these statements. Moreover, Vodacom Group (Proprietary) Limited will not necessarily update any of these statements after the date of this presentation either to conform them to actual results or to changes in our expectations.
• Insofar as the shareholder’s of Vodacom Group (Proprietary) Ltd are listed and offer their shares publicly for sale on recognised Stock Exchanges locally and/or internationally, potential investors in the shares of Vodacom Group (Proprietary) Limited’s shareholders are cautioned not to place undue reliance on this presentation.
Strategic Highlights
Alan Knott-CraigGroup Chief Executive Officer
Leveraging SA market5
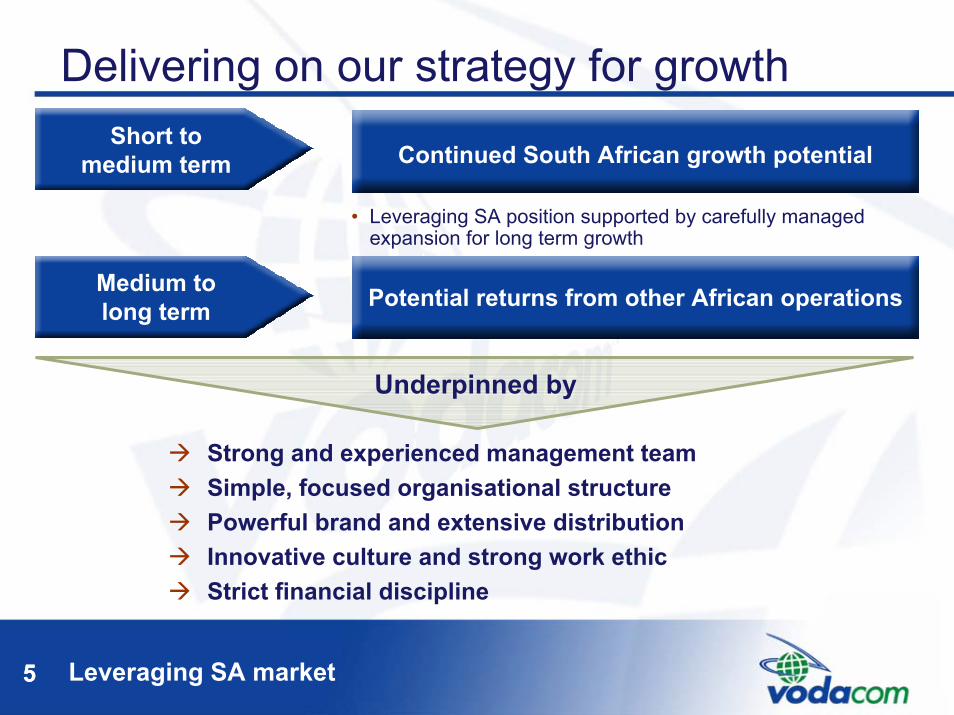
Delivering on our strategy for growth
Strong and experienced management teamSimple, focused organisational structure Powerful brand and extensive distributionInnovative culture and strong work ethicStrict financial discipline
Underpinned by
• Leveraging SA position supported by carefully managed expansion for long term growth
Continued South African growth potential
Potential returns from other African operations
Short to medium term
Medium to long term
5
Strong growth6
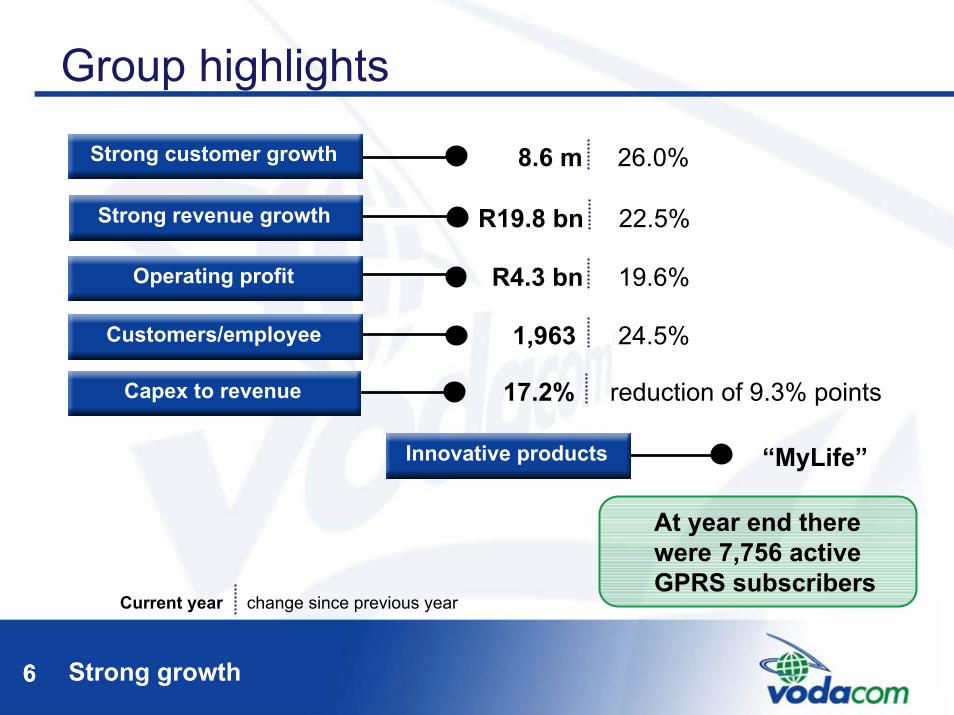
Group highlights
At year end there were 7,756 active GPRS subscribers
6
R19.8 bn 22.5%
8.6 m 26.0%RevenueStrong customer growth
RevenueStrong revenue growth
R4.3 bn 19.6% RevenueOperating profit
1,963 24.5% RevenueCustomers/employee
17.2% reduction of 9.3% points RevenueCapex to revenue
RevenueInnovative products “MyLife”
Current year change since previous year
Leverage off better economies of scale7
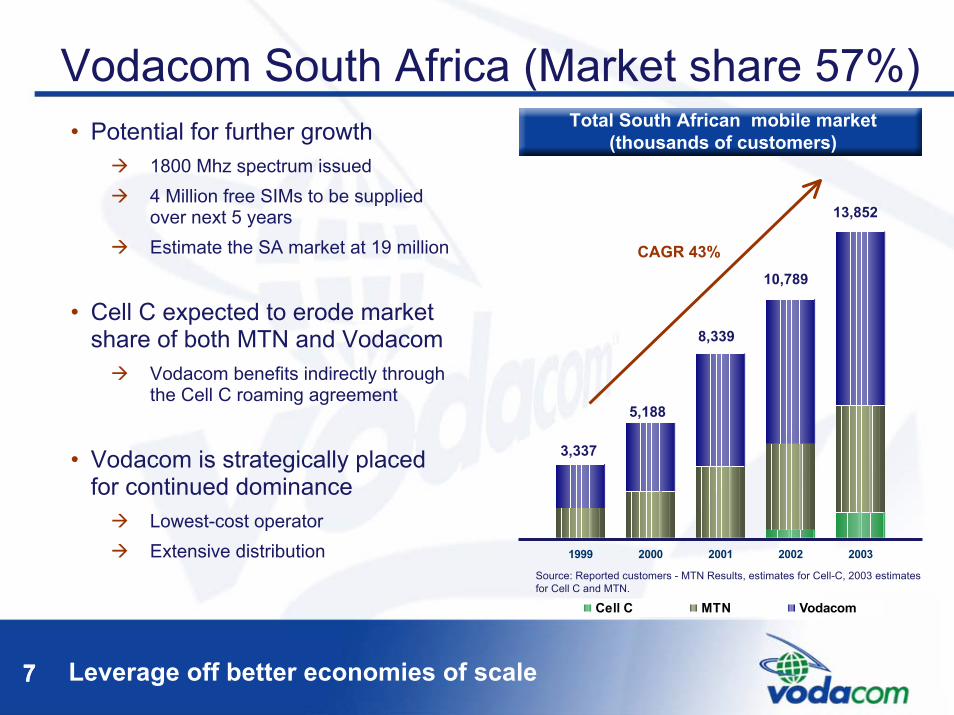
Vodacom South Africa (Market share 57%)Total South African mobile market
(thousands of customers)• Potential for further growth1800 Mhz spectrum issued4 Million free SIMs to be supplied over next 5 yearsEstimate the SA market at 19 million
• Cell C expected to erode market share of both MTN and Vodacom
Vodacom benefits indirectly through the Cell C roaming agreement
• Vodacom is strategically placed for continued dominance
Lowest-cost operatorExtensive distribution
Source: Reported customers - MTN Results, estimates for Cell-C, 2003 estimates for Cell C and MTN.
1999 2000 2001 2002 2003
Cell C MTN Vodacom
CAGR 43%
3,337
5,188
8,339
10,789
13,852
7

Growing a dynamic customer base8
Strong SA operational indicators• Gross connections up 15.0% to a
new high of 3.5 million84.6% of closing base is prepaid18.2% of closing base is inactive
• Churn trendsContract churn at all-time low of 11.9%Prepaid churn increased to 34.0%
• Total traffic1 increased by 18% to 10.5 billion minutes
• 2003 average of 15 SMS’s per customer, March 2003 18.3
• Total SA ARPU begins stabilising1. Total traffic excluding national roaming and incoming international
3,069
5,1086,557
7,874
1,8842,990
3,495
3,038
2000 2001 2002 2003Customers Gross connections
Vodacom SA customers and gross connections (thousands)
266208 182
629481 493
560
183
98 9093132
2000 2001 2002 2003
Contract ARPU Total ARPU Prepaid ARPU
Vodacom SA ARPU (R’s)
8
Our largest other African operation9
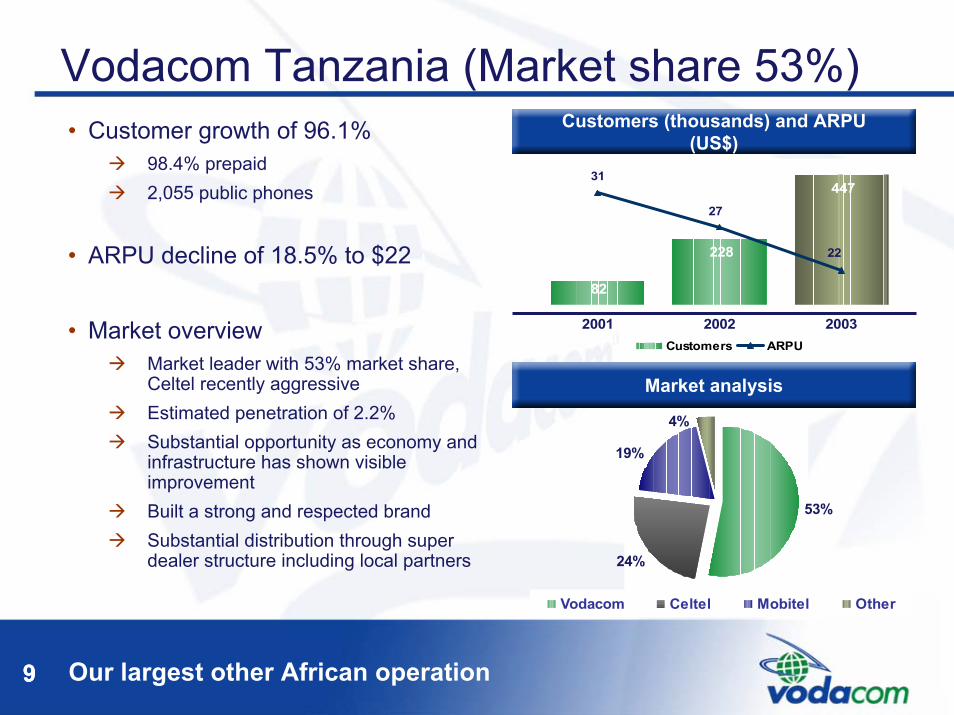
Vodacom Tanzania (Market share 53%)
82
228
44731
27
22
2001 2002 2003Customers ARPU
Customers (thousands) and ARPU (US$)
Market analysis
53%
24%
19%
4%
Vodacom Celtel Mobitel Other
• Customer growth of 96.1%98.4% prepaid2,055 public phones
• ARPU decline of 18.5% to $22
• Market overviewMarket leader with 53% market share, Celtel recently aggressiveEstimated penetration of 2.2%Substantial opportunity as economy and infrastructure has shown visible improvementBuilt a strong and respected brandSubstantial distribution through super dealer structure including local partners
9
Positive first year of operations10
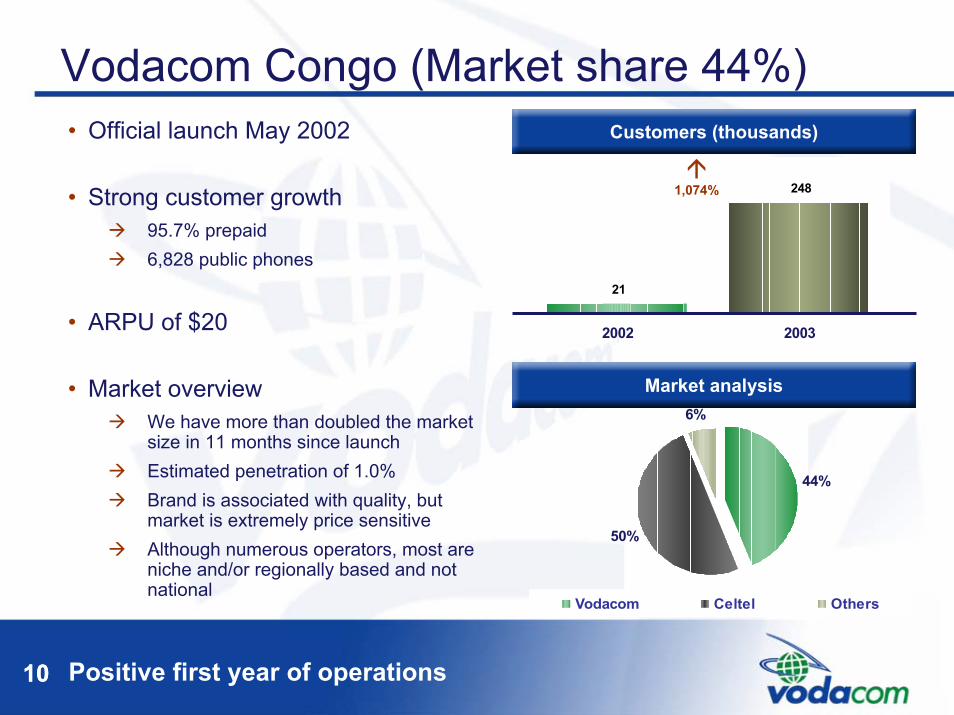
Vodacom Congo (Market share 44%)
21
248
2002 2003
Customers (thousands)
1,074%
44%
50%
6%
Vodacom Celtel Others
Market analysis
• Official launch May 2002
• Strong customer growth95.7% prepaid6,828 public phones
• ARPU of $20
• Market overviewWe have more than doubled the market size in 11 months since launchEstimated penetration of 1.0%Brand is associated with quality, but market is extremely price sensitiveAlthough numerous operators, most are niche and/or regionally based and not national
10
Responding to change11
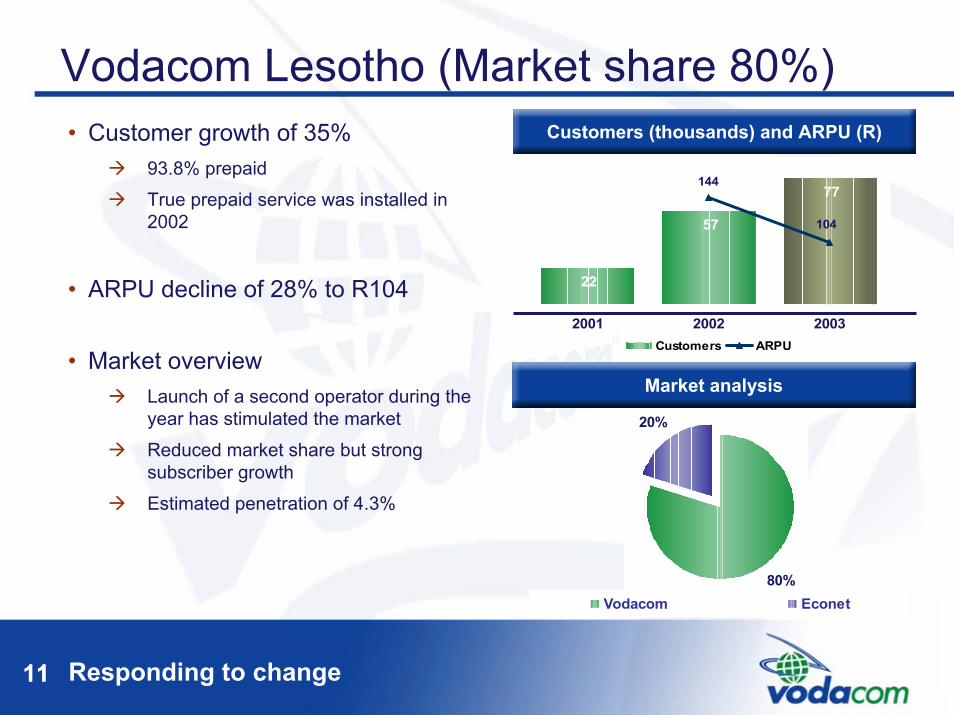
Vodacom Lesotho (Market share 80%)
22
57
77144
104
2001 2002 2003Customers ARPU
Customers (thousands) and ARPU (R)
Market analysis
80%
20%
Vodacom Econet
• Customer growth of 35%93.8% prepaidTrue prepaid service was installed in 2002
• ARPU decline of 28% to R104
• Market overviewLaunch of a second operator during the year has stimulated the marketReduced market share but strong subscriber growthEstimated penetration of 4.3%
11
State of the art South African network12
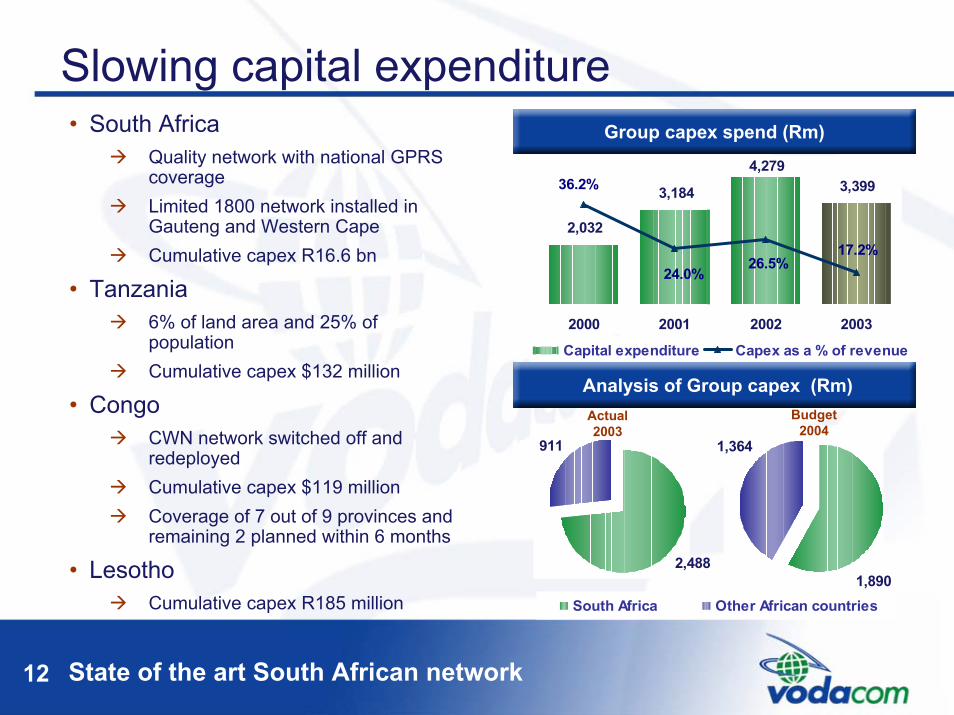
Slowing capital expenditure• South Africa
Quality network with national GPRS coverageLimited 1800 network installed in Gauteng and Western CapeCumulative capex R16.6 bn
• Tanzania6% of land area and 25% of populationCumulative capex $132 million
• CongoCWN network switched off and redeployedCumulative capex $119 millionCoverage of 7 out of 9 provinces and remaining 2 planned within 6 months
• LesothoCumulative capex R185 million
Capex as a % of revenue
2,032
3,184
4,2793,39936.2%
24.0%17.2%
26.5%
2000 2001 2002 2003
Capital expenditure Capex as a % of revenue
Group capex spend (Rm)
Analysis of Group capex (Rm)
2,488
911
South Africa Other African countries
1,364
1,890
Budget2004
Actual2003
Financial Review
Leon CrouseGroup Finance Director
Consistent results14
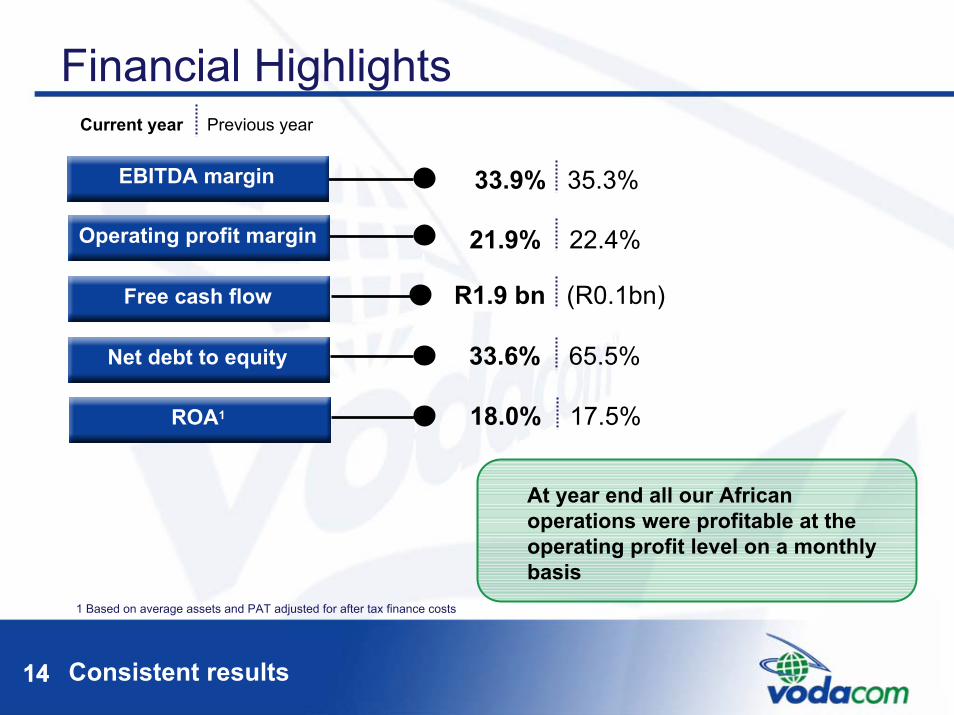
Financial HighlightsCurrent year Previous year
33.9% 35.3%RevenueEBITDA margin
21.9% 22.4%RevenueOperating profit margin
R1.9 bn (R0.1bn)RevenueFree cash flow
33.6% 65.5% RevenueNet debt to equity
18.0% 17.5% RevenueROA1
At year end all our African operations were profitable at the operating profit level on a monthly basis
1 Based on average assets and PAT adjusted for after tax finance costs
14
Customers driving revenue15
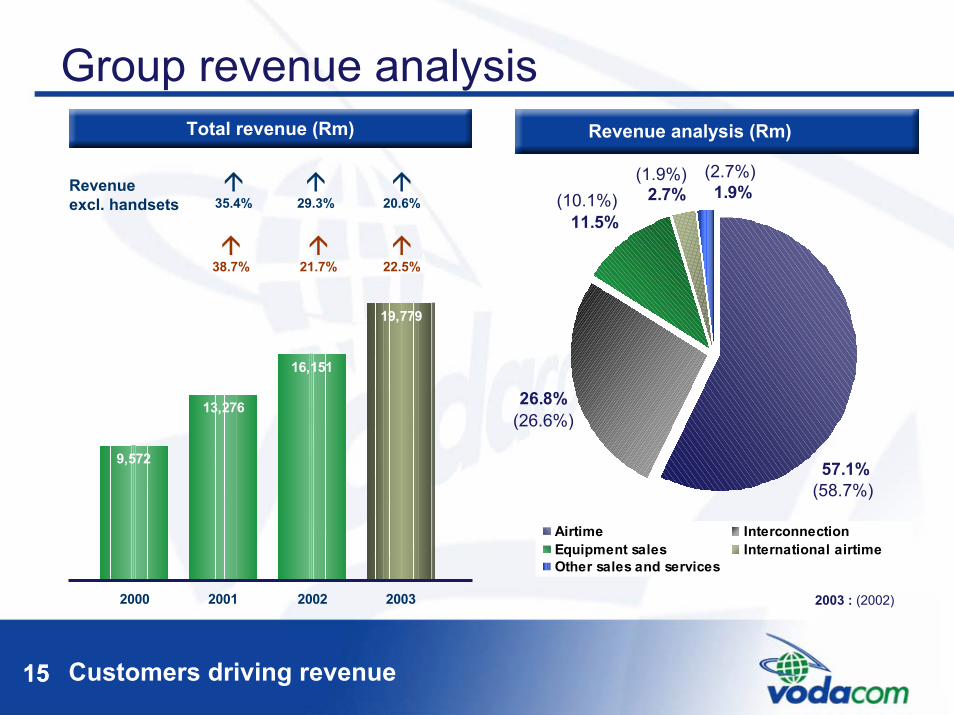
Group revenue analysis
2.7%11.5%
26.8%
57.1%
1.9%
Airtime InterconnectionEquipment sales International airtimeOther sales and services
Revenue analysis (Rm)
(58.7%)
(26.6%)
(10.1%)(1.9%) (2.7%)
Total revenue (Rm)
16,151
13,276
9,572
19,779
2000 2001 2002 2003
38.7% 21.7% 22.5%
35.4% 29.3% 20.6%Revenue excl. handsets
2003 : (2002)
15
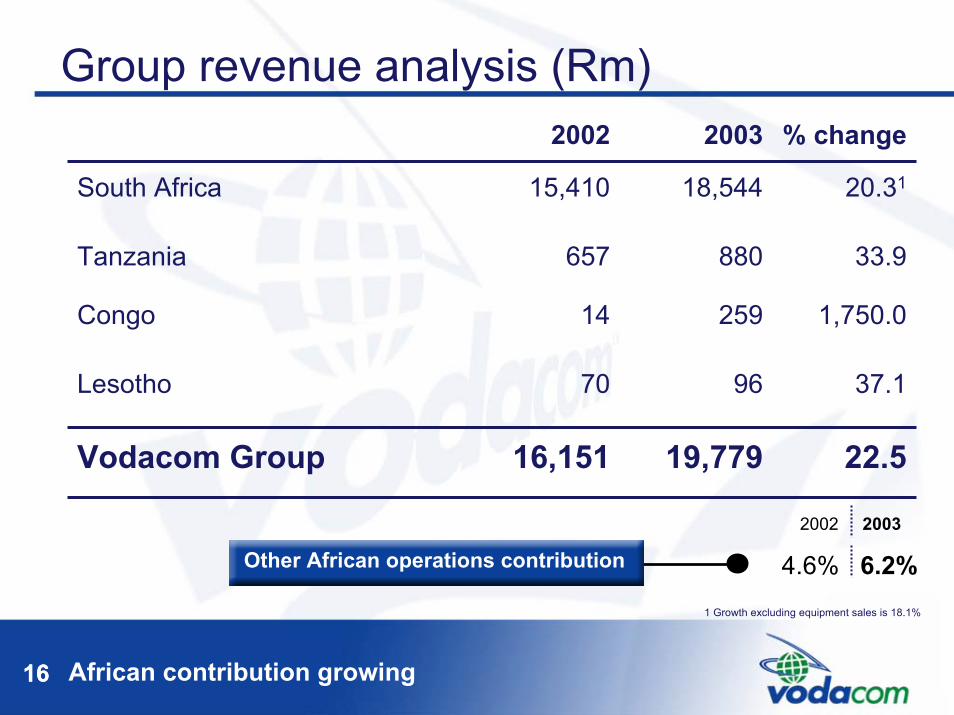
African contribution growing16
Group revenue analysis (Rm)
37.19670Lesotho
22.519,77916,151Vodacom Group
1,750.025914Congo
33.9880657Tanzania
20.3118,54415,410South Africa
% change20032002
2002 2003
16
RevenueOther African operations contribution 4.6% 6.2%1 Growth excluding equipment sales is 18.1%

SMS is still the main driver of data revenue17
SA data revenueData revenue (Rm)• Revenue from data services makes
up 3% of total revenue
• Strong penetration of SMS useContract 73%
Prepaid 42%
• SMS usage increased 64.7% to 1.5 billion for the year
• Stimulated by new tariff packages such as 4U
• Impact of MyLife and new generation handsets is still to be felt
581
400
266
2001 2002 2003
50.4% 45.3%
17
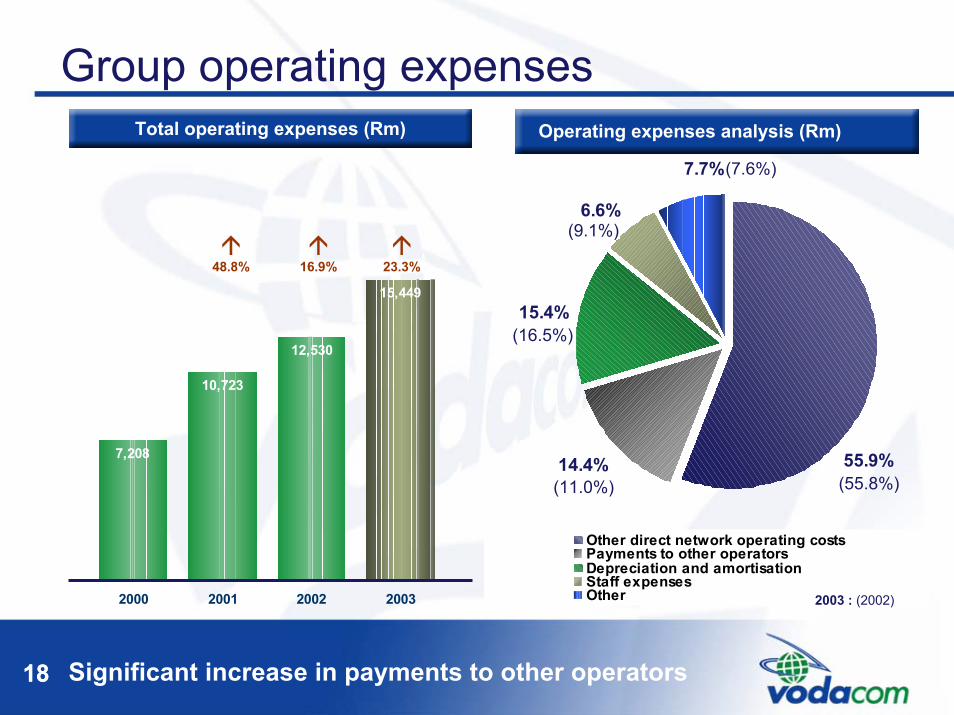
Significant increase in payments to other operators18
Group operating expensesTotal operating expenses (Rm)
6.6%
15.4%
14.4% 55.9%
7.7%
Other direct network operating costsPayments to other operatorsDepreciation and amortisationStaff expensesOther
Operating expenses analysis (Rm)
(11.0%) (55.8%)
(7.6%)
(9.1%)
(16.5%)
2003 : (2002)
12,530
10,723
7,208
15,449
2000 2001 2002 2003
48.8% 16.9% 23.3%
18
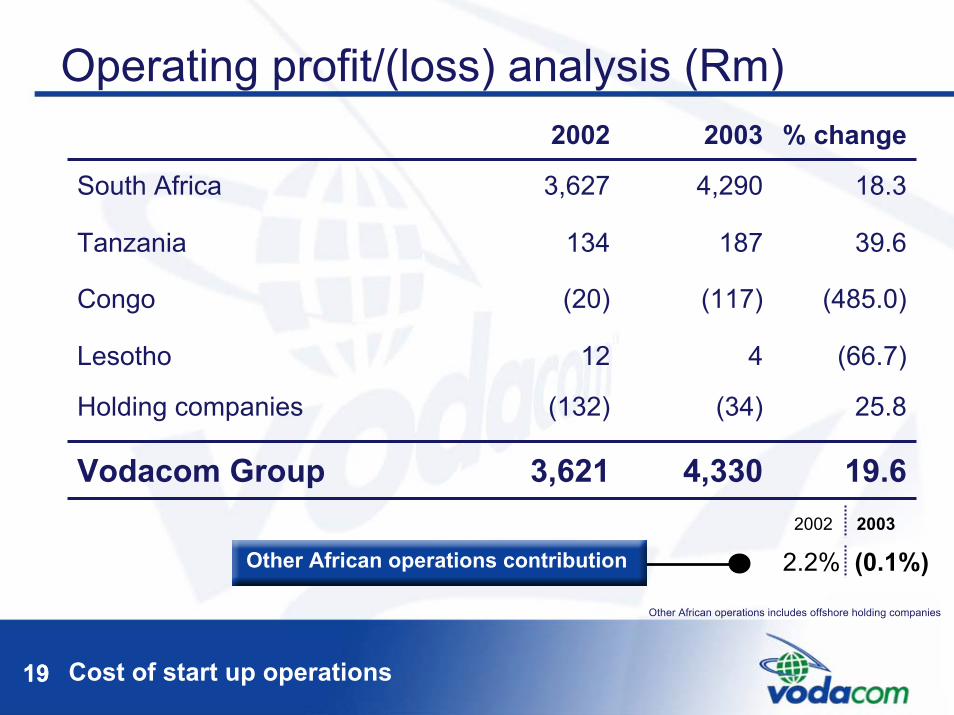
Cost of start up operations19
Operating profit/(loss) analysis (Rm)
(485.0)(117)(20)Congo
25.8(34)(132)Holding companies
19.64,3303,621Vodacom Group
(66.7)412Lesotho
39.6187134Tanzania
18.34,2903,627South Africa
% change20032002
2.2% (0.1%)2002 2003
RevenueOther African operations contribution
Other African operations includes offshore holding companies
19
African contribution growing20
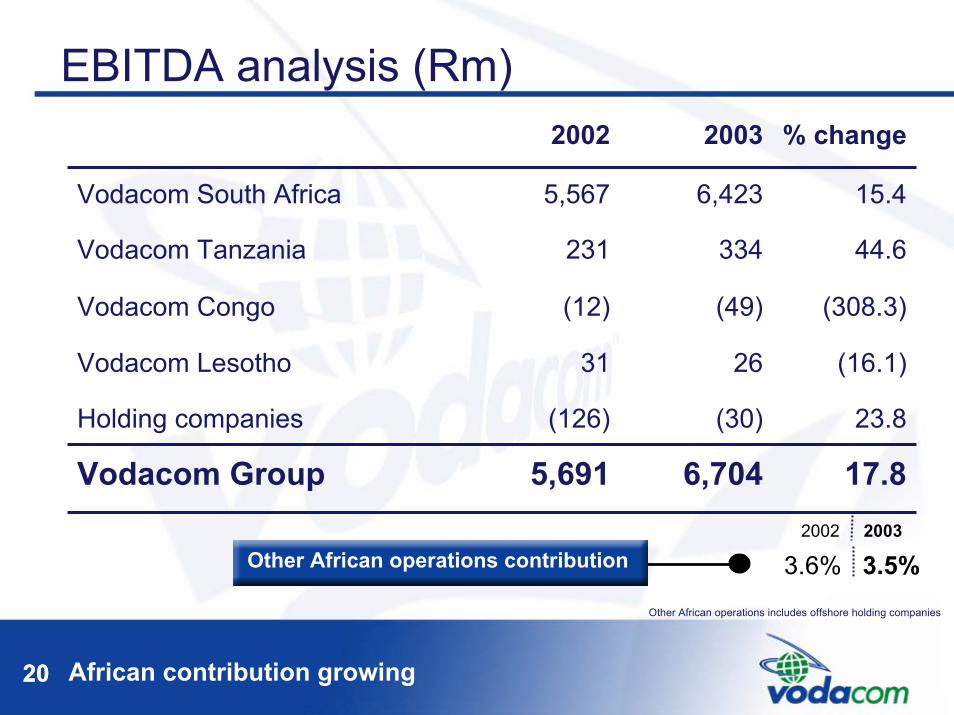
EBITDA analysis (Rm)
(308.3)(49)(12)Vodacom Congo
23.8(30)(126)Holding companies
17.86,7045,691Vodacom Group
(16.1)2631Vodacom Lesotho
44.6334231Vodacom Tanzania
15.46,4235,567Vodacom South Africa
% change20032002
3.6% 3.5%2002 2003
RevenueOther African operations contribution
Other African operations includes offshore holding companies
20
21
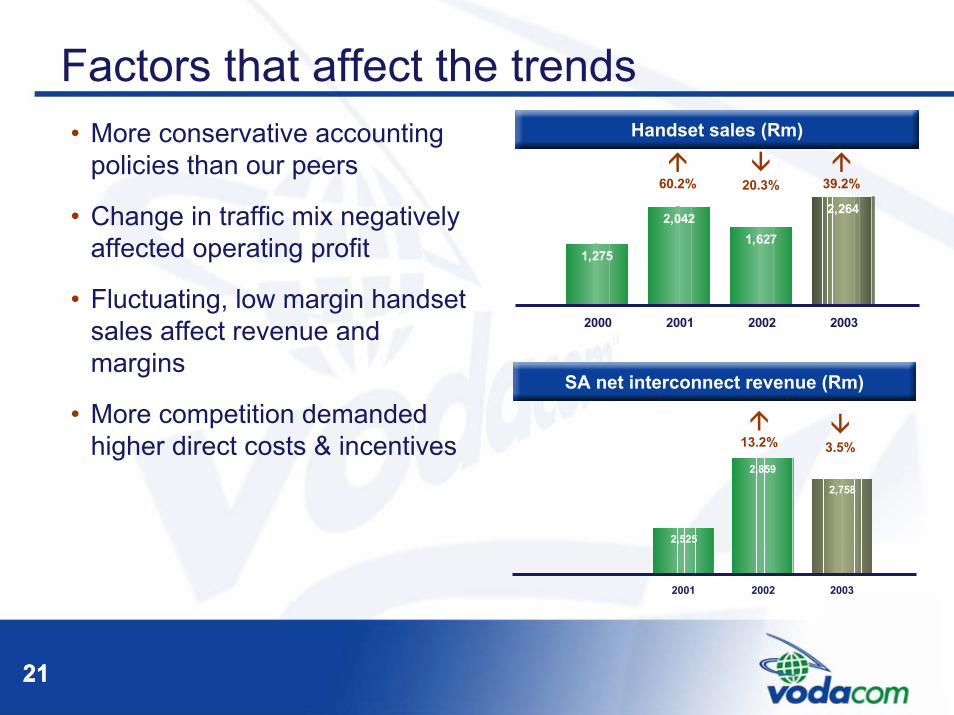
Factors that affect the trends
1,275
2,0422,264
1,627
2000 2001 2002 2003
60.2% 20.3% 39.2%
Handset sales (Rm)• More conservative accounting policies than our peers
• Change in traffic mix negatively affected operating profit
• Fluctuating, low margin handset sales affect revenue and margins
• More competition demanded higher direct costs & incentives
2,525
2,859
2,758
2001 2002 2003
SA net interconnect revenue (Rm)
3.5%13.2%
21
And sale of non-core businesses22
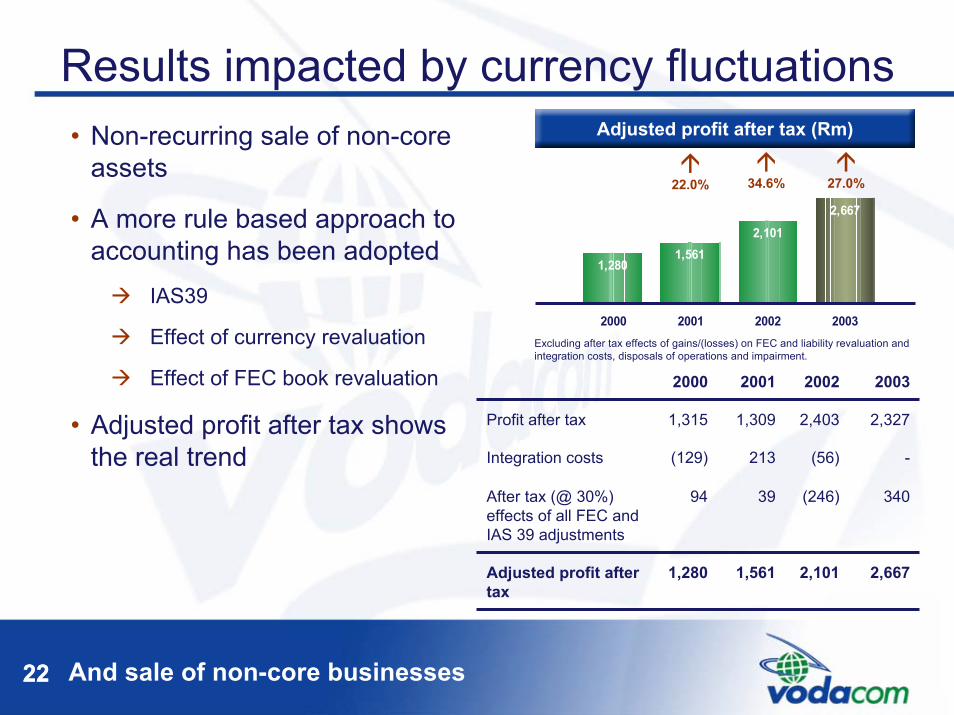
Results impacted by currency fluctuations
1,2801,561
2,6672,101
2000 2001 2002 2003Excluding after tax effects of gains/(losses) on FEC and liability revaluation and integration costs, disposals of operations and impairment.
22.0% 34.6% 27.0%
Adjusted profit after tax (Rm)• Non-recurring sale of non-core assets
• A more rule based approach to accounting has been adopted
IAS39
Effect of currency revaluation
Effect of FEC book revaluation
• Adjusted profit after tax shows the real trend
2,101
(246)
(56)
2,403
2002
1,561
39
213
1,309
2001
2,667
340
-
2,327
2003
1,280
94
(129)
1,315
2000
After tax (@ 30%) effects of all FEC and IAS 39 adjustments
Adjusted profit after tax
Integration costs
Profit after tax
22
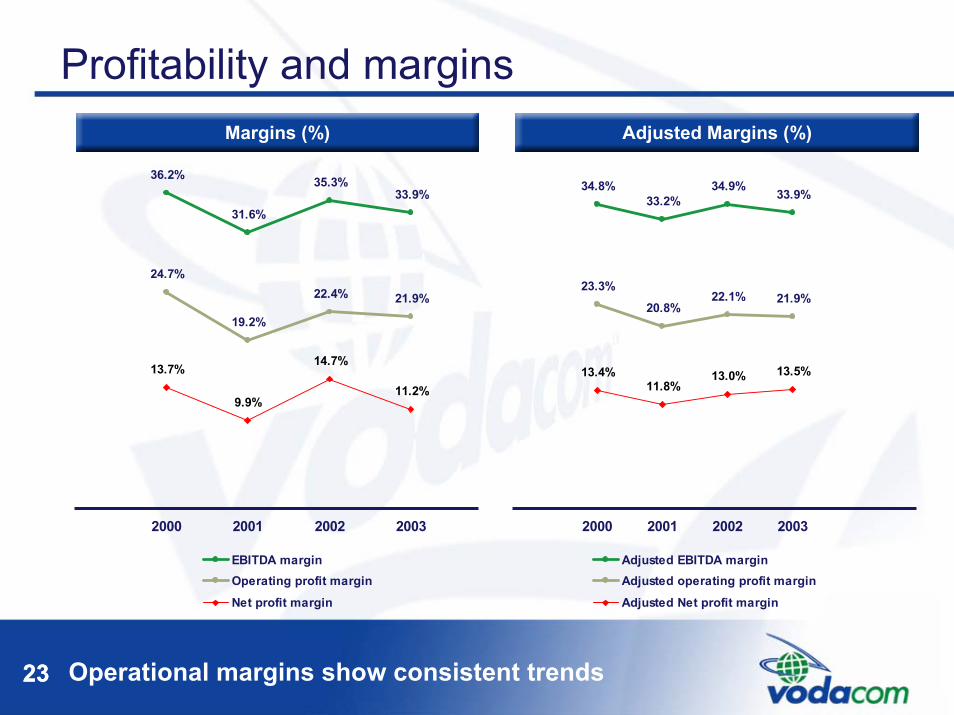
Operational margins show consistent trends23
Profitability and margins
33.9%
21.9%
13.7%
9.9%
14.7%
11.2%
36.2%
31.6%
35.3%
24.7%
19.2%
22.4%
2000 2001 2002 2003
EBITDA marginOperating profit marginNet profit margin
Margins (%)
33.9%
21.9%
13.4%11.8%
13.0% 13.5%
34.8%33.2%
34.9%
23.3%20.8%
22.1%
2000 2001 2002 2003
Adjusted EBITDA marginAdjusted operating profit marginAdjusted Net profit margin
Adjusted Margins (%)
23
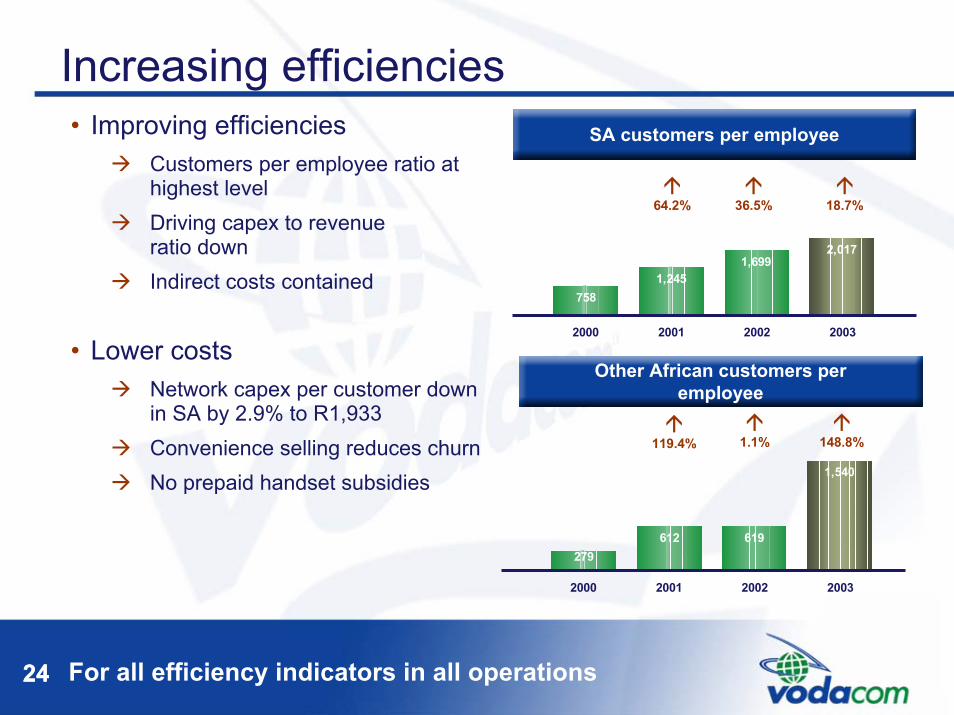
For all efficiency indicators in all operations24
Increasing efficiencies• Improving efficiencies
Customers per employee ratio at highest levelDriving capex to revenue ratio downIndirect costs contained
• Lower costsNetwork capex per customer down in SA by 2.9% to R1,933Convenience selling reduces churnNo prepaid handset subsidies
1,2451,699
2,017
758
2000 2001 2002 2003
64.2% 36.5% 18.7%
SA customers per employee
Other African customers per employee
612 619
1,540
279
2000 2001 2002 2003
119.4% 1.1% 148.8%
24

Increasing cashflow generation and low leverage25
Strong cashflows and balance sheetOperating cash flow (Rm) Net debt to EBITDA (%)
93.9%
63.1% 62.9%
34.2%
2000 2001 2002 2003
30.8% 0.2% 28.7%
3,182
4,664
6,721
6,188
2000 2001 2002 2003
46.6% 32.7% 8.6%
Net debt includes interest and non-interest bearing debt, shareholder loans, bank overdraft net of cash and cash equivalents.
187.9%
99.0%76.5%
36.0%
2000 2001 2002 2003Net debt includes interest and non-interest bearing debt, shareholder loans, bank overdraft net of cash and cash equivalents.
Net debt to net tangible assets (%)
88.9% 22.5% 40.5%
25
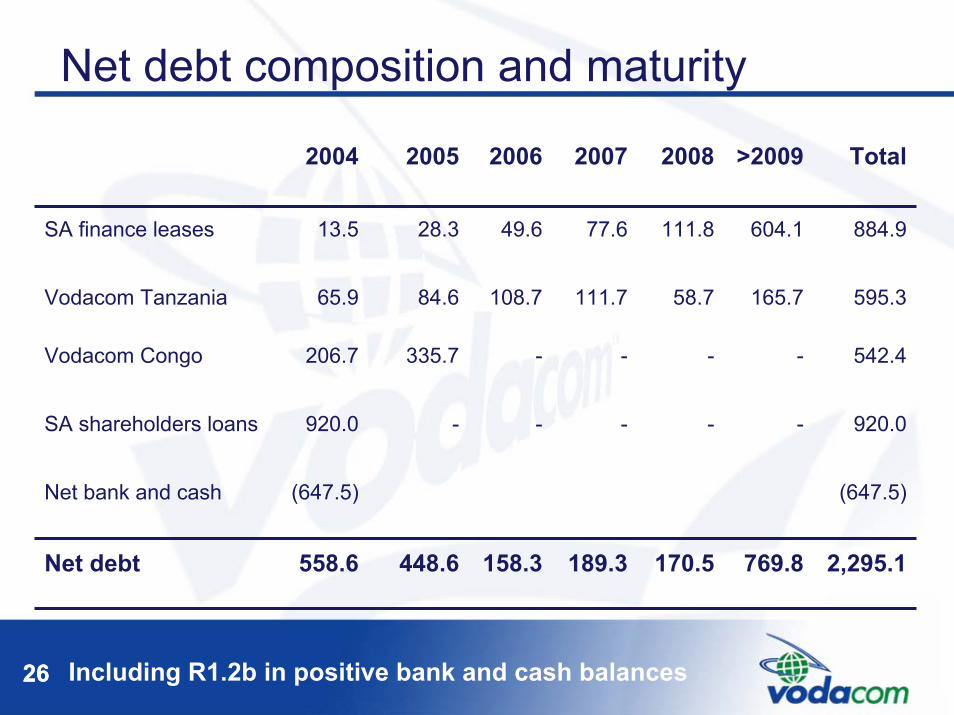
Including R1.2b in positive bank and cash balances26
Net debt composition and maturity
(647.5)(647.5)Net bank and cash
158.3
-
-
108.7
49.6
2006
448.6
-
335.7
84.6
28.3
2005
189.3
-
-
111.7
77.6
2007
558.6
920.0
206.7
65.9
13.5
2004
542.4--Vodacom Congo
2,295.1769.8170.5Net debt
920.0--SA shareholders loans
595.3165.758.7Vodacom Tanzania
884.9604.1111.8SA finance leases
Total>20092008
26
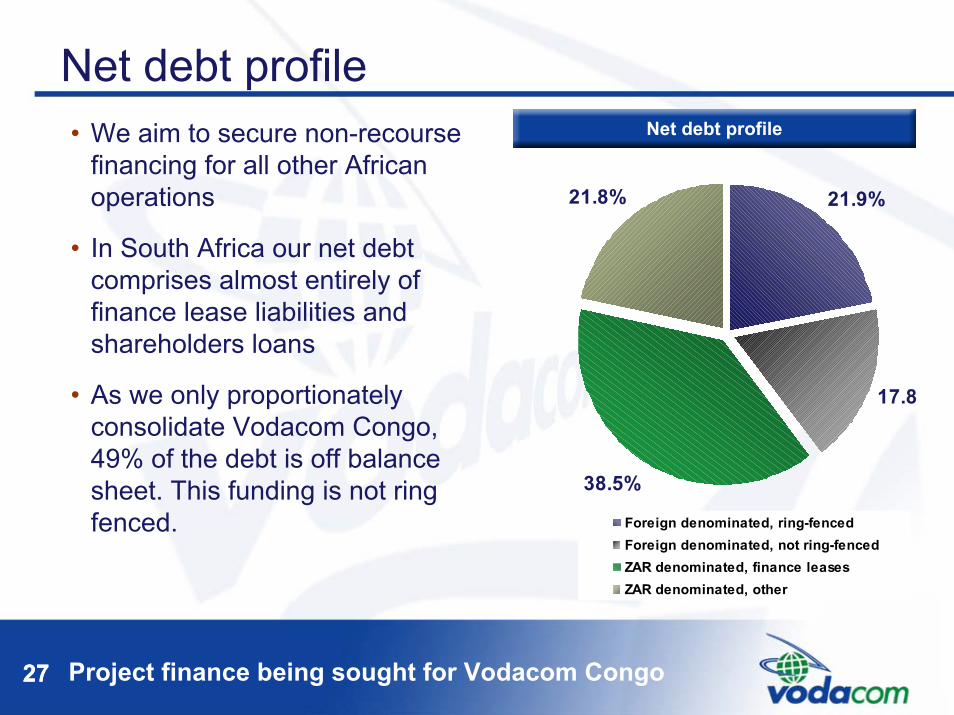
Project finance being sought for Vodacom Congo27
Net debt profile
17.8
38.5%
21.8% 21.9%
Foreign denominated, ring-fencedForeign denominated, not ring-fencedZAR denominated, finance leasesZAR denominated, other
Net debt profile• We aim to secure non-recourse financing for all other African operations
• In South Africa our net debt comprises almost entirely of finance lease liabilities and shareholders loans
• As we only proportionately consolidate Vodacom Congo, 49% of the debt is off balance sheet. This funding is not ring fenced.
27
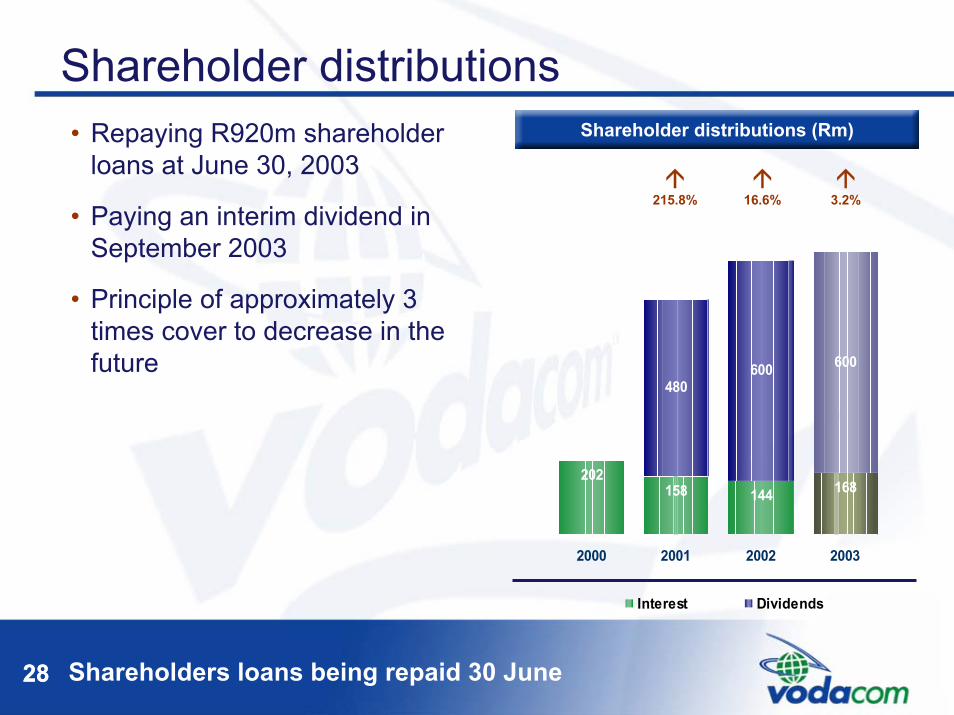
Shareholders loans being repaid 30 June28
Shareholder distributionsShareholder distributions (Rm)• Repaying R920m shareholder
loans at June 30, 2003
• Paying an interim dividend in September 2003
• Principle of approximately 3 times cover to decrease in the future
480600 600
144158202
168
2000 2001 2002 2003
Interest Dividends
215.8% 16.6% 3.2%
28
Questions?


