
Skewing: An Efficient Alternative to Lookahead for Decision Tree
Induction
David Page Soumya Ray
Department of Biostatistics and Medical Informatics
Department of Computer SciencesUniversity of Wisconsin, Madison
USA

Main Contribution
Greedy tree learning algorithms suffer from myopia
This is remedied by Lookahead, which is computationally very expensive
We present an approach to efficiently address the myopia of tree learners

Task Setting
Given: m examples of n Boolean attributes each, labeled according to a function f over some subset of the n attributes
Do: Learn the Boolean function f

TDIDT Algorithm
Top Down Induction of Decision TreesGreedy algorithmChooses feature that locally optimizes some
measure of “purity” of class labelsInformation GainGini Index

TDIDT Example
+110
−010
−101
+000
Valuex3x2x1
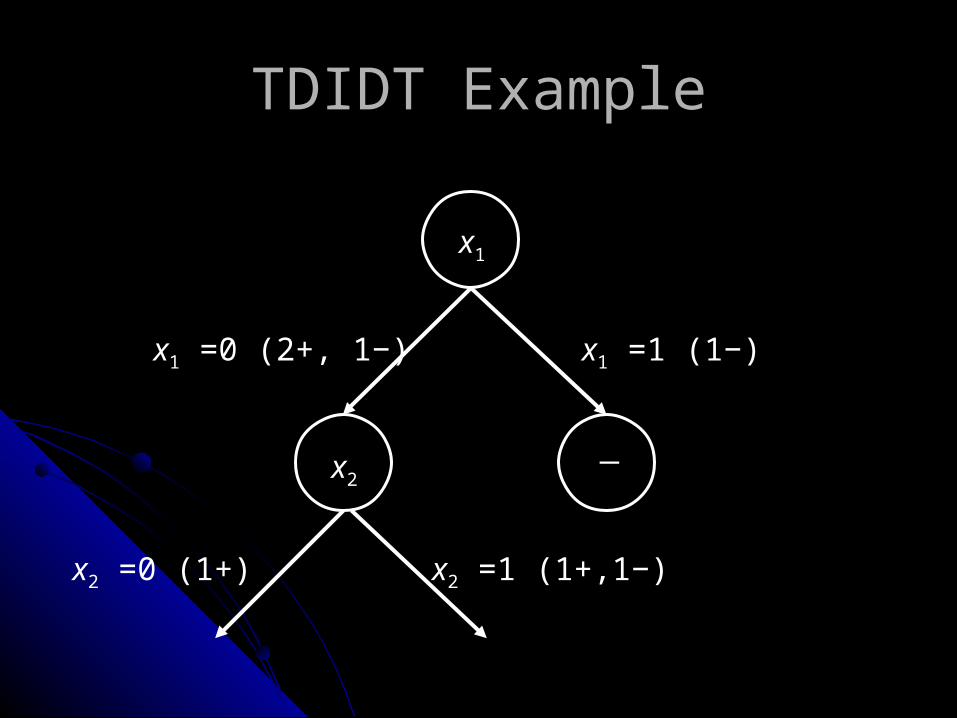
x1
x1 =0 (2+, 1−) x1 =1 (1−)
─
x2 =0 (1+) x2 =1 (1+,1−)
x2
TDIDT Example

Outline
Introduction to TDIDT algorithmMyopia and “Hard” FunctionsSkewingExperiments with Skewing AlgorithmSequential SkewingExperiments with Sequential SkewingConclusions and Future Work

Myopia and Correlation Immunity
For certain Boolean functions, no variable has “gain” according to standard purity measures (e.g., entropy, Gini)
No variable correlated with class
In cryptography, correlation immune
Given such a target function, every variable looks equally good (bad)
In an application, the learner will be unable to differentiate between relevant and irrelevant variables
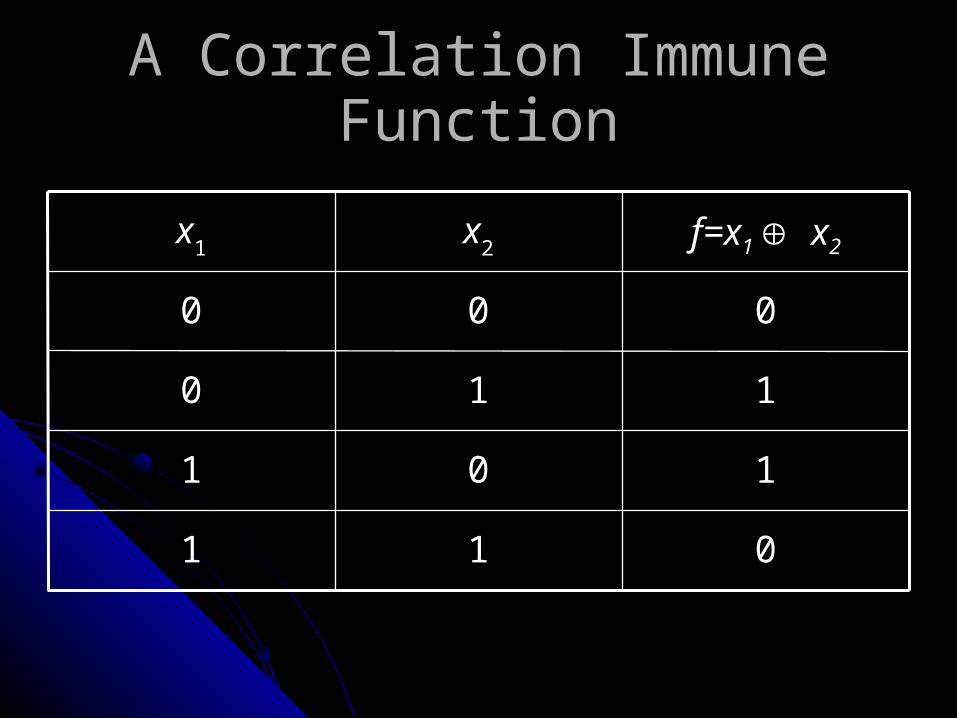
A Correlation Immune Function
f=x1 x2x2x1
011
101
110
000

Examples
In Drosophila, Survival is an exclusive-or function of Gender and the expression of the SxL gene
In drug binding (Ligand-Domain), binding may have an exclusive-or subfunction of Ligand Charge and Domain Charge

Learning Hard Functions
Standard method of learning hard functions with TDIDT: depth-k LookaheadO(mn2k+1-1) for m examples in n variables
Can we devise a technique that allows TDIDT algorithms to efficiently learn hard functions?

Key Idea
Correlation immune functions aren’t hard – if the data distribution is significantly
different from uniform

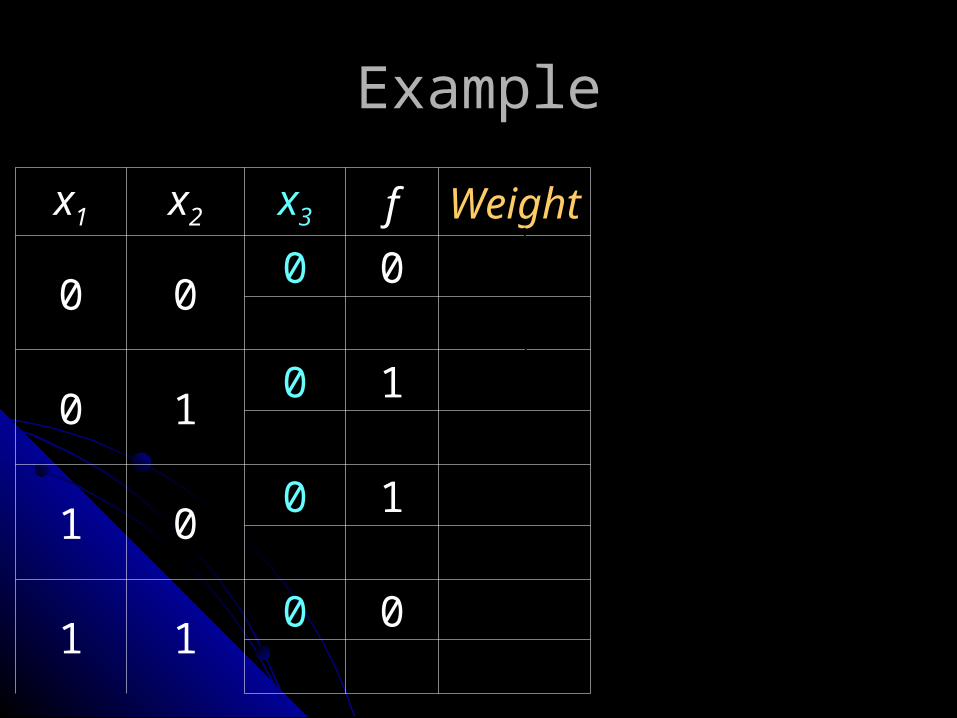
Example
Uniform distribution can be sampled by setting each variable (feature) independently of all others, with probability 0.5 of being set to 1
Consider a distribution where each variable has probability 0.75 of being set to 1.

Example
0)(
25.0)1;(
25.0)0;(
25.0)(
i
i
i
xGAIN
xfGINI
xfGINI
fGINI
x1 x2 x3 f
0 00
01
0 10
11
1 00
11
1 10
01

Example
x1 x2 x3 f Weight Sum
0 00
01
0 10
11
1 00
11
1 10
01
16
1
16
3
16
3
16
9
64
1
64
3
64
3
64
9
64
3
64
9
64
9
64
27

Example
256
6016
)33(
16
)91(
)(
fGINI
x1 x2 x3 f Sum
0 00
01
0 10
11
1 00
11
1 10
01
16
1
16
3
16
3
16
9

Example
256
48
4
3
4
1
16/4
16/3
16/4
16/1
)0;( 1
xfGINIx1 x2 x3 f Sum
0 00
01
0 10
11
16
1
16
3

Example
x1 x2 x3 f Sum
1 00
11
1 10
01
16
3
16
9 256
48
4
3
4
1
16/12
16/9
16/12
16/3
)1;( 1
xfGINI
Example
x1 x2 x3 f Weight
0 00 0
0 10 1
1 00 1
1 10 0
64
1
64
3
64
3
64
9
256
60
16
10
16
6
64/16
64/10
64/16
64/6
)0;( 3
xfGINI

Key Idea
Givena large enough sample anda second distribution sufficiently different from the
first,
we can learn functions that are hard for TDIDT algorithms under the original distribution.
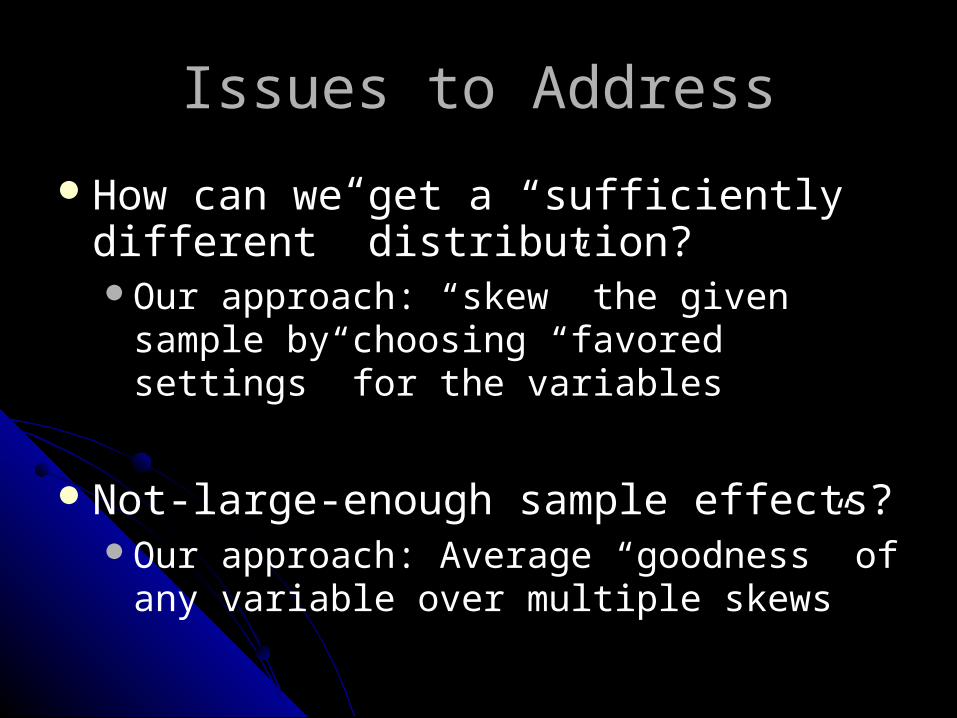
Issues to Address
How can we get a “sufficiently different” distribution?Our approach: “skew” the given sample by
choosing “favored settings” for the variables
Not-large-enough sample effects?Our approach: Average “goodness” of any variable
over multiple skews

Skewing Algorithm
For T trials doChoose a favored setting for each variableReweight the sampleCalculate entropy of each variable split under this
weightingFor each variable that has sufficient gain,
increment a counter
Split on the variable with the highest count

Experiments
ID3 vs. ID3 with Skewing (ID3 to avoid issues to do with parameters, pruning, etc.)
Synthetic Propositional Data Examples of 30 Boolean variables Target Boolean functions of 2-6 of these variables Randomly chosen targets and randomly chosen hard targets
UCI Datasets (Perlich et al, JMLR 2003) 10 fold cross validation Evaluation metric: Weighted Accuracy = average of accuracy over
positives and negatives

Results (3-variable Boolean functions)
75
80
85
90
95
100
200 400 600 800 1000
Acc
ura
cy
Sample Size
ID3, No SkewingID3 with Skewing
Random functions Hard functions
50
60
70
80
90
100
200 400 600 800 1000A
ccu
racy
Sam ple Size
ID3, No SkewingID3 with Skewing

Results (4-variable Boolean functions)
Random functions Hard functions
75
80
85
90
95
100
200 400 600 800 1000
Acc
ura
cy
Sample Size
ID3, No SkewingID3 with Skewing
50
60
70
80
90
100
200 400 600 800 1000A
ccu
racy
Sam ple Size
ID3, No SkewingID3 with Skewing

Results (5-variable Boolean functions)
Random functions Hard functions
75
80
85
90
95
100
200 400 600 800 1000
Acc
ura
cy
Sam ple Size
ID3, No SkewingID3 with Skewing
50
60
70
80
90
100
200 400 600 800 1000A
ccu
racy
Sam ple Size
ID3, No SkewingID3 with Skewing

Results (6-variable Boolean functions)
Random functions Hard functions
75
80
85
90
95
100
200 400 600 800 1000
Acc
ura
cy
Sam ple Size
ID3, No SkewingID3 with Skewing
50
60
70
80
90
100
200 400 600 800 1000A
ccu
racy
Sam ple Size
ID3, No SkewingID3 with Skewing

Current Shortcomings
Sensitive to noise, high-dimensional dataVery small signal on the hardest CI functions
(parity) given more than 3 relevant variablesOnly very small gains on real-world datasets
attempted so farFew correlation immune functions in practice?Noise, dimensionality, not enough examples?


