SIMULATION AND EXPERIMENT INVESTIGATION FOR PRODUCING BIODIESEL
USING BATCH REACTIVE DISTILLATION
A Thesis Submitted to the College of Engineering
of Al-Nahrain University in Partial Fulfillment of the Requirements for the Degree of
Master of Science in
Chemical Engineering
by SARAH RASHID GHAYYIB AL-KARKHI
B.Sc. in Chemical Engineering 2009
Jumada Al-UlaApril
1433 2012
Click t
o buy NOW!
PDF-XChange
ww
w.tracker-software.c
om Click t
o buy NOW!
PDF-XChange
ww
w.tracker-software
.com
Click t
o buy NOW!
PDF-XChange
ww
w.tracker-software.c
om Click t
o buy NOW!
PDF-XChange
ww
w.tracker-software
.com
I
Abstract Environmental pollution has raised the concern on the search for the
alternative energy sources. Biomass derived diesel fuel, termed biodiesel, can
replace petroleum- based diesel fuels. Environmental benefit of replacing fossil
fuels with biomass-based fuels is that the energy obtained from biomass does not
add to the level of carbon dioxide in the atmosphere that causes global warming.
The present work concerned with studying the performance of batch reactive
packed distillation to produce biodiesel (methyl oleate) by the reaction of methanol
and oleic acid using homogeneous catalysts H2SO4, experimentally and
theoretically.
The experiment work concerns with constructing a lab-scale packed reactive
distillation column which consists a heat resistance glass distillation column 42 cm
total height and 3.5 cm inside column diameter, packed with glass rashing rings of
10 mm length, 6 mm outside diameter, and 3 mm inside diameter at one atmosphere
pressure.
The effect of many parameters on conversion of oleic acid to biodiesel have
been studied such as molar ratio of methanol to oleic acid 4:1, 6:1 and 8:1, amount
of catalyst 0.6, 1.2 and 1.8 g sulfuric acid/g oleic acid, reaction time 36, 57 and 75
minutes, and reaction temperature 100oC, 120oC and 130oC in order to find the best
conditions to produce biodiesel (methyl oleate) with higher conversion by batch
reactive distillation.
The design of the experiment by the Taguchi method was considered for
performing the minimum numbers of experiments of (9). The best operating
conditions are MEOH/OLAC feed molar ratio 8:1, catalyst amount 1.2 g sulfuric
acid/g oleic acid, time of reaction 57 min and reaction temperature 130oC, these
conditions give oleic acid conversion of 93.5%. Also the results show that the molar
ratio of methanol to oleic acid is the most influential parameter on the conversion of
oleic acid, while the time has a less effect by comparing to other variables.
Click t
o buy NOW!
PDF-XChange
ww
w.tracker-software.c
om Click t
o buy NOW!
PDF-XChange
ww
w.tracker-software
.com
II
The properties of biodiesel (methyl oleate) such as viscosity, flash point, density
and carbon residue were measured experimentally and compared to those of ASTM
standard for biodiesel and petrol diesel. The comparison that gives methyl oleate
ester could be used as alternative diesel.
Theoretically, an equilibrium model (EQ) was simulated using MATLAB
(R2010a) to solve MESHR equations. UNIQUAC liquid phase activity coefficient
model is the most appropriate model to describe the non ideality of OLAC-MEOH-
MEOL-H2O system. The chemical reactions rates results from EQ model indicating
the rates are controlled by chemical kinetics.
The equilibrium model results were compared with the results of the
experimental work which gives the model the ability to predict the result of
experiment performed with the same parameters of experimental work. Also the
equilibrium model was checked with previous experimental work, the model still
gives a nearly quantitative accurate prediction of the conversions. The best of fit of
the experimental results to theoretical equilibrium model was assessed by
comparing the experimental conversion of oleic acid with the theoretical
equilibrium model conversion of oleic acid, also good linear regression between
experimental and theoretical results according to linear correlation coefficient r and
multiple coefficient of determination R2 for the best operating conditions are 0.9697
and 0.9381 respectively, with percentage error of 2.5333%.
Click t
o buy NOW!
PDF-XChange
ww
w.tracker-software.c
om Click t
o buy NOW!
PDF-XChange
ww
w.tracker-software
.com
III
List of Contents Content Page
Abstract
I
List of Contents III Notations VII List of Tables XI List of Figures XIV Chapter One : Introduction 1 1.1 Introduction 1 1.2 Aim of the Present Work 6 Chapter Two : Literature Survey 7 2.1 Introduction 7 2.2 Chemical Building Blocks 8 2.3 Biodiesel Production 11 2.3.1 Transesterification Process 12 2.3.2 Esterification Process 17 2.3.3 Two Step Process 25 2.4 Characterization of Biodiesel 28 2.4.1 Physical Characterization 28 2.4.2 Chemical Characterization 30 2.5 Experimental Design 32 2.6 Reactive Distillation Development for Biodiesel Production 33 2.7 Literature Review of RD for Biodiesel Production 35 2.7.1 Continuous Reactive Distillation (CRD) for Biodiesel
Production 35
2.7.2 Batch Reactive Distillation (BRD) for Esterification Reaction
39
2.8 Thermodynamic Models 40 2.8.1 Ideal Vapor Liquid Equilibrium 41 2.8.2 Non Ideal Vapor Liquid Equilibrium 41 2.8.2.1 Fugacity Coefficient Model 42 2.8.2.2 Activity Coefficient Model 44 2.8.3 Enthalpy Calculation 47 2.9 Equilibrium Model 48 2.10 Hold up 51 Chapter Three : Theoretical Aspects 52 3.1 Introduction 52 3.2 Simulation of Equilibrium Model 52 3.2.1 Equilibrium Model Assumptions 52 3.2.2 Equilibrium Model Equations 53
Click t
o buy NOW!
PDF-XChange
ww
w.tracker-software.c
om Click t
o buy NOW!
PDF-XChange
ww
w.tracker-software
.com
IV
3.2.3 Estimation of Equilibrium Model Parameters 56 3.2.3.1 Vapor-Liquid Equilibrium Relation 56 3.2.3.1.1 Vapor Fugacity Coefficient 56 3.2.3.1.2 Liquid Activity Coefficient 58 3.2.3.2 Enthalpy Calculation 60 3.2.3.3 Vapor Pressure Calculation 61 3.2.3.4 Bubble Point Calculation 62 3.2.3.5 Holdup Calculation 62 3.2.3.6 Physical Properties 63 3.2.4 Rigorous Method Algorithm for Batch Distillation
with Chemical Reaction 63
3.2.5 Solution Procedure of the Equilibrium Model 66 Chapter Four : Experimental Work 67 4.1 Introduction 67 4.2 Materials 67 4.3 Bench Experiment 68 4.4 Reactive Distillation unit Description 69 4.4.1 Still Pot 70 4.4.2 The Main Column 71 4.4.3 The Condenser 71 4.5 Experimental Measurements 72 4.5.1 Temperature Measurements 72 4.5.2 Composition Measurements 72 4.5.3 Other Measurements 73 4.5.3.1 Acid value by Titration 73 4.5.3.2 Analysis by Fourier Transforms Infrared spectroscopy (FT-
IR) 74
4.5.3.3 Flash Point Analyzer 74 4.5.3.4 Viscosity Testing 75 4.5.3.5 Density 76 4.5.3.6 Carbon Residue 76 4.6 Operating Procedure 77 4.7 Experimental Procedure 77 4.7.1 Experimental Variables 78 4.7.2 Taguchi Method 79 Chapter Five : Results and Discussions 81 5.1 Introduction 81 5.2 Results of Bench Experiment 81 5.3 Analysis by the Taguchi Method 82 5.4 Methods of Analysis 83 5.5 Results of Experimental Batch Reactive Distillation Unit 84 5.5.1 Effect of Molar Ratio 84 5.5.2 Effect of Catalyst Amount 85 5.5.3 Effect of Reaction Time 86
Click t
o buy NOW!
PDF-XChange
ww
w.tracker-software.c
om Click t
o buy NOW!
PDF-XChange
ww
w.tracker-software
.com
V
5.5.4 Effect of Reaction Temperature 87 5.6 Determination of Percentage Contribution of Individual Variables 89
5.7 Determination of Best Experimental Condition by the Taguchi Method
92
5.8 Results Physical Properties of the Biodiesel 94 5.8.1 Density 95 5.8.2 Kinematic Viscosity 95 5.8.3 Flash Point 98 5.8.4 Carbon Residue 99 5.9 Results of FTIR 100 5.10 Theoretical Results 101 5.10.1 Calculation of Vapor Fugacity Coefficient 101 5.10.2 Selection of Activity Coefficient Model 101 5.10.3 Checking the Validity of the Unsteady State Equilibrium
Model 103
5.11 Comparison of Experimental and Equilibrium Model Results 105 5.12 Rate of Reaction 116 Chapter Six: Conclusions and Recommendations 119 6.1 Conclusions 119 6.2 Recommendations for the Future Work 120 References 122 Appendixes Appendix A: Parameter of Activity Coefficient Model A-1 Appendix B: Equilibrium model properties B-1 Appendix C: Experimental Calibration C-1 Appendix D: Fugacity and Activity Coefficients Programs D-1 Appendix E: Results of Activity Coefficient models E-1 Appendix F: Experimental and Theoretical Results F-1 Appendix G: Statistical Analysis G-1
Click t
o buy NOW!
PDF-XChange
ww
w.tracker-software.c
om Click t
o buy NOW!
PDF-XChange
ww
w.tracker-software
.com
VI
Notations Symbols Notation Unit
ija
Parameter for the interaction between components of the NRTL equation (3.36)
-
pa Packing surface area m2/m3 iA Mass percentage of FFA and FFME equations
(2.11) and (2.12)
A Constant - AV Acid value equation (4.2)
FFA
KOH
gmg
ijB Parameter of the NRTL equation (3.36) - B Constant -
ijc Parameter of the NRTL equation (3.36) - C Constant - CI Cetane index equation (2.13) - CN Cetane number equation (2.14) min
LCP Specific heat of liquid J/kgmol.K VCP Specific heat of vapor J/kgmol.K
pD Out side diameter of packing cm D Constant - D Number of double bonds equation (2.12) - E Constant -
ijG Parameter of the NRTL equation (3.34) - ih Enthalpy of component i J/kgmol Lh Total enthalpy of liquid phase J/kgmol Vh Total enthalpy of vapor phase J/kgmol Lh Liquid hold up in Packing equation (2.46) m2liquid/m3bed
volume mixH heat of mixing J/kgmol
orH Standard heats of reaction equation (2.37) J/kgmol rH Heats of reaction equation (2.39) J/kgmol
HETP Height equivalent to theoretical plates equation (C.2)
ft
HHV Higher heating value equation (2.10) MJ/kg HV Heating value equation (2.10) MJ/kg IV Iodine Value (% iodine absorbed) equation (2.12)
sample
iodine
gcg
L Liquid flow rate kgmol/hr L Length of wire burned equation (2.9) cm
Click t
o buy NOW!
PDF-XChange
ww
w.tracker-software.c
om Click t
o buy NOW!
PDF-XChange
ww
w.tracker-software
.com

VII
LN Lubricity number - catM Mass of catalyst g
wiM Molecular weight kg/kgmol TN Number of stages - cN Number of components -
P Pressure Pa oP Vapor presure Pa cP Critical pressure Pa
rP Reduced pressure - Q Heat duty Watt
iq Area parameter of component i in UNIQUAC and UNIFAC models
-
R Gas constant = 8.314 Kkgmol
mPa.
. 3
FFAR Reaction rate equation (3.4) min.L
gmol
R2 Coefficient of Multiple determination - r Linear correlation coefficient for sample - ir Volume parameter of component i in UNIQUAC
and UNIFAC models -
SV Saponification value equation (2.11) FFA
KOH
gmg
se The standard error of estimate - T Temperature K
cT Critical temperature K refT Reference temperature K
rT Reduce temperature - t flow time sec iju Parameter of interaction between component i and
j in UNIQUAC model cal/mol
KOHV Volume of KOH solution consumed from titration ml V Titration volume equation (2.9) ml V Vapor flow rate kgmol/hr
catW Weight of sulfuric acid g W Weight of liquid sample equation (2.9) g
ix Liquid mole fraction -
iy Vapor mol fraction - Z Compressibility factor - z Coordinate number =10 in NRTL model -
Click t
o buy NOW!
PDF-XChange
ww
w.tracker-software.c
om Click t
o buy NOW!
PDF-XChange
ww
w.tracker-software
.com
VIII
Greek Letters kinematic viscosity at 40°C cSt
i Fugacity coefficient of component i in mixture -
i Volume fraction of component i in UNIQUAC model equation (3.39)
-
i area fraction of component i in UNIQUAC model equation (3.39)
-
i Activity coefficient of component i in mixture - Ci
Combinatorial part of activity coefficient of component i
-
Ri
Residual part of activity coefficient of component i
-
Wilson model parameter - ij nonrandomness parameter (NRTL parameter) –
Empirical Constant -
Liquid molar density kgmol/m3
Click t
o buy NOW!
PDF-XChange
ww
w.tracker-software.c
om Click t
o buy NOW!
PDF-XChange
ww
w.tracker-software
.com
IX
Abbreviations
ASTM American Standards of Testing Material B100 Pure Biodiesel
B1 Blend (1% biodiesel, 99% petroleum diesel) B20 Blend (20% biodiesel and80% petroleum diesel BRD Batch Reactive Distillation CRD Continuous Reactive Distillation CFD Computational Fluid Dynamics DG Diglycerides E10 Blend (5%-10% ethanol and 90%-95% gasoline) E85 Blend (85% ethanol and 15% gasoline) EOS Equation of State EQ Equilibrium Model
GC Gas Chromatography GL Glycerol FA Fatty Aacid
FFA Free Fatty Acid FAME Fatty Acid Methyl ester FTIR Fourier Transforms Infrared spectroscopy HC Hydrocarbon
HPLC High Pressure Liquid Chromatography MAD Mean Absolute Deviation
MEOH Methanol MEOL Methyl Oleate
MESHR Material Equilibrium Summation Enthalpy Reaction Equations MG Monoglycerides
nPAH Nitrated polycyclic aromatic hydrocarbons PAH polycyclic aromatic hydrocarbons
OLAC Oleic Acid RD Reactive Distillation TG Triglycerides
VLQ Vapor Liquid Equilibrium WVO Waste Vegetable Oil
Click t
o buy NOW!
PDF-XChange
ww
w.tracker-software.c
om Click t
o buy NOW!
PDF-XChange
ww
w.tracker-software
.com

X
List of Tables Table Title Page
(1.1)
Petroleum Diesel vs. Biodiesel
2
(2.1) Summary of transesterification process from previous studies
14
(2.2) Summary of esterification process from previous studies 19 (2.3) Summary of two step process from previous studies 26 (2.4) Equations of fugacity coefficient methods 42 (2.5) Design data for Rashing Ring Glass packing 51 (4.1) Design experiments, with four parameters at-three level,
for the production of methyl oleate (Biodiesel) 79
(4.2) Orthogonal array used to design experiments with four parameters at three-levels, L-9(34)
80
(5.1) Results of Bench Experiment 81 (5.2) Biodiesel conversion for each experiments 90 (5.3) Conversions of oleic acid and S/N ratios for the nine
sets of experiments 90
(5.4) Mean S/N ratio at a given level 90 (5.5) The difference between two levels 91 (5.6) The distribution of the four influential parameters 91 (5.7) Density of the experimental results measured 95 (5.8) Viscosity of the experimental results measured at 40oC 96 (5.9) Flash points of the biodiesel from some experiments in
this study 99
(5.10) Fugacity Coefficient by Redlich/Kowng Cubic Equation of state Results
101
(5.11) Fugacity Coefficient by Peng-Robinson cubic equation of state Results
101
(5.12) Comparison between Experimental and Predicted Boiling Points
102
(5-13) The comparison of experimental and equilibrium model results
104
(5.14) The comparison of experimental Kusmiyati et. al. (2010) and developed equilibrium model of oleic acid conversion
105
(5.15) Statistical analysis in the correlation between the % conversion of experimental and theoretical equilibrium model
115
(5.16) The comparison between experimental and theoretical equilibrium model conversion results
115
(A.1) NRTL parameters for the binary pairs of components in the reactive mixtures
A-1
Click t
o buy NOW!
PDF-XChange
ww
w.tracker-software.c
om Click t
o buy NOW!
PDF-XChange
ww
w.tracker-software
.com
XI
(A.2) UNIQUAC parameters for the oleic acid – methanol – methyl oleate – water mixture, cal/mol
A-1
(A.3) Structure, Molecular Formula and Group Number for Each Component
A-2
(A.4) Group Parameters for Each Component A-2 (A.5) Group Interaction Parameter mka in (K-1) A-2 (B.1) Heat Capacity Constants in Vapor Phase in J/kgmol.K B-1 (B.2) Heat Capacity Constants in liquid Phase in J/kgmol.K B-1 (B.3) Some Physical Properties B-1 (B.4) Heat of Vaporization Coefficient in kJ/kgmol B-2 (B.5) Dinsity Constants of liquid Phase in kgmol/m3 B-2 (B.6) Critical Properties B-2 (B.7) Vapor pressure Coefficient B-2 (E.1) Comparison of Methods of Activity Coefficient E-1 (E.2) VLQ Data for OLAC-MEOH-MEOL-Water System at 1
atm for UNIQUAC Method E-4
(E-3) VLQ Data for OLAC-MEOH-MEOL-Water System at 1 atm, for UNIFAC Method
E-5
(E.4) VLQ Data for OLAC-MEOH-MEOL-Water System at 1 atm, for NRTL Method
E-6
(F.1) Experiments Results by titration F-1 (F.2) % Weight of organic phase by GC F-2 (F.3) %Weight and %mole of organic phase by titration F-3 (F.4) Comparison between %weight from experimental and
empirical equation of Parthiban et. al., (2011) F-4
(F.5) Comparison between %weight from GC, Titration and empirical equation of Felizardo et. al., (2006)
F-5
(F.6) Results of changing the molar ratio on the % conversion of oleic acid
F-5
(F.7) Results of changing the catalyst amount on the % conversion of oleic acid
F-6
(F.8) Results of changing the time on the % conversion of oleic acid
F-6
(F-9) Results of changing the reaction temperature on the % conversion of oleic acid
F-7
(F.10) Effect of molar ratio on biodiesel (methyl oleate) viscosities
F-7
(F.11) Effect of catalyst amount on biodiesel (methyl oleate) viscosities
F-8
(F.12) Effect of time on biodiesel (methyl oleate) viscosities F-8 (F.13) Effect of reaction temperature on biodiesel (methyl
oleate) viscosities F-9
(F.14) Initial mole fractions to equilibrium model F-9 (F.15) Operating Conditions for Proposed EQ Program F-9
Click t
o buy NOW!
PDF-XChange
ww
w.tracker-software.c
om Click t
o buy NOW!
PDF-XChange
ww
w.tracker-software
.com
XII
(F.16) Theoretical Results of Equilibrium Model F-10 (F.17) Comparison of % Conversion of oleic acid for
experimental and theoretical equilibrium model F-11
(F.18) Comparison of % conversion of oleic acid for experimental and theoretical equilibrium model
F-12
(F.19) Effect of catalyst amount on rate of reaction and conversion
F-12
(F.20) Effect of molar ratio on rate of reaction and conversion F-13 (F.21) Effect of time on rate of reaction and conversion F-13 (F.22) Effect of reaction temperature on rate of reaction and
conversion F-14
Click t
o buy NOW!
PDF-XChange
ww
w.tracker-software.c
om Click t
o buy NOW!
PDF-XChange
ww
w.tracker-software
.com

XIII
List of Figures Figure Title page
(1.1)
Life cycle of diesel vs. biodiesel as an environmentally friendly fuel. The CO2 cycle is closed for biodiesel but not for diesel.
3
(1.2) Biodiesel vs. petroleum diesel emissions. 4 (1.3) Comparison of CO2 emissions for most common fuels. 4 (2.1) Molecular structure of an idealized fatty acid. 8 (2.2) Molecular structure of soap. 8 (2.3) Molecular structure of glycerol. 9 (2.4) Molecular structure of methanol, ethanol, 1-propanol,
and 1-butanol. 9
(2.5) Biodiesel molecules. Above is a methyl ester; below, an ethyl ester.
9
(2.6) Molecular structure of triglyceride. 10 (2.7) Cetane molecules at the top and at the bottom ethyl ester 10 (2.8) (a) The schematics of the M-ROCLE test apparatus;
(b) Actual contact between the test roller and the cylinder.
30
(2.9) Comparison of Batch Process and Reactive Distillation. 34
(2.10) Schematic of each theoretical stage along the reactive distillation column.
49
(3.1) Schematic Diagram of EQ Segment. 53 (4.1) Apparatuses illustrated Bench Experiment. 68 (4.2) Flow Diagram of Experimental Plant. 69 (4.3) General view of the main experimental RD. 70 (4.4) Glass rashing ring. 71 (4.5) Open cup flash point. 75 (4.6) Closed cup flash point. 75 (4.7) Water bath. 76 (4.8) Viscosity testing. 76 (4-9) Density testing. 76 (5.1) Comparison between %weight from GC, titration and
empirical equation of Felizardo et. al., (2006). 83
(5.2) Effect of molar ratio on the conversion (main effects). 85 (5.3) Effect of catalyst amount on the conversion (main
effects). 86
(5.4) Effect of time on the conversion (main effects). 87 (5.5) Effect of reaction temperature on the conversion (main
effects). 88
(5.6) Effect of changing the temperature on color of product. 88
Click t
o buy NOW!
PDF-XChange
ww
w.tracker-software.c
om Click t
o buy NOW!
PDF-XChange
ww
w.tracker-software
.com
XIV
(5.7) Percentage contribution of individual variables on variation in oleic acid conversion.
91
(5.8) The effect of Molar ratio (OLAC/MEOH) at different levels on the S/N ratio.
92
(5.9) The effect of Catalyst Amount (g sulfuric acid/g oleic acid) at different levels on the S/N ratio.
93
(5.10) The effect of Time (min) at different levels on the S/N ratio.
93
(5.11) The effect of Reaction Temperature (oC) at different levels on the S/N ratio.
94
(5.12) Effect of reaction temperature on biodiesel kinematics viscosity.
96
(5.13) Effect of Molar ratio on biodiesel kinematics viscosity 97 (5.14) Effect of catalyst amount on biodiesel kinematics
viscosity. 97
(5.15) Effect of time of reaction on biodiesel (methyl oleate) kinematics viscosity.
98
(5.16) FT-IR spectrum of produced methyl oleate (Biodiesel). 100 (5.17) Comparison between Experimental and Predicted
Boiling Points. 103
(5.18) Plot for the EQ model validation. 104 (5.19) Experimental and theoretical equilibrium model results
for composition Profile in the still, molar ratio 4:1, catalyst amount 0.6, 36 min, 100oC
106
(5.20) Experimental and theoretical equilibrium model results for composition Profile in the still, molar ratio 4:1, catalyst amount 1.2, 57 min, 120oC.
106
(5.21) Experimental and theoretical equilibrium model results for composition Profile in the still, molar ratio 4:1, catalyst amount 1.8, 75 min, 130oC.
107
(5.22) Experimental and theoretical equilibrium model results for composition Profile in the still, molar ratio 6:1, catalyst amount 0.6, 57 min, 130oC.
107
(5.23) Experimental and theoretical equilibrium model results for composition Profile in the still, molar ratio 6:1, catalyst amount 1.2, 75 min, 100oC.
108
(5.24) Experimental and theoretical equilibrium model results for composition Profile in the still, molar ratio 6:1, catalyst amount 1.8, 36 min, 120oC.
108
(5.25) Experimental and theoretical equilibrium model results for composition Profile in the still, molar ratio 8:1, catalyst amount 0.6, 75 min, 120oC.
109
(5.26) Experimental and theoretical equilibrium model results for composition Profile in the still, molar ratio 8:1, catalyst amount 1.2, 36 min, 130oC.
109
Click t
o buy NOW!
PDF-XChange
ww
w.tracker-software.c
om Click t
o buy NOW!
PDF-XChange
ww
w.tracker-software
.com

XV
(5.27) Experimental and theoretical equilibrium model results for composition Profile in the still, molar ratio 8:1, catalyst amount 1.8, 57 min, 100oC.
110
(5.28) Experimental and theoretical equilibrium model results for composition Profile in the still, molar ratio 8:1, catalyst amount 1.2, 57 min, 130oC.
110
(5.29) % Conversion profile for experimental and theoretical equilibrium model Experiment 1.
111
(5.30) % Conversion profile for experimental and theoretical equilibrium model Experiment 2.
111
(5.31) % Conversion profile for experimental and theoretical equilibrium model Experiment 3.
112
(5.32) % Conversion profile for experimental and theoretical equilibrium model Experiment 4.
112
(5.33) % Conversion profile for experimental and theoretical equilibrium model Experiment 5.
112
(5.34) % Conversion profile for experimental and theoretical equilibrium model Experiment 6
113
(5.35) % Conversion profile for experimental and theoretical equilibrium model Experiment 7.
113
(5.36) % Conversion profile for experimental and theoretical equilibrium model Experiment 8.
113
(5.37) % Conversion profile for experimental and theoretical equilibrium model Experiment 9.
114
(5.38) % Conversion profile for experimental and theoretical equilibrium model Best Experiment.
114
(5.39) Effect of catalyst amount on average rate of esterification reaction.
116
(5.40) Effect of molar ratio on average rate of esterification reaction.
117
(5.41) Effect of Time on rate of esterification reaction, Best Experiment.
117
(5.42) Effect of time on average rate of esterification reaction 118 (5.43) Effect of reaction temperature on average rate of
esterification reaction. 118
(E.1) Activity Coefficient of oleic acid at different methods vs. Temperature.
E-2
(E.2) Activity Coefficient of methanol at different methods vs. Temperature.
E-2
(E.3) Activity Coefficient of methyl oleate at different. methods vs. Temperature
E-3
(E.4) Activity Coefficient of water at different methods vs. Temperature
E-3
(G.1) True line (predicted line) and an observed data point G-1
Click t
o buy NOW!
PDF-XChange
ww
w.tracker-software.c
om Click t
o buy NOW!
PDF-XChange
ww
w.tracker-software
.com
XVI
(G.2) Coefficient of Multiple determination R2 G-2 (G.3) Linear curve fitting of the conversion of equilibrium
model and experimental, Experiment 1 G-4
(G.4) Linear curve fitting of the conversion of equilibrium model and experimental, Experiment 2
G-4
(G.5) Linear curve fitting of the conversion of equilibrium model and experimental, Experiment 3
G-5
(G.6) Linear curve fitting of the conversion of equilibrium model and experimental, Experiment 4
G-5
(G.7) Linear curve fitting of the conversion of equilibrium model and experimental, Experiment 5
G-5
(G.8) Linear curve fitting of the conversion of equilibrium model and experimental, Experiment 6
G-6
(G.9) Linear curve fitting of the conversion of equilibrium model and experimental, Experiment 7
G-6
(G.10) Linear curve fitting of the conversion of equilibrium model and experimental, Experiment 8
G-6
(G.11) Linear curve fitting of the conversion of equilibrium model and experimental, Experiment 9
G-7
(G.12) Linear curve fitting of the conversion of equilibrium model and experimental, Best Experiment
G-7
Click t
o buy NOW!
PDF-XChange
ww
w.tracker-software.c
om Click t
o buy NOW!
PDF-XChange
ww
w.tracker-software
.com
Chapter OneIntroduction
1.1 Introduction
Biomass derived diesel fuel, termed biodiesel, can replace petroleum based
diesel fuels. Environmental pollution and diminishing of fossil fuels reserves has
raised the concern on the search for the alternative energy sources. Among the
available alternative energy sources, biodiesel has drawn significant attention since
it holds various advantages compared with fossil fuel in terms of renewability, non-
toxicity, better lubricant and biodegradability characteristic. Also, biodiesel has
high cetane number and low sulfur content, hence it will prolong the machine’s
lifetime (Boucher et. al. 2008, Kiss 2008 and Budiman 2009).
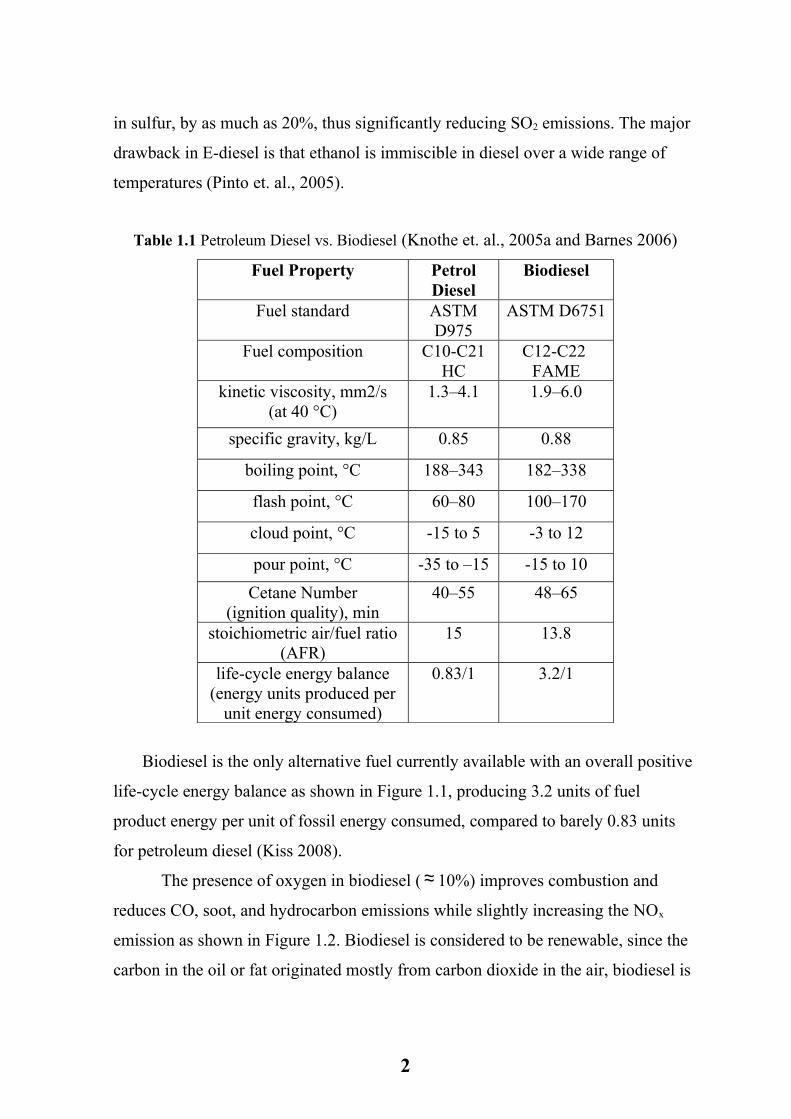
Despite the chemical differences of biodiesel and diesel fuels, these two fuels
have similar properties and performance parameters Table 1.1 (Knothe et. al., 2005a
and Barnes 2006). An important characteristic of diesel fuels is the ability to
autoignite, quantified by the cetane number (cetane index). Biodiesel has a higher
cetane number and flash point than petroleum diesel Table 1.1, this means that it
has better and safer performance.
Along with its technical advantages over petroleum diesel, biodiesel brings
several additional benefits to the society: rural revitalization, creation of new jobs,
and less global warming.
Blends of biodiesel and petroleum diesel are designated by a “B” followed by
the vol % of biodiesel. B5 and B20, the most common blends, can be used in
unmodified diesel engines. E-diesels (blends of ethanol in diesel) are currently being
used in fleet vehicles in the European Union and the United States. Studies have
been carried out in E-diesel indicate significant reductions of particulate matter,
sometimes up to 40%, depending on the test methods and operating conditions. The
CO and nitrogen oxides (NOx) emissions were significantly lower when a 20%
blend of E-diesel was used in a constant-speed stationary diesel engine, as opposed
to diesel fuel. The addition of ethanol to diesel may result in a volumetric reduction
1
in sulfur, by as much as 20%, thus significantly reducing SO2 emissions. The major
drawback in E-diesel is that ethanol is immiscible in diesel over a wide range of
temperatures (Pinto et. al., 2005).
Table 1.1 Petroleum Diesel vs. Biodiesel (Knothe et. al., 2005a and Barnes 2006)
Fuel Property Petrol Diesel
Biodiesel
Fuel standard ASTM D975
ASTM D6751
Fuel composition C10-C21 HC
C12-C22 FAME
kinetic viscosity, mm2/s(at 40 °C)
1.3–4.1 1.9–6.0
specific gravity, kg/L 0.85 0.88
boiling point, °C 188–343 182–338
flash point, °C 60–80 100–170
cloud point, °C -15 to 5 -3 to 12
pour point, °C -35 to –15 -15 to 10
Cetane Number(ignition quality), min
40–55 48–65
stoichiometric air/fuel ratio (AFR)
15 13.8
life-cycle energy balance(energy units produced per
unit energy consumed)
0.83/1 3.2/1
Biodiesel is the only alternative fuel currently available with an overall positive
life-cycle energy balance as shown in Figure 1.1, producing 3.2 units of fuel
product energy per unit of fossil energy consumed, compared to barely 0.83 units
for petroleum diesel (Kiss 2008).
The presence of oxygen in biodiesel ( ≈ 10%) improves combustion and
reduces CO, soot, and hydrocarbon emissions while slightly increasing the NOx
emission as shown in Figure 1.2. Biodiesel is considered to be renewable, since the
carbon in the oil or fat originated mostly from carbon dioxide in the air, biodiesel is
2
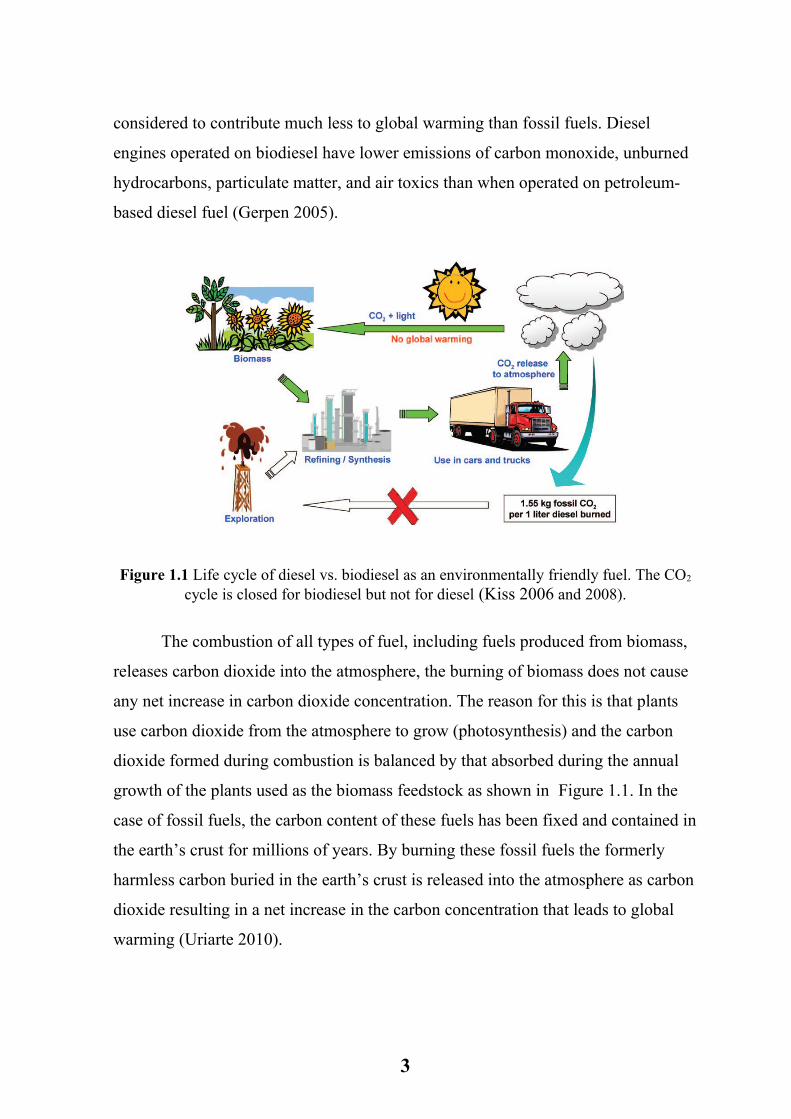
considered to contribute much less to global warming than fossil fuels. Diesel
engines operated on biodiesel have lower emissions of carbon monoxide, unburned
hydrocarbons, particulate matter, and air toxics than when operated on petroleum-
based diesel fuel (Gerpen 2005).
Figure 1.1 Life cycle of diesel vs. biodiesel as an environmentally friendly fuel. The CO2
cycle is closed for biodiesel but not for diesel (Kiss 2006 and 2008).
The combustion of all types of fuel, including fuels produced from biomass,
releases carbon dioxide into the atmosphere, the burning of biomass does not cause
any net increase in carbon dioxide concentration. The reason for this is that plants
use carbon dioxide from the atmosphere to grow (photosynthesis) and the carbon
dioxide formed during combustion is balanced by that absorbed during the annual
growth of the plants used as the biomass feedstock as shown in Figure 1.1. In the
case of fossil fuels, the carbon content of these fuels has been fixed and contained in
the earth’s crust for millions of years. By burning these fossil fuels the formerly
harmless carbon buried in the earth’s crust is released into the atmosphere as carbon
dioxide resulting in a net increase in the carbon concentration that leads to global
warming (Uriarte 2010).
3
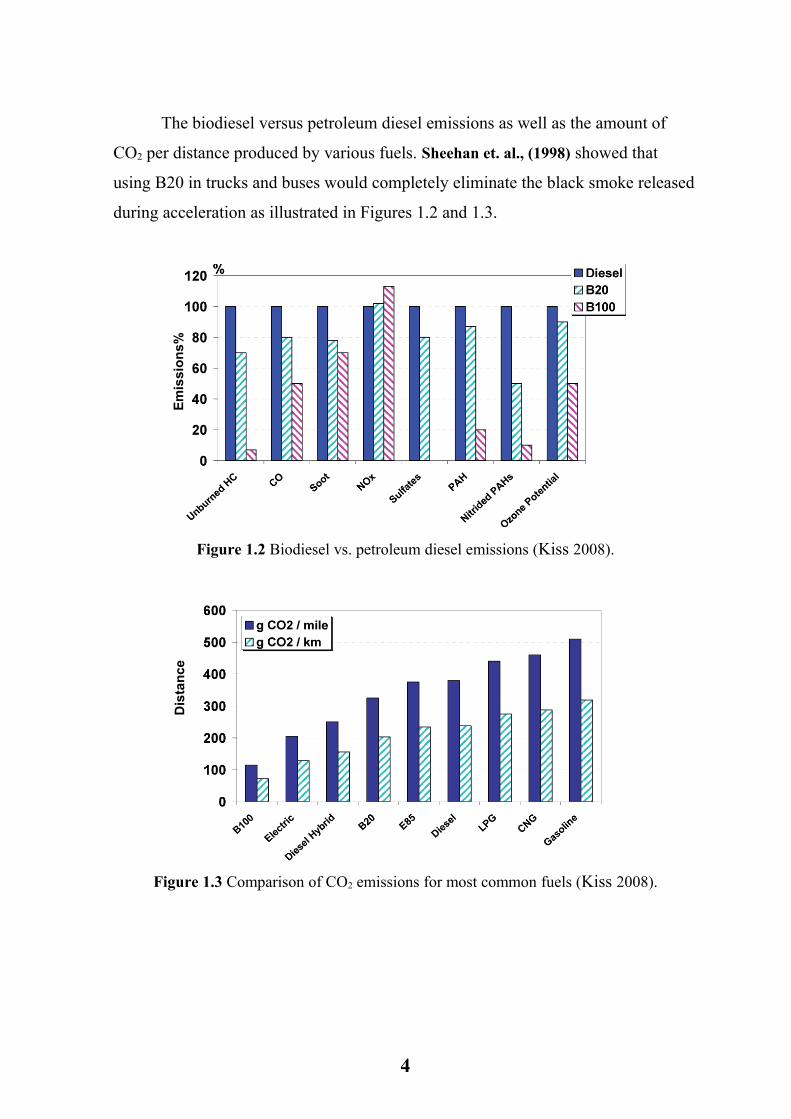
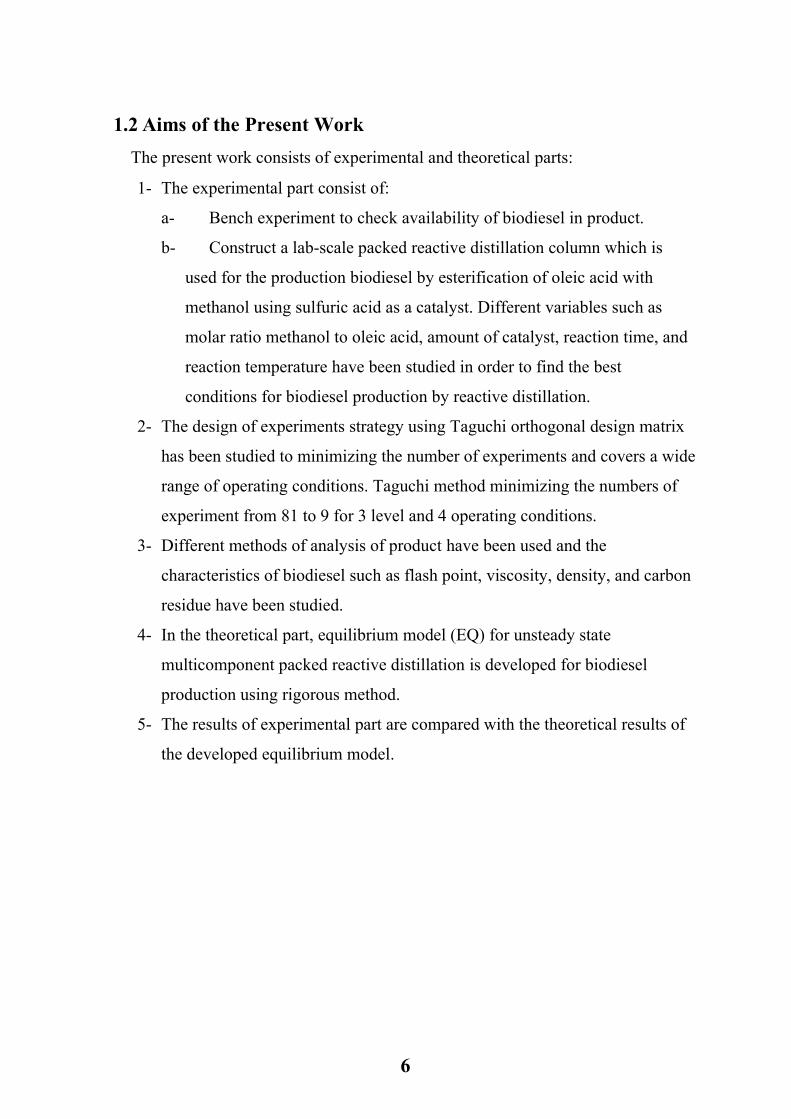
The biodiesel versus petroleum diesel emissions as well as the amount of
CO2 per distance produced by various fuels. Sheehan et. al., (1998) showed that
using B20 in trucks and buses would completely eliminate the black smoke released
during acceleration as illustrated in Figures 1.2 and 1.3.
Figure 1.2 Biodiesel vs. petroleum diesel emissions (Kiss 2008).
Figure 1.3 Comparison of CO2 emissions for most common fuels (Kiss 2008).
4
%
Em
issi
on
s
Dis
tan
ce

The higher cost of biodiesel is due to its production mostly from expensive
raw materials and consists of complicated process units. Therefore, it is necessary to
develop a process in order to produce biodiesel more efficient and economical.
To solve this problems, non-edible oils are suitable for biodiesel production,
because edible oils are already in demand and too expensive than diesel fuel. Plants
contains non edible oil is considered to be the wonder biodiesel feed stock because
of rapid in growth, higher seed productivity, it grow in arid, semiarid and wasteland,
it requires little water and fertilizer, can survive on infertile soils, and is not
browsed by cattle. Oleic acid is used as a raw material to produce biodiesel because
oleic acid is widely found in various plants. There are several economic biomass
sources for producing biodiesel such as:
1- Micro algae such as marine micro algae, botryococcus braunii, dunaliella
tertiolecta, gracilaria, pleurochrysis carterae, chlorella pyrenodiosa and
spirulina maxima.
2- Waste vegetables oil from frying process and sheep buchery plant fats
waste.
3- Many plants such as jatropa curcus, the jatropa oil contains 20% saturated
fatty acids and 80% unsaturated fatty acids.
For reducing the units, reactive distillation (RD) apply in the production
process lead to enormous reduction of capital and investment cost.
Reactive distillation (RD) is an innovating process which combines both distillation
and chemical reaction into a single unit, which saves energy (for heating) and
materials. Therefore, the RD technology offers many benefits as well as restrictions
over the conventional process of reaction followed by distillation or other separation
approaches. Reducing capital cost, higher conversion, improving selectivity, lower
energy consumption, the reduction or elimination of solvents in the process and
voidance of azeotropes are a few of the potential advantages offered by RD. This
technique is especially useful for equilibrium-limited reactions such as esterification
and transesterification reactions.
5
1.2 Aims of the Present Work
The present work consists of experimental and theoretical parts:
1- The experimental part consist of:
a- Bench experiment to check availability of biodiesel in product.
b- Construct a lab-scale packed reactive distillation column which is
used for the production biodiesel by esterification of oleic acid with
methanol using sulfuric acid as a catalyst. Different variables such as
molar ratio methanol to oleic acid, amount of catalyst, reaction time, and
reaction temperature have been studied in order to find the best
conditions for biodiesel production by reactive distillation.
2- The design of experiments strategy using Taguchi orthogonal design matrix
has been studied to minimizing the number of experiments and covers a wide
range of operating conditions. Taguchi method minimizing the numbers of
experiment from 81 to 9 for 3 level and 4 operating conditions.
3- Different methods of analysis of product have been used and the
characteristics of biodiesel such as flash point, viscosity, density, and carbon
residue have been studied.
4- In the theoretical part, equilibrium model (EQ) for unsteady state
multicomponent packed reactive distillation is developed for biodiesel
production using rigorous method.
5- The results of experimental part are compared with the theoretical results of
the developed equilibrium model.
6
7
Chapter Two Literature Survey
2.1 Introduction
The idea of using vegetable oil as fuel for diesel engines is over a century old.
In 1911, Rudolph Diesel presented an engine based on compression ignition is the
diesel engine. At that time there was no specific fuel fed to this engine, Rudolph
Diesel first used peanut oil (which is mostly in the form of triglycerides) at the turn
of the century to demonstrate the patent for diesel engine. The rapid introduction of
cheap petroleum made petroleum the preferred source of diesel fuel, so that today’s
diesel engines do not operate well when operated on unmodified triglycerides.
Natural oils, it turns out, are too viscous to be used in modern diesel engines
(Sheehan et. al., 1998, Pinto et. al., 2005, Kiss 2008 and Drapcho et. al., 2008). In
1980s, a chemical modification of natural oils was introduced that helped to bring
the viscosity of the oils within the range of current petroleum diesel. By reacting
triglycerides with simple alcohols, a chemical reaction known as
“transesterification” takes place in industry to create a chemical compound known
as an alkyl ester, which is known as biodiesel (Sheehan et. al., 1998).
There have been many problems associated with using vegetable oils directly
in diesel engines, problems such as: decrease in power output and thermal
efficiency of the engine, carbon deposits, oil ring sticking, thickening or gelling of
the lubricating oil as a result of contamination by vegetable oils. Other
disadvantages to the use of vegetable oils and especially animal fats are the high
viscosity (about 11–17 times higher than diesel fuel) and lower volatility that result
in carbon deposits in engines due to incomplete combustion. Beside that, vegetable
oils contain polyunsaturated compounds. Some chemical or physical modifications
have been tested to overcome these problems: pyrolysis, microemulsification,
dilution and transesterification, so esters from vegetable oils are the best substitutes
for diesel because they do not demand any modification in the diesel engine and
Click t
o buy NOW!
PDF-XChange
ww
w.tracker-software.c
om Click t
o buy NOW!
PDF-XChange
ww
w.tracker-software
.com
8
less viscous and will easily flow through the fuel system of an engine, a high
energetic yield, also vegetable oils naturally fix the solar energy and do not contain
sulfur. (Ma et. al., 1999 and Pinto et. al., 2005).
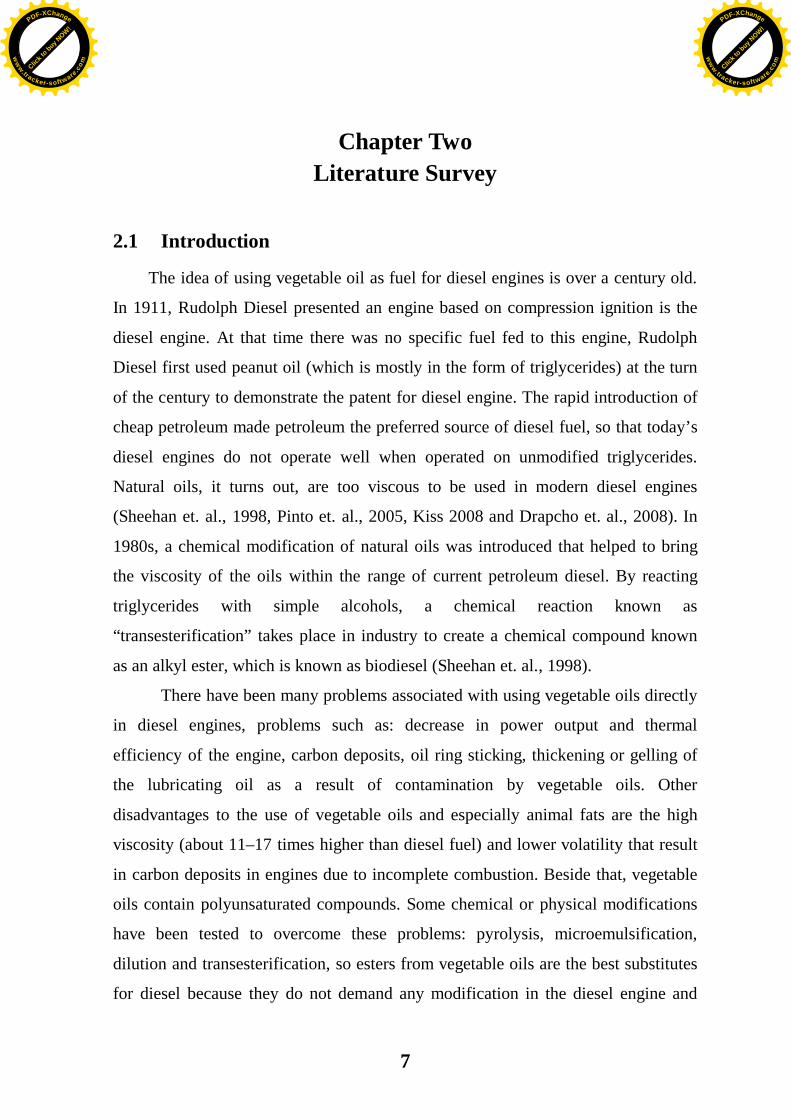
2.2 Chemical Building Blocks It is instructive to think of the chemistry of biodiesel in terms of the building
blocks that comprise the larger molecules involved in the biodiesel-making
reactions. Fatty acids are a component of both vegetable oil and biodiesel. In
chemical terms, are carboxylic acids of the form:
Figure 2.1 Molecular structure of an idealized fatty acid.
Fatty acids which are not bound to some other molecule are known as free
fatty acids. When reacted with a base, a fatty acid loses a hydrogen atom to form
soap. Chemically, soap is the salt of a fatty acid.
Figure 2.2 Molecular structure of soap.
The structures of fatty acids shown in Figure 2-1 are highly idealized. Real
fatty acids vary in the number of carbon atoms, and in the number of double bonds.
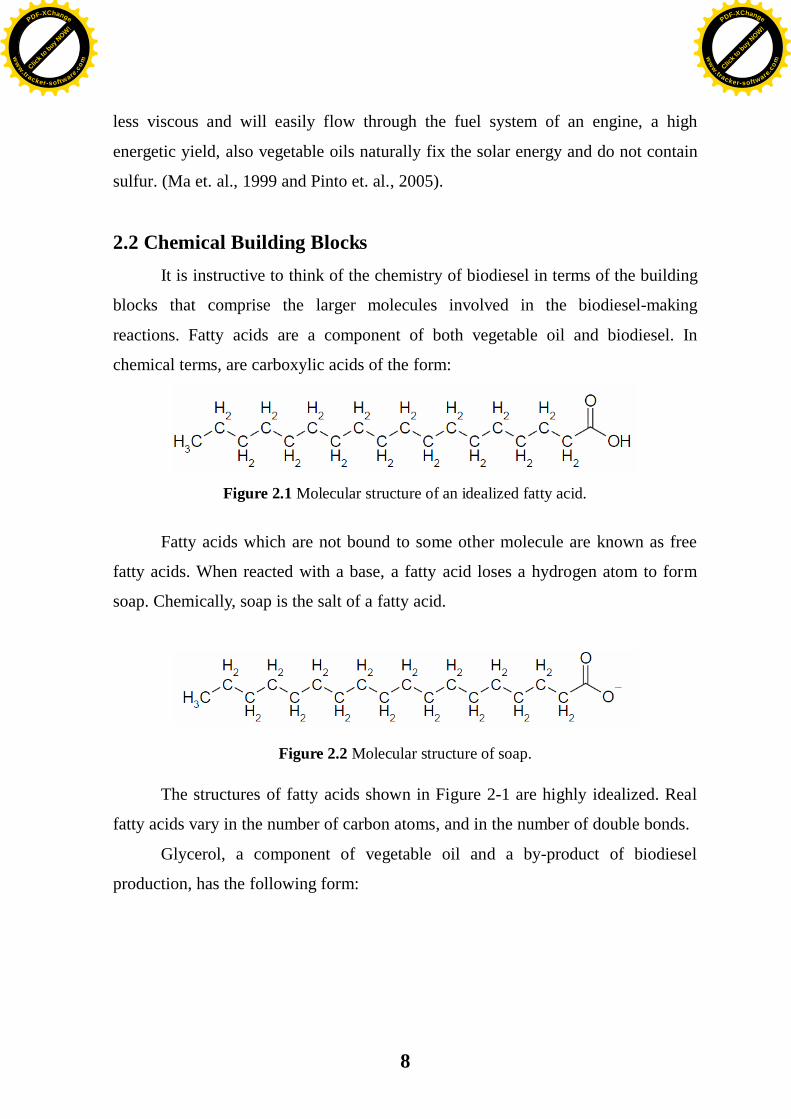
Glycerol, a component of vegetable oil and a by-product of biodiesel
production, has the following form:
Click t
o buy NOW!
PDF-XChange
ww
w.tracker-software.c
om Click t
o buy NOW!
PDF-XChange
ww
w.tracker-software
.com
9
Figure 2.3 Molecular structure of glycerol.
Alcohols are organic compounds of the form R-OH, where R is a
hydrocarbon. Typical alcohols used in biodiesel making are methanol, ethanol, 1-
propanol, and 1-butanol:
Figure 2.4 Molecular structure of methanol, ethanol, 1-propanol, and 1-butanol.
Methanol is the most commonly used to make biodiesel since ethanol is
easily obtained from plant sugars, while methanol is commonly produced from
natural gas. Ethanol is harder to be used because it easily forms emulsions, making
the separation of end products more difficult. This is especially true if the oil source
is WVO.
Transesterification is sometimes called alcoholysis, such as methanolysis or
ethanolysis, transesterification is the process of transforming one type of ester into
another type of ester. Chemically, biodiesel is a fatty acid alkyl ester:
Figure 2.5 Biodiesel molecules. Above is a methyl ester, below, an ethyl ester.
Click t
o buy NOW!
PDF-XChange
ww
w.tracker-software.c
om Click t
o buy NOW!
PDF-XChange
ww
w.tracker-software
.com
10
The biodiesel ester contains a fatty acid chain on one side, and a hydrocarbon
called an alkane on the other, thus biodiesel is a fatty acid alkyl ester. Usually, the
form of the alkane is specified, as in “methyl ester” or “ethyl ester”.
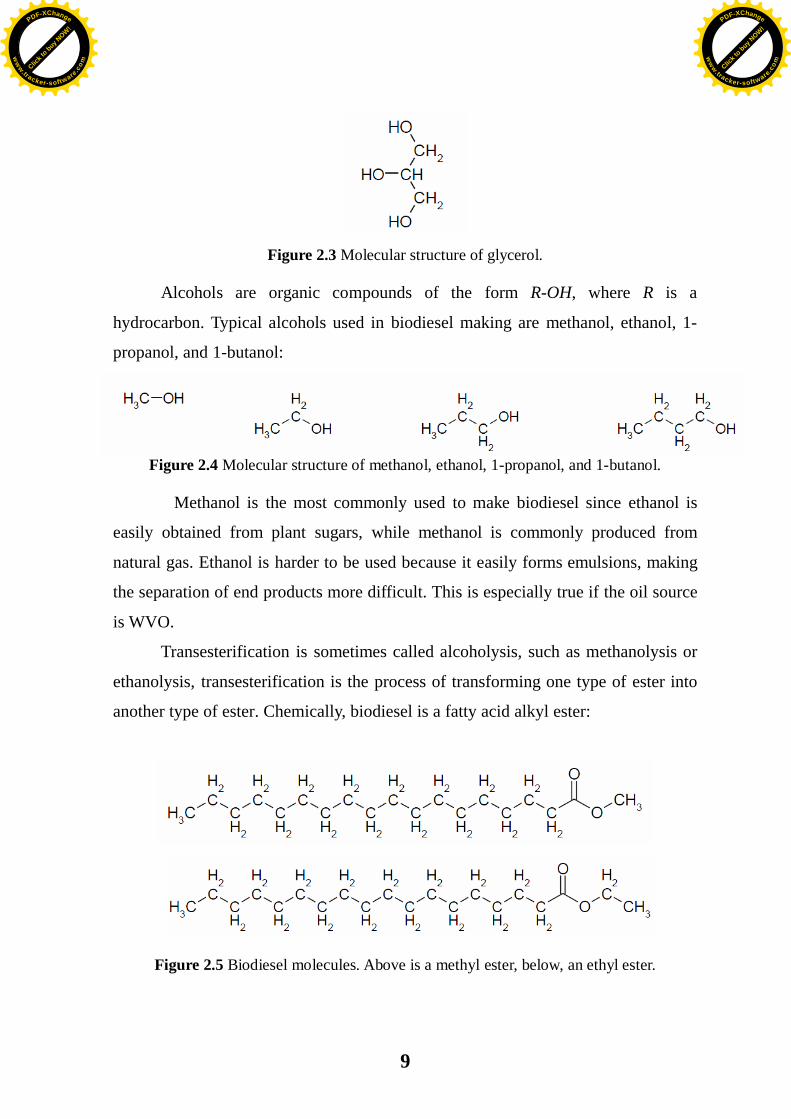
Vegetable oil is a mixture of many compounds, primarily triglycerides and free
fatty acids. A triglyceride is a tri-ester of glycerol and three fatty acids:
Figure 2.6 Molecular structure of triglyceride.
Edible oil contains a low percentage of free fatty acids. Waste vegetable oil
contains a higher amount of FFA’s because the frying process breaks down
triglyceride molecules.
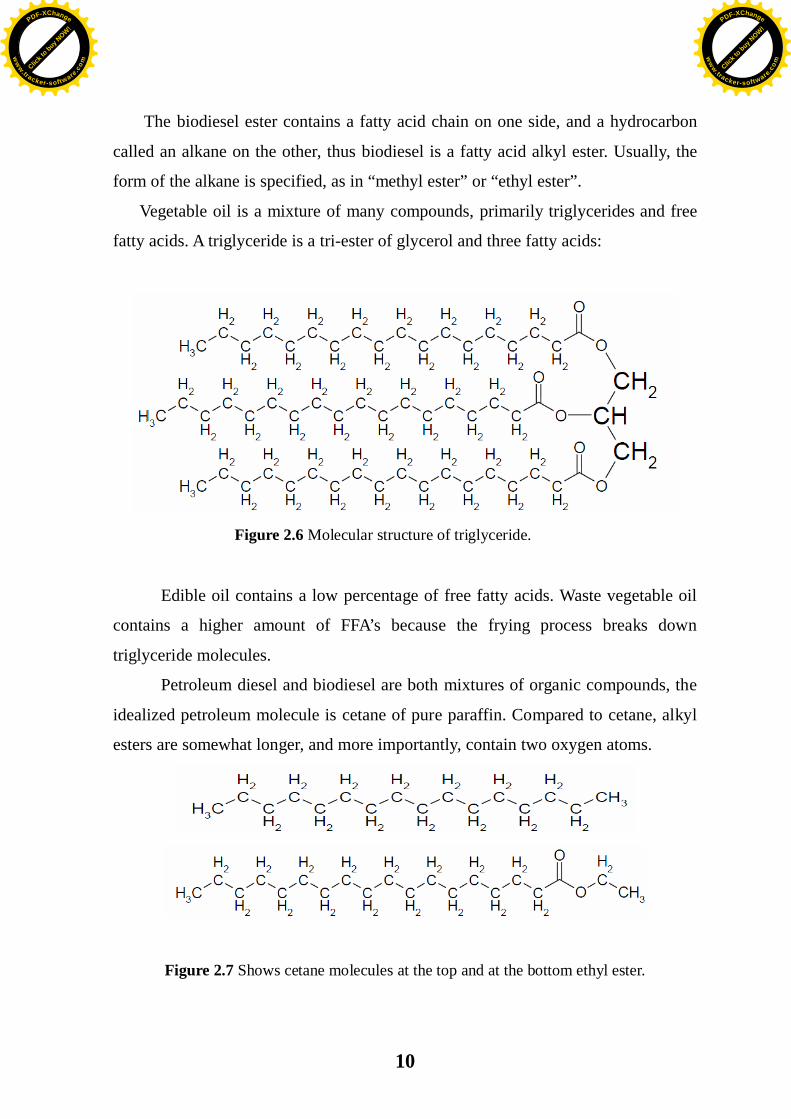
Petroleum diesel and biodiesel are both mixtures of organic compounds, the
idealized petroleum molecule is cetane of pure paraffin. Compared to cetane, alkyl
esters are somewhat longer, and more importantly, contain two oxygen atoms.
Figure 2.7 Shows cetane molecules at the top and at the bottom ethyl ester.
Click t
o buy NOW!
PDF-XChange
ww
w.tracker-software.c
om Click t
o buy NOW!
PDF-XChange
ww
w.tracker-software
.com
11
Since combustion is an oxidation reaction, the heating value of cetane, which
contains no oxygen atoms, is higher than that of biodiesel, for this reason, diesel
engines running biodiesel gives a loss of power on the order of 5% (Turner 2005).
2.3 Biodiesel Production There are six ways of producing biodiesel:
1- Direct use and blending of vegetable oil.
2- The usage of microemulsions with short-chain alcohols.
3- Thermal cracking (Pyrolysis) of vegetable oils.
4- Transesterification of triglycerides catalyzed by acids, bases or enzymes.
5- Esterification of free fatty acids with alcohols, using acids catalysts,
solids acids or bioenzymes.
6- Two-stage process (transesterification and esterification).
Using transesterification reaction, biodiesel production is normally
catalyzed by alkaline homogeneous catalyst to form a mixture of fatty acid
methyl esters. Alkaline catalyst could result soap formation if the feedstock used
contains substantial amount of free fatty acids. In the present work esterification of
FFA with methanol, using acids catalyst has been considered, the acid catalyzed
esterification reaction is one of the suitable routes to solve the problem of soap
formation (Ma et. al., 1999, Pinto et. al., 2005, Kiss 2008 and An 2009).
The principal ways of making biodiesel are by transesterification of
triglycerides and esterification of free fatty acids, in the first reaction, a tri-ester is
converted to three individual esters, thus it is termed transesterification. In the
second reaction, a new ester is created, thus it is called esterification.
The catalyst used in these processes can be enzymatic (lipases: Candida,
Pseudomonas), homogenous acids (H2SO4, HCl, H3PO4), heterogeneous acids
(zeolites, sulfonic resins), heterogeneous bases (MgO, CaO) and or homogenous
bases (KOH, NaOH), the latter being commonly used at industrial scale because it
operated at moderate conditions (ambient pressure and a temperature of 60-70oC)
Click t
o buy NOW!
PDF-XChange
ww
w.tracker-software.c
om Click t
o buy NOW!
PDF-XChange
ww
w.tracker-software
.com
12
and it gives a shorter reaction time.
Also the biodiesel can be produced without a catalyst using supercritical
method, this was developed to solve the problem of miscibility of oil and alcohol
that hinders the kinetics of transesterification, as well as to take advantage of not
using catalyst at all. However, the operating conditions are severe (T >240oC, P
>80bar) and therefore require special equipments.
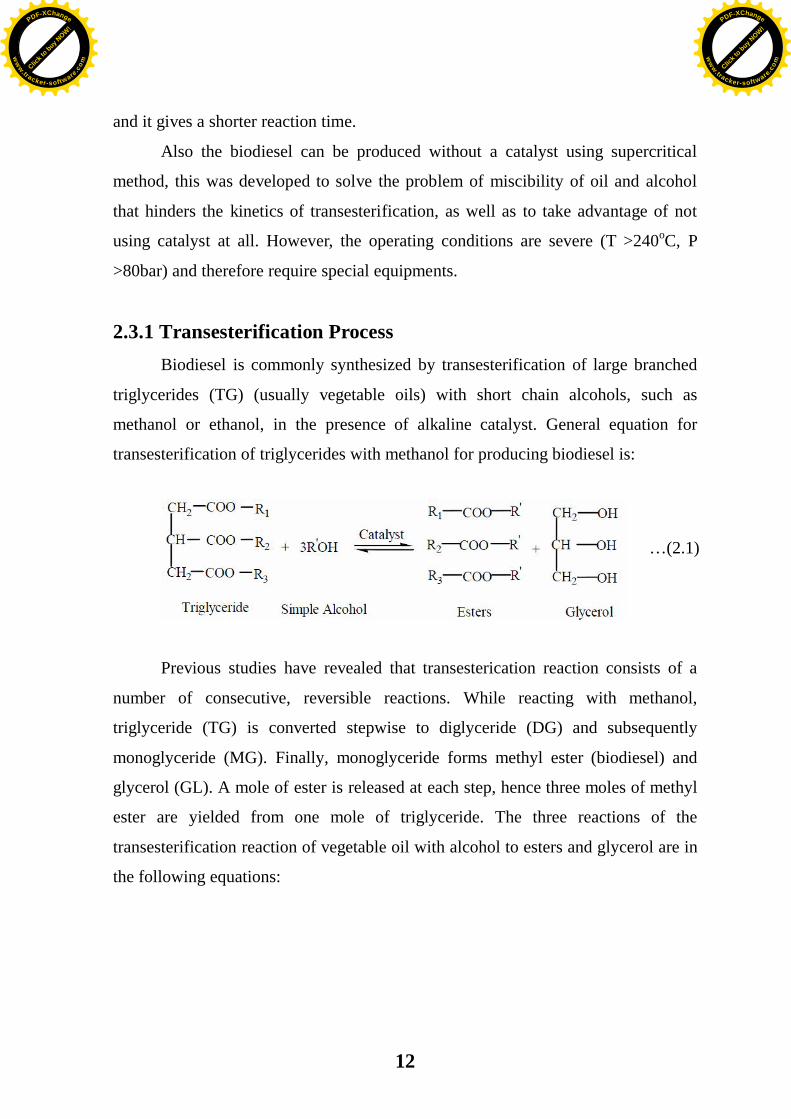
2.3.1 Transesterification Process Biodiesel is commonly synthesized by transesterification of large branched
triglycerides (TG) (usually vegetable oils) with short chain alcohols, such as
methanol or ethanol, in the presence of alkaline catalyst. General equation for
transesterification of triglycerides with methanol for producing biodiesel is:
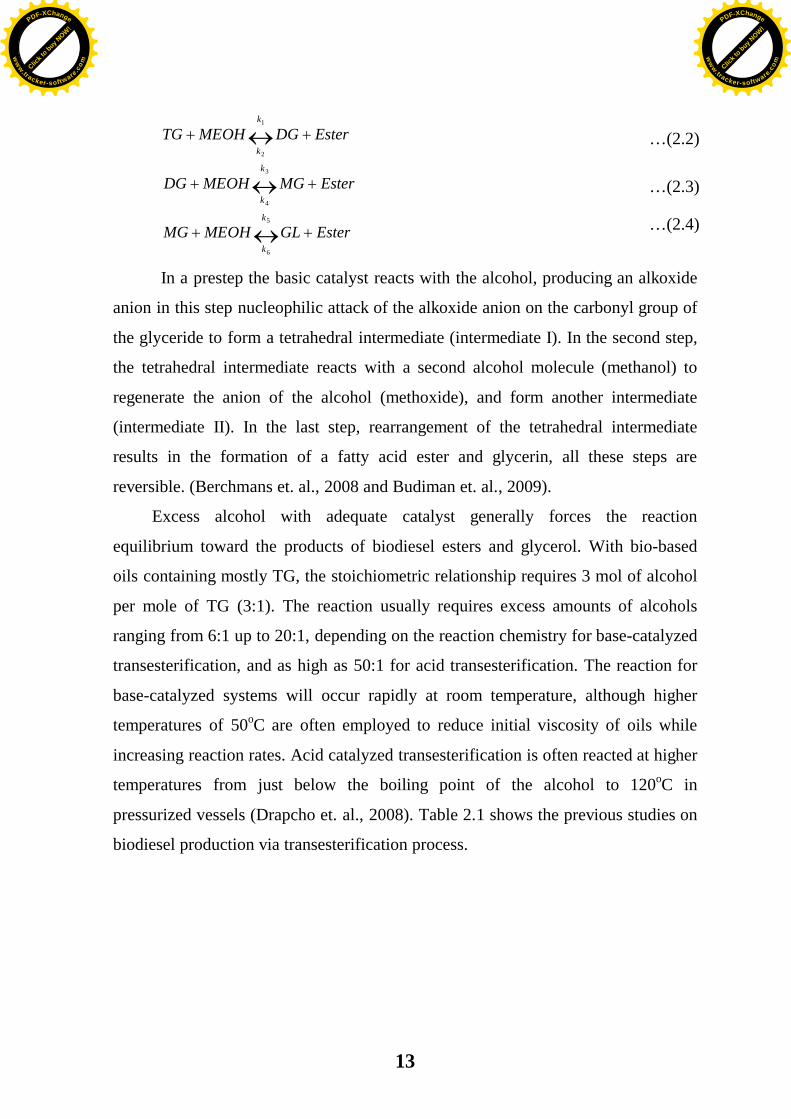
Previous studies have revealed that transesterication reaction consists of a
number of consecutive, reversible reactions. While reacting with methanol,
triglyceride (TG) is converted stepwise to diglyceride (DG) and subsequently
monoglyceride (MG). Finally, monoglyceride forms methyl ester (biodiesel) and
glycerol (GL). A mole of ester is released at each step, hence three moles of methyl
ester are yielded from one mole of triglyceride. The three reactions of the
transesterification reaction of vegetable oil with alcohol to esters and glycerol are in
the following equations:
…(2.1)
Click t
o buy NOW!
PDF-XChange
ww
w.tracker-software.c
om Click t
o buy NOW!
PDF-XChange
ww
w.tracker-software
.com
13
EsterGLMEOHMG
EsterMGMEOHDG
EsterDGMEOHTG
k
k
k
k
k
k
5
6
3
4
1
2
In a prestep the basic catalyst reacts with the alcohol, producing an alkoxide
anion in this step nucleophilic attack of the alkoxide anion on the carbonyl group of
the glyceride to form a tetrahedral intermediate (intermediate I). In the second step,
the tetrahedral intermediate reacts with a second alcohol molecule (methanol) to
regenerate the anion of the alcohol (methoxide), and form another intermediate
(intermediate II). In the last step, rearrangement of the tetrahedral intermediate
results in the formation of a fatty acid ester and glycerin, all these steps are
reversible. (Berchmans et. al., 2008 and Budiman et. al., 2009).
Excess alcohol with adequate catalyst generally forces the reaction
equilibrium toward the products of biodiesel esters and glycerol. With bio-based
oils containing mostly TG, the stoichiometric relationship requires 3 mol of alcohol
per mole of TG (3:1). The reaction usually requires excess amounts of alcohols
ranging from 6:1 up to 20:1, depending on the reaction chemistry for base-catalyzed
transesterification, and as high as 50:1 for acid transesterification. The reaction for
base-catalyzed systems will occur rapidly at room temperature, although higher
temperatures of 50oC are often employed to reduce initial viscosity of oils while
increasing reaction rates. Acid catalyzed transesterification is often reacted at higher
temperatures from just below the boiling point of the alcohol to 120oC in
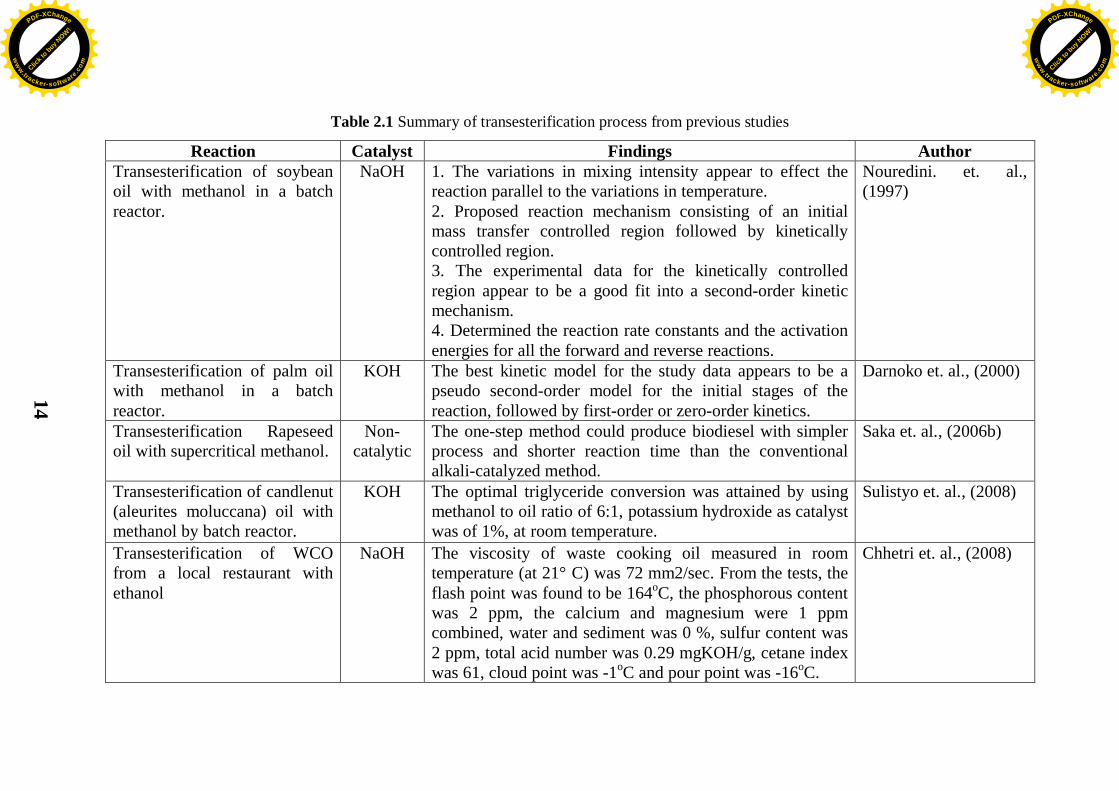
pressurized vessels (Drapcho et. al., 2008). Table 2.1 shows the previous studies on
biodiesel production via transesterification process.
…(2.2)
…(2.3)
…(2.4)
Click t
o buy NOW!
PDF-XChange
ww
w.tracker-software.c
om Click t
o buy NOW!
PDF-XChange
ww
w.tracker-software
.com
14
Table 2.1 Summary of transesterification process from previous studies
Reaction Catalyst Findings Author Transesterification of soybean oil with methanol in a batch reactor.
NaOH 1. The variations in mixing intensity appear to effect the reaction parallel to the variations in temperature. 2. Proposed reaction mechanism consisting of an initial mass transfer controlled region followed by kinetically controlled region. 3. The experimental data for the kinetically controlled region appear to be a good fit into a second-order kinetic mechanism. 4. Determined the reaction rate constants and the activation energies for all the forward and reverse reactions.
Nouredini. et. al., (1997)
Transesterification of palm oil with methanol in a batch reactor.
KOH The best kinetic model for the study data appears to be a pseudo second-order model for the initial stages of the reaction, followed by first-order or zero-order kinetics.
Darnoko et. al., (2000)
Transesterification Rapeseed oil with supercritical methanol.
Non-catalytic
The one-step method could produce biodiesel with simpler process and shorter reaction time than the conventional alkali-catalyzed method.
Saka et. al., (2006b)
Transesterification of candlenut (aleurites moluccana) oil with methanol by batch reactor.
KOH The optimal triglyceride conversion was attained by using methanol to oil ratio of 6:1, potassium hydroxide as catalyst was of 1%, at room temperature.
Sulistyo et. al., (2008)
Transesterification of WCO from a local restaurant with ethanol
NaOH
The viscosity of waste cooking oil measured in room temperature (at 21° C) was 72 mm2/sec. From the tests, the flash point was found to be 164oC, the phosphorous content was 2 ppm, the calcium and magnesium were 1 ppm combined, water and sediment was 0 %, sulfur content was 2 ppm, total acid number was 0.29 mgKOH/g, cetane index was 61, cloud point was -1oC and pour point was -16oC.
Chhetri et. al., (2008)
Click t
o buy NOW!
PDF-XChange
ww
w.tracker-software.c
om Click t
o buy NOW!
PDF-XChange
ww
w.tracker-software
.com
15
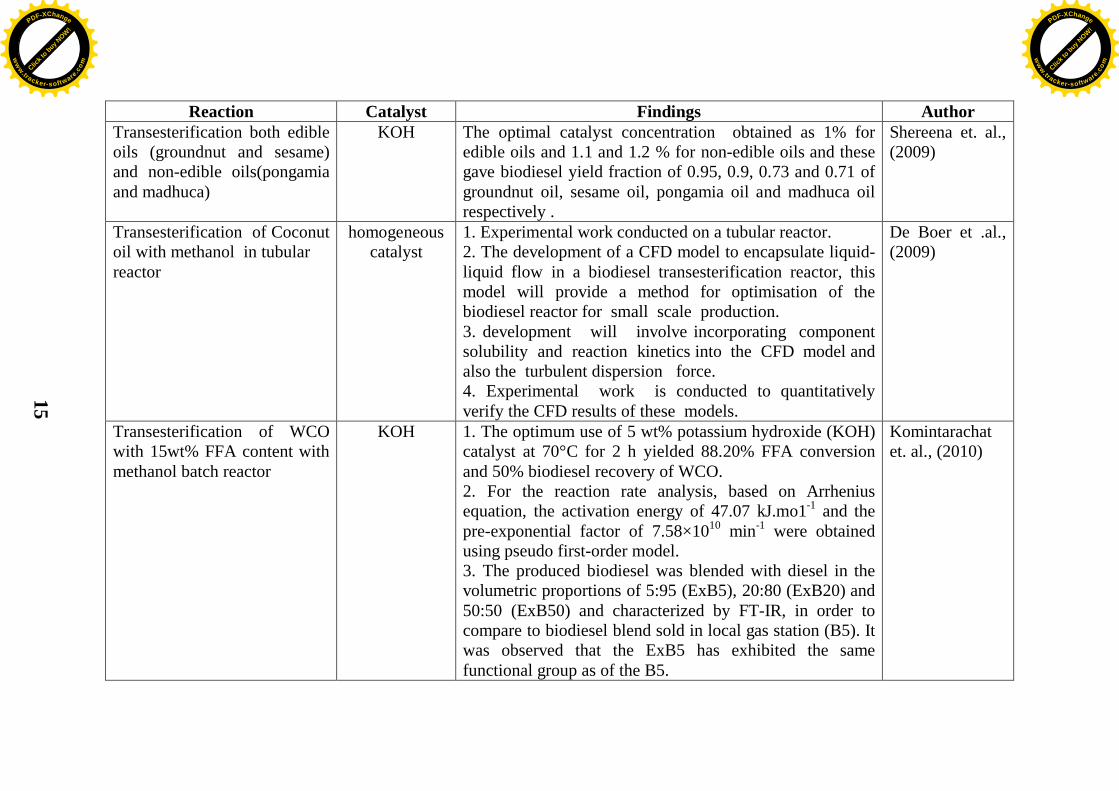
Reaction Catalyst Findings Author Transesterification both edible oils (groundnut and sesame) and non-edible oils(pongamia and madhuca)
KOH
The optimal catalyst concentration obtained as 1% for edible oils and 1.1 and 1.2 % for non-edible oils and these gave biodiesel yield fraction of 0.95, 0.9, 0.73 and 0.71 of groundnut oil, sesame oil, pongamia oil and madhuca oil respectively .
Shereena et. al., (2009)
Transesterification of Coconut oil with methanol in tubular reactor
homogeneous catalyst
1. Experimental work conducted on a tubular reactor. 2. The development of a CFD model to encapsulate liquid-liquid flow in a biodiesel transesterification reactor, this model will provide a method for optimisation of the biodiesel reactor for small scale production. 3. development will involve incorporating component solubility and reaction kinetics into the CFD model and also the turbulent dispersion force. 4. Experimental work is conducted to quantitatively verify the CFD results of these models.
De Boer et .al., (2009)
Transesterification of WCO with 15wt% FFA content with methanol batch reactor
KOH 1. The optimum use of 5 wt% potassium hydroxide (KOH) catalyst at 70°C for 2 h yielded 88.20% FFA conversion and 50% biodiesel recovery of WCO. 2. For the reaction rate analysis, based on Arrhenius equation, the activation energy of 47.07 kJ.mo1-1 and the pre-exponential factor of 7.58×10¹⁰ min-1 were obtained using pseudo first-order model. 3. The produced biodiesel was blended with diesel in the volumetric proportions of 5:95 (ExB5), 20:80 (ExB20) and 50:50 (ExB50) and characterized by FT-IR, in order to compare to biodiesel blend sold in local gas station (B5). It was observed that the ExB5 has exhibited the same functional group as of the B5.
Komintarachat et. al., (2010)
Click t
o buy NOW!
PDF-XChange
ww
w.tracker-software.c
om Click t
o buy NOW!
PDF-XChange
ww
w.tracker-software
.com

16
Reaction Catalyst Findings Author Transesterification rapeseed oil with methanol
KOH
1. The optimal experimental condition by Tanguchi method was KOH as a catalyst, at a concentration of 1.5 wt%, and reaction temperature of 60oC. 2. Catalyst concentration played the most important role in the yield of rapeseed methyl ester. 3. The yield was improved to 96.7% with the by optimal conditions of the control parameter.
Kim et. al., (2010)
Transesterification of soybean oil with methanol methanol using high frequency ultrasound.
KOH 1. The optimal experimental condition by Tanguchi method were 581kHz, 143W, 0.75 wt% KOH loading at 1:6 oil/methanol, resulting in more than 92.5% biodiesel yield in less than 30 min. 2. The catalyst loading is the most influential parameter, followed by ultrasonic power, and oil/methanol molar ratio. 3. Ultrasonic frequency is found to have negligible influence on the biodiesel yield in the range of the investigation
Mahamuni et. al., (2010)
Firstly Transesterification Jatropha Curcas oil with butanol in the ratio of 1:25 investigated with mixing intensity of 250 rpm in isothermal batch reactor.
NaOH 1. The fuzzy model of the temperature is developed using adaptive neurofuzzy inference system (ANFIS). 2. Performance was evaluated by comparing fuzzy model with the batch kinetic data. The result obtained from experimental data and fuzzy modeling is very similar. Both techniques are very efficient and accurate
Sohpal et. al. (2011)
Click t
o buy NOW!
PDF-XChange
ww
w.tracker-software.c
om Click t
o buy NOW!
PDF-XChange
ww
w.tracker-software
.com
17
2.3.2 Esterification Process The esterification of FFA with short-chain alcohols is another way to
produce biodiesel, and it is a reversible reaction where free fatty acids (FFA) are
converted to alkyl esters, the by-product of this reaction is water. The reaction is
reversible and to shift the equilibrium in favor of the products two methods can be
used: removal of one of the products, preferably water, or using an excess of
alcohol.
OHCOORROHRCOOHR 22121
Free fatty acids are a by product of the refining of edible oils, which are
removed in a neutralization step in the chemical refining (for oils with low acidity)
or physical refining by deodorization (in oils with high acid content) in order to be
marketed. These acids recovered on deodorization process have the potential to be
converted into biodiesel.
The three reactions of the transesterification processes and the hydrolysis of
oils and fats are used as a pretreatment to increase the FFA concentration producing
a more complete conversion. Such reactions increase the range of raw materials
usable for biodiesel production. Previous studies show that this reaction of fatty
acid esterification is faster and occurs in a single step, unlike the three reactions of
the transesterification of triglycerides (Machado et. al., 2011).
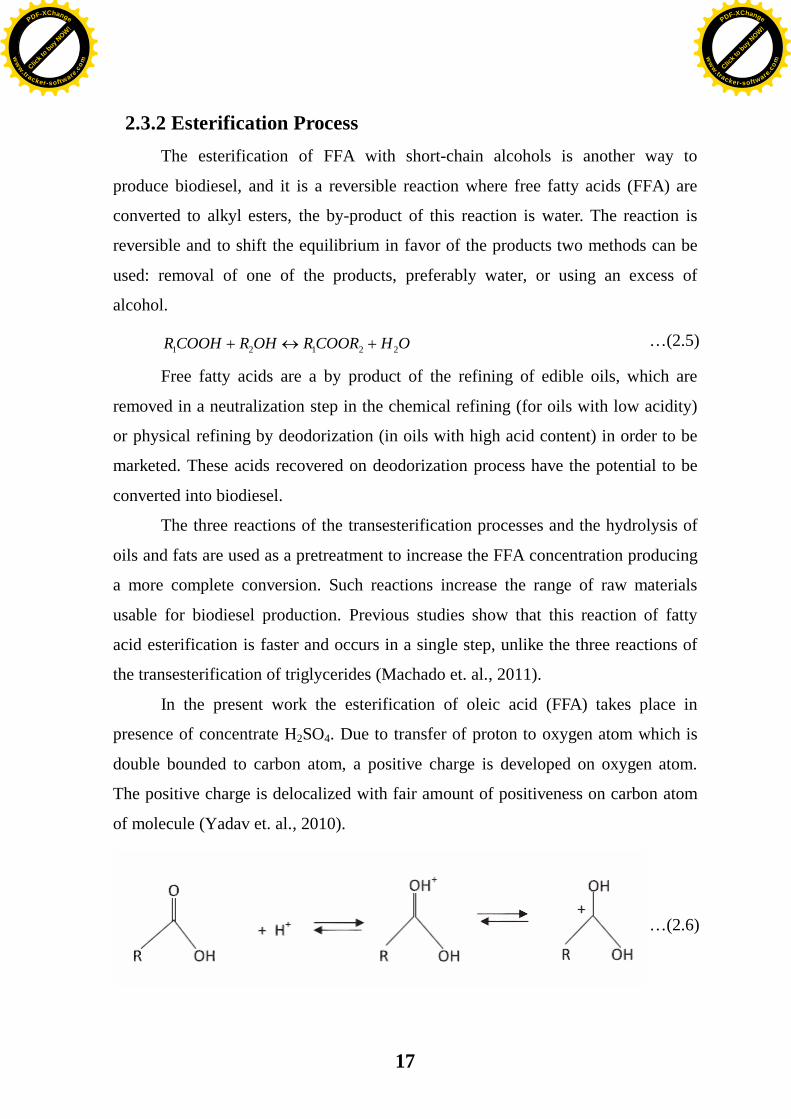
In the present work the esterification of oleic acid (FFA) takes place in
presence of concentrate H2SO4. Due to transfer of proton to oxygen atom which is
double bounded to carbon atom, a positive charge is developed on oxygen atom.
The positive charge is delocalized with fair amount of positiveness on carbon atom
of molecule (Yadav et. al., 2010).
…(2.5)
…(2.6)
Click t
o buy NOW!
PDF-XChange
ww
w.tracker-software.c
om Click t
o buy NOW!
PDF-XChange
ww
w.tracker-software
.com
18
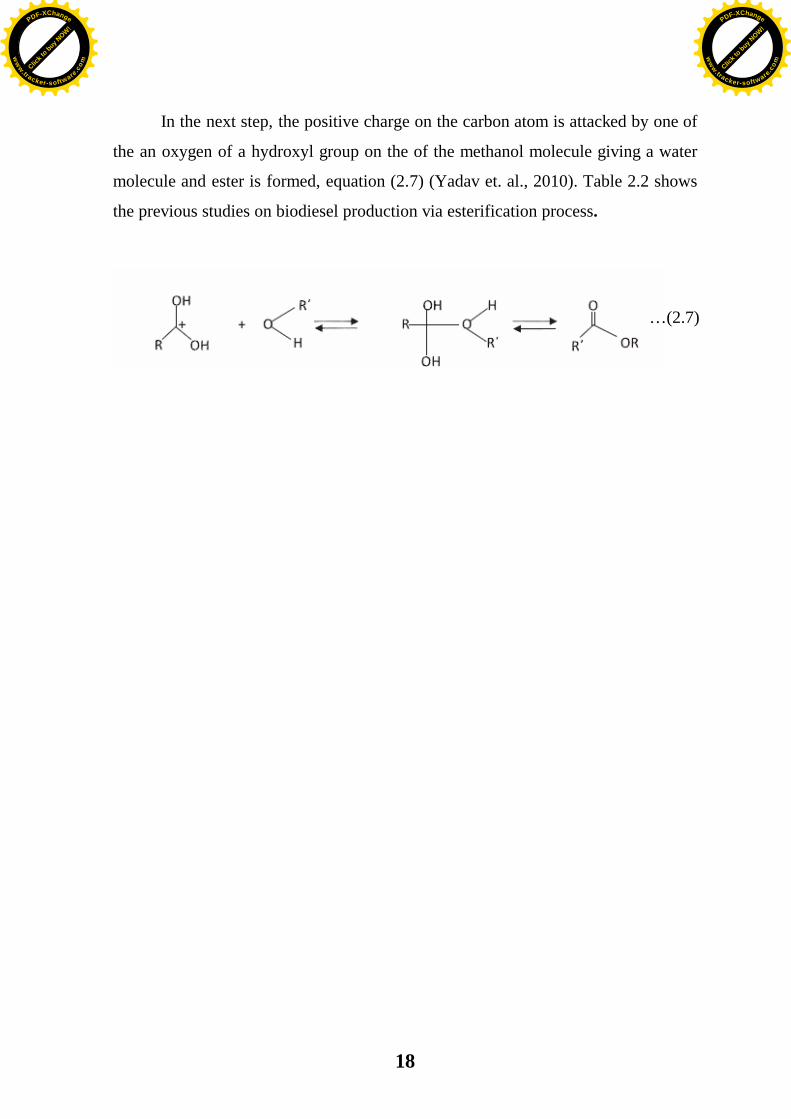
In the next step, the positive charge on the carbon atom is attacked by one of
the an oxygen of a hydroxyl group on the of the methanol molecule giving a water
molecule and ester is formed, equation (2.7) (Yadav et. al., 2010). Table 2.2 shows
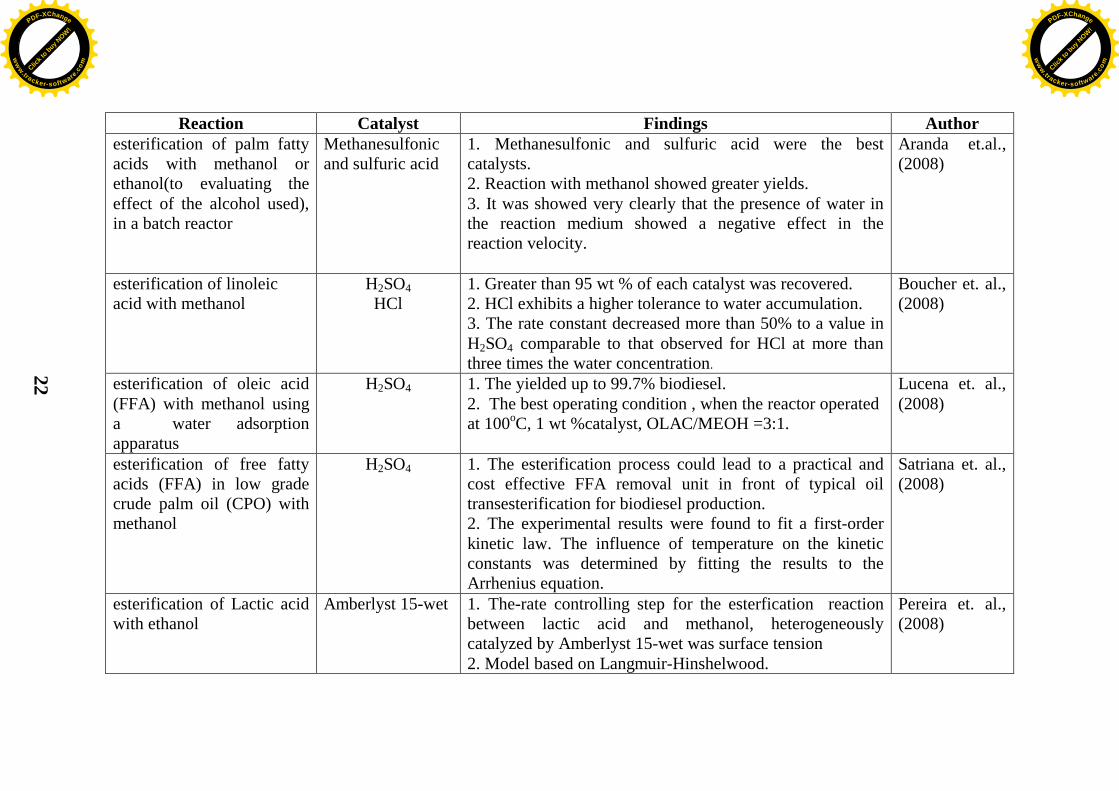
the previous studies on biodiesel production via esterification process.
…(2.7)
Click t
o buy NOW!
PDF-XChange
ww
w.tracker-software.c
om Click t
o buy NOW!
PDF-XChange
ww
w.tracker-software
.com

19
Table 2.2 Summary of esterification process from previous studies
Reaction Catalyst Findings Author esterification of oleic acid with methanol.
p-Toluenesulfonic acid p-TSA) and the cation-exchange resins K2411 and K1481
1. The presence of p-toluenesulfonic acid in a homogeneous phase in high yield, avoiding diffusion and mass-transfer. 2. The presence of the cationic resins in a heterogeneous phase. The chemical reactivity appeared to be limited by external diffusion oleic acid and desorption of methyl oleate.
Vieville et. el.,
(1993)
esterification of oleic acid with methanol
001 type acidic ion-exchange
resin
The water produced could be well removed from the reaction product in the two-phase region. Therefore, it is possible to increase the yield of methyl oleate by using excess methanol.
Chen et. al. (2001)
esterification mixing refined rapeseed oil with oleic acid with methanol
H2SO4 1. The reaction rate depends on the amount of the catalyst, the acidity of the reaction mixture, and reaction duration, especially during the first 15 min. 2. The data suggest that having excluded diffusion, the reaction order is about 1. Within the limits of the experimental conditions (free fatty acids 0.162 mol//L-1.948 mol/L, temperature 20–60oC, constant mixing speed 850 min-1, 1% of catalyst (H2SO4)) the apparent energy of activation Et is < 13.3 kJ/mol, while pre-exponent A = 1.27.
Sendzikiene et. al.,(2004)
esterification of oleic acid by methanol in the presence of tritglycerides in a batch well-stirred slurry reactor.
Acid-ion-exchange
polymeric resin (Relite CFS)
1. The experimental data have been interpreted with a second-order, pseudo-homogenous kinetic model and a good agreement between the experimental data and model has been obtained. 2. Kinetic parameters of a pseudo-homogenous second-order model have been determined by nonlinear regression on the experimental free- acidity data.
Tesser et. al. (2005)
Click t
o buy NOW!
PDF-XChange
ww
w.tracker-software.c
om Click t
o buy NOW!
PDF-XChange
ww
w.tracker-software
.com

20
Reaction Catalyst Findings Author esterification of dodecanoic acid with 2-ethylhexanol, 1- propanol, and methanol at 130 –180oC.
solid acids (zeolites, ion-exchange resins, and mixed metal oxides)
1. The most promising candidate is found to be sulphated zirconia. 2. Catalysts with small pores (microporous), such as zeolites, are not suitable for biodiesel manufacture because of the diffusion limitations of the large fatty acid molecules. Ion-exchange resins are active strong acids, but have a low thermal stability.
Kiss et. al., (2006)
Esterfication of palmitic acid with ethanol in 15 ml closed batch reactor
Lipozyme RM-IM (Enzyme)
1. Statistical analysis indicated that enzyme concentration and palmitic acid/ethanol molar ratio is the most significant variables efficating the initial reaction rate. 2. The best result at palmitic acid/ethanol molar ratio of o.5, temperature 67 oC, and enzyme concentration of 4.5%(w/w)
Viera et. al., (2006)
Esterfication acid oil (10% oleic acid and 90% refines sunflower oil) with ethanol.
Dowex monosphere 550 A resin and Dowex upcore A-625
1. Resins are a suitable to perform the esterfication reaction with good results. 2. Dowex monosphere 550 A resin shows both better final conversion and a good reaction rate at the operation condition used in this work than Dowex upcore A-625.
Marchetti et. al., (2007)
esterification of oleic acid, dissolved in soybean oil, with methanol in two different reactors: a well-stirred slurry reactor (WSSR) and a spray tower loop reactor (STLR) both working at atmospheric pressure.
sulfonic exchange acid resin (Relite CFS by Resindion)
1. The WSSR and STLR had similar behavior with performances that are better than those obtainable in a PFR working at atmospheric pressure for similar methanol flow rates. The improved performances are due to the efficiency in stripping water shifting the equilibrium of the reaction to the right. 2. Both the WSSR and STLR showed liquid-solid phase mass transfer limitations, the liquid-solid mass transfer coefficients, determined by regression on the experimental data, have been compared with the values obtained by appropriate correlations.
Santacesaria et. al., (2007)
Click t
o buy NOW!
PDF-XChange
ww
w.tracker-software.c
om Click t
o buy NOW!
PDF-XChange
ww
w.tracker-software
.com
21
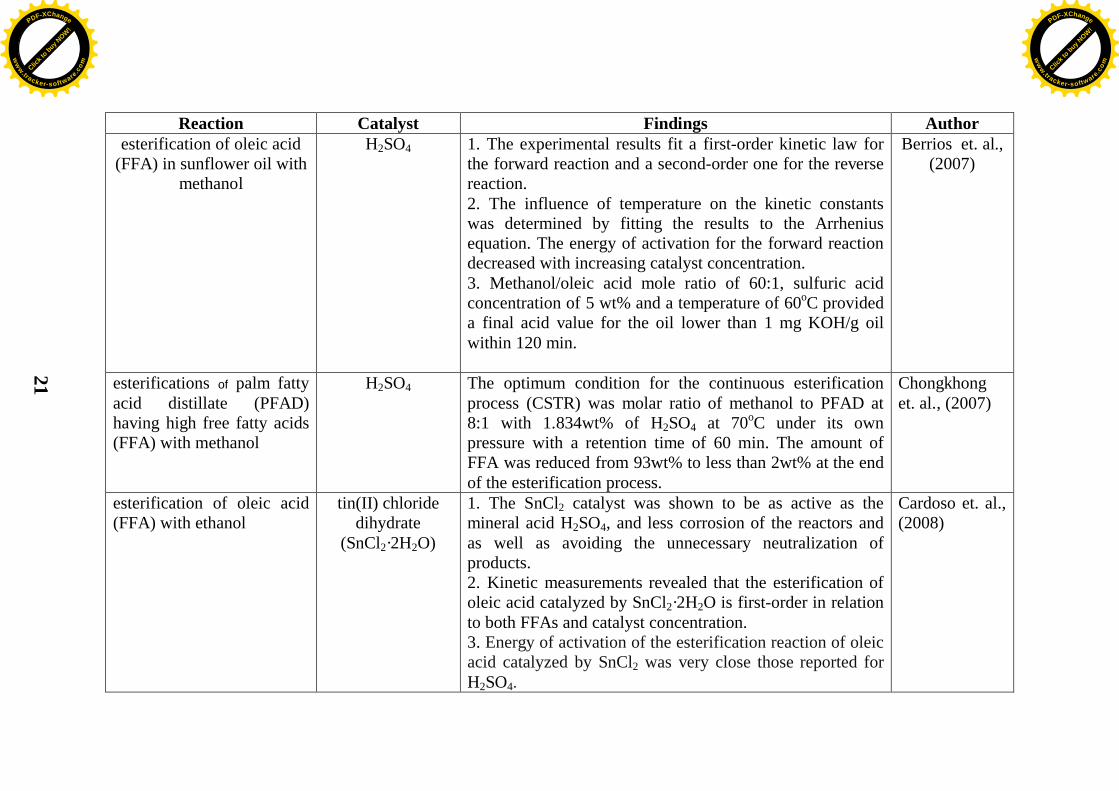
Reaction Catalyst Findings Author esterification of oleic acid
(FFA) in sunflower oil with methanol
H2SO4 1. The experimental results fit a first-order kinetic law for the forward reaction and a second-order one for the reverse reaction. 2. The influence of temperature on the kinetic constants was determined by fitting the results to the Arrhenius equation. The energy of activation for the forward reaction decreased with increasing catalyst concentration. 3. Methanol/oleic acid mole ratio of 60:1, sulfuric acid concentration of 5 wt% and a temperature of 60oC provided a final acid value for the oil lower than 1 mg KOH/g oil within 120 min.
Berrios et. al., (2007)
esterifications of palm fatty acid distillate (PFAD) having high free fatty acids (FFA) with methanol
H2SO4 The optimum condition for the continuous esterification process (CSTR) was molar ratio of methanol to PFAD at 8:1 with 1.834wt% of H2SO4 at 70oC under its own pressure with a retention time of 60 min. The amount of FFA was reduced from 93wt% to less than 2wt% at the end of the esterification process.
Chongkhong et. al., (2007)
esterification of oleic acid (FFA) with ethanol
tin(II) chloride dihydrate
(SnCl2·2H2O)
1. The SnCl2 catalyst was shown to be as active as the mineral acid H2SO4, and less corrosion of the reactors and as well as avoiding the unnecessary neutralization of products. 2. Kinetic measurements revealed that the esterification of oleic acid catalyzed by SnCl2·2H2O is first-order in relation to both FFAs and catalyst concentration. 3. Energy of activation of the esterification reaction of oleic acid catalyzed by SnCl2 was very close those reported for H2SO4.
Cardoso et. al., (2008)
Click t
o buy NOW!
PDF-XChange
ww
w.tracker-software.c
om Click t
o buy NOW!
PDF-XChange
ww
w.tracker-software
.com
22
Reaction Catalyst Findings Author esterification of palm fatty acids with methanol or ethanol(to evaluating the effect of the alcohol used), in a batch reactor
Methanesulfonic and sulfuric acid
1. Methanesulfonic and sulfuric acid were the best catalysts. 2. Reaction with methanol showed greater yields. 3. It was showed very clearly that the presence of water in the reaction medium showed a negative effect in the reaction velocity.
Aranda et.al., (2008)
esterification of linoleic acid with methanol
H2SO4 HCl
1. Greater than 95 wt % of each catalyst was recovered. 2. HCl exhibits a higher tolerance to water accumulation. 3. The rate constant decreased more than 50% to a value in H2SO4 comparable to that observed for HCl at more than three times the water concentration.
Boucher et. al., (2008)
esterification of oleic acid (FFA) with methanol using a water adsorption apparatus
H2SO4 1. The yielded up to 99.7% biodiesel. 2. The best operating condition , when the reactor operated at 100oC, 1 wt %catalyst, OLAC/MEOH =3:1.
Lucena et. al., (2008)
esterification of free fatty acids (FFA) in low grade crude palm oil (CPO) with methanol
H2SO4 1. The esterification process could lead to a practical and cost effective FFA removal unit in front of typical oil transesterification for biodiesel production. 2. The experimental results were found to fit a first-order kinetic law. The influence of temperature on the kinetic constants was determined by fitting the results to the Arrhenius equation.
Satriana et. al., (2008)
esterification of Lactic acid with ethanol
Amberlyst 15-wet 1. The-rate controlling step for the esterfication reaction between lactic acid and methanol, heterogeneously catalyzed by Amberlyst 15-wet was surface tension 2. Model based on Langmuir-Hinshelwood.
Pereira et. al., (2008)
Click t
o buy NOW!
PDF-XChange
ww
w.tracker-software.c
om Click t
o buy NOW!
PDF-XChange
ww
w.tracker-software
.com
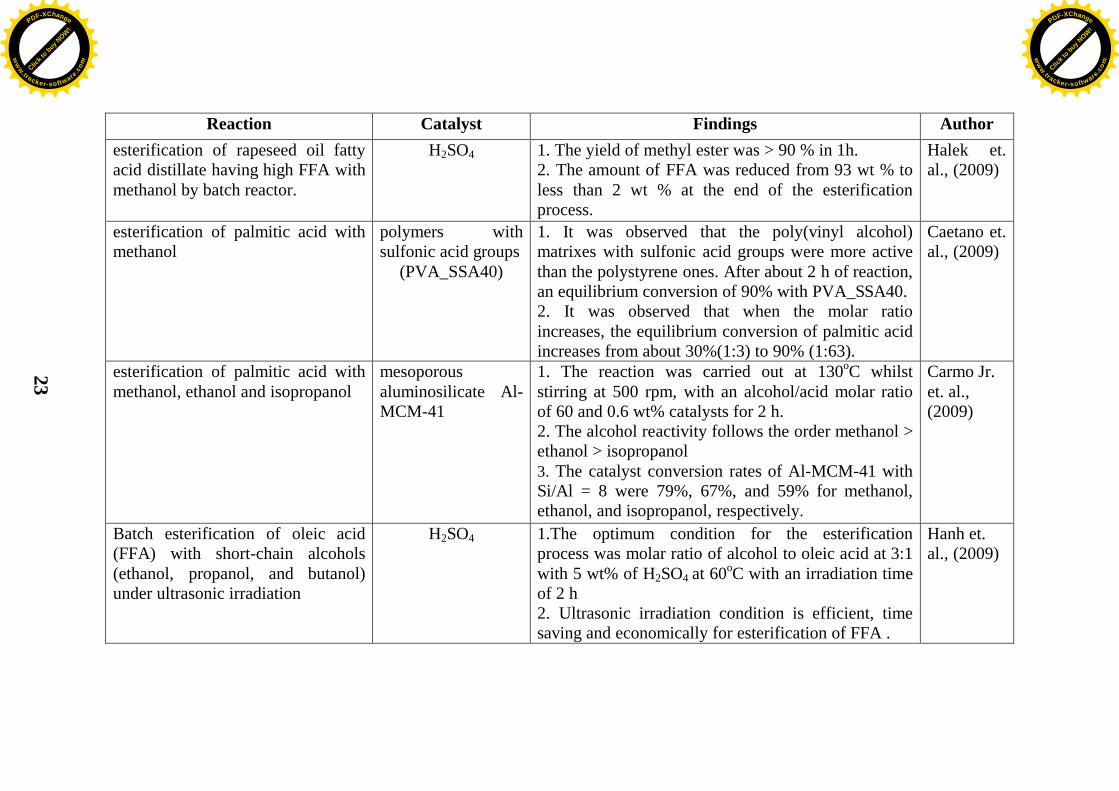
23
Reaction Catalyst Findings Author esterification of rapeseed oil fatty acid distillate having high FFA with methanol by batch reactor.
H2SO4 1. The yield of methyl ester was > 90 % in 1h. 2. The amount of FFA was reduced from 93 wt % to less than 2 wt % at the end of the esterification process.
Halek et. al., (2009)
esterification of palmitic acid with methanol
polymers with sulfonic acid groups
(PVA_SSA40)
1. It was observed that the poly(vinyl alcohol) matrixes with sulfonic acid groups were more active than the polystyrene ones. After about 2 h of reaction, an equilibrium conversion of 90% with PVA_SSA40. 2. It was observed that when the molar ratio increases, the equilibrium conversion of palmitic acid increases from about 30%(1:3) to 90% (1:63).
Caetano et. al., (2009)
esterification of palmitic acid with methanol, ethanol and isopropanol
mesoporous aluminosilicate Al-MCM-41
1. The reaction was carried out at 130oC whilst stirring at 500 rpm, with an alcohol/acid molar ratio of 60 and 0.6 wt% catalysts for 2 h. 2. The alcohol reactivity follows the order methanol > ethanol > isopropanol 3. The catalyst conversion rates of Al-MCM-41 with Si/Al = 8 were 79%, 67%, and 59% for methanol, ethanol, and isopropanol, respectively.
Carmo Jr. et. al., (2009)
Batch esterification of oleic acid (FFA) with short-chain alcohols (ethanol, propanol, and butanol) under ultrasonic irradiation
H2SO4 1.The optimum condition for the esterification process was molar ratio of alcohol to oleic acid at 3:1 with 5 wt% of H2SO4 at 60oC with an irradiation time of 2 h 2. Ultrasonic irradiation condition is efficient, time saving and economically for esterification of FFA .
Hanh et. al., (2009)
Click t
o buy NOW!
PDF-XChange
ww
w.tracker-software.c
om Click t
o buy NOW!
PDF-XChange
ww
w.tracker-software
.com
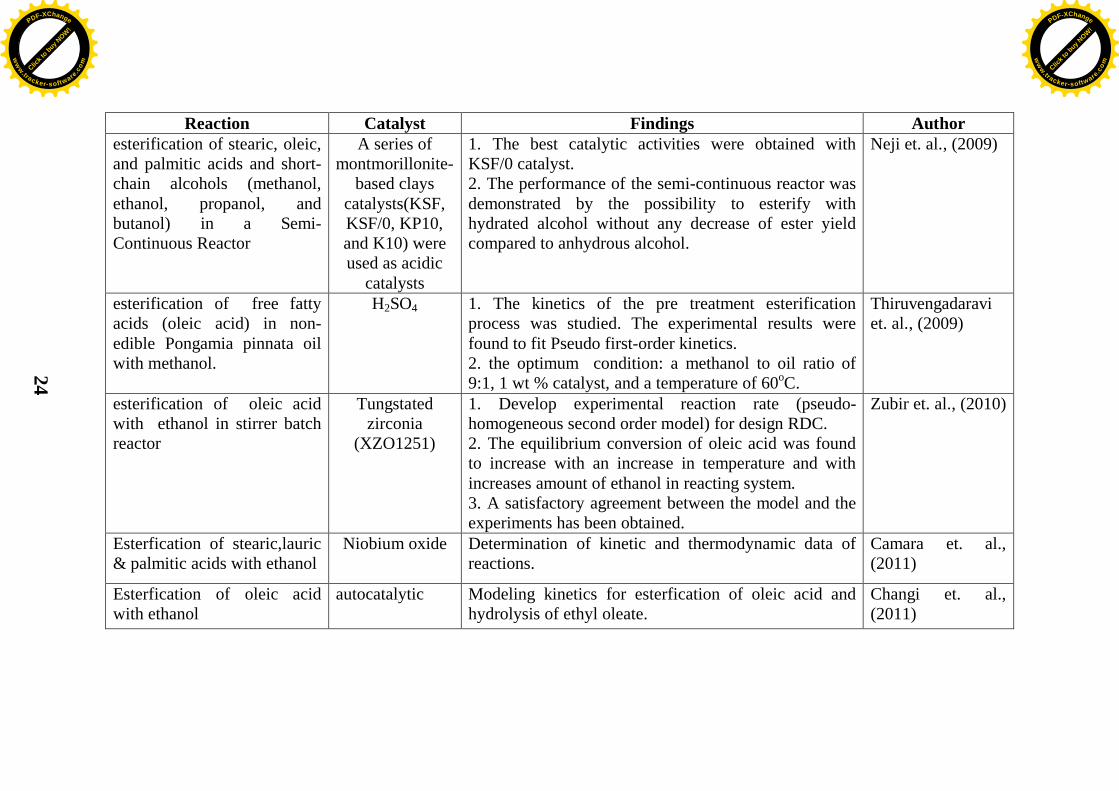
24
Reaction Catalyst Findings Author esterification of stearic, oleic, and palmitic acids and short-chain alcohols (methanol, ethanol, propanol, and butanol) in a Semi-Continuous Reactor
A series of montmorillonite-
based clays catalysts(KSF, KSF/0, KP10, and K10) were used as acidic
catalysts
1. The best catalytic activities were obtained with KSF/0 catalyst. 2. The performance of the semi-continuous reactor was demonstrated by the possibility to esterify with hydrated alcohol without any decrease of ester yield compared to anhydrous alcohol.
Neji et. al., (2009)
esterification of free fatty acids (oleic acid) in non-edible Pongamia pinnata oil with methanol.
H2SO4 1. The kinetics of the pre treatment esterification process was studied. The experimental results were found to fit Pseudo first-order kinetics. 2. the optimum condition: a methanol to oil ratio of 9:1, 1 wt % catalyst, and a temperature of 60oC.
Thiruvengadaravi et. al., (2009)
esterification of oleic acid with ethanol in stirrer batch reactor
Tungstated zirconia
(XZO1251)
1. Develop experimental reaction rate (pseudo-homogeneous second order model) for design RDC. 2. The equilibrium conversion of oleic acid was found to increase with an increase in temperature and with increases amount of ethanol in reacting system. 3. A satisfactory agreement between the model and the experiments has been obtained.
Zubir et. al., (2010)
Esterfication of stearic,lauric & palmitic acids with ethanol
Niobium oxide Determination of kinetic and thermodynamic data of reactions.
Camara et. al., (2011)
Esterfication of oleic acid with ethanol
autocatalytic Modeling kinetics for esterfication of oleic acid and hydrolysis of ethyl oleate.
Changi et. al., (2011)
Click t
o buy NOW!
PDF-XChange
ww
w.tracker-software.c
om Click t
o buy NOW!
PDF-XChange
ww
w.tracker-software
.com
25
2.3.3 Two Step Process A combined strategy called the two-stage process can be used to maximize
the amount of biodiesel produced, while minimizing the amount of soap produced.
The first stage is acid-catalyzed esterification of the free fatty acids. This is
followed by base-catalyzed transesterification. This approach is especially effective
for waste vegetable oil and animal fats, which have high free fatty acid content.
For non catalytic reaction supercritical technology is the one-step method
(Saka process) and the two-step method (Saka-Dadan process) is by supercritical
methanol technology. These studies demonstrated that supercritical methanol has
the ability to convert oils/fats consisting of triglycerides and free fatty acids into
FAME through transesterification and methyl esterification, respectively, without
any catalyst. This one-step method was proven to be much simpler process
achieving higher yield of FAME, compared with the alkali-catalyzed method, to
improve the biodiesel quality, another reaction route was also developed by the two-
step method. This process consists of hydrolysis step for oils/fats to fatty acids in
subcritical water and subsequent methyl esterification to FAME in supercritical
methanol. These new methods are highly tolerant against the presence of water in
oils/fats, thus, being applicable for various oils/fats including their wastes for
biodiesel production (Saka et. al., 2006a and Isayama et. al., 2008). Table 2.3 shows
the previous studies on biodiesel production by two step process.
Click t
o buy NOW!
PDF-XChange
ww
w.tracker-software.c
om Click t
o buy NOW!
PDF-XChange
ww
w.tracker-software
.com
28
2.4 Characterization of Biodiesel The biodiesel esters were characterized according to their physical and
chemical properties. 2.4.1 Physical Characterization
The esters were extensively characterized for its physical properties such as
viscosity, heating value, cloud point, pour point, boiling point distribution, flash
point and lubricity property. 1- Viscosity: Is the most important property of biodiesels since it affects the
operation of fuel injection equipment, particularly at low temperatures when an
increase in viscosity affects the fluidity of the fuel. High viscosity leads to poorer
atomization of the fuel spray and less accurate operation of the fuel injectors. The
lower the viscosity of the biodiesel, the easier it is to pump and atomize and achieve
finer droplets. The conversion of triglycerides into methyl or ethyl esters through
the transesterification process reduces the molecular weight to one third that of the
triglyceride and reduces the viscosity by a factor of about eight. Viscosities show
the same trends as with the tallow biodiesels higher than the soybean and rapeseed
biodiesels. Biodiesels have a viscosity close to that of diesel fuels, as the oil
temperature increases its viscosity decreases. The ester content was determined through kinematic viscosity at 40°C using
the correlation of Felizardo et. al., (2006):
85.162ln*055.45%FAME
The biodiesel kinamatic viscosity according to ASTM must be between the
ranges 1.9-6 cSt (ASTM D 445).
2- Heating Value: The heating value (also referred to as energy content) of
diesel fuel is the heat of combustion, the heat released when a known quantity of
…(2.8)
Click t
o buy NOW!
PDF-XChange
ww
w.tracker-software.c
om Click t
o buy NOW!
PDF-XChange
ww
w.tracker-software
.com
29
fuel is burned under specific conditions, is another important property of an ester as
it is aimed for use as a diesel fuel substitute. The heating value for experimental
uses is calculated using the equation of Issariyakul (2006):
1000184.4*3.2)2470*(
WLVTHV
For higher heating value (HHV) an equation was developed by Demirbas
(1998) using iodine value (IV) and saponification value (SV) (Enweremadu et. al.,
2010):
)*041.0()*015.0(43.49 SVIVHHV
3- Cloud Point and Pour Point: Cloud point is the temperature at which a
cloud of wax crystals first appears in the oil when it is cooled. Pour point is the
lowest temperature at which the oil specimen can still be moved. Cloud point and
pour point are used to measure the cold temperature usability of an ester as a fuel
(Issariyakul 2006).
4- Boiling Point: Is an important parameter for biodiesel as a fuel to be used
in a diesel engine. Boiling point can be used to indicate the degree of contamination
by high boiling point materials such as un-reacted acylglycerols (Issariyakul 2006).
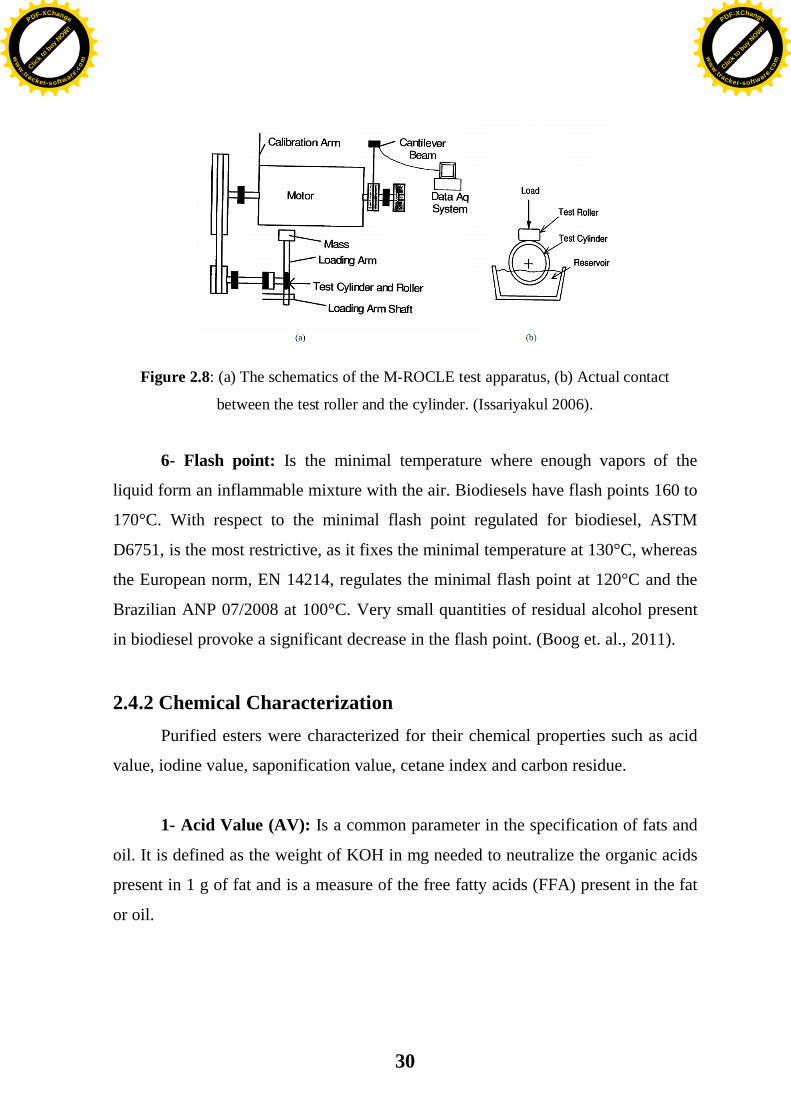
5- Lubricity: Lubricity of the esters was measured by means of the Munson
Roller on Cylinder Lubricity Evaluator (M-ROCLE). The M-ROCLE test apparatus
is shown in Figure 2.8. The reaction torque was proportional to the friction force
and was used to calculate the coefficient of friction. The image of wear scar area
produced on the test roller was transferred to image processing software to measure
wear scar area. The lubricity number (LN) was determined from steady state contact
stress, Hertzian theoretical elastic contact stress, and coefficient of friction. The
higher value of the lubricity number indicates the better lubricating property of the
fuel (Issariyakul 2006).
…(2.9)
…(2.10)
Click t
o buy NOW!
PDF-XChange
ww
w.tracker-software.c
om Click t
o buy NOW!
PDF-XChange
ww
w.tracker-software
.com
30
Figure 2.8: (a) The schematics of the M-ROCLE test apparatus, (b) Actual contact
between the test roller and the cylinder. (Issariyakul 2006).
6- Flash point: Is the minimal temperature where enough vapors of the
liquid form an inflammable mixture with the air. Biodiesels have flash points 160 to
170°C. With respect to the minimal flash point regulated for biodiesel, ASTM
D6751, is the most restrictive, as it fixes the minimal temperature at 130°C, whereas
the European norm, EN 14214, regulates the minimal flash point at 120°C and the
Brazilian ANP 07/2008 at 100°C. Very small quantities of residual alcohol present
in biodiesel provoke a significant decrease in the flash point. (Boog et. al., 2011).
2.4.2 Chemical Characterization Purified esters were characterized for their chemical properties such as acid
value, iodine value, saponification value, cetane index and carbon residue.
1- Acid Value (AV): Is a common parameter in the specification of fats and
oil. It is defined as the weight of KOH in mg needed to neutralize the organic acids
present in 1 g of fat and is a measure of the free fatty acids (FFA) present in the fat
or oil.
Click t
o buy NOW!
PDF-XChange
ww
w.tracker-software.c
om Click t
o buy NOW!
PDF-XChange
ww
w.tracker-software
.com

31
2- Saponification Value (SV): Saponification value is defined as the amount
of alkali necessary to saponify a definite quantity of the sample.
Saponification value of oils can either noted from the literature or calculated
from the empirical equations (Azam et. al., 2005):
Wii MASV /)*560(
3- Iodine Value (IV): The iodine value is a measure of unsaturation of oils
and is expressed in terms of the number of centigrams (cg) of iodine absorbed per g
of sample (% iodine absorbed). When unsaturated oil is heated, polymerization of
the triglyceride occurs which leads to gum formation. Also, unsaturated compounds
are susceptible to oxidation when exposed to air, thereby degrading the oil quality.
The higher iodine value indicates the higher degree of unsaturation of the
corresponding oil.
Iodine value of oils can either noted from the literature or calculated from the
empirical equations (Azam et. al., 2005):
Wii MADIV /)**254(
4- Cetane Number (CN): Is a measure of ignition quality or ignition delay and is
related to the time required for a liquid fuel to ignite after injection into a
compression ignition engine. CN is based on two compounds, namely, hexadecane,
with a cetane of 100, and heptamethylnonane, with a cetane of 15. The CN scale
also shows that straight-chain, saturated hydrocarbons have higher CNs than
branched-chain or aromatic compounds of similar molecular weight and number of
carbon atoms. The longer the fatty acid carbon chains and the more saturated the
molecules, the higher the CN. The CN of biofuel from animal fats is higher than
those of vegetable oils (Tenaw 2010).
Cetane index determination was done using the empirical formula developed
by Krisnangkura (1986):
IVSVCI *225.0/54583.46
…(2.11)
…(2.12)
…(2.13)
Click t
o buy NOW!
PDF-XChange
ww
w.tracker-software.c
om Click t
o buy NOW!
PDF-XChange
ww
w.tracker-software
.com
32
Cetane number is not much different from cetane index and calculated using
equation by Patel (1999):
5.1CICN to 6.2
5- Carbon Residue: The carbon residue is a measure of how much residual
carbon remains after combustion. Carbon residue is formed by decomposition and
subsequent pyrolysis of fuel components can clog the fuel injectors. The maximum
allowable carbon residue for biodiesel is 0.05 wt% (Sanford et. al., 2009).
2.5 Experimental Design The classical method (full factorial design) used in statistical design of
experiments requires a large number of experiments to be carried out when the
number of process parameters increases. For a full factorial design, the number of
possible designs of experiments, N, is N=Lm, where L is the number of levels for
each factor and m is the number of factors. For example, to study the effect of four
parameters (molar ratio, amount of catalyst, reaction time, and reaction temperature)
at three different levels, 81 (34) different combinations of parameters are possible.
Also, it is very difficult to identify and quantify the interactions among different
parameters and the contribution of individual parameters. Hence, there was an
absolute need for a design of experiments strategy that can reduce the number of
experiments as well as identify and quantify the interactions among different
parameters affecting the process. Taguchi (1986) designed a system of specific
orthogonal arrays to be chosen and applied in suitable conditions to describe a large
number of experimental situations. This fractional factorial design optimization
technique uses the Taguchi orthogonal design matrix, where only a fraction of the
combination of variables are considered, and hence, minimizing the number of
experiments while covering a wide range of operating conditions and keeping all
the information/data intact. The quantified and comparative analysis of the effect of
parameters is the second advantage of this approach. Usually, with the aid of range
analysis, analysis of variance (ANOVA), or analysis of signal-to-noise ratio (S/N
…(2.14)
Click t
o buy NOW!
PDF-XChange
ww
w.tracker-software.c
om Click t
o buy NOW!
PDF-XChange
ww
w.tracker-software
.com

33
ratio), the key factors that have significant effects on the response can be identified
and the best factor levels for a given process can be determined from the
predetermined factor levels. The Taguchi methodology uses several design arrays,
such as L4, L8, L9, L12, L16, L18, L27, and L64, which focuses on the main
effects and increases the efficiency and reproducibility of small-scale experiments.
Finally, a confirmation experiment is conducted to verify the best process
parameters obtained from the parameter design (Mahamuni et. al., 2010).
2.6 Reactive Distillation Development for Biodiesel Production Organic esters are gaining increased importance in a number of industrial
applications, primarily as solvents to replace petroleum-derived materials, and thus
hold promise as a major class of bio-based commodity products (Decot et. al.,
2007).
At present, the esterification of fatty acid and alcohol into fatty acid ester
(biodiesel) is usually conducted in a batch reactor, However production biodiesel
from esterification reaction in the conventional batch reactor has many problems
because of its low conversion, heavy capital investments and high energy costs so
this process is not economically (Kusmiyati et. al., 2010). Biodiesel is traditionally produced by batch process using well mixed stirred
tank and a series of separation equipments. Though simple, batch process is slow,
labor intensive, and costly for a very-large scale process (Kiss et. al., 2006, Singh
et. al, 2004). In view of that, biodiesel manufacturing at large scale asks for the
development of the more ground-breaking and efficient processes, particularly the
continuous process which able to reduce cost reaction cleaning and total processing
time. Several types of continuous-flow processes for biodiesel preparation have
been introduced (Bisowarno et. al., 2004) However, most existing continuous
processes still employ reaction and product separation occurs separately
conventional configuration in which this conventional configuration is not
economical since it requires high capital as well as operation and energy cost.
Hence, to acquire a more effective and efficient process system, development of a
Click t
o buy NOW!
PDF-XChange
ww
w.tracker-software.c
om Click t
o buy NOW!
PDF-XChange
ww
w.tracker-software
.com
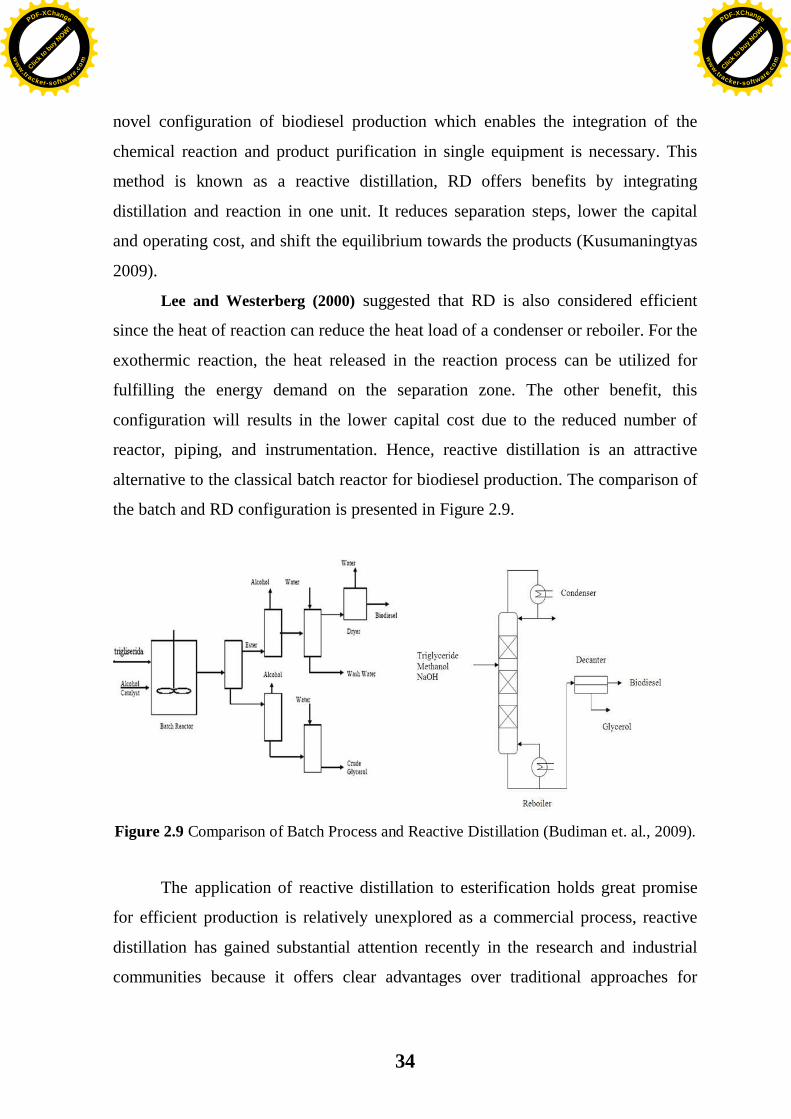
34
novel configuration of biodiesel production which enables the integration of the
chemical reaction and product purification in single equipment is necessary. This
method is known as a reactive distillation, RD offers benefits by integrating
distillation and reaction in one unit. It reduces separation steps, lower the capital
and operating cost, and shift the equilibrium towards the products (Kusumaningtyas
2009).
Lee and Westerberg (2000) suggested that RD is also considered efficient
since the heat of reaction can reduce the heat load of a condenser or reboiler. For the
exothermic reaction, the heat released in the reaction process can be utilized for
fulfilling the energy demand on the separation zone. The other benefit, this
configuration will results in the lower capital cost due to the reduced number of
reactor, piping, and instrumentation. Hence, reactive distillation is an attractive
alternative to the classical batch reactor for biodiesel production. The comparison of
the batch and RD configuration is presented in Figure 2.9.
Figure 2.9 Comparison of Batch Process and Reactive Distillation (Budiman et. al., 2009).
The application of reactive distillation to esterification holds great promise
for efficient production is relatively unexplored as a commercial process, reactive
distillation has gained substantial attention recently in the research and industrial
communities because it offers clear advantages over traditional approaches for
Click t
o buy NOW!
PDF-XChange
ww
w.tracker-software.c
om Click t
o buy NOW!
PDF-XChange
ww
w.tracker-software
.com

35
carrying out equilibrium-limited chemical reactions. Candidate reactions for
reactive distillation are characterized by a substantial difference in volatility
between reaction products, such that removal of one product by distillation drives
the reaction to completion. Reactions are often catalyzed, either by solid catalysts
packed within the distillation column or by addition of homogeneous catalysts
(acids, bases, metal complexes, etc.) added to the column feed (Decot et al., 2007).
Reactive distillation column consists of there basic elements: rectifying
section on the top, reactive section in the middle and stripping section at the bottom.
The reactive distillation is featured with its merits not only in promoting the
reaction conversion, but also reducing both capital and operational cost as its
multifunctional nature.
Since the RD process is first appeared in 1932 for production of ethyl acetate
and lately become new focus in 1980’s, since Eastman Chemical Company owned
commercial RD process for production of methyl acetate. Later on, extensive
researches on RD process appeared in the literature. At the same time, successful
commercial processes that applied reactive distillation are installed for producing
various chemicals such as methyl tert-butyl ether, (MTBE), cumene, ethyl-benzene
and 3-methyl-1-butene, etc. In fact, practices of using RD for production methyl
acetate and MTBE demonstrate its ability to render cost effectiveness and
compactness to chemical plant.
2.7 Literature Review of RD for Biodiesel Production
2.7.1 Continuous Reactive Distillation (CRD) for Biodiesel
Production: Most of CRD the oil (or fatty acid) is fed above and methanol below the
reactive zone respectively, to reduce the amount of oil (or fatty acid) in the final
product. The reflux ratio is very low (RR = 0.01-0.1) as returning water to the
column is detrimental to chemical equilibrium. Water by-product is removed in top,
then separated in a decanter from which only the fatty acids are recycled to the
Click t
o buy NOW!
PDF-XChange
ww
w.tracker-software.c
om Click t
o buy NOW!
PDF-XChange
ww
w.tracker-software
.com

36
column while water is recovered at high purity and hence reusable as industrial
water on the same site.
Singh et al., (2004) prepared a biodiesel from canola oil and methanol through
transesterification process in the presence of KOH as a catalyst. In this study
developed a novel reactor system using reactive distillation techniques and studied
the effect of reduced methanol to oil ratio on over all quality of biodiesel product
and the efficiency of such an RD reactor. Product parameters such as methyl ester
content, viscosity, total glycerol, and methanol content were analyzed as per ASTM
methods. Preliminary results showed that process parameters of methanol to oil
molar ratio of 4:1 and a column temperature of 65oC produced a biodiesel that met
the ASTM standards for the total glycerol and viscosity.
Matallana et. al., (2005) investigated theoretically the possibility of producing
the corresponding ester with oleic acid and lauric acid and performed a simulation
of a equilibrium model by using Aspen plus and PRO/II.
He (2006) developed and studied two stages, in the first stage, a novel reactor
system using a manufactured (glass) reactive distillation (RD) column to proof the
product still produce a quality fuel when reduce the use of excess alcohol. The
second stage, scale-up the system to a production rate of 80 to 100 ml/min and
measured its effectiveness. The author designed a 20 sieve-tray RD reactor system
to produce biodiesel and to study products parameters such as methyl ester content
and total glycerol. The results of process parameters of methanol-to-oil molar ratio
of 4:1 and column temperature of 65oC produced a biodiesel that was 90.71%
converted in 5 minutes.
Kiss et. al., (2006) developed a sustainable esterfication process based on catalytic
reactive distillation by using the sulfated metal oxides (solid acid catalyst) as green
catalyst such as niobic acid, sulfated zirconia, sulfated titania and sulfated oxide, ,
this catalyst is very suitable than zeolite and resins because catalyst activity and
surface hydrophobicity, reaction pockets are created inside a hydrophobic
enivironment, where the fatty acid molecules can be absorbed and react further.
zeolites have small pores are not suitable for biodiesel manufacturing, because of
Click t
o buy NOW!
PDF-XChange
ww
w.tracker-software.c
om Click t
o buy NOW!
PDF-XChange
ww
w.tracker-software
.com
37
the diffusion limitations of the large fatty acids and ester molecules. Ion exchange
resins, such as Nifon and Amberlyst, are active strong acids, but have a low thermal
stability.
Fortin et. al., (2008) designed a lab-scale flexible continuous flow reactive
distillation unit for research on biodiesel production including methanol recovery.
Kiss et. al., (2009) proposed a novel energy- efficient integrated production of
biodiesel from hydrous bioethanol, by combining the advantages of using solid
catalysts with the integration of reaction and separation. Rigorous simulations
embedding experiments results were performed using Aspen Tech Aspen Plus to
design the separative reactor and evaluate the overall of the process. The RD
column was simulated using the rigorous RADFRAC unit with rateSep (rate-based)
model, and considering three phases balance. Sensitivity analysis was used to
determine the optima, range of the operating parameters. The results are given for a
plant producing 10 ktpy biodiesel ( > 99.9wt %) from hydrous bioethanol (96wt%)
and waste vegetable oil with high free fatty acids content ( 100%), using solid
acids as green catalysts.
Galindo et. al., (2009) explored the esterfication of lauric acid and methanol
using a thermally coupled distillation sequence with a side rectifier and the petlyuk
distillation column and founded that the thermally coupled distillation sequence
involving a side rectifier can produce biodiesel with a high purity (around 0.999)
and also pure water, and the excess of methanol is recovered in a side rectifier. The
results indicate that energy consumption of the complex distillation sequence with a
side rectifier can be reduced significantly by varying operational conditions. These
reductions in energy consumption can be interpreted as reductions in carbon dioxide
emissions.
Thotla et. al., (2009) demonstrated the applicability of reactive distillation with
side draw, for certain industrially important reactions. For the reacting systems
which involve products with intermediate volatility, a side draw facilitates its in situ
removal and enhances either conversion or selectivity. It further reduces the
downstream processing in some cases the concept is proved for three representative
Click t
o buy NOW!
PDF-XChange
ww
w.tracker-software.c
om Click t
o buy NOW!
PDF-XChange
ww
w.tracker-software
.com

38
systems, esterfiication of lactic acid, aldol condensation of acetone and for
esterification of fatty acid by methanol.
Budiman et. al., (2009) applied a laboratory scale reactive distillation for the
biodiesel synthesis from the Indonesian refined jatropha oil in the presence of
NaOH catalyst. The experimental investigation demonstrated the effects of the
temperature, catalyst loading, and molar ratio of the reactants. The best result was
achieved on the process conducted at the reaction temperature of 65oC with molar
ratio of methanol to triglycerides of 10:1 and catalyst loading of 0.75 wt% oil. The
reaction conversion was 94.83% and methyl ester content of the product was
99.27%. The fuel characteristic of biodiesel agreed with the Indonesian national
standard and ASTM specification.
N. Da Lima Da Siliva et. al., (2010a) present an efficient process using reactive
distillation columns applied to biodiesel production from soybean oil and
bioethanol. Different variables affect the conventional biodiesel production process
such as catalyst concentration, reaction temperature, level of agitation,
ethanol/soybean oil molar ratio, reaction time, and raw material type. Also in this
study the experimental design was used to optimize the following process variables:
the catalyst concentration (from 0.5wt% to 1.5wt%), the ethanol/soybean oil molar
ratio (from 3:1 to 9:1). The reactive column reflux rate was 83 ml/min, and the
reaction time was 6 min.
Santander et. al., (2010) studied the surface response methodology and the
Aspen Plus software were used for simulating the castor oil biodiesel production by
reactive distillation with the aim of obtaining a deep understanding about the
process, finding the best conditions for producing the largest amount of fatty acid
esters and assess its vialability.
Mueanmas et. al., (2010) proposed the feasibility study of biodiesel production
from palm oil by transesterification using reactive distillation. The hypothesis is to
reduce the amount of alcohol in the feed stream closing to its stoichiometric ratio
with oil, this is due to the less energy used in the methanol recovery for the
processes. The effects of process parameters were conducted by lab scale RD
Click t
o buy NOW!
PDF-XChange
ww
w.tracker-software.c
om Click t
o buy NOW!
PDF-XChange
ww
w.tracker-software
.com
39
packed column. The results indicated that process parameters of 900 ml/hr flow
rate, reboiler temperature 90°C with 4:1 molar ratio of methanol to oil and residence
time of 5 minutes in the column produced 92.75 percent biodiesel purity.
Castro (2011) proposed the use of reactive distillation and thermally coupled
reactive distillation con gurations to produce biodiesel fuel by the supercritical
methanol method. First-order kinetics is used to represent the esteri cation reaction
of oleic acid with methanol, obtaining high conversions in a single shell.
2.7.2 Batch Reactive Distillation (BRD) for Esterification Reaction: Batch reactive distillation (BRD) is a simple experimental tool to quickly
evaluate the feasibility of reactive distillation for a reaction of interest.
Maya et. al., (2006) Fischer esterification of the mixture of palm fatty acids with
isopropanol can be achieved in 80% conversion, under conditions of batch reactive
distillation and methanesulphonic acid as catalyst.
Kumar and Mahjani (2007) evaluated the applicability of batch reactive
distillation for esterification of lactic acid with n-butanol to synthesize n-butyl
lactate in the presence of cation exchange resins as a catalyst, an equilibrium stage
model is formulated, and simulation results were compared with the experimental
results.
Edreder et. al. (2010) evaluated the performance of BRD to produced lactic acid
by hydrolysis reaction of methyl lactate. Minimum time optimization problem was
developed incorporating a process model within gPROMS software.
Kusmiyati et. al., (2010) determined the best conditions for biodiesel production
from the esterification reaction of oleic acid, methanol and sulfuric acid as a catalyst
by batch reactive distillation, and the effect of several variables was studied such as
feed molar ratio, catalyst amount, time of reaction and reaction temperaure.
Biodiesel product from oleic acid was analyzed by ASTM, the results show that the
biodiesel produced has the quality required to be a diesel substitute.
Batch reactive distillation runs are less time consuming and use less amount of
chemicals. Hence, these experiments can be performed as the first step in process
Click t
o buy NOW!
PDF-XChange
ww
w.tracker-software.c
om Click t
o buy NOW!
PDF-XChange
ww
w.tracker-software
.com
40
development to quickly ascertain the potential of RD. Therefore, in the present
work batch reactive distillation is considered for the production of biodiesel.
2.8 Thermodynamic Models
To describe the phase equilibrium of a system of NC components at a
temperature T and pressure P, the vapor phase fugacity is equal to the liquid phase
fugacity for every component (Simith et. al., 2001).
l
i
v
i ff i =1, 2, 3. . . . . NC
The vapor phase fugacity can be written in terms of the vapor phase fugacity
coefficient i , vapor mole fraction iy , and total pressure P as follows.
Pyf ii
v
i
Also the liquid phase fugacity can be written in terms of liquid phase activity
coefficient i , liquid mole fraction ix , and liquid phase properties if as follows.
iiil
i fxf
Where if is calculated using the equation:
RTPPVPf
sati
Lisat
isatii exp
At equilibrium
ii
iii xKy
Where i is given by the equation;
RTPPV sat
iL
isati
ii exp
…(2.15)
…(2.16)
…(2.17)
…(2.18)
…(2.19)
…(2.20)
Click t
o buy NOW!
PDF-XChange
ww
w.tracker-software.c
om Click t
o buy NOW!
PDF-XChange
ww
w.tracker-software
.com

41
At low pressures (up to at least 1 bar), vapor phases usually approximate ideal
gases for which 1satii and Poynting factor which represented by the
exponential differs from unity by only a few parts per thousand. Therefore equation
(2.19) is written as.
i
satii
i xPPy
2.8.1 Ideal Vapor Liquid Equilibrium
Vapor liquid equilibrium is one of the most important fundamental properties
in simulation, optimization and design of any distillation process.
The mixture is called ideal if both liquid and vapor are ideal mixtures of ideal
components, thus in the vapor phase the partial pressure of component satiP is
proportional to its mole fraction in the vapor phase according to Daltons law
(Simith et. al., 2001).
PyP isat
i
The equilibrium relationship for any component is defined as.
i
ii x
yK
For ideal mixture the K values can be predicted from Raoult’s law, where:
PP
xyK
sati
i
ii
2.8.2 Non Ideal Vapor Liquid Equilibrium
For non-ideal mixture additional variables i (activity coefficient) and i
(fugacity coefficient) appears in vapor-liquid equilibrium equation (Simith et. al.,
…(2.21)
…(2.22)
…(2.23)
…(2.24)
Click t
o buy NOW!
PDF-XChange
ww
w.tracker-software.c
om Click t
o buy NOW!
PDF-XChange
ww
w.tracker-software
.com
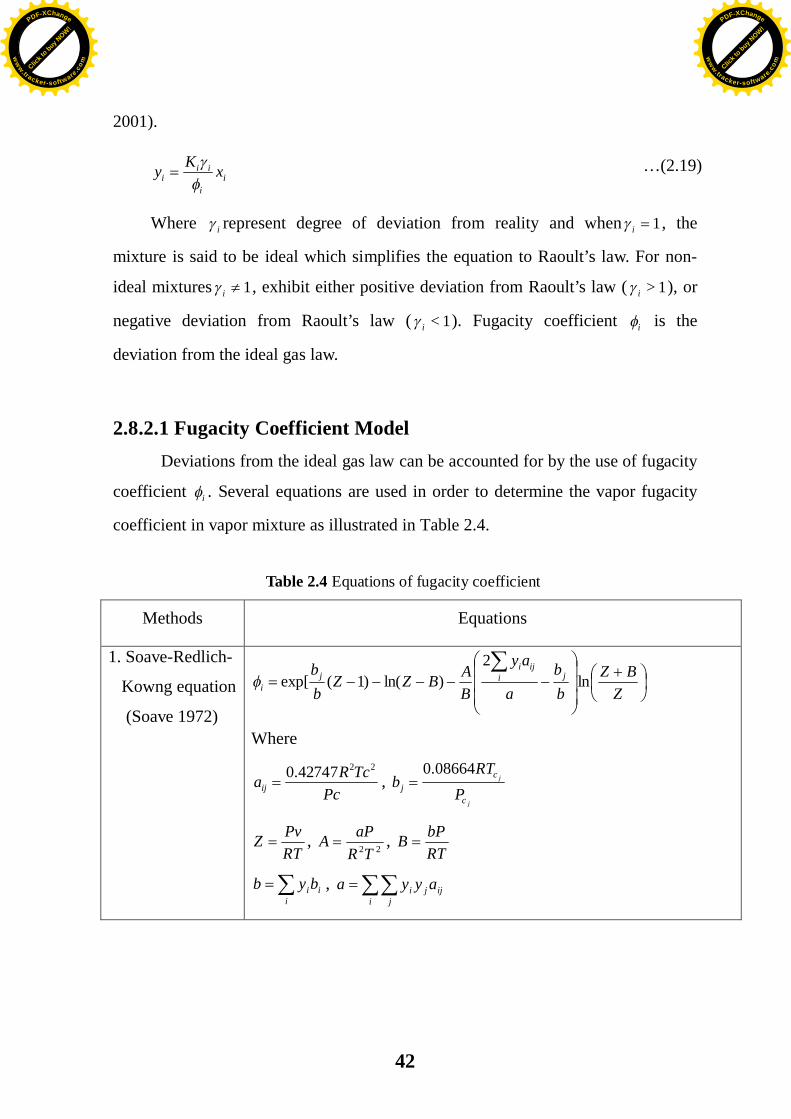
42
2001).
ii
iii xKy
Where i represent degree of deviation from reality and when 1i , the
mixture is said to be ideal which simplifies the equation to Raoult’s law. For non-
ideal mixtures 1i , exhibit either positive deviation from Raoult’s law ( 1>i ), or
negative deviation from Raoult’s law ( 1<i ). Fugacity coefficient i is the
deviation from the ideal gas law.
2.8.2.1 Fugacity Coefficient Model Deviations from the ideal gas law can be accounted for by the use of fugacity
coefficient i . Several equations are used in order to determine the vapor fugacity
coefficient in vapor mixture as illustrated in Table 2.4.
Table 2.4 Equations of fugacity coefficient
Methods Equations
1. Soave-Redlich-
Kowng equation
(Soave 1972) Z
BZbb
a
ay
BABZZ
bb ji
ijij
i ln2
)ln()1(exp[
Where
PcTcRaij
2242747.0 , j
j
c
cj P
RTb
08664.0
RTPvZ , 22TR
aPA , RTbPB
iiibyb ,
i jijji ayya
…(2.19)
Click t
o buy NOW!
PDF-XChange
ww
w.tracker-software.c
om Click t
o buy NOW!
PDF-XChange
ww
w.tracker-software
.com
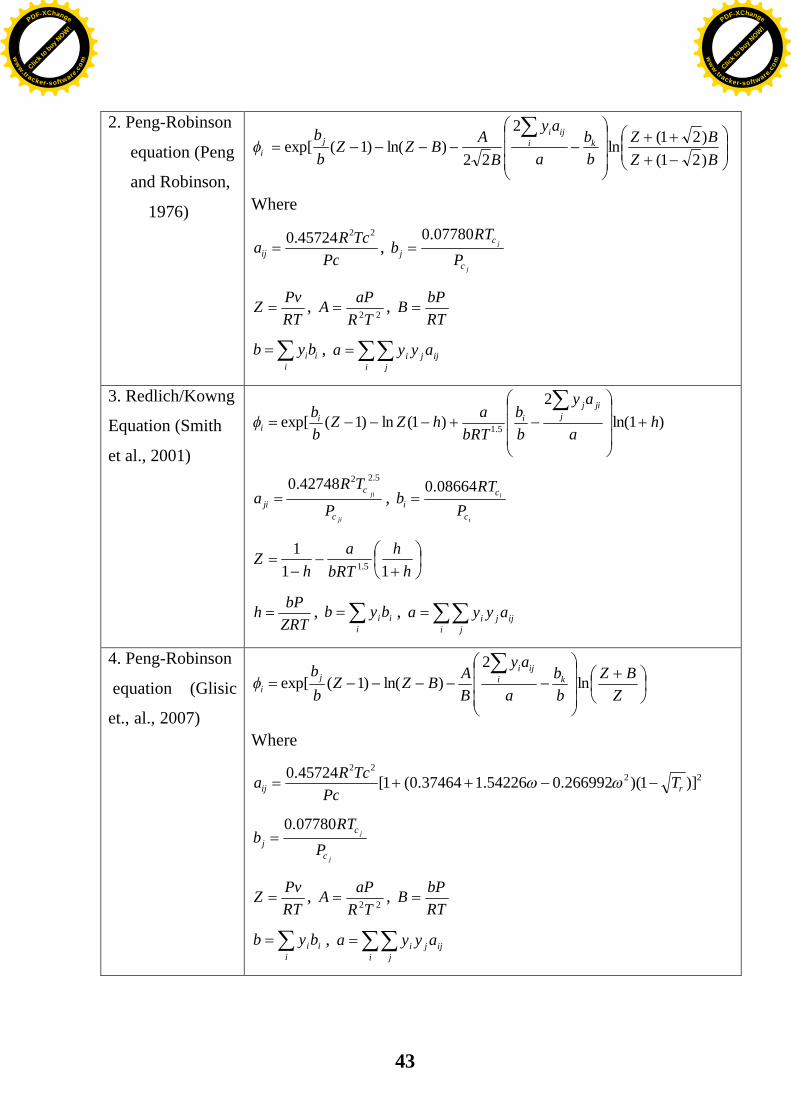
43
2. Peng-Robinson
equation (Peng
and Robinson,
1976)
BZBZ
bb
a
ay
BABZZ
bb ki
ijij
i )21()21(ln
2
22)ln()1(exp[
Where
PcTcRaij
2245724.0 , j
j
c
cj P
RTb
07780.0
RTPvZ , 22TR
aPA , RTbPB
iiibyb ,
i jijji ayya
3. Redlich/Kowng
Equation (Smith
et al., 2001)
)1ln(2
)1(ln)1(exp[ 5.1 ha
ay
bb
bRTahZZ
bb j
jijii
i
ji
ji
c
cji P
TRa
5.2242748.0,
i
i
c
ci P
RTb
08664.0
hh
bRTa
hZ
111
5.1
ZRTbPh ,
iiibyb ,
i jijji ayya
4. Peng-Robinson
equation (Glisic
et., al., 2007) Z
BZbb
a
ay
BABZZ
bb ki
ijij
i ln2
)ln()1(exp[
Where
2222
)]1)(266992.054226.137464.0(1[45724.0rij T
PcTcRa
j
j
c
cj P
RTb
07780.0
RTPvZ , 22TR
aPA , RTbPB
iiibyb ,
i jijji ayya
Click t
o buy NOW!
PDF-XChange
ww
w.tracker-software.c
om Click t
o buy NOW!
PDF-XChange
ww
w.tracker-software
.com
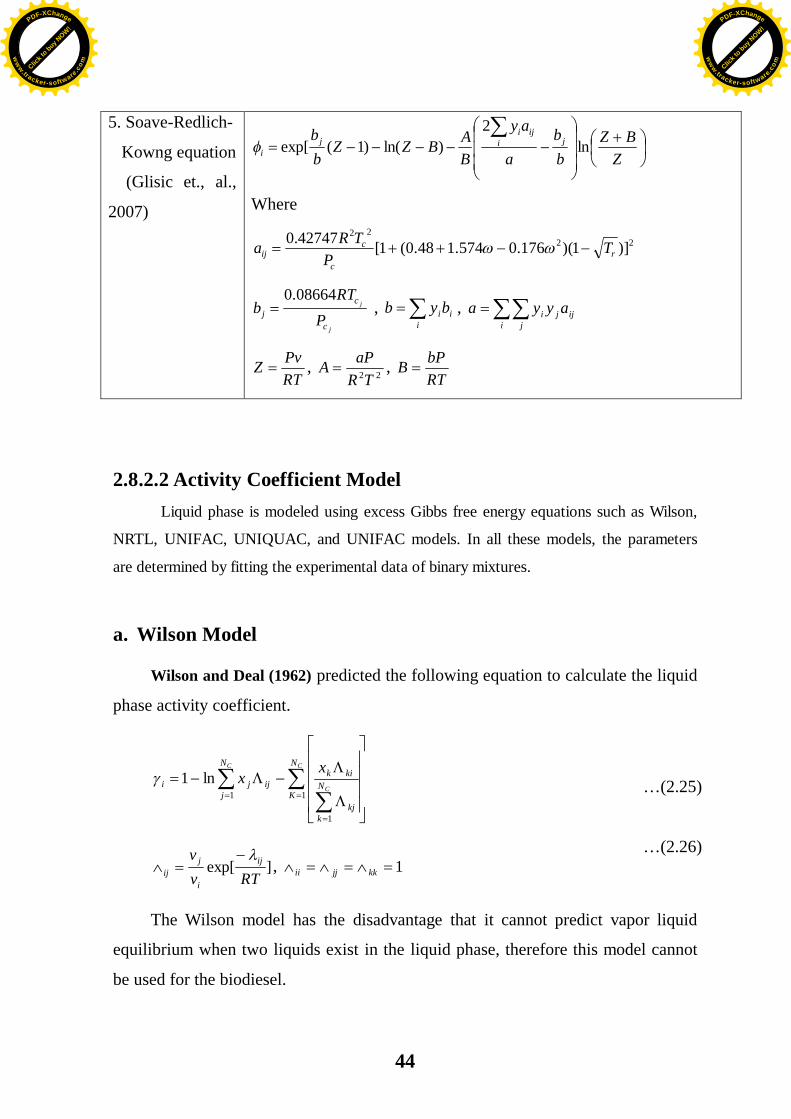
44
5. Soave-Redlich-
Kowng equation
(Glisic et., al.,
2007)
ZBZ
bb
a
ay
BABZZ
bb ji
ijij
i ln2
)ln()1(exp[
Where
2222
)]1)(176.0574.148.0(1[42747.0r
c
cij T
PTRa
j
j
c
cj P
RTb
08664.0 ,
iiibyb ,
i jijji ayya
RTPvZ , 22TR
aPA , RTbPB
2.8.2.2 Activity Coefficient Model Liquid phase is modeled using excess Gibbs free energy equations such as Wilson,
NRTL, UNIFAC, UNIQUAC, and UNIFAC models. In all these models, the parameters
are determined by fitting the experimental data of binary mixtures.
a. Wilson Model
Wilson and Deal (1962) predicted the following equation to calculate the liquid
phase activity coefficient.
C
C
C N
KN
kkj
kikij
N
jji
xx
1
1
1ln1
]exp[RTv
v ij
i
jij , 1kkjjii
The Wilson model has the disadvantage that it cannot predict vapor liquid
equilibrium when two liquids exist in the liquid phase, therefore this model cannot
be used for the biodiesel.
…(2.25)
…(2.26)
Click t
o buy NOW!
PDF-XChange
ww
w.tracker-software.c
om Click t
o buy NOW!
PDF-XChange
ww
w.tracker-software
.com

45
b. NRTL Model
The NRTL (non-random, two liquid model) was developed by Renon and
Prausnitz (1968). This model uses three binary interaction parameters for each
binary pair in multicomponent mixture-pairs. For NC components system, it requires
2)1( CC NN molecular binary pair. This equation is applicable to multicomponent
vapor-liquid, liquid- liquid and vapor-liquid-liquid systems.
The main equation used to calculate liquid phase activity coefficient for NRTL
model is.
C
C
C
CC
C
N
jN
kkjk
N
mmjmmj
ijN
kkjK
ijjN
kkik
N
jjijji
i
Gx
Gx
Gx
Gx
Gx
Gx
1
1
1
11
1ln
c. UNIQUAC Model
Abrams and Prausnitz (1975) developed the UNIQUAC (Universal Quasi
Chemical) activity coefficient model. This model distinguishes two contributions
termed combinational (C) and residual (R).
)(ln)(lnln residualnalcombinatio Ri
Cii
The combinational part basically accounts for non-ideality of a mixture arising
from differences in size and shape of constituent molecular species, whereas the
residual part considers the difference between inter-molecular and intermolecular
interaction energies.
The UNIQUAC equation gives good representation of both vapor-liquid and
liquid-liquid equilibria for binary and multicomponent mixtures containing a variety
of nonelectrolyte components such as hydrocarbons, ketones, esters, amines,
alcohols, nitriles, etc., and water. When well-defined simplifying assumptions are
introduced into the generalized quasi-chemical treatment, the UNIQUAC equation
…(2.27)
…(2.28)
Click t
o buy NOW!
PDF-XChange
ww
w.tracker-software.c
om Click t
o buy NOW!
PDF-XChange
ww
w.tracker-software
.com
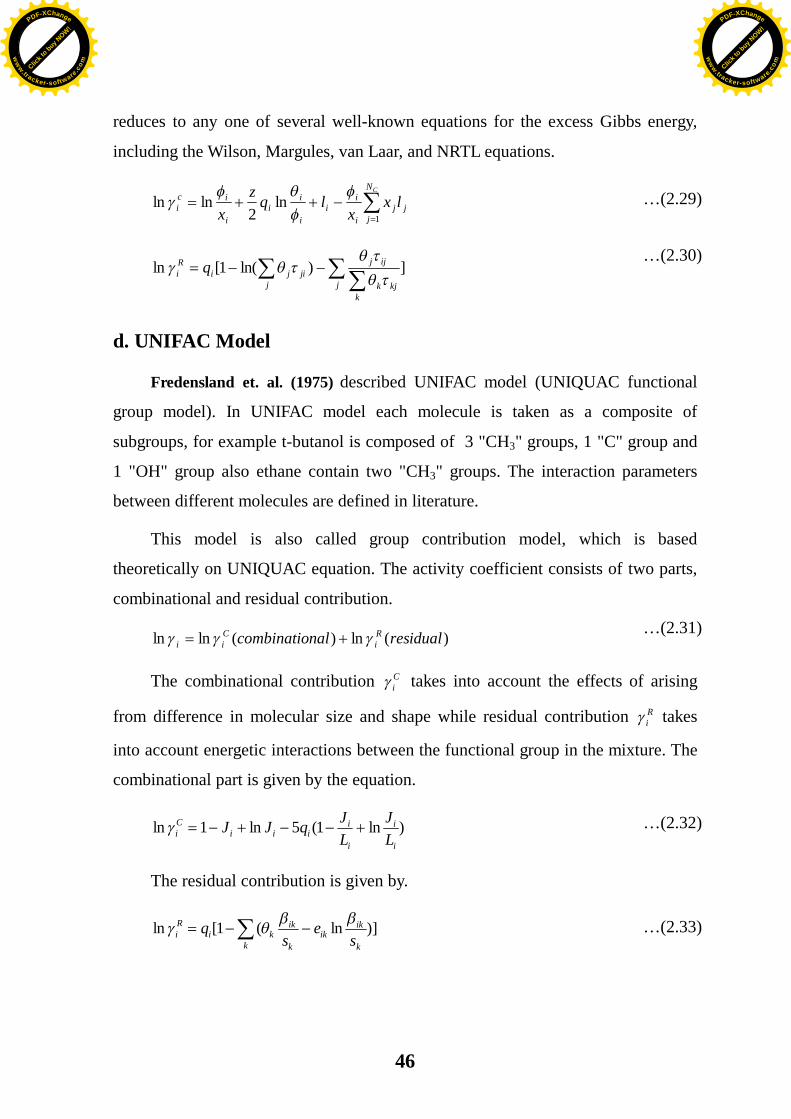
46
reduces to any one of several well-known equations for the excess Gibbs energy,
including the Wilson, Margules, van Laar, and NRTL equations.
CN
jjj
i
ii
i
ii
i
ici lx
xlqz
x 1ln
2lnln
jk
kjk
ijj
jjiji
Ri q ])ln(1[ln
d. UNIFAC Model
Fredensland et. al. (1975) described UNIFAC model (UNIQUAC functional
group model). In UNIFAC model each molecule is taken as a composite of
subgroups, for example t-butanol is composed of 3 "CH3" groups, 1 "C" group and
1 "OH" group also ethane contain two "CH3" groups. The interaction parameters
between different molecules are defined in literature.
This model is also called group contribution model, which is based
theoretically on UNIQUAC equation. The activity coefficient consists of two parts,
combinational and residual contribution.
)(ln)(lnln residualnalcombinatio Ri
Cii
The combinational contribution Ci takes into account the effects of arising
from difference in molecular size and shape while residual contribution Ri takes
into account energetic interactions between the functional group in the mixture. The
combinational part is given by the equation.
)ln1(5ln1lni
i
i
iiii
Ci L
JLJqJJ
The residual contribution is given by.
)]ln(1[lnk
ikik
k
ik
kki
Ri s
es
q
…(2.32)
…(2.31)
…(2.33)
…(2.29)
…(2.30)
Click t
o buy NOW!
PDF-XChange
ww
w.tracker-software.c
om Click t
o buy NOW!
PDF-XChange
ww
w.tracker-software
.com
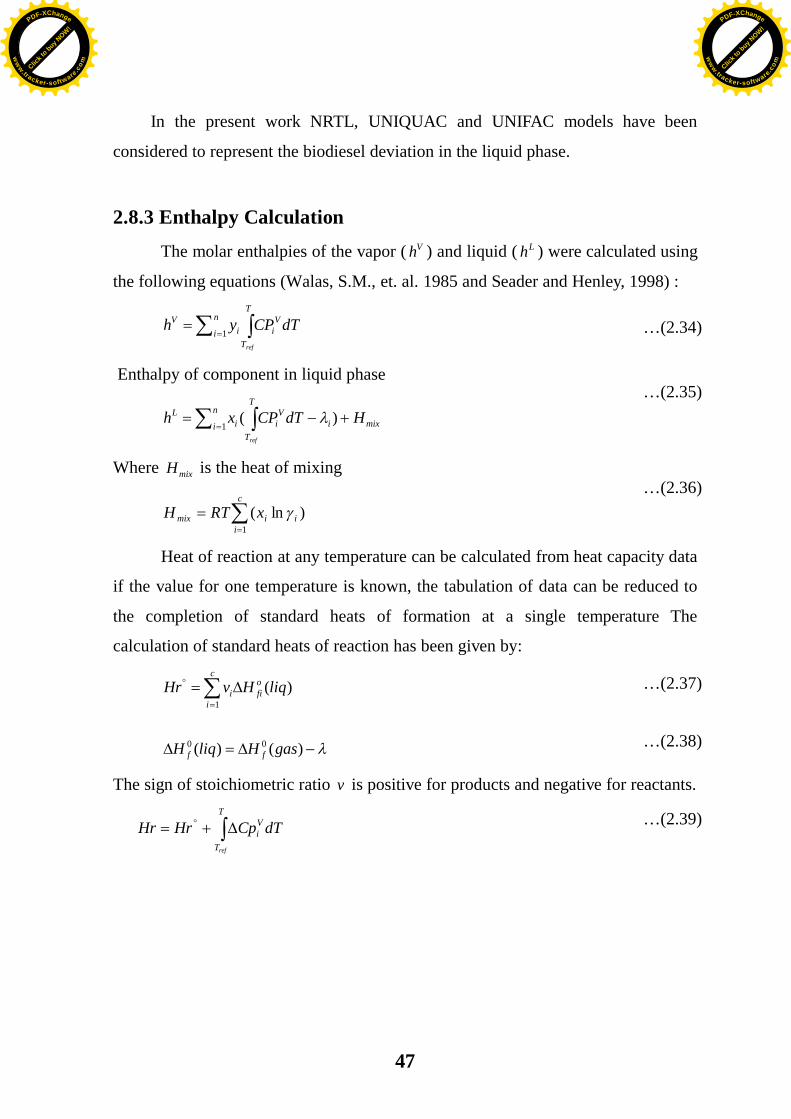
47
In the present work NRTL, UNIQUAC and UNIFAC models have been
considered to represent the biodiesel deviation in the liquid phase.
2.8.3 Enthalpy Calculation The molar enthalpies of the vapor ( Vh ) and liquid ( Lh ) were calculated using
the following equations (Walas, S.M., et. al. 1985 and Seader and Henley, 1998) :
T
T
Vi
n
i iV
ref
dTCPyh1
Enthalpy of component in liquid phase
mixin
i
T
T
Vii
L HdTCPxhref
)(1
Where mixH is the heat of mixing
c
iiimix xRTH
1)ln(
Heat of reaction at any temperature can be calculated from heat capacity data
if the value for one temperature is known, the tabulation of data can be reduced to
the completion of standard heats of formation at a single temperature The
calculation of standard heats of reaction has been given by:
)()(
)(
00
1
gasHliqH
liqHvHr
ff
c
i
ofii
The sign of stoichiometric ratio v is positive for products and negative for reactants.
T
T
Vi
ref
dTCpHrHr
…(2.34)
…(2.35)
…(2.36)
…(2.37)
…(2.39)
…(2.38)
Click t
o buy NOW!
PDF-XChange
ww
w.tracker-software.c
om Click t
o buy NOW!
PDF-XChange
ww
w.tracker-software
.com
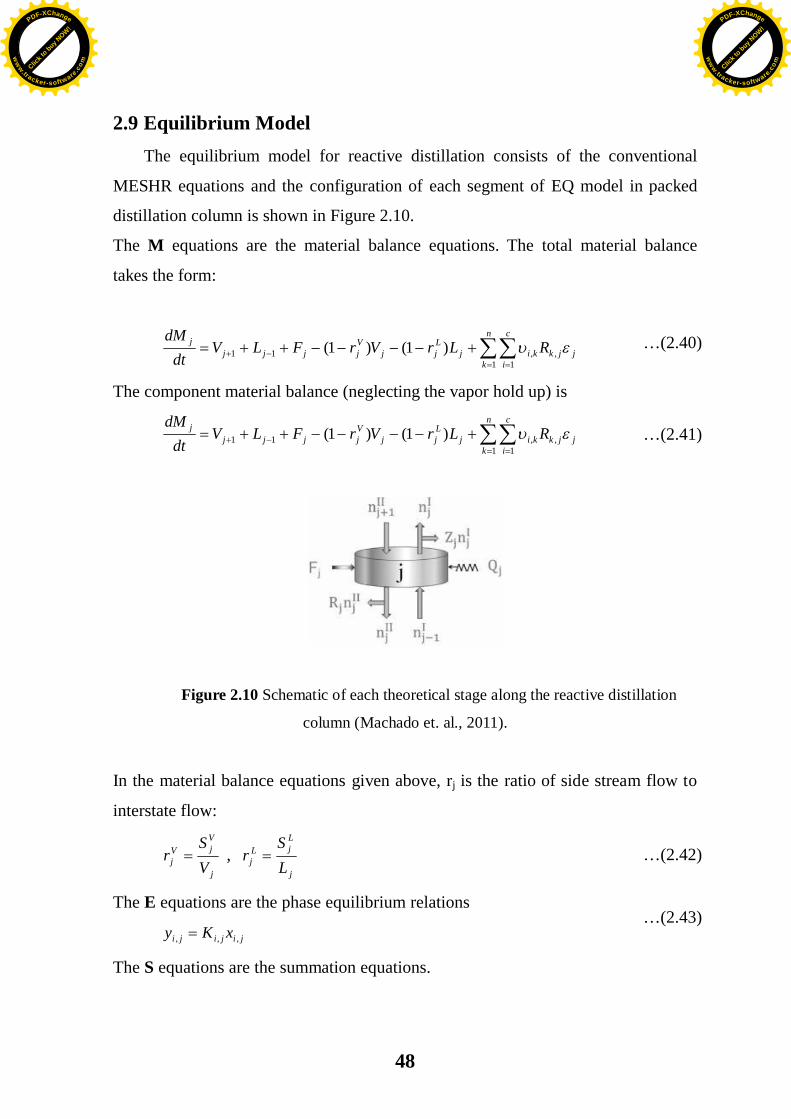
48
2.9 Equilibrium Model The equilibrium model for reactive distillation consists of the conventional
MESHR equations and the configuration of each segment of EQ model in packed
distillation column is shown in Figure 2.10.
The M equations are the material balance equations. The total material balance
takes the form:
n
k
c
ijjkkij
Ljj
Vjjjj
j RLrVrFLVdt
dM
1 1,,11 )1()1(
The component material balance (neglecting the vapor hold up) is n
k
c
ijjkkij
Ljj
Vjjjj
j RLrVrFLVdt
dM
1 1,,11 )1()1(
Figure 2.10 Schematic of each theoretical stage along the reactive distillation
column (Machado et. al., 2011).
In the material balance equations given above, rj is the ratio of side stream flow to
interstate flow:
j
VjV
j VS
r , j
LjL
j LS
r
The E equations are the phase equilibrium relations
jijiji xKy ,,, The S equations are the summation equations.
…(2.43)
…(2.42)
…(2.41)
…(2.40)
Click t
o buy NOW!
PDF-XChange
ww
w.tracker-software.c
om Click t
o buy NOW!
PDF-XChange
ww
w.tracker-software
.com
49
1,1
ji
c
ix
, 1,
1ji
c
iy
The enthalpy balance, H equation is given by:
HrRQhLrHVrhFhLHVdt
HdMjjjj
Ljjj
Vj
Fjjjjjj
jj )1()1(1111
R equations are the reaction rate equations.
The previous studies for equilibrium model for biodiesel production:
Steinigeweg et. al., (2003) presented a reactive distillation process for the
production of decanoic acid methyl ester by the esterfication of the fatty acid
decanoic acid with methanol. The reaction has been catalyzed heterogeneously by a
strong acidic ion-exchange resin (Amberlyst 15). Operation conditions have been
varied (reflux ratio and reactant ratio) experimentally. An equilibrium stage model
is capable of describing the experiments quantitatively when the adsorption based a
kinetic model is applied. Simulation using Aspen-plus version 11.1 has been used
subsequently to determine the influence of important operating and design factors
reactant ratio, reflux ratio, pressure, distillate to feed ratio, size of the reactive
section, and role of prereactor.
Chin et. al., (2006) developed a steady state equilibrium model for the
production of iso-propyl palmitate in a catalytic distillation column catalyzed by
zinc acetate supported on functionalized silica gel.
Kiss et. al., (2008) showed by rigorous process simulation that a combining
metal oxide catalysts such as niobic acid, sulfated zirconia, sulfatated titania, and
sulfated tin oxide with a reactive distillation technology is a feasible and
advantageous solution for the biodiesel production.
Kiss et. al., (2009) proposed a novel energy- efficient integrated production of
biodiesel from hydrous bioehanol, by combining the advantages of using solid
catalysts with the integration of reaction and separation. Rigorous simulations
embedding experiments results were performed using Aspen Tech Aspen Plus to
design the separative reactor and evaluate the overall of the process. The RD
column was simulated using the rigorous RADFRAC unit with rateSep (rate-based)
…(2.45)
…(2.44)
Click t
o buy NOW!
PDF-XChange
ww
w.tracker-software.c
om Click t
o buy NOW!
PDF-XChange
ww
w.tracker-software
.com

50
model, and considering three phases balance. Sensitivity analysis was used to
determine the optima; range of the operating parameters. The results are given for a
plant producing 10 ktpy biodiesel ( > 99.9%wt) from hydrous bioethanol (96%wt)
and waste vegetable oil with high free fatty acids content ( 100%), using solid
acids as green catalysts.
Castro et. al., (2010) proposed process involves the use of methanol at
supercritical conditions, Two alternative are proposed the process involves the use
of either reactive distillation or thermally coupled reactive distillation. Simulations
have been carried out by using Aspen One process simulator to demonstrate the
feasibility of such alternatives to produce biodiesel with methanol. A design method
for the thermal coupled systems shows low energy consumptions than the
reactive distillation column.
N. Da Lima Da Siliva et. al., (2010b) developed a simulation of the reactive
distillation process using Aspen Plus then studied a comparative between
experimental and the simulation. The results of this study showed many advantages
of the integration process as compared with the conventional biodiesel production
such: decrease of the ethanol excess, decrease of the reaction time, and decrease of
the equipment units. The best ester conversion was 98.18% wt with 0.65% wt of
sodium hydroxide, ethanol: soy oil molar ratio 1:8 and the reaction time was 6 min.
the process simulation results are in agreement with experimental ones.
Machado et. al., (2011) presented computational steady-state simulations of three
examples of fatty acid esterification in a reactive distillation column to produce
biodiesel fuels. In both of them, conversions close to 99% are possible. The
simulations results obtained can be useful for the proper design of processes that
use reactive distillation columns for biodiesel production.
Click t
o buy NOW!
PDF-XChange
ww
w.tracker-software.c
om Click t
o buy NOW!
PDF-XChange
ww
w.tracker-software
.com
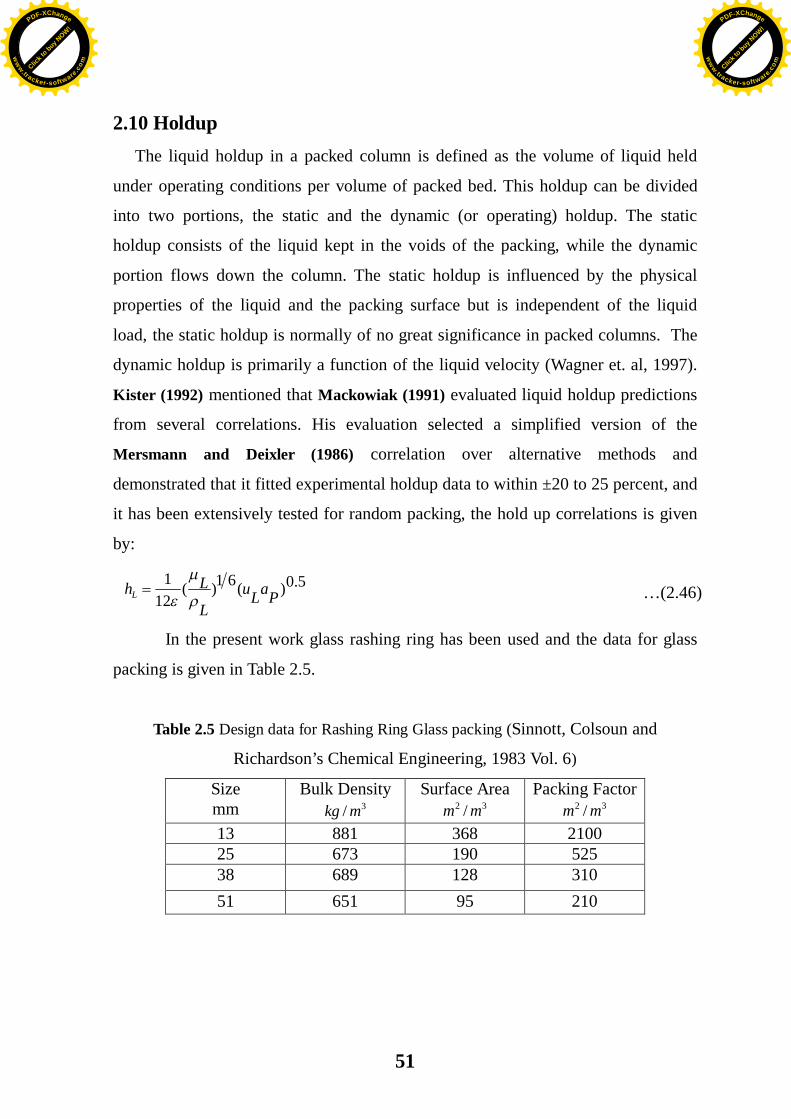
51
2.10 Holdup The liquid holdup in a packed column is defined as the volume of liquid held
under operating conditions per volume of packed bed. This holdup can be divided
into two portions, the static and the dynamic (or operating) holdup. The static
holdup consists of the liquid kept in the voids of the packing, while the dynamic
portion flows down the column. The static holdup is influenced by the physical
properties of the liquid and the packing surface but is independent of the liquid
load, the static holdup is normally of no great significance in packed columns. The
dynamic holdup is primarily a function of the liquid velocity (Wagner et. al, 1997).
Kister (1992) mentioned that Mackowiak (1991) evaluated liquid holdup predictions
from several correlations. His evaluation selected a simplified version of the
Mersmann and Deixler (1986) correlation over alternative methods and
demonstrated that it fitted experimental holdup data to within ±20 to 25 percent, and
it has been extensively tested for random packing, the hold up correlations is given
by:
5.0)(61)(12
1PaLu
L
LhL
In the present work glass rashing ring has been used and the data for glass
packing is given in Table 2.5.
Table 2.5 Design data for Rashing Ring Glass packing (Sinnott, Colsoun and
Richardson’s Chemical Engineering, 1983 Vol. 6)
Size mm
Bulk Density 3/ mkg
Surface Area 32 / mm
Packing Factor 32 / mm
13 881 368 2100 25 673 190 525 38 689 128 310 51 651 95 210
…(2.46)
Click t
o buy NOW!
PDF-XChange
ww
w.tracker-software.c
om Click t
o buy NOW!
PDF-XChange
ww
w.tracker-software
.com
52
Chapter Three Theoretical Aspects
3.1 Introduction
Unsteady state equilibrium model for packed reactive distillation column to
produced biodiesel is developed. The equations that are required to solve the
equilibrium model are given together with the model parameters. The solution
procedure of the proposed model of the present work is also discussed.
3.2 Simulation of Equilibrium Model
3.2.1 Equilibrium Model Assumptions
Consider the batch packed reactive distillation column and the schematic
model of jth segment shown in Figures 3.1 and 3.2, respectively, the mathematical
equilibrium model was formulated using the following assumptions:
1- Constant pressure drop across the column.
2- Hold-up per stage equal to liquid hold up on stage (i.e. vapor phase molar
hold-up is neglected).
3- Each stage is considered as a continuous stirred-tank reactor (CSTR).
4- There is heat transfer in the reboiler and in the condenser, but the interior
stages of the column are adiabatic.
The stream of liquid and vapor leaving the stages are in phase equilibrium, in
the present work the vapor phase and the liquid phase behaviors are calculated.
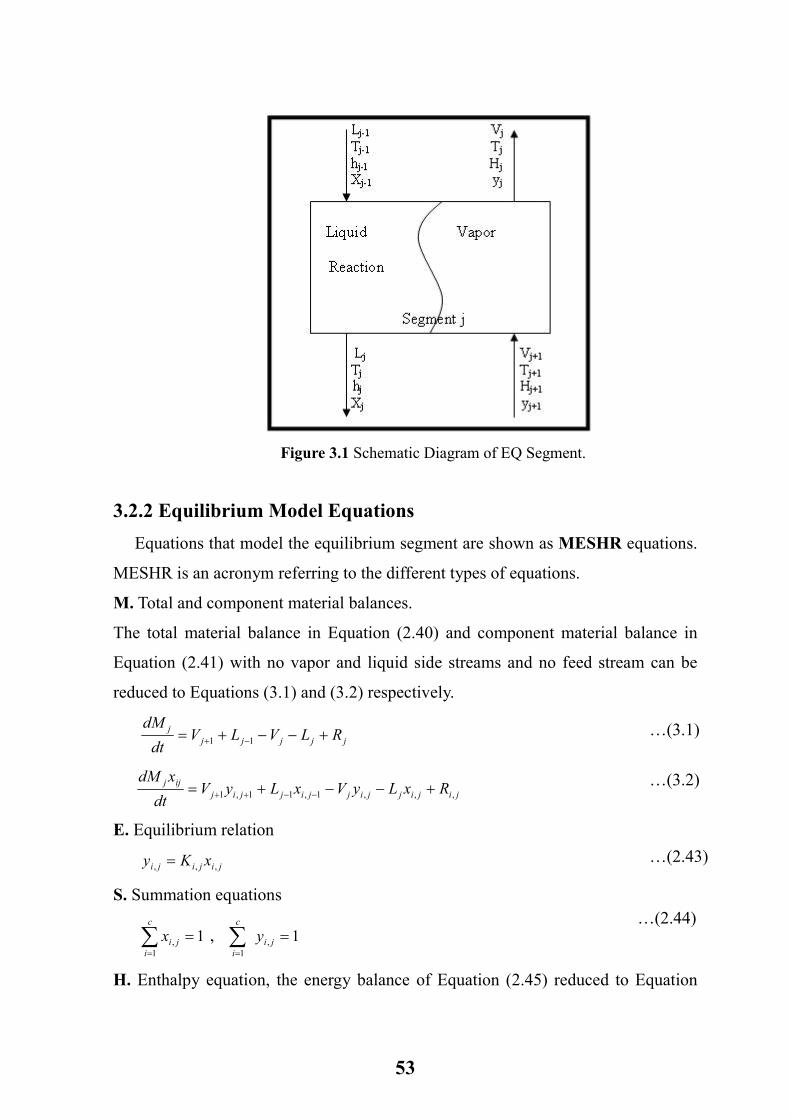
53
Figure 3.1 Schematic Diagram of EQ Segment.
3.2.2 Equilibrium Model Equations
Equations that model the equilibrium segment are shown as MESHR equations.
MESHR is an acronym referring to the different types of equations.
M. Total and component material balances.
The total material balance in Equation (2.40) and component material balance in
Equation (2.41) with no vapor and liquid side streams and no feed stream can be
reduced to Equations (3.1) and (3.2) respectively.
jjjjjj RLVLV
dt
dM+−−+= −+ 11
jijijjijjijjijijj RxLyVxLyV
dt
xdM,,,1,11,1 +−−+= −−++
E. Equilibrium relation
jijiji xKy ,,, =
S. Summation equations
11
, =∑=
c
ijix , 1,
1
=∑=
ji
c
i
y
H. Enthalpy equation, the energy balance of Equation (2.45) reduced to Equation
…(3.1)
…(3.2)
…(2.43)
…(2.44)
54
(3.3) with no side streams and no feed stream.
HrRhLHVhLHVdt
HdMjjjjjjjjj
jj +−−+= −−++ 1111
R. Reaction rate equations
The chemical reaction of esterification is considered as first order with
respect to oleic acid and of zeroth order with respect to methanol (when methanol is
used in excess). It is assumed that the reverse reaction (hydrolysis) does not occur,
i.e., the esterification is irreversible, these assumptions are used in the development
of a pseudo-homogeneous kinetic model as function of reagent concentration
(Sendzikiene, et. al., 2004, Aranda, et. al., 2008, Boucher et. al., 2008, Melo Junior
et., al., 2010 and Yadav et. al., 2010):
catFFA WFFAkdtFFAd
R *][][
1=−=
Where the kinetic constant k1 in equation (3.4) is given by the Arrhenius
equation (Sendzikiene et. al., 2004):
−=RT
k13300
exp27.11
The concentration of oleic acid is replaced by activity, equation (3.4)
becomes:
catOLACOLAC WakR *1=
The activity of ith component was calculated using the following equation:
iii Ca γ=
The mechanism of the reaction is represented as in (Yadav et. al., 2010):
][1
1
++↔−
+ FFAHFFAk
k
→++2
][k
MEOHFFA
…(3.3)
…(3.9)
…(3.8)
Intermediate
Intermediate→3k
Product
…(3.4)
…(3.5)
…(3.7)
…(3.6)
…(3.10)
55
From equilibrium equation (3.8)
]][[][ 1++ = HFFAkFFA
The rate of disappearance of FFA is:
]][[][
][]][[][
2
11
MEOHFFAkdtFFAd
FFAkHFFAkdtFFAd
+
+−
+
=−
−=−
Substituting the value of [FFA+] from equation (3.11) into equation (3.13), the rate
of disappearance of FFA becomes:
]][][[][
12 MEOHHFFAkkdtFFAd +=−
The rate law equation (3.14) suggests a first order dependence of rate with
respect to each fatty acid and methanol (i.e. overall a second order reaction) in
presence of acid as catalyst.
In presence of excess methanol, equations (3.8) and (3.9) becomes
comparable and the equilibrium condition is not considered with respect to equation
(3.8). However, in such case on applying steady state condition with respect to
[FFA+] it becomes:
][
]][[][
21
1
MEOHkkHFFAk
FFA+
=−
++
The rate of disappearance of [FFA] is given as:
][
]][][[][
21
21
MEOHkkMEOHHFFAkk
dtFFAd
+=−
−
+
At higher [MEOH] where k2 [MEOH] >> k-1, the rate law equation (3.16) becomes:
]][[][
1+=− HFFAk
dtFFAd
…(3.13)
…(3.14)
…(3.15)
…(3.12)
…(3.17)
…(3.16)
…(3.11)

56
3.2.3 Estimation of Equilibrium Model Parameters
3.2.3.1 Vapor-Liquid Equilibrium Relation
For non-ideal mixture additional variables such as iγ (activity coefficient) and
iφ (fugacity coefficient) appears to represent the degree of deviation from ideality.
ii
iii x
Ky
φγ
=
3.2.3.1.1 Vapor Fugacity Coefficient
Redlich/Kowng and Peng-Robinson cubic equations of state have been used in
the present work to calculate the vapor fugacity coefficients of components in vapor
phase.
a. Redlich/Kowng Cubic EOS
The vapor phase fugacity coefficient of components is calculated using
Redlich/Kowng Cubic EOS.
)1ln(2
)1(ln)1(exp[ 5.1 ha
ay
bb
bRTa
hZZbb j
jijii
i +
−+−−−=∑
φ
The mixing rules that have found greatest favor are:
∑∑=i j
ijji ayya
with jiij aa =
and ∑=i
iibyb
ija is of two types: pure-species parameters (like subscripts) and interaction
parameters (unlike subscripts), ib are parameters for pure species.
ci
cii
cij
cijij
PRT
b
P
TRa
08664.0
42748.0 5.22
=
=
…(2.19)
…(3.18)
…(3.21)
…(3.22)
…(3.20)
…(3.19)
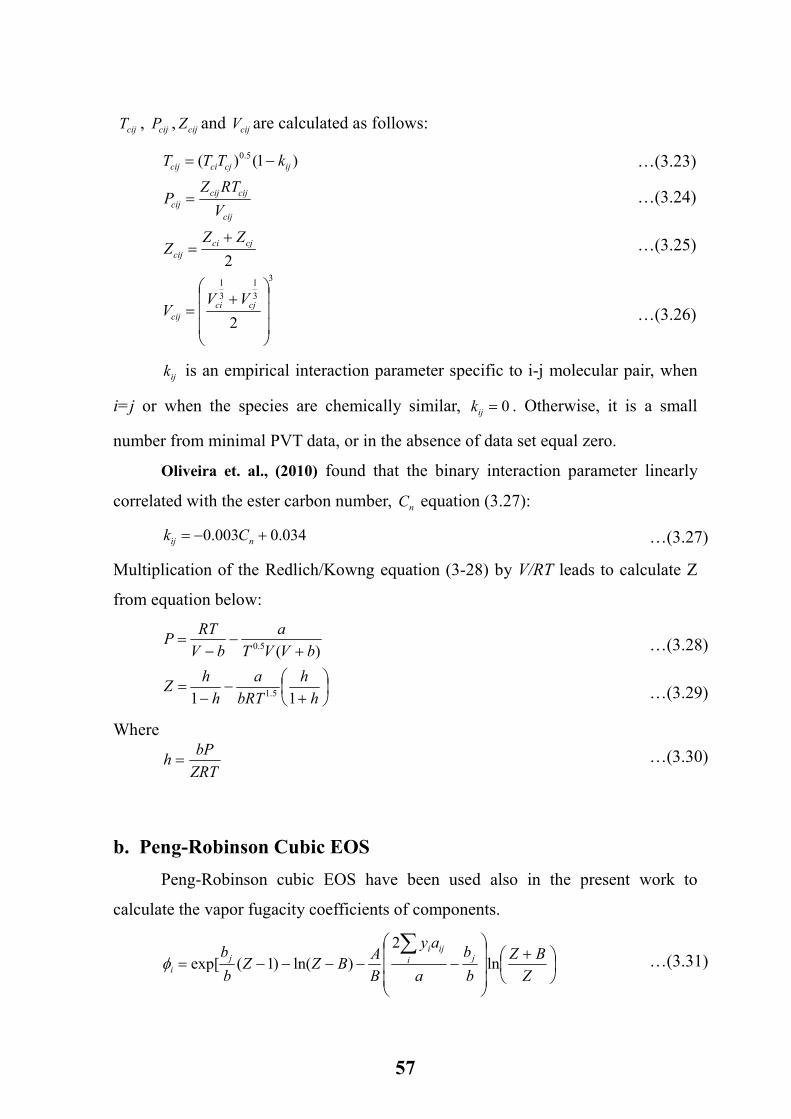
57
cijT , cijP , cijZ and cijV are calculated as follows:
3
31
31
5.0
2
2
)1()(
+
=
+=
=
−=
cjcicij
cjcicij
cij
cijcijcij
ijcjcicij
VVV
ZZZ
V
RTZP
kTTT
ijk is an empirical interaction parameter specific to i-j molecular pair, when
i=j or when the species are chemically similar, 0=ijk . Otherwise, it is a small
number from minimal PVT data, or in the absence of data set equal zero.
Oliveira et. al., (2010) found that the binary interaction parameter linearly
correlated with the ester carbon number, nC equation (3.27):
034.0003.0 +−= nij Ck
Multiplication of the Redlich/Kowng equation (3-28) by V/RT leads to calculate Z
from equation below:
+
−−
=
+−
−=
hh
bRTa
hh
Z
bVVTa
bVRT
P
11
)(
5.1
5.0
Where
ZRTbP
h =
b. Peng-Robinson Cubic EOS
Peng-Robinson cubic EOS have been used also in the present work to
calculate the vapor fugacity coefficients of components.
+
−−−−−=
∑Z
BZb
b
a
ay
BA
BZZb
b jiiji
ji ln
2)ln()1(exp[φ
…(3.26)
…(3.25)
…(3.24)
…(3.23)
…(3.27)
…(3.29)
…(3.30)
…(3.28)
…(3.31)
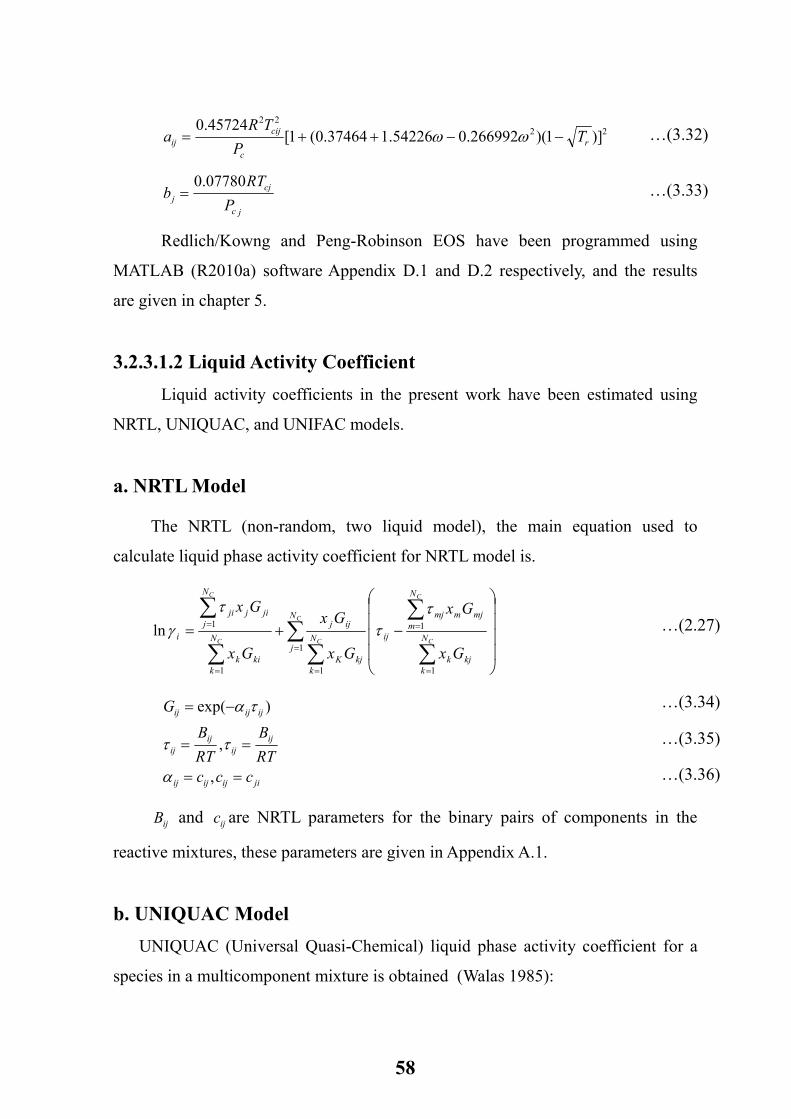
58
2222
)]1)(266992.054226.137464.0(1[45724.0
rc
cijij T
P
TRa −−++= ωω
jc
cjj P
RTb
07780.0=
Redlich/Kowng and Peng-Robinson EOS have been programmed using
MATLAB (R2010a) software Appendix D.1 and D.2 respectively, and the results
are given in chapter 5.
3.2.3.1.2 Liquid Activity Coefficient
Liquid activity coefficients in the present work have been estimated using
NRTL, UNIQUAC, and UNIFAC models.
a. NRTL Model
The NRTL (non-random, two liquid model), the main equation used to
calculate liquid phase activity coefficient for NRTL model is.
∑∑
∑
∑∑
∑
=
=
=
==
=
−+=C
C
C
CC
C
N
jN
kkjk
N
mmjmmj
ijN
kkjK
ijj
N
kkik
N
jjijji
i
Gx
Gx
Gx
Gx
Gx
Gx
1
1
1
11
1lnτ
ττ
γ
jiijijij
ijij
ijij
ijijij
cccRT
B
RT
B
G
==
==
−=
,
,
)exp(
α
ττ
τα
ijB and ijc are NRTL parameters for the binary pairs of components in the
reactive mixtures, these parameters are given in Appendix A.1.
b. UNIQUAC Model
UNIQUAC (Universal Quasi-Chemical) liquid phase activity coefficient for a
species in a multicomponent mixture is obtained (Walas 1985):
…(3.33)
…(3.32)
…(2.27)
…(3.36)
…(3.34)
…(3.35)
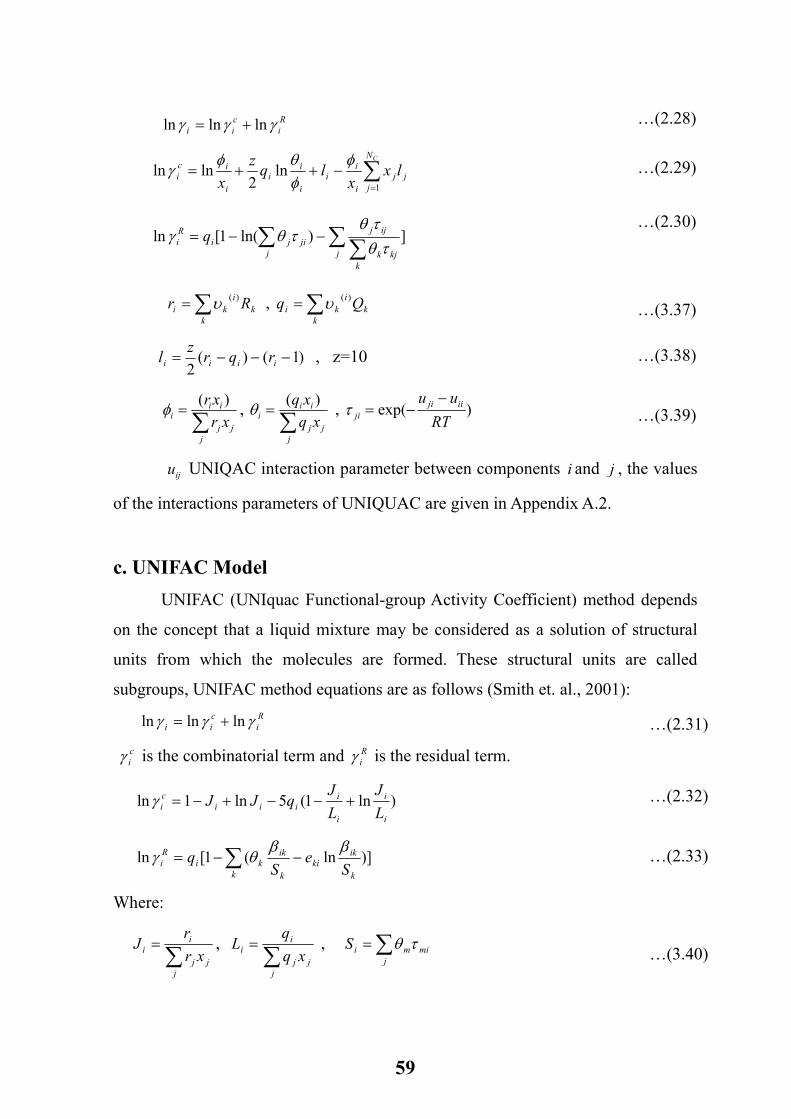
59
Ri
cii γγγ lnlnln +=
∑=
−++=CN
jjj
i
ii
i
ii
i
ici lx
xlq
zx 1
ln2
lnlnφ
φθφ
γ
∑∑∑ −−=j
kkjk
ijj
jjiji
Ri q ])ln(1[ln
τθτθ
τθγ
∑=k
ki
ki Rr )(υ , ∑=k
ki
ki Qq )(υ
)1()(2
−−−= iiii rqrz
l , z=10
∑
=
jjj
iii xr
xr )(φ , ∑
=
jjj
iii xq
xq )(θ , )exp(RT
uu iijiji
−−=τ
iju UNIQAC interaction parameter between components i and j , the values
of the interactions parameters of UNIQUAC are given in Appendix A.2.
c. UNIFAC Model
UNIFAC (UNIquac Functional-group Activity Coefficient) method depends
on the concept that a liquid mixture may be considered as a solution of structural
units from which the molecules are formed. These structural units are called
subgroups, UNIFAC method equations are as follows (Smith et. al., 2001):
Ri
cii γγγ lnlnln +=
ciγ is the combinatorial term and R
iγ is the residual term.
)ln1(5ln1lni
i
i
iiii
ci L
JLJ
qJJ +−−+−=γ
)]ln(1[lnk
ikki
k k
ikki
Ri S
eS
qββ
θγ −−= ∑
Where:
∑
=
jjj
ii xr
rJ ,
∑=
jjj
ii xq
qL , ∑=
jmimiS τθ
…(2.29)
…(2.30)
…(2.28)
…(2.31)
…(3.40)
…(2.33)
…(2.32)
…(3.37)
…(3.38)
…(3.39)

60
In addition the following definitions were applied:
∑=k
ki
ki Rr )(υ , ∑=k
ki
ki Qq )(υ , i
ki
kki q
Qe
)(υ=
∑=m
mkmiik e τβ , ∑
∑=
jjj
ikiii
k qx
eqxθ ,
Tamk
mk exp=τ
Subscript i is identifying species, and j is a dummy index running overall
species. Subscript k identifies subgroups, and m is a dummy index running overall
subgroups. The quantity of )(ikυ is the number of subgroups of type k in a molecule
of species i (Smith et. al., 2001). The structure, molecular formula, group number
of each component, values of subgroup parameters kR and kQ and the group
interaction parameters mka are given Appendix A.3.
The three models have been programmed using MATLAB (R2010a)
software Appendix D.3, D.4 and D.5 respectively, and the results are given in
chapter 5.
3.2.3.2 Enthalpy Calculation
Enthalpy of component in vapor phase is estimated through the integration
the sensible heat from reference temperature to desired temperature
∫=T
T
Vii
ref
dTCph
Evaluation of integral in Equation (3.43) requires knowledge of the temperature
dependence of heat capacity.
]])cosh(
)([]
)sinh(
)([[ 22
TE
TE
D
TC
TC
BACPVi ++=
The constants A, B, C, D and E for all components in vapor and liquid are
given in Appendix B.1. The total enthalpy of vapor phase is:
…(3.42)
…(3.41)
…(3.43)
…(3.44)
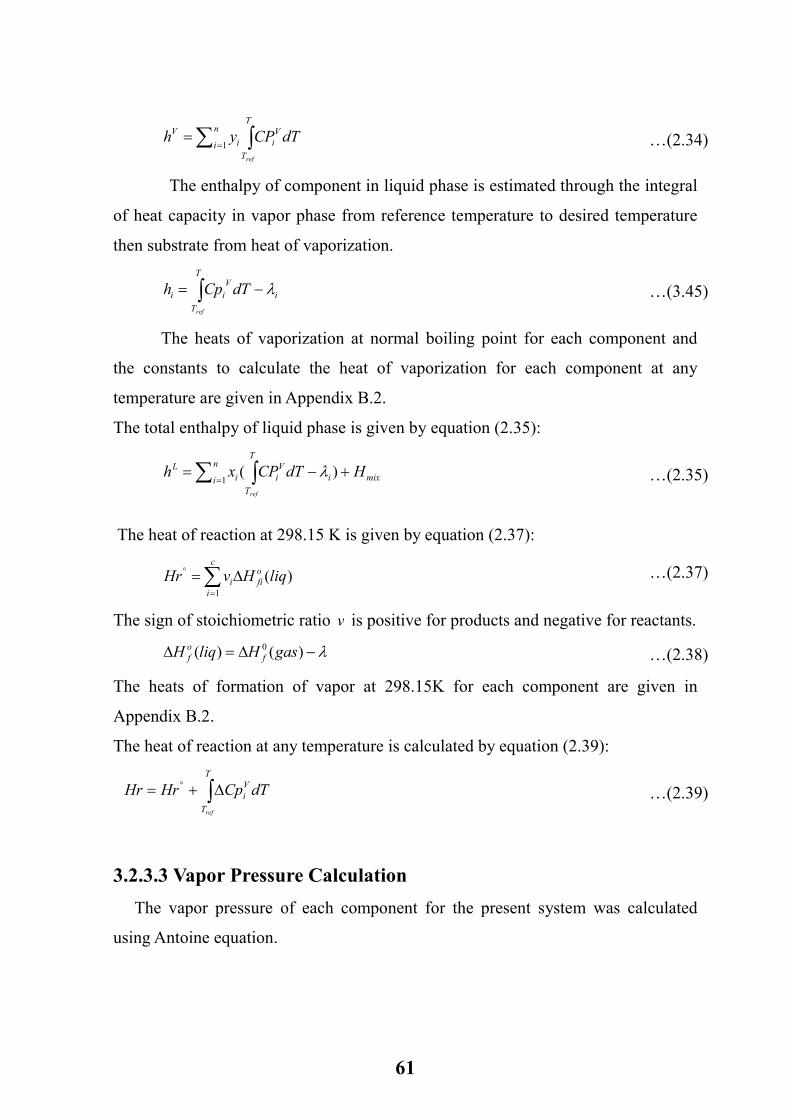
61
∫∑ ==
T
T
Vi
n
i iV
ref
dTCPyh1
The enthalpy of component in liquid phase is estimated through the integral
of heat capacity in vapor phase from reference temperature to desired temperature
then substrate from heat of vaporization.
i
T
T
Vii
ref
dTCph λ−= ∫
The heats of vaporization at normal boiling point for each component and
the constants to calculate the heat of vaporization for each component at any
temperature are given in Appendix B.2.
The total enthalpy of liquid phase is given by equation (2.35):
mixin
i
T
T
Vii
L HdTCPxhref
+−=∑ ∫=)(
1λ
The heat of reaction at 298.15 K is given by equation (2.37):
)(1
liqHvHrc
i
ofii∑
=
° ∆=
The sign of stoichiometric ratio v is positive for products and negative for reactants.
λ−∆=∆ )()( 0 gasHliqH fof
The heats of formation of vapor at 298.15K for each component are given in
Appendix B.2.
The heat of reaction at any temperature is calculated by equation (2.39):
∫∆+= °T
T
Vi
ref
dTCpHrHr
3.2.3.3 Vapor Pressure Calculation
The vapor pressure of each component for the present system was calculated
using Antoine equation.
…(2.34)
…(3.45)
…(2.35)
…(2.37)
…(2.38)
…(2.39)
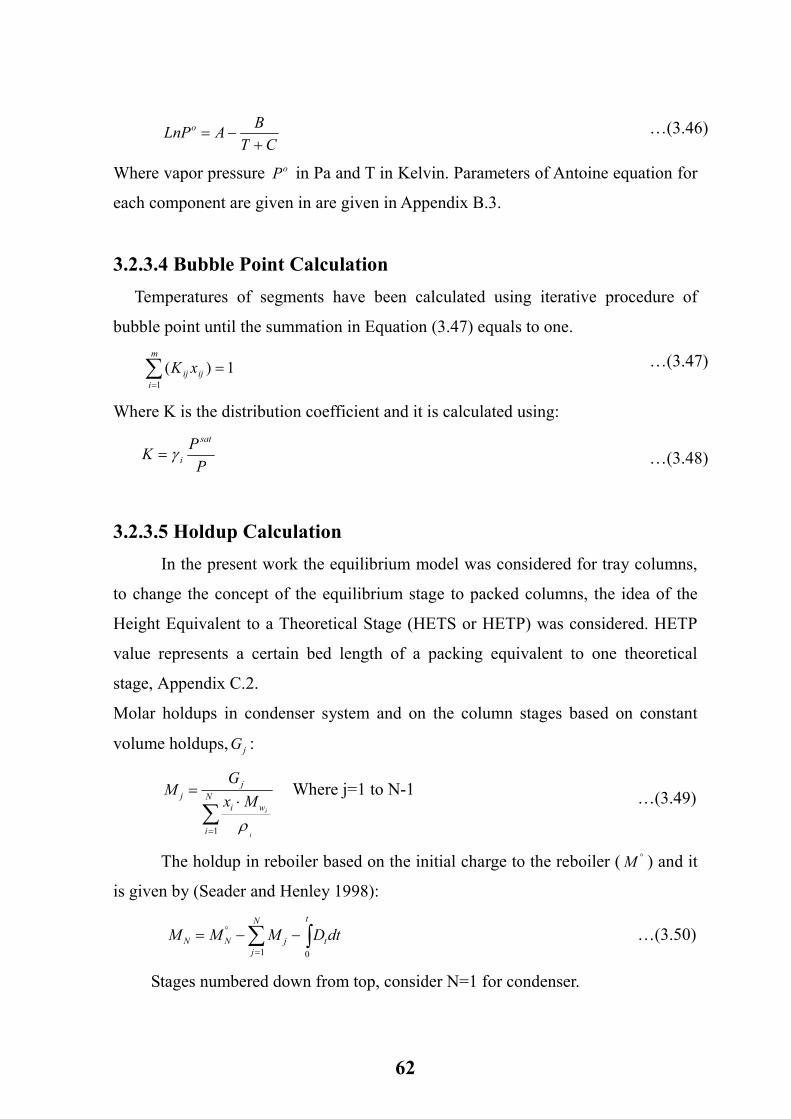
62
CT
BALnPo
+−=
Where vapor pressure oP in Pa and T in Kelvin. Parameters of Antoine equation for
each component are given in are given in Appendix B.3.
3.2.3.4 Bubble Point Calculation
Temperatures of segments have been calculated using iterative procedure of
bubble point until the summation in Equation (3.47) equals to one.
1)(1
=∑=
m
iijij xK
Where K is the distribution coefficient and it is calculated using:
P
PK
sat
iγ=
3.2.3.5 Holdup Calculation
In the present work the equilibrium model was considered for tray columns,
to change the concept of the equilibrium stage to packed columns, the idea of the
Height Equivalent to a Theoretical Stage (HETS or HETP) was considered. HETP
value represents a certain bed length of a packing equivalent to one theoretical
stage, Appendix C.2.
Molar holdups in condenser system and on the column stages based on constant
volume holdups, jG :
∑=
⋅= N
i
wi
jj
i
iMx
GM
1 ρ
Where j=1 to N-1
The holdup in reboiler based on the initial charge to the reboiler ( °M ) and it
is given by (Seader and Henley 1998):
∑ ∫=
° −−=N
j
t
tjNN dtDMMM1 0
Stages numbered down from top, consider N=1 for condenser.
…(3.46)
…(3.48)
…(3.47)
…(3.50)
…(3.49)
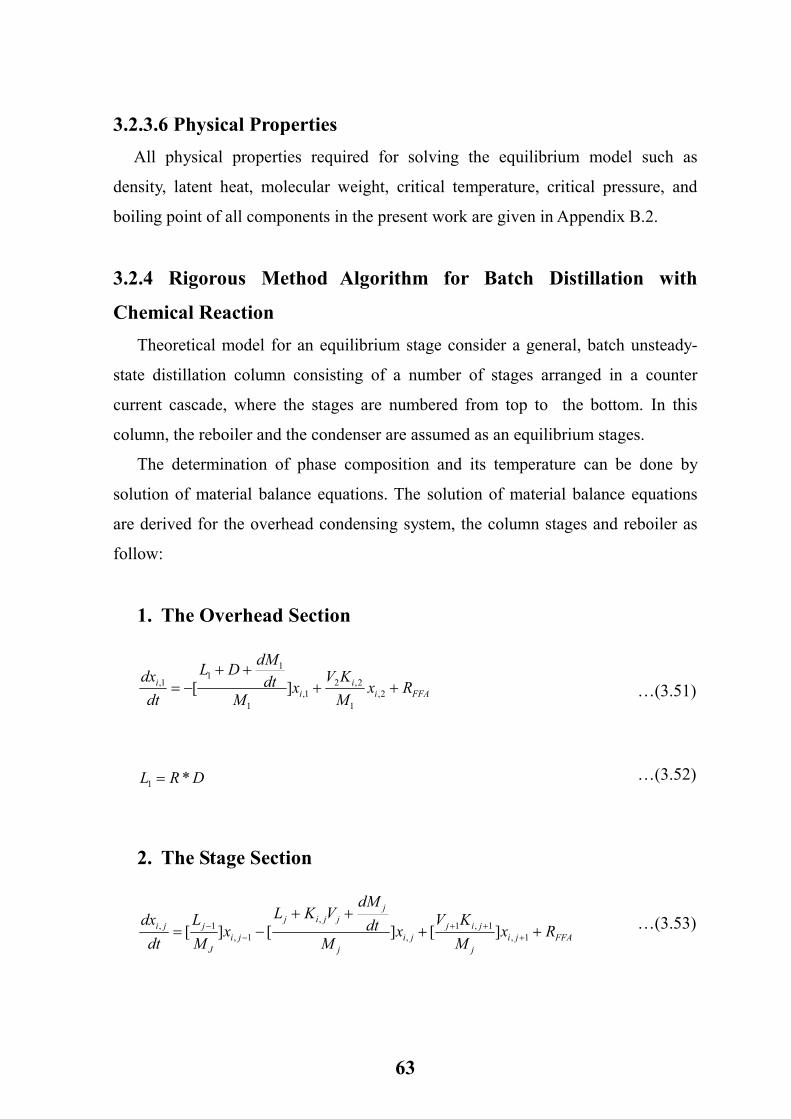
63
3.2.3.6 Physical Properties
All physical properties required for solving the equilibrium model such as
density, latent heat, molecular weight, critical temperature, critical pressure, and
boiling point of all components in the present work are given in Appendix B.2.
3.2.4 Rigorous Method Algorithm for Batch Distillation with
Chemical Reaction
Theoretical model for an equilibrium stage consider a general, batch unsteady-
state distillation column consisting of a number of stages arranged in a counter
current cascade, where the stages are numbered from top to the bottom. In this
column, the reboiler and the condenser are assumed as an equilibrium stages.
The determination of phase composition and its temperature can be done by
solution of material balance equations. The solution of material balance equations
are derived for the overhead condensing system, the column stages and reboiler as
follow:
1. The Overhead Section
FFAii
ii Rx
MKV
xM
dtdM
DL
dtdx
++++
−= 2,1
2,21,
1
11
1, ][
DRL *1 =
2. The Stage Section
FFAjij
jijji
j
jjjij
jiJ
jji RxM
KVx
Mdt
dMVKL
xM
L
dt
dx++
++−= +
++−
−1,
1,1,
,
1,1, ][][][
…(3.51)
…(3.52)
…(3.53)
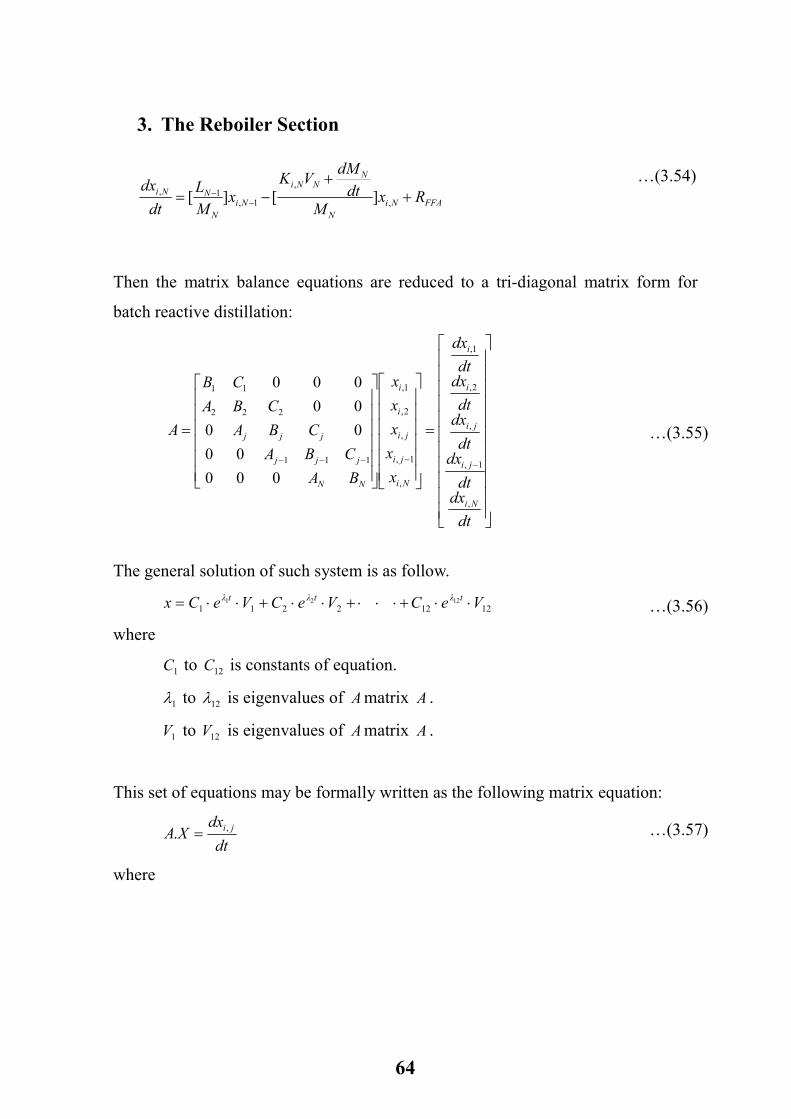
64
3. The Reboiler Section
FFANiN
NNNi
NiN
NNi RxM
dtdM
VKx
ML
dtdx
++
−= −−
,
,
1,1, ][][
Then the matrix balance equations are reduced to a tri-diagonal matrix form for
batch reactive distillation:
=
=
−−−−−
dtdx
dt
dxdt
dxdt
dxdt
dx
x
x
x
x
x
BA
CBA
CBA
CBA
CB
A
Ni
ji
ji
i
i
Ni
ji
ji
i
i
NN
jjj
jjj
,
1,
,
2,
1,
,
1,
,
2,
1,
111
222
11
000
00
00
00
000
The general solution of such system is as follow.
121222111221 VeCVeCVeCx tλtλtλ ⋅⋅+⋅⋅⋅+⋅⋅+⋅⋅=
where
1C to 12C is constants of equation.
1λ to 12λ is eigenvalues of Amatrix A .
1V to 12V is eigenvalues of Amatrix A .
This set of equations may be formally written as the following matrix equation:
dt
dxXA ji ,. =
where
…(3.54)
…(3.55)
…(3.57)
…(3.56)
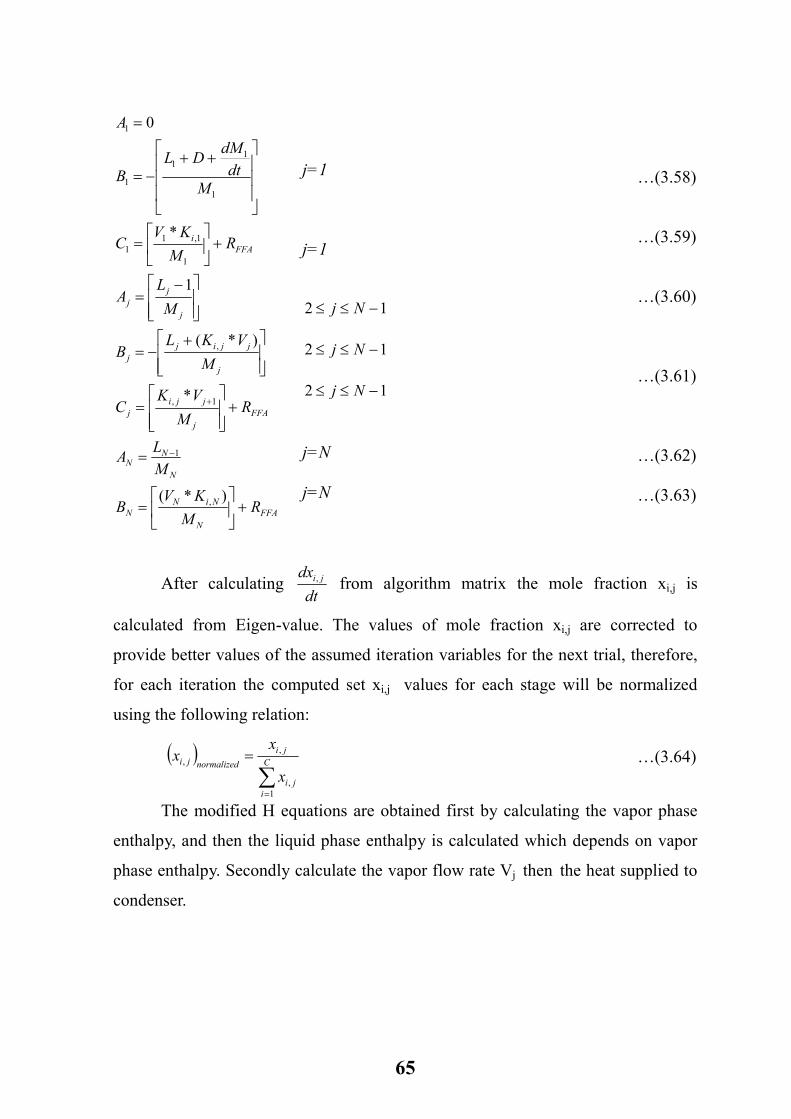
65
FFAN
NiNN
N
NN
FFAj
jjij
j
jjijj
j
jj
FFAi
RM
KVB
ML
A
RM
VKC
M
VKLB
M
LA
RM
KVC
Mdt
dMDL
B
A
+
=
=
+
=
+−=
−=
+
=
++−=
=
−
+
)*(
*
)*(
1
*
0
,
1
1,
,
1
1,11
1
11
1
1
After calculating dt
dx ji, from algorithm matrix the mole fraction xi,j is
calculated from Eigen-value. The values of mole fraction xi,j are corrected to
provide better values of the assumed iteration variables for the next trial, therefore,
for each iteration the computed set xi,j values for each stage will be normalized
using the following relation:
( )∑=
= C
iji
ji
normalizedji
x
xx
1,
,,
The modified H equations are obtained first by calculating the vapor phase
enthalpy, and then the liquid phase enthalpy is calculated which depends on vapor
phase enthalpy. Secondly calculate the vapor flow rate Vj then the heat supplied to
condenser.
j=1 j=1
12 −≤≤ Nj
12 −≤≤ Nj
12 −≤≤ Nj j=N j=N
…(3.58) …(3.59) …(3.60) …(3.61) …(3.62) …(3.63)
…(3.64)
66
∑=
= C
iiji
rj
x
QV
1, λ
, at initial mole fraction
+−−−
−= −−
++ dt
dhMhhLhhV
hhV
Lj
jLj
Ljj
Lj
VjjL
jVj
j )()()(
111
11
dtdh
MhhVQL
LVc
11122 )( −−=
3.2.5 Solution Procedure of the Equilibrium Model
A computer program to solve the MESHR equations has been developed
using MATLAB (R2010a) to determine the composition of components, segments
temperatures, condenser and reboiler duties, liquid and vapor flow rates along
stages, and reaction rate profile.
The program begins with specify all parameters that consist of number of
stages, reflux ratio, total pressure, feed compositions, distillate rate, batch time, step
time, and mass of catalyst, as well as all physical properties of components. Time,
and temperature loops were started, respectively over all stages. The temperature of
each stage has been calculated by trial and error until the equilibrium relation
applicable.
The new segments temperatures have been used in calculation of reaction
rate, enthalpies of vapor, liquid and mixing. Then the liquid and vapor flow rates
were calculated by total material and energy balances. A tridiagonal matrix was
used to find the component compositions by solving the MESHR equations, solving
the matrices by eigen value, and normalizing the new compositions for each
component. New sets of composition are obtained with the previous procedure for
each step time of the batch time. When the compositions at different times are
evaluated the program ended and the results plotted. Block diagram of the
equilibrium model is given in Appendix B.4.
…(3.65)
, j=1 to N …(3.66)
…(3.67)
67
Chapter Four Experimental Work
4.1 Introduction
In this chapter, the description of the experimental work is considered. First
bench experiment was carried out in order to check availability of biodiesel in
product. Full description of reactive distillation column unit, experimental
measurements, operating and experimental procedure and the effect of different
variables were studied.
The Taguchi approach (Taguchi method) was adopted as the experimental
design methodology, which was adequate for understanding the effects of the
control variables and to choose the best experimental conditions from a limited
number of experiments.
Different analysis methods of product were considered such as Gas
Chromatography (GC), Fourier Transforms Infrared spectroscopy (FT-IR), and
Titration method to compute the conversion of oleic acid to biodiesel (methyl
oleate), also the characteristics of the produced biodiesel (methyl oleate) were
determined using different measurements such as flash point, viscosity, density and
carbon residue.
4.2 Materials Oleic acid extra pure was procured from “Loba Chemie”, Mumbai, India (IV
= 92, AV = 200). Methyl Oleate “Fluka Company”, packed Switzerland. Anhydrous
methanol (MEOH), 99.8%, and anhydrous ethanol (EtOH) were procured from
“Scharlau Company”, Spain. Potassium hydroxide (KOH) 0.1 M solution procured
from BDH CVS Chemicals, standardized with a solution of sulfuric acid using
Phenolphthalein as indicator, sulfuric acid (H2SO4) from “Gainland Chemical
Company”, Factory Road, Sandycroft Deeside, and Phenolphthalein “The British-
Drug House LTD”, B.D.H. Laboratory Chemicals Division, Poole, England.
Click t
o buy NOW!
PDF-XChange
ww
w.tracker-software.c
om Click t
o buy NOW!
PDF-XChange
ww
w.tracker-software
.com

68
4.3 Bench Experiment Bench experiment to check the availability of biodiesel (methyl oleate) and
determinate the range of variables that studied in batch reactive distillation. Bench
experiment was carried out in a batch reactor, consists of 500ml three-necked round
flask one neck handle thermometer and the other handling a total reflux condenser,
heat was supplied by a glycerin oil bath as shown in Figure 4.1. Oleic acid and
methanol are introduced to the flask with a molar ratio of 8:1 methanol to oleic acid
and mixed continuously by magnetic stirrer with a measured amount of catalyst to
produce biodiesel (methyl oleate), sulfuric acid is used as a catalyst with a mount of
1 g sulfuric acid/g oleic acid, the mixture is well mixed and heated until reaches the
reaction mixture temperature. After a certain time a sample was taken and analyzed
using gas chromatography, the bench experiment was carried out to check the
availability of biodiesel.
Figure 4.1 Apparatuses illustrated Bench Experiment.
Click t
o buy NOW!
PDF-XChange
ww
w.tracker-software.c
om Click t
o buy NOW!
PDF-XChange
ww
w.tracker-software
.com

69
4.4 Reactive Distillation unit Description The experiments were carried out using laboratory scale batch reactive
distillation column as shown in Figures 4.2 and 4.3. Figure 4.2 represents the
diagram of the experimental column. The general view of the main experimental
RD is shown in Figure 4.3.
The unit consists of a still pot (D), which is heated using glycerin bath (C) that
takes heat from a magnetic stirrer.
The distillation column is located above the still pot, packed with rashing
rings. At the top of column, a double pipe water-cooler condenser is connected,
which is used to condense the vapor leaving the top of column.
Figure 4.2 Flow Diagram of Experimental Plant.
Click t
o buy NOW!
PDF-XChange
ww
w.tracker-software.c
om Click t
o buy NOW!
PDF-XChange
ww
w.tracker-software
.com
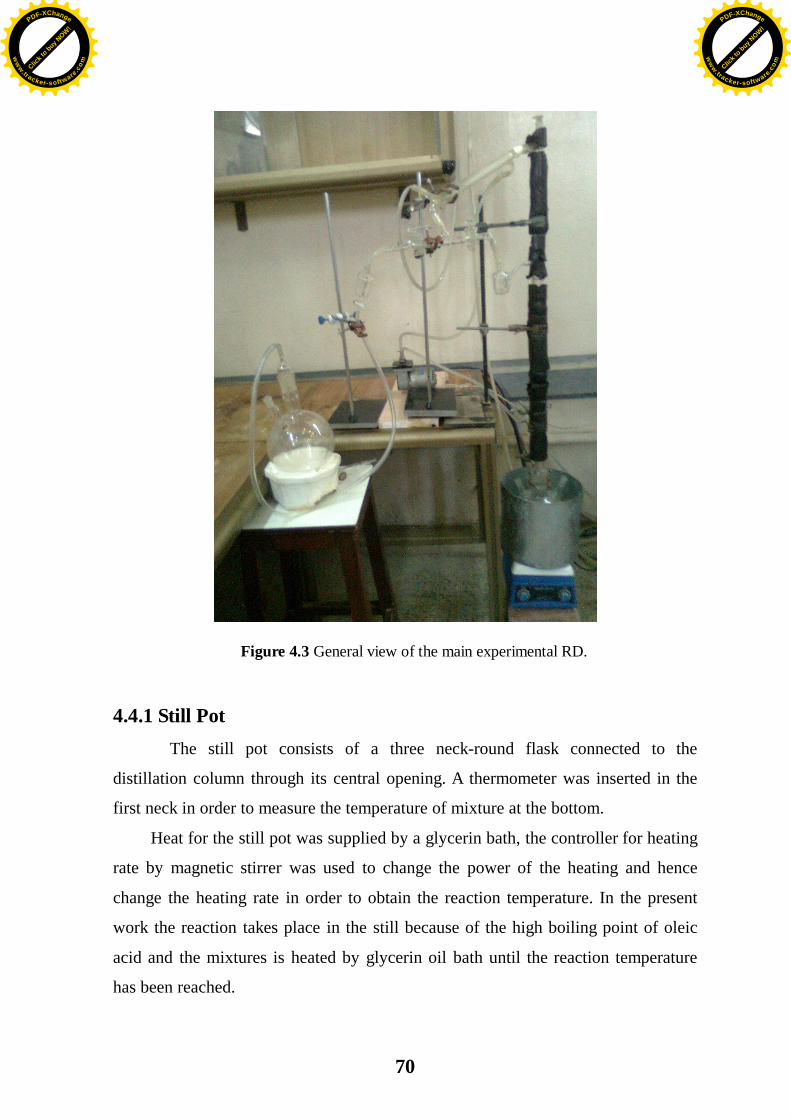
70
Figure 4.3 General view of the main experimental RD.
4.4.1 Still Pot
The still pot consists of a three neck-round flask connected to the
distillation column through its central opening. A thermometer was inserted in the
first neck in order to measure the temperature of mixture at the bottom.
Heat for the still pot was supplied by a glycerin bath, the controller for heating
rate by magnetic stirrer was used to change the power of the heating and hence
change the heating rate in order to obtain the reaction temperature. In the present
work the reaction takes place in the still because of the high boiling point of oleic
acid and the mixtures is heated by glycerin oil bath until the reaction temperature
has been reached.
Click t
o buy NOW!
PDF-XChange
ww
w.tracker-software.c
om Click t
o buy NOW!
PDF-XChange
ww
w.tracker-software
.com
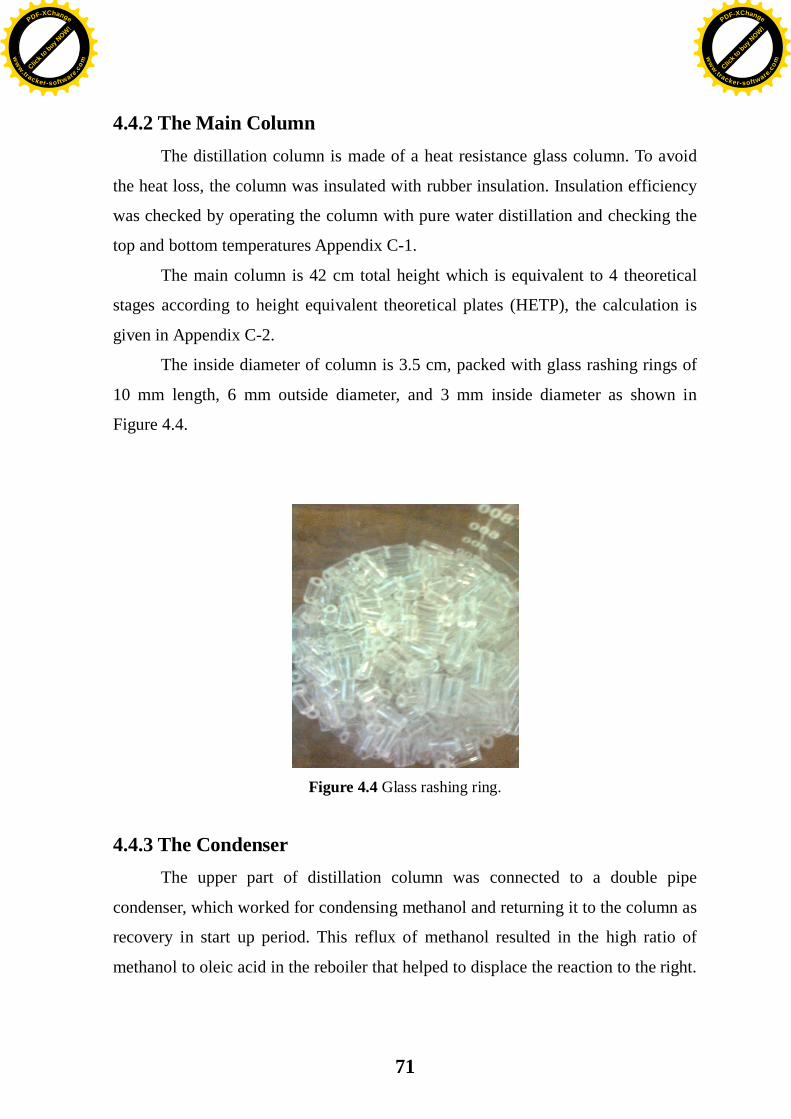
71
4.4.2 The Main Column The distillation column is made of a heat resistance glass column. To avoid
the heat loss, the column was insulated with rubber insulation. Insulation efficiency
was checked by operating the column with pure water distillation and checking the
top and bottom temperatures Appendix C-1.
The main column is 42 cm total height which is equivalent to 4 theoretical
stages according to height equivalent theoretical plates (HETP), the calculation is
given in Appendix C-2.
The inside diameter of column is 3.5 cm, packed with glass rashing rings of
10 mm length, 6 mm outside diameter, and 3 mm inside diameter as shown in
Figure 4.4.
Figure 4.4 Glass rashing ring.
4.4.3 The Condenser The upper part of distillation column was connected to a double pipe
condenser, which worked for condensing methanol and returning it to the column as
recovery in start up period. This reflux of methanol resulted in the high ratio of
methanol to oleic acid in the reboiler that helped to displace the reaction to the right.
Click t
o buy NOW!
PDF-XChange
ww
w.tracker-software.c
om Click t
o buy NOW!
PDF-XChange
ww
w.tracker-software
.com
72
Water at room temperature was circulated counter currently through the
external pipe of condenser to condense the vapor out from the upper part of
distillation column totally. Both portions of condensate were passed through
graduated containers before reaching the column and the collecting vessel, the
liquid distillate is collected in the collecting vessel P.
4.5 Experimental Measurements In this section the measurements of temperature, composition and other
measurements are considered.
4.5.1 Temperature Measurements Bottom, top and glycerin bath temperatures were measured using three
mercury thermometers. Bottom temperature was measured by a thermometer
connected to the still pot to measure the mixture temperature, the top temperature
was measured with a thermometer connected to the upper end of distillation column
to measure the temperature of vapor before passing through the condenser and the
glycerin bath temperature was measured with a thermometer connected to bath to
measure the glycerin temperature.
The actual readings of the three thermometers were calibrated using boiling
water and ice, both gave low errors compared with the boiling and freezing points
of water Appendix C-3.
4.5.2 Composition Measurements Each sample of the oil phase was taken from the bottom, at three equal
intervals from the time of reaction. The samples were analyzed using Gas
Chromatography (GC) in Iben Sina Company / Ministry of Industry and Minerals.
The type of GC was Packard equipped with a capillary column SE-30 (5m length
0.32cm i.d) and a flame ionization detector (FID). The temperatures of injector and
detector were set at 275oC and 350oC respectively. Helium gas (He) of high purity
Click t
o buy NOW!
PDF-XChange
ww
w.tracker-software.c
om Click t
o buy NOW!
PDF-XChange
ww
w.tracker-software
.com
73
was used as the carrier gas with flow of 30 ml / min. The oven temperature was
initially set at 100oC, increasing to 300oC, the temperature increase for both ramps
was set at 5oC/min.
4.5.3 Other Measurements Other measurements are studied such as acid value, FT-IR, Flash Point,
Viscosity, Density and Carbon Residue.
4.5.3.1 Acid value by Titration
Titration method is used to calculate acid value and the conversion of oleic
acid (FFA) to methyl oleate (biodiesel) for each sample.
The acid value from equation (4.1) represents the amount of oleic acid
(FFA), which decreases with time due to the consumption of FFA acid. The acid
value for the oleic acid (FFA) = 200 mg KOH/g FFA, so the conversion of oleic
acid was calculated using equation (4.3):
FFA
wtKOHKOHKOH
FFA
KOH
gMCVAV
gmgAV
1**
100*%0
0
t
ttt
AVAVAVConversion
Titration procedure is outlined below:
1. Measure 10 ml of ethanol in a test tube.
2. Weighing 1g of sample and mix with ethanol.
3. Add about 2-3 drops of phenolphthalein solution.
4. Add 0.1 M of KOH solution in the burette.
The titration is then performed by means of an alkaline 0.1M KOH solution.
The volume of KOH solution consumed is reported, and the acidity of the sample is
calculated using the equation (4.2).
…(4.1)
…(4.3)
…(4.2)
Click t
o buy NOW!
PDF-XChange
ww
w.tracker-software.c
om Click t
o buy NOW!
PDF-XChange
ww
w.tracker-software
.com
74
Oleic acid (FFA) and methyl oleate (biodiesel) compositions were measured
using GC and Titration techniques.
4.5.3.2 Analysis by Fourier Transforms Infrared spectroscopy (FT-
IR) FTIR (Fourier Transform Infra Red) is used to examine the functional groups
of molecules; this was by measuring the energy associated with the vibration of
atoms that are connected together. FTIR has been used to elucidate structures in
biodiesel (Sanford et. al., 2009).
The methyl oleate (biodiesel) samples were analyzed by FTIR with IR-
Prestige-21 spectrometer with Detuterated Triglycine Sulfate (DTGC) sampling
attachment and a resolution of 8° per cm-1. The spectra were taken at room
temperature and in a range of 4000 – 400 cm-1, air spectrum was used as the
background. Analysis and samples were carried out in Iben Sina Company /
Ministry of Industry and Minerals.
4.5.3.3 Flash Point Analyzer Biodiesel flash point is tested by using open cup flash point because the
product is already not containing methanol that is separated from the product by
RD. The flash points were measured using Cleveland open cup flash point tester
(Koehler Instrument Company, Inc. K13900) as shown in Figure 4.5, and for
obtaining a more accurate result a close cup method was also considered measured
by Pensky-Martens close cup tester (Koehler Instrument Company, Inc. K16200) as
shown in Figure 4.6, using ASTM D93, Standard Test Methods for Flash Point by
Pensky-Martens closed cup tester. The apparatus and method consist of the
controlled heating of the biodiesel in a closed cup, introducing an ignition source,
and observing if the heated biodiesel flashes, the temperature at which the biodiesel
flashes is the flash point. For biodiesel, a flash point of below 93°C is considered to
Click t
o buy NOW!
PDF-XChange
ww
w.tracker-software.c
om Click t
o buy NOW!
PDF-XChange
ww
w.tracker-software
.com
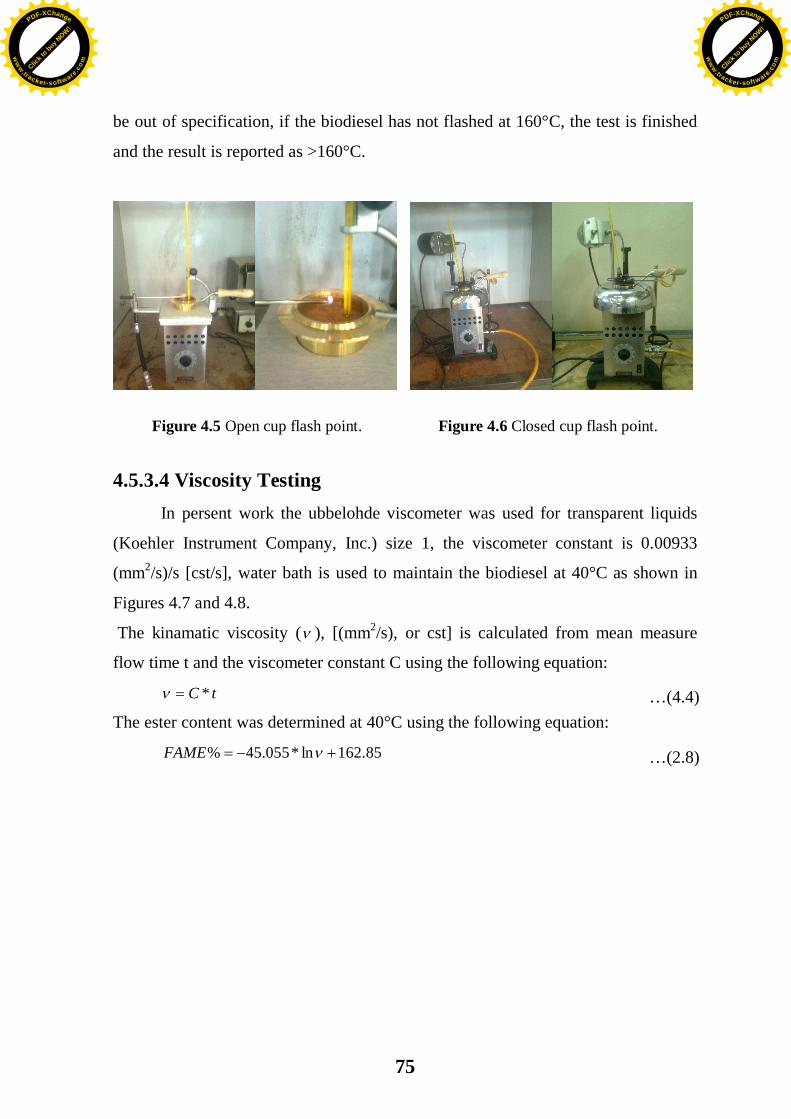
75
be out of specification, if the biodiesel has not flashed at 160°C, the test is finished
and the result is reported as >160°C.
Figure 4.5 Open cup flash point. Figure 4.6 Closed cup flash point.
4.5.3.4 Viscosity Testing
In persent work the ubbelohde viscometer was used for transparent liquids
(Koehler Instrument Company, Inc.) size 1, the viscometer constant is 0.00933
(mm2/s)/s [cst/s], water bath is used to maintain the biodiesel at 40°C as shown in
Figures 4.7 and 4.8.
The kinamatic viscosity ( ), [(mm2/s), or cst] is calculated from mean measure
flow time t and the viscometer constant C using the following equation:
tC *
The ester content was determined at 40°C using the following equation:
85.162ln*055.45%FAME
…(2.8)
…(4.4)
Click t
o buy NOW!
PDF-XChange
ww
w.tracker-software.c
om Click t
o buy NOW!
PDF-XChange
ww
w.tracker-software
.com
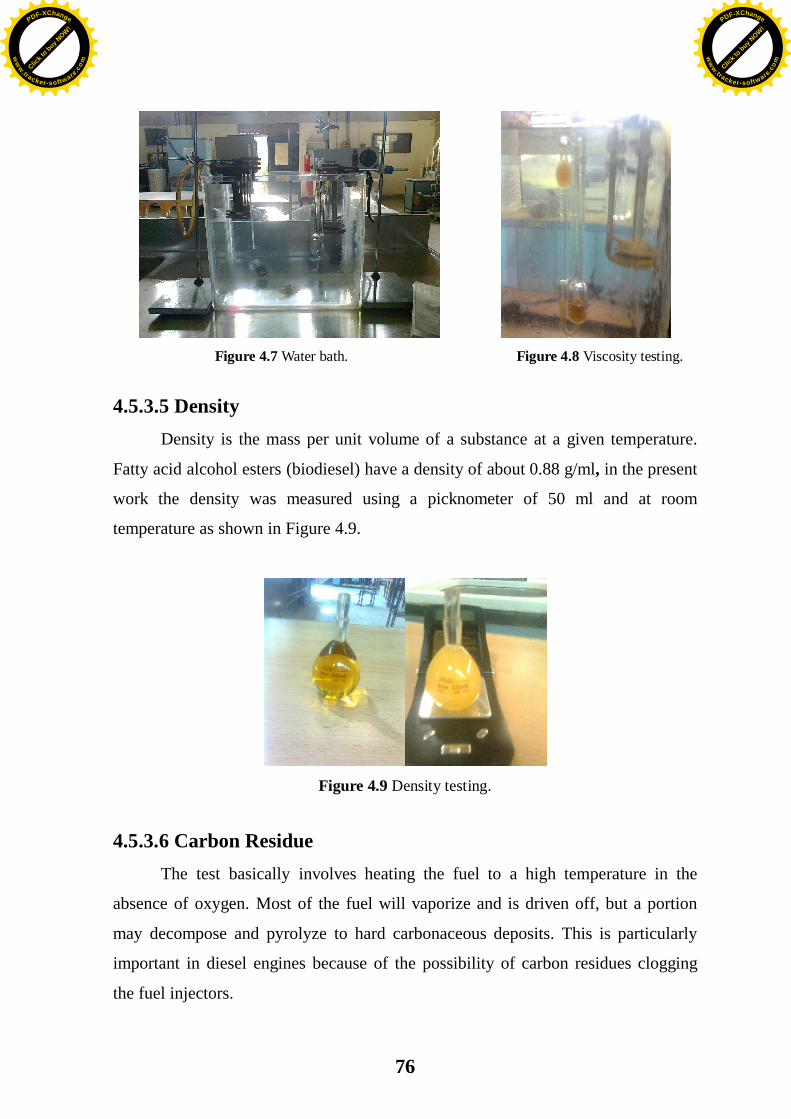
76
Figure 4.7 Water bath. Figure 4.8 Viscosity testing.
4.5.3.5 Density Density is the mass per unit volume of a substance at a given temperature.
Fatty acid alcohol esters (biodiesel) have a density of about 0.88 g/ml, in the present
work the density was measured using a picknometer of 50 ml and at room
temperature as shown in Figure 4.9.
Figure 4.9 Density testing.
4.5.3.6 Carbon Residue The test basically involves heating the fuel to a high temperature in the
absence of oxygen. Most of the fuel will vaporize and is driven off, but a portion
may decompose and pyrolyze to hard carbonaceous deposits. This is particularly
important in diesel engines because of the possibility of carbon residues clogging
the fuel injectors.
Click t
o buy NOW!
PDF-XChange
ww
w.tracker-software.c
om Click t
o buy NOW!
PDF-XChange
ww
w.tracker-software
.com
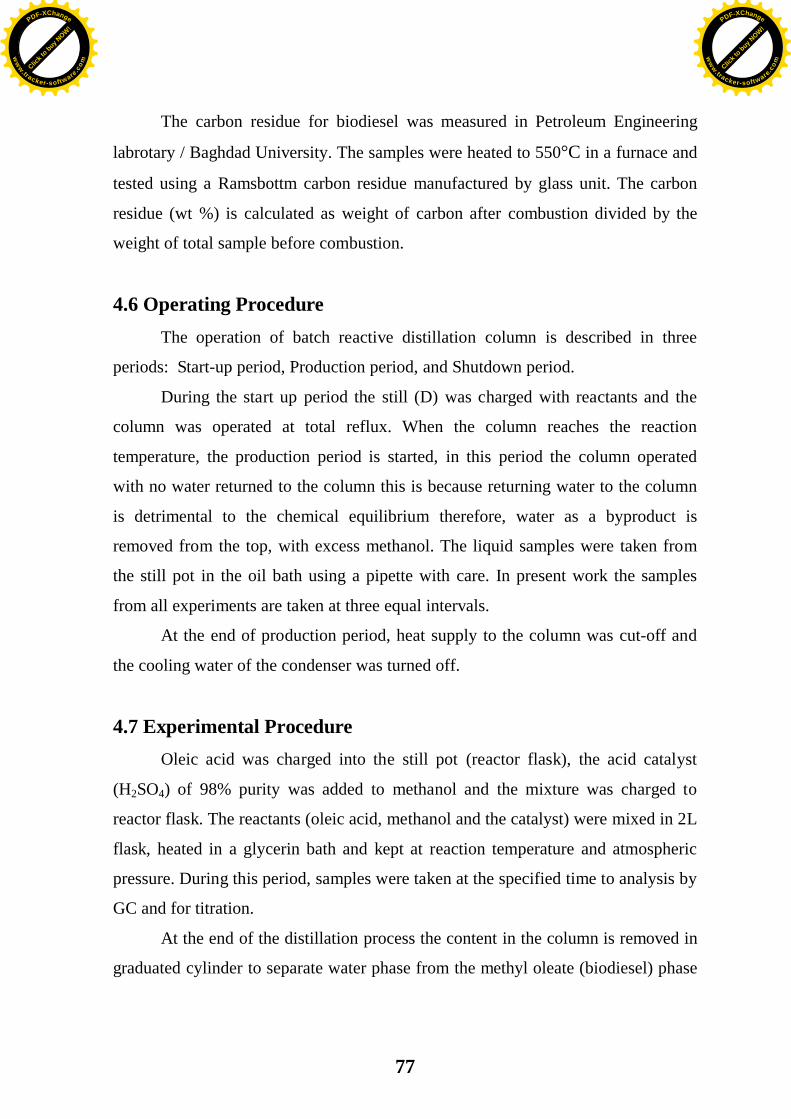
77
The carbon residue for biodiesel was measured in Petroleum Engineering
labrotary / Baghdad University. The samples were heated to 550°C in a furnace and
tested using a Ramsbottm carbon residue manufactured by glass unit. The carbon
residue (wt %) is calculated as weight of carbon after combustion divided by the
weight of total sample before combustion.
4.6 Operating Procedure The operation of batch reactive distillation column is described in three
periods: Start-up period, Production period, and Shutdown period. During the start up period the still (D) was charged with reactants and the
column was operated at total reflux. When the column reaches the reaction
temperature, the production period is started, in this period the column operated
with no water returned to the column this is because returning water to the column
is detrimental to the chemical equilibrium therefore, water as a byproduct is
removed from the top, with excess methanol. The liquid samples were taken from
the still pot in the oil bath using a pipette with care. In present work the samples
from all experiments are taken at three equal intervals.
At the end of production period, heat supply to the column was cut-off and
the cooling water of the condenser was turned off.
4.7 Experimental Procedure Oleic acid was charged into the still pot (reactor flask), the acid catalyst
(H2SO4) of 98% purity was added to methanol and the mixture was charged to
reactor flask. The reactants (oleic acid, methanol and the catalyst) were mixed in 2L
flask, heated in a glycerin bath and kept at reaction temperature and atmospheric
pressure. During this period, samples were taken at the specified time to analysis by
GC and for titration.
At the end of the distillation process the content in the column is removed in
graduated cylinder to separate water phase from the methyl oleate (biodiesel) phase
Click t
o buy NOW!
PDF-XChange
ww
w.tracker-software.c
om Click t
o buy NOW!
PDF-XChange
ww
w.tracker-software
.com

78
if water is available, where esterfication of fatty acid is a reversible reaction and
water is formed. Removal of water can drive the reaction equilibrium to the
completion and therefore increase the conversion. By removing water as by product
the equilibrium is shifted towards ester methyl oleate (biodiesel) formation. The
biodiesel will always be separated at the bottom of the reactive distillation column.
Water is present as a side product and typically is removed as top product due to its
lower boiling point, together with the methanol. Thus, higher reflux ratio is not
beneficial as it brings back water into the column, hence decreasing the conversion
by shifting the equilibrium towards ester hydrolysis; therefore, in the present work
no reflux is considered (Kiss et. al., 2009 and Kusmiyati et. al., 2010).
4.7.1 Experimental Variables
In order to determine the best conditions for methyl oleate (biodiesel) production
by batch reactive distillation, the experiments were carried out using different
variables as follows:
1. The effect of molar ratio of methanol to oleic acid: In the present work three
molar ratio of methanol to oleic acid 4:1, 6:1 and 8:1 were chosen and excess
methanol is used because the reaction equilibrium is shifted towards the biodiesel
production.
2. The effect of amount of catalyst: A concentrated sulfuric acid 98% is used as a
catalyst with amount of 0.6, 1.2, and 1.8 g sulfuric acid/g oleic acid in the present
work.
3. The effect of reaction time: Three reaction times of 36, 57, and 75 minutes were
chosen in the present work.
4. The effect of reaction temperature: Three temperatures were chosen in the present
work 100oC, 120oC, and 130oC and the best working condition is at temperature
above 100oC in a system with continuous water removal and when the temperature
is greater than 130oC a degradation of biodiesel takes place this is because of the
loose of methanol.
Click t
o buy NOW!
PDF-XChange
ww
w.tracker-software.c
om Click t
o buy NOW!
PDF-XChange
ww
w.tracker-software
.com
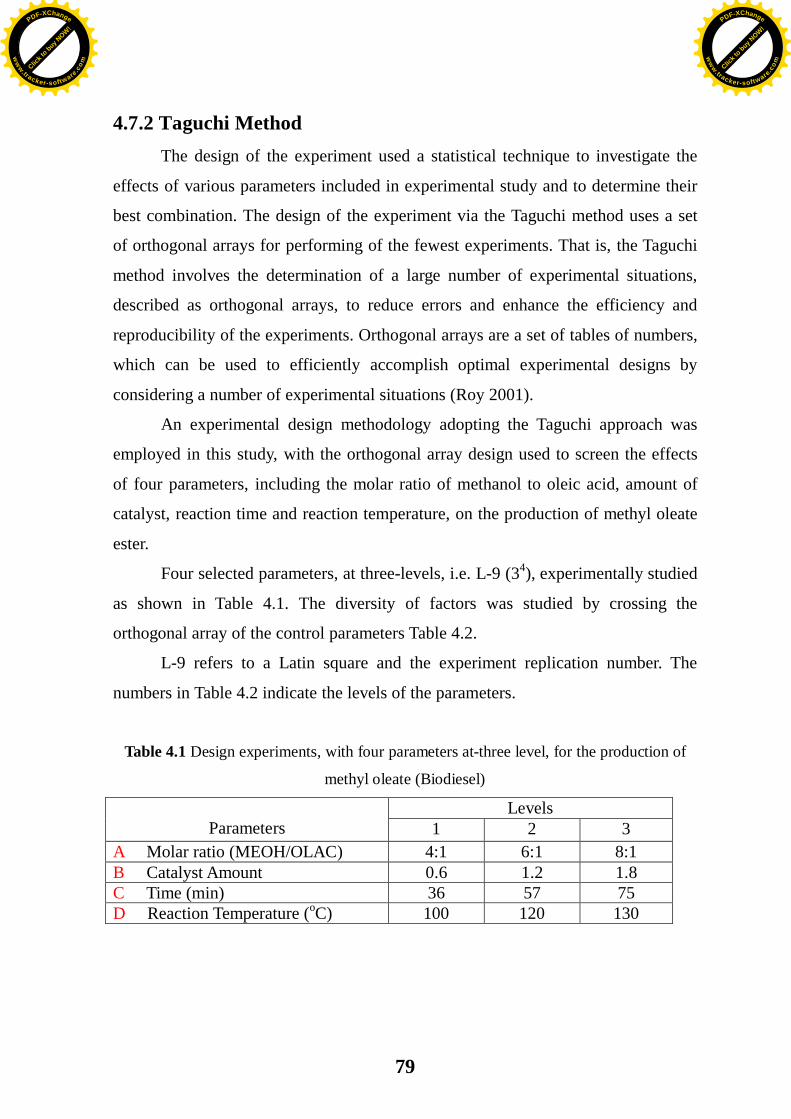
79
4.7.2 Taguchi Method
The design of the experiment used a statistical technique to investigate the
effects of various parameters included in experimental study and to determine their
best combination. The design of the experiment via the Taguchi method uses a set
of orthogonal arrays for performing of the fewest experiments. That is, the Taguchi
method involves the determination of a large number of experimental situations,
described as orthogonal arrays, to reduce errors and enhance the efficiency and
reproducibility of the experiments. Orthogonal arrays are a set of tables of numbers,
which can be used to efficiently accomplish optimal experimental designs by
considering a number of experimental situations (Roy 2001).
An experimental design methodology adopting the Taguchi approach was
employed in this study, with the orthogonal array design used to screen the effects
of four parameters, including the molar ratio of methanol to oleic acid, amount of
catalyst, reaction time and reaction temperature, on the production of methyl oleate
ester.
Four selected parameters, at three-levels, i.e. L-9 (34), experimentally studied
as shown in Table 4.1. The diversity of factors was studied by crossing the
orthogonal array of the control parameters Table 4.2.
L-9 refers to a Latin square and the experiment replication number. The
numbers in Table 4.2 indicate the levels of the parameters.
Table 4.1 Design experiments, with four parameters at-three level, for the production of
methyl oleate (Biodiesel)
Levels 3 2 1
Parameters
8:1 6:1 4:1 A Molar ratio (MEOH/OLAC) 1.8 1.2 0.6 B Catalyst Amount 75 57 36 C Time (min)
130 120 100 D Reaction Temperature (oC)
Click t
o buy NOW!
PDF-XChange
ww
w.tracker-software.c
om Click t
o buy NOW!
PDF-XChange
ww
w.tracker-software
.com
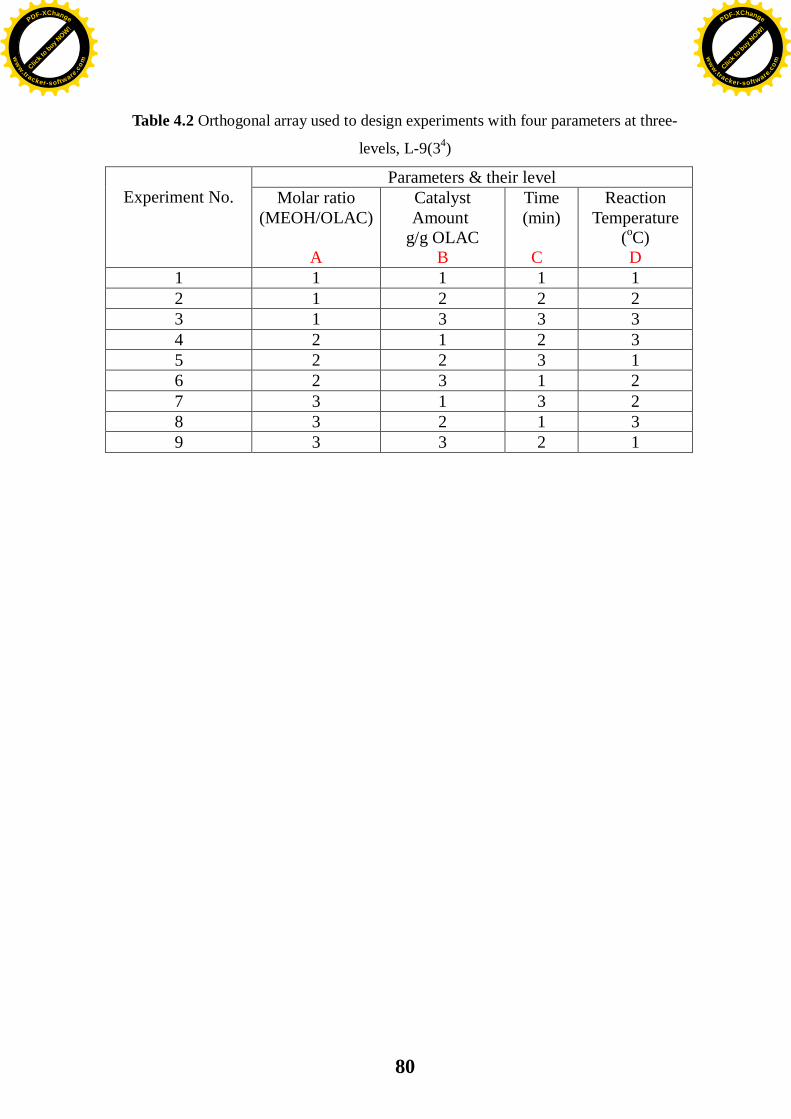
80
Table 4.2 Orthogonal array used to design experiments with four parameters at three-
levels, L-9(34)
Parameters & their level Reaction
Temperature (oC) D
Time (min)
C
Catalyst Amount
g/g OLAC B
Molar ratio (MEOH/OLAC)
A
Experiment No.
1 1 1 1 1 2 2 2 1 2 3 3 3 1 3 3 2 1 2 4 1 3 2 2 5 2 1 3 2 6 2 3 1 3 7 3 1 2 3 8 1 2 3 3 9
Click t
o buy NOW!
PDF-XChange
ww
w.tracker-software.c
om Click t
o buy NOW!
PDF-XChange
ww
w.tracker-software
.com
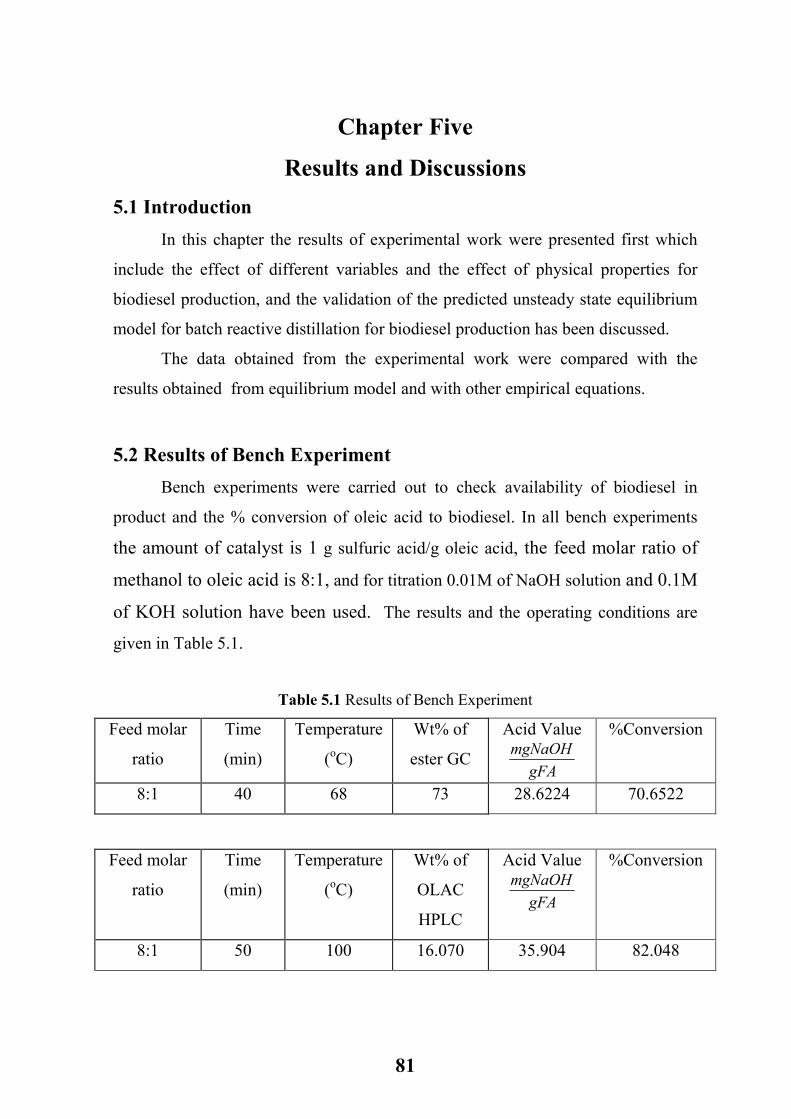
81
Chapter Five
Results and Discussions
5.1 Introduction
In this chapter the results of experimental work were presented first which
include the effect of different variables and the effect of physical properties for
biodiesel production, and the validation of the predicted unsteady state equilibrium
model for batch reactive distillation for biodiesel production has been discussed.
The data obtained from the experimental work were compared with the
results obtained from equilibrium model and with other empirical equations.
5.2 Results of Bench Experiment
Bench experiments were carried out to check availability of biodiesel in
product and the % conversion of oleic acid to biodiesel. In all bench experiments
the amount of catalyst is 1 g sulfuric acid/g oleic acid, the feed molar ratio of
methanol to oleic acid is 8:1, and for titration 0.01M of NaOH solution and 0.1M
of KOH solution have been used. The results and the operating conditions are
given in Table 5.1.
Table 5.1 Results of Bench Experiment
Feed molar
ratio
Time
(min)
Temperature
(oC)
Wt% of
ester GC
Acid Value
gFAmgNaOH
%Conversion
8:1 40 68 73 28.6224 70.6522
Feed molar
ratio
Time
(min)
Temperature
(oC)
Wt% of
OLAC
HPLC
Acid Value
gFAmgNaOH
%Conversion
8:1 50 100 16.070 35.904 82.048
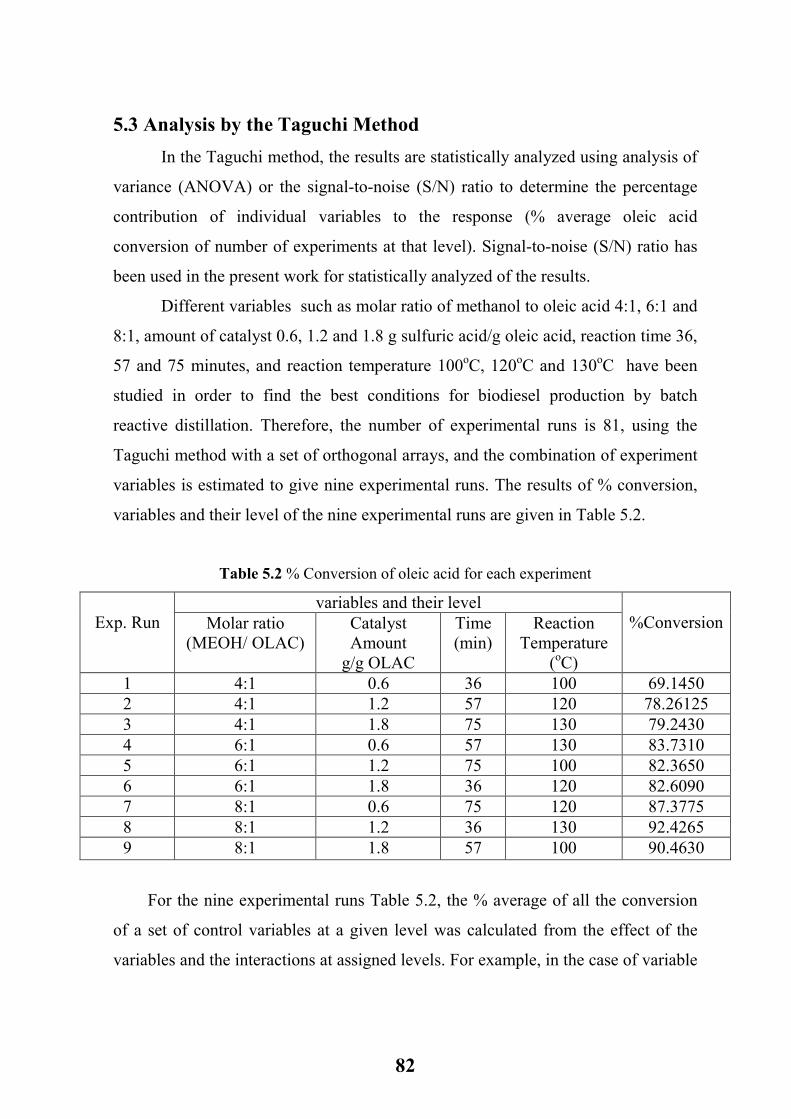
82
5.3 Analysis by the Taguchi Method
In the Taguchi method, the results are statistically analyzed using analysis of
variance (ANOVA) or the signal-to-noise (S/N) ratio to determine the percentage
contribution of individual variables to the response (% average oleic acid
conversion of number of experiments at that level). Signal-to-noise (S/N) ratio has
been used in the present work for statistically analyzed of the results.
Different variables such as molar ratio of methanol to oleic acid 4:1, 6:1 and
8:1, amount of catalyst 0.6, 1.2 and 1.8 g sulfuric acid/g oleic acid, reaction time 36,
57 and 75 minutes, and reaction temperature 100oC, 120oC and 130oC have been
studied in order to find the best conditions for biodiesel production by batch
reactive distillation. Therefore, the number of experimental runs is 81, using the
Taguchi method with a set of orthogonal arrays, and the combination of experiment
variables is estimated to give nine experimental runs. The results of % conversion,
variables and their level of the nine experimental runs are given in Table 5.2.
Table 5.2 % Conversion of oleic acid for each experiment
%Conversion
variables and their level Exp. Run Reaction
Temperature (oC)
Time (min)
Catalyst Amount g/g OLAC
Molar ratio (MEOH/ OLAC)
69.1450 100 36 0.6 4:1 1 78.26125 120 57 1.2 4:1 2 79.2430 130 75 1.8 4:1 3 83.7310 130 57 0.6 6:1 4 82.3650 100 75 1.2 6:1 5 82.6090 120 36 1.8 6:1 6 87.3775 120 75 0.6 8:1 7 92.4265 130 36 1.2 8:1 8 90.4630 100 57 1.8 8:1 9
For the nine experimental runs Table 5.2, the % average of all the conversion
of a set of control variables at a given level was calculated from the effect of the
variables and the interactions at assigned levels. For example, in the case of variable
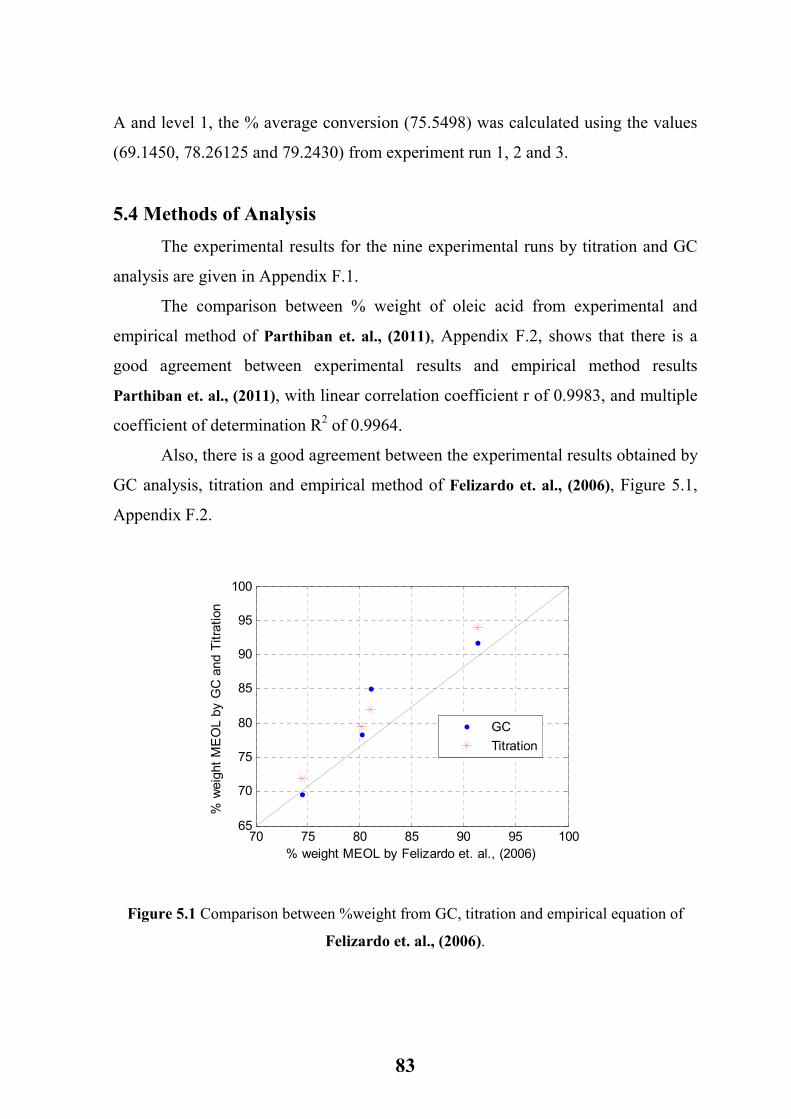
83
A and level 1, the % average conversion (75.5498) was calculated using the values
(69.1450, 78.26125 and 79.2430) from experiment run 1, 2 and 3.
5.4 Methods of Analysis
The experimental results for the nine experimental runs by titration and GC
analysis are given in Appendix F.1.
The comparison between % weight of oleic acid from experimental and
empirical method of Parthiban et. al., (2011), Appendix F.2, shows that there is a
good agreement between experimental results and empirical method results
Parthiban et. al., (2011), with linear correlation coefficient r of 0.9983, and multiple
coefficient of determination R2 of 0.9964.
Also, there is a good agreement between the experimental results obtained by
GC analysis, titration and empirical method of Felizardo et. al., (2006), Figure 5.1,
Appendix F.2.
70 75 80 85 90 95 10065
70
75
80
85
90
95
100
% weight MEOL by Felizardo et. al., (2006)
% weight MEOL by GC and Titration
GCTitration
Figure 5.1 Comparison between %weight from GC, titration and empirical equation of
Felizardo et. al., (2006).
84
In the present work the effect of all variables studied and their comparison is
based on titration results, this is because the complicated GC analysis and for each
sample the analysis must be twice, one by using FID detector (high boiling
component and not sense water) and secondly by TCD (low boiling compound). It
was indicated from the analysis of some samples that the fraction of methanol and
water is very small in organic layer can be neglected, similar things were noticed
from the flash point analysis and FTIR analysis.
5.5 Results of Experimental Batch Reactive Distillation Unit
5.5.1 Effect of Molar Ratio
Molar ratio of methanol to oleic acid is one of the most important variables
that are affecting the conversion of oleic acid. In the present work methyl oleate
(biodiesel) was produced from reaction of oleic acid and methanol using various
molar ratios of methanol/oleic acid of 4:1, 6:1 and 8:1. Stoichiometrically, the
methanol/oleic acid molar ratio required was 1:1. But, in practice this was not
sufficient to complete the reaction. Higher amount of methanol was required to
drive the reaction to completion at faster rate.
The molar ratio of methanol/oleic acid increases the % average conversion of
oleic acid increases as shown in Figure 5.2. The highest % conversion of oleic acid
is 92.42655, for experiment number 8 and the feed molar ratio of methanol to oleic
acid is 8:1. This increase is explained by the shift in the equilibrium which is caused
by the excess of methanol, so the effect of backward reaction is small, and can be
neglected when using excess methanol (higher molar ratio of methanol to oleic
acid).
This increase also can be explained by the emulsion system changes from
dispersion of methanol into oleic acid towards dispersion of oleic acid into
methanol. This transformation results cause an increase in the interfacial area up to
a point above which the interfacial area starts to decrease as the cavitations in

85
methanol phase is much easier than in oleic acid phase due to viscosity difference
(Mahamuni et. al., 2010).
The results of different molar ratios on the % conversion of oleic acid
for the nine experiments are given in Appendix F.3.
4 5 6 7 875
80
85
90
95
Molar Ratio (MEOH/OLAC)
% Average Conversion
Figure 5.2 Effect of molar ratio on % average conversion (main effects).
5.5.2 Effect of Catalyst Amount
The amount of catalyst has significant effects on the conversion of
esterfication reaction. The reaction rate of esterfication reaction is directly
proportional to the amount of a catalyst, so the catalyst is used to enhance the
reaction rate and conversion. It gives lower activation energy, thus, more products
will be formed, and the amount of sulfuric acid employed as a catalyst is related to
formation of H+ that catalyzes the reaction. Increasing the amount of catalyst
increase the reaction rate and consequently reduces the time to achieve a high
conversion.
In the present work different amounts of catalyst of 0.6, 1.2 and 1.8 g
sulfuric acid/g oleic acid have been used. The effective amount of catalyst is 1.2,
when the amount of catalyst is 0.6 the % average conversion of oleic acid is
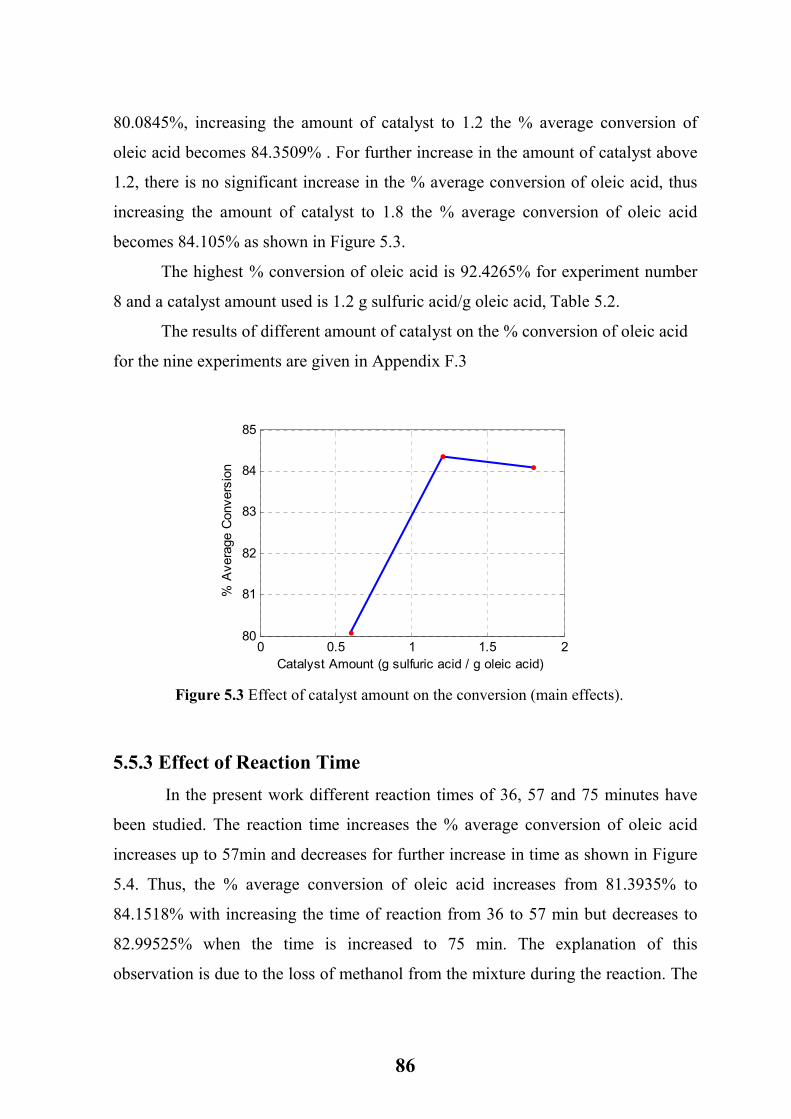
86
80.0845%, increasing the amount of catalyst to 1.2 the % average conversion of
oleic acid becomes 84.3509% . For further increase in the amount of catalyst above
1.2, there is no significant increase in the % average conversion of oleic acid, thus
increasing the amount of catalyst to 1.8 the % average conversion of oleic acid
becomes 84.105% as shown in Figure 5.3.
The highest % conversion of oleic acid is 92.4265% for experiment number
8 and a catalyst amount used is 1.2 g sulfuric acid/g oleic acid, Table 5.2.
The results of different amount of catalyst on the % conversion of oleic acid
for the nine experiments are given in Appendix F.3
0 0.5 1 1.5 280
81
82
83
84
85
Catalyst Amount (g sulfuric acid / g oleic acid)
% Average Conversion
Figure 5.3 Effect of catalyst amount on the conversion (main effects).
5.5.3 Effect of Reaction Time
In the present work different reaction times of 36, 57 and 75 minutes have
been studied. The reaction time increases the % average conversion of oleic acid
increases up to 57min and decreases for further increase in time as shown in Figure
5.4. Thus, the % average conversion of oleic acid increases from 81.3935% to
84.1518% with increasing the time of reaction from 36 to 57 min but decreases to
82.99525% when the time is increased to 75 min. The explanation of this
observation is due to the loss of methanol from the mixture during the reaction. The
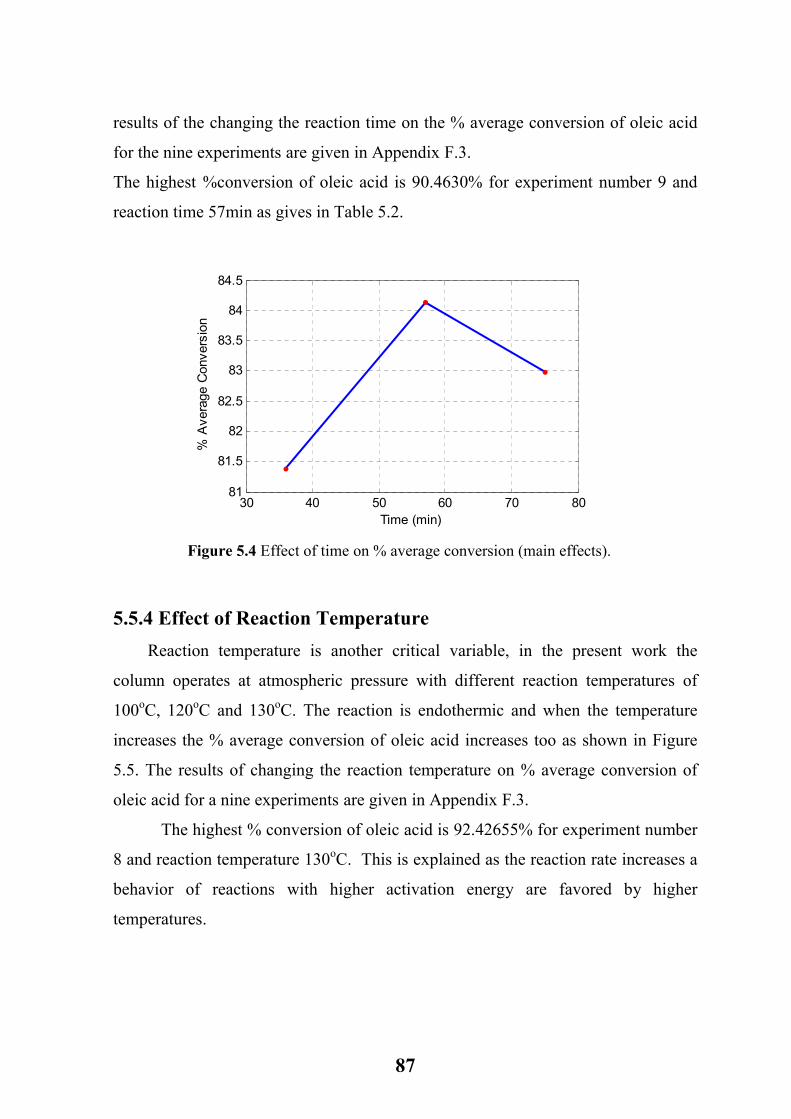
87
results of the changing the reaction time on the % average conversion of oleic acid
for the nine experiments are given in Appendix F.3.
The highest %conversion of oleic acid is 90.4630% for experiment number 9 and
reaction time 57min as gives in Table 5.2.
30 40 50 60 70 8081
81.5
82
82.5
83
83.5
84
84.5
Time (min)
% Average Conversion
Figure 5.4 Effect of time on % average conversion (main effects).
5.5.4 Effect of Reaction Temperature
Reaction temperature is another critical variable, in the present work the
column operates at atmospheric pressure with different reaction temperatures of
100oC, 120oC and 130oC. The reaction is endothermic and when the temperature
increases the % average conversion of oleic acid increases too as shown in Figure
5.5. The results of changing the reaction temperature on % average conversion of
oleic acid for a nine experiments are given in Appendix F.3.
The highest % conversion of oleic acid is 92.42655% for experiment number
8 and reaction temperature 130oC. This is explained as the reaction rate increases a
behavior of reactions with higher activation energy are favored by higher
temperatures.
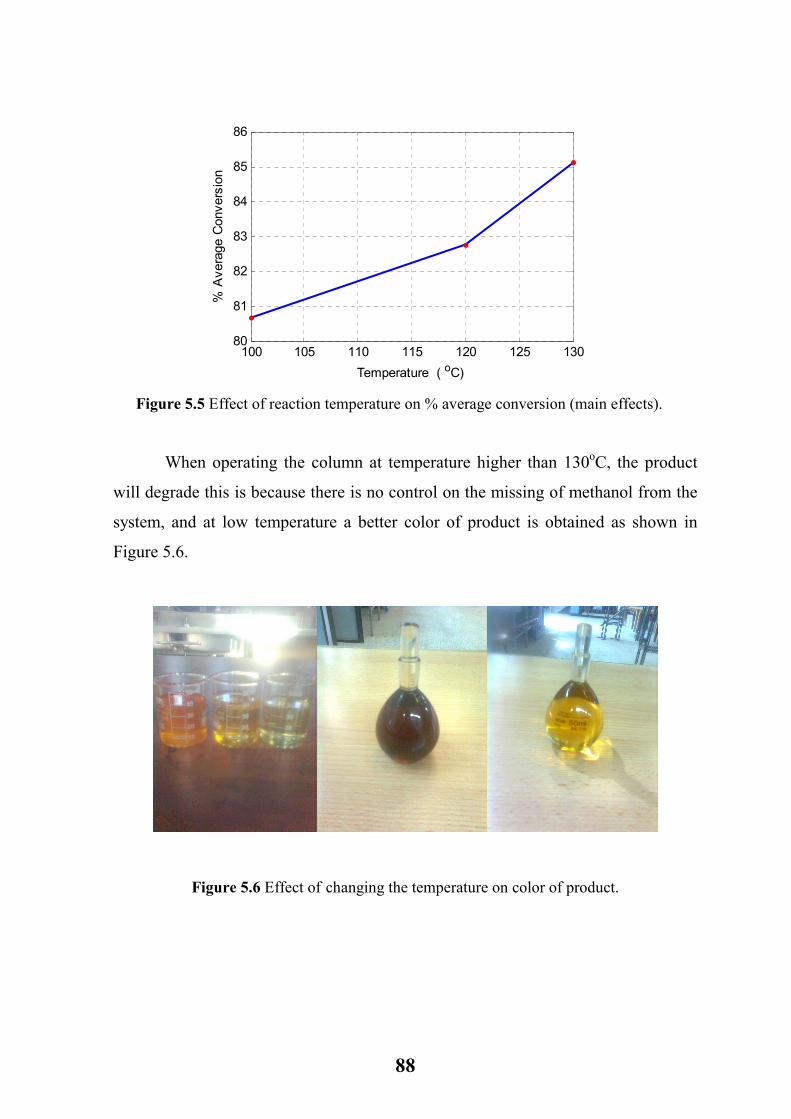
88
100 105 110 115 120 125 13080
81
82
83
84
85
86
Temperature ( oC)
% Average Conversion
Figure 5.5 Effect of reaction temperature on % average conversion (main effects).
When operating the column at temperature higher than 130oC, the product
will degrade this is because there is no control on the missing of methanol from the
system, and at low temperature a better color of product is obtained as shown in
Figure 5.6.
Figure 5.6 Effect of changing the temperature on color of product.
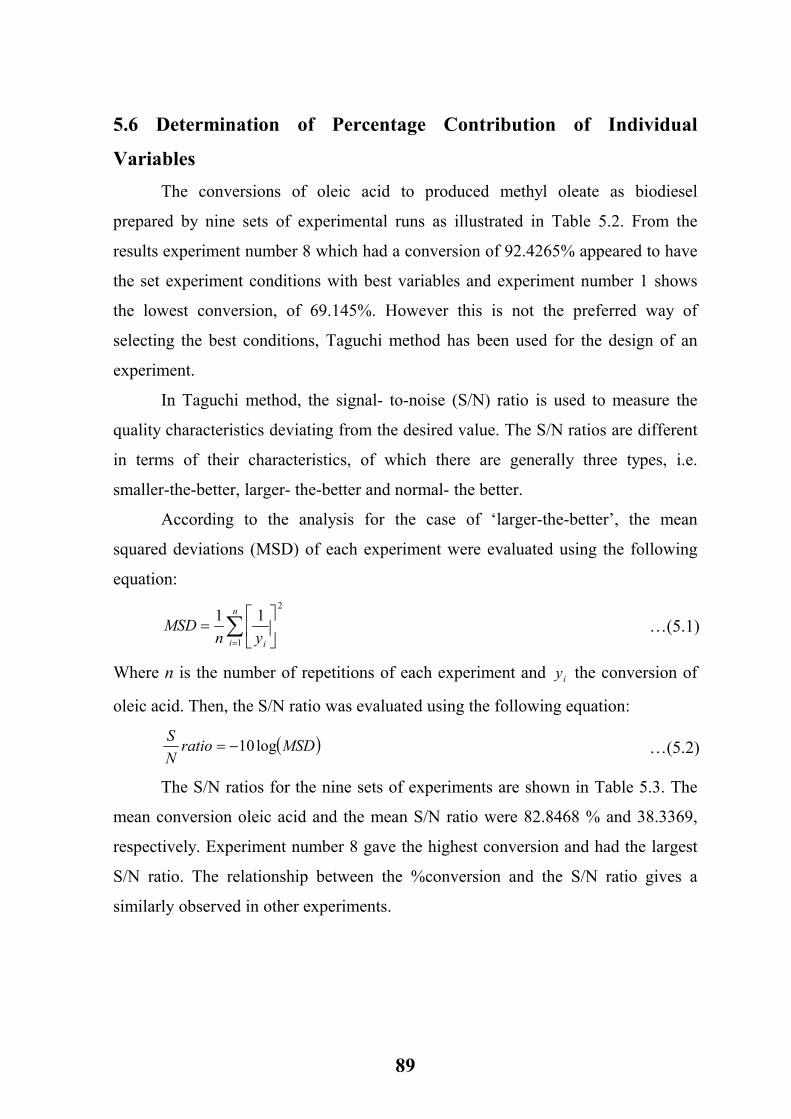
89
5.6 Determination of Percentage Contribution of Individual
Variables
The conversions of oleic acid to produced methyl oleate as biodiesel
prepared by nine sets of experimental runs as illustrated in Table 5.2. From the
results experiment number 8 which had a conversion of 92.4265% appeared to have
the set experiment conditions with best variables and experiment number 1 shows
the lowest conversion, of 69.145%. However this is not the preferred way of
selecting the best conditions, Taguchi method has been used for the design of an
experiment.
In Taguchi method, the signal- to-noise (S/N) ratio is used to measure the
quality characteristics deviating from the desired value. The S/N ratios are different
in terms of their characteristics, of which there are generally three types, i.e.
smaller-the-better, larger- the-better and normal- the better.
According to the analysis for the case of ‘larger-the-better’, the mean
squared deviations (MSD) of each experiment were evaluated using the following
equation: 2
1
11∑=
=
n
i iynMSD
Where n is the number of repetitions of each experiment and iy the conversion of
oleic acid. Then, the S/N ratio was evaluated using the following equation:
( )MSDratioNS
log10−=
The S/N ratios for the nine sets of experiments are shown in Table 5.3. The
mean conversion oleic acid and the mean S/N ratio were 82.8468 % and 38.3369,
respectively. Experiment number 8 gave the highest conversion and had the largest
S/N ratio. The relationship between the %conversion and the S/N ratio gives a
similarly observed in other experiments.
…(5.2)
…(5.1)

90
Table 5.3 %Conversions and S/N ratios for the nine sets of experiments
Exp. No. % conversion of oleic acid S/N ratio
1 69.1450 36.7952 2 78.26125 37.8709 3 79.2430 37.9792 4 83.7310 38.4577 5 82.3650 38.3149 6 82.6090 38.3405 7 87.3775 38.8280 8 92.4265 39.3159 9 90.4630 39.1294 mean conversion of methyl oleate (%) =
82.8468 Mean S/N ratio =
38.3369
The mean S/N ratio was calculated from the effect of the variables and the
interactions at assigned levels this means the average of all the S/N ratios of a set of
control variables at a given level. For example, in the case of variable A and level 1,
the mean S/N ratio (37.5484) was calculated using the values (36.7952, 37.8709 and
37.9792) from experiment numbers 1 to 3 in Table 4.2. In the case of parameter A
and level 2, the mean S/N ratio (38.3710) was calculated using the values (38.4577,
38.3149 and 38.3405) from experiment numbers 4 to 6 in Table 4.2, and so on. The
mean S/N ratio and the difference in two levels are given in Tables 5.4 and 5.5.
Table 5.4 Mean S/N ratio at a given level
Variables Levels 1 2 3
A Molar ratio (MEOH/OLAC) 37.5484 38.3710 38.8281 B Catalyst Amount 38.0269 38.5006 38.4830 C Time (min) 38.1505 38.4860 38.3740 D Reaction Temperature (oC) 38.0798 38.3455 38.5843

91
Table 5.5 the difference between two levels
Variables Difference 12−L 13−L 23−L
A Molar ratio (MEOH/OLAC) 0.8226 1.2797 0.4571 B Catalyst Amount 0.4737 0.4561 - 0.0176 C Time (min) 0.3355 0.2235 -0.1120 D Reaction Temperature (oC) 0.2657 0.5045 0.2388
The contribution of an experimental variable was calculated from the maximum
difference in the values between the mean S/N ratios at each level Table 5.6.
Table 5.6 The distribution of the four influential variables
Variables Max. Difference Contribution (%) A Molar ratio (MEOH/OLAC) 1.2797 49.3445 B Catalyst Amount 0.4737 18.2656 C Time (min) 0.3355 12.9367 D Reaction Temperature (oC) 0.5045 19.4532
Total 2.5934 100
The order of influence of the parameters in terms of the conversions was:
A Molar ratio (MEOH/OLAC) > D Reaction Temperature (oC) > B Catalyst
Amount (g sulfuric acid/g oleic acid) > C Time (min). Figure 5.7 illustrates the
percentage contribution of individual variables on variation in oleic acid conversion.
49.3445
18.265612.9367
19.4532
05101520253035404550
%Contribution
A Molar Ratio B CatalystAmount
C Time (min) D ReactionTemperature
Variable
Figure 5.7 Percentage contribution of individual variables on variation in oleic acid conversion.
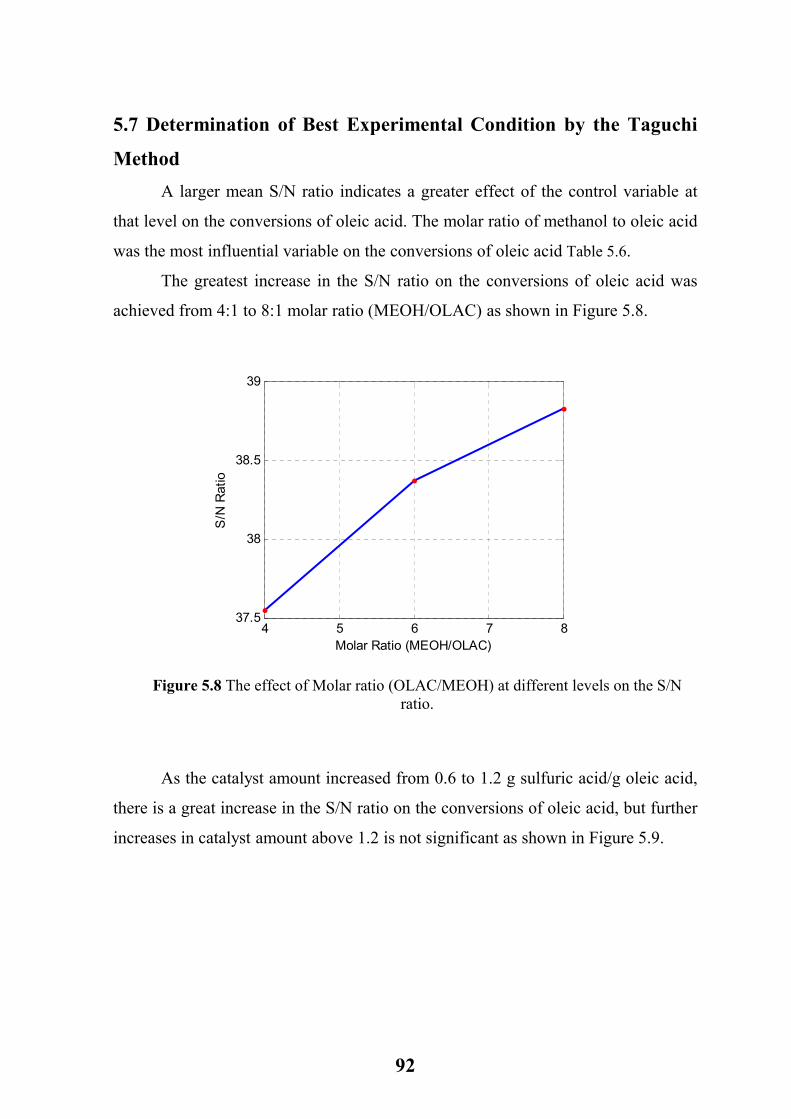
92
5.7 Determination of Best Experimental Condition by the Taguchi
Method
A larger mean S/N ratio indicates a greater effect of the control variable at
that level on the conversions of oleic acid. The molar ratio of methanol to oleic acid
was the most influential variable on the conversions of oleic acid Table 5.6.
The greatest increase in the S/N ratio on the conversions of oleic acid was
achieved from 4:1 to 8:1 molar ratio (MEOH/OLAC) as shown in Figure 5.8.
4 5 6 7 837.5
38
38.5
39
Molar Ratio (MEOH/OLAC)
S/N Ratio
Figure 5.8 The effect of Molar ratio (OLAC/MEOH) at different levels on the S/N ratio.
As the catalyst amount increased from 0.6 to 1.2 g sulfuric acid/g oleic acid,
there is a great increase in the S/N ratio on the conversions of oleic acid, but further
increases in catalyst amount above 1.2 is not significant as shown in Figure 5.9.
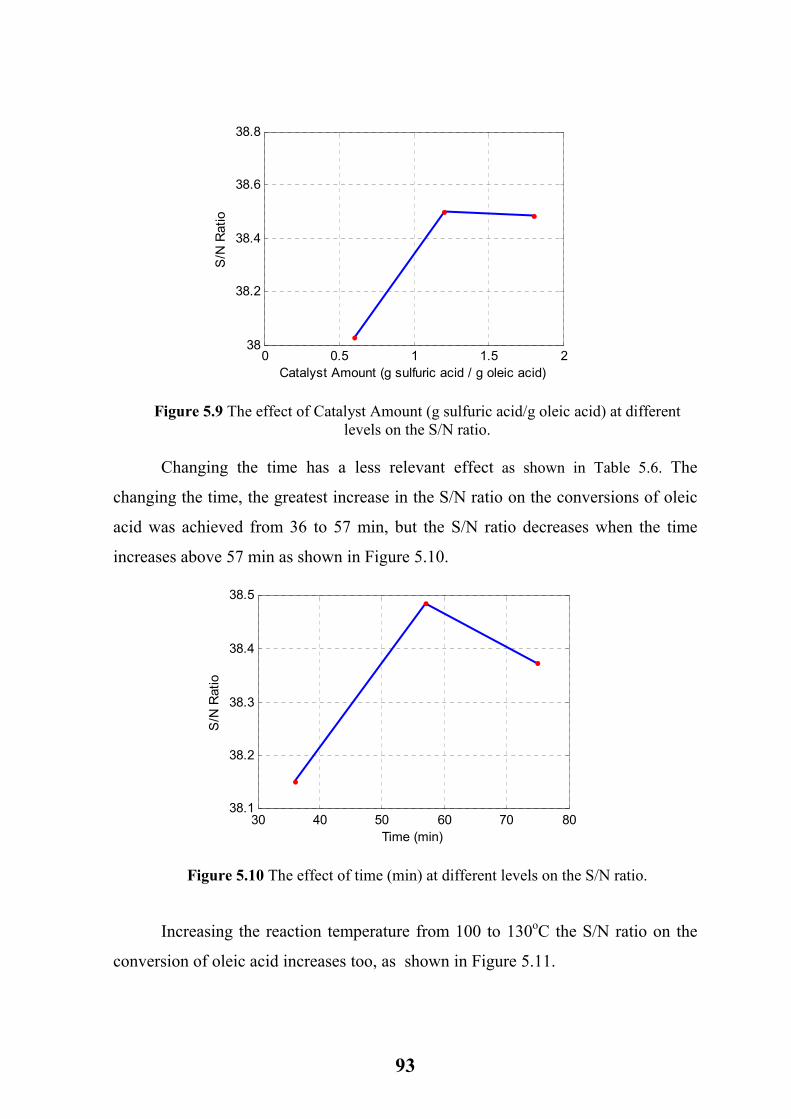
93
0 0.5 1 1.5 238
38.2
38.4
38.6
38.8
Catalyst Amount (g sulfuric acid / g oleic acid)
S/N Ratio
Figure 5.9 The effect of Catalyst Amount (g sulfuric acid/g oleic acid) at different levels on the S/N ratio.
Changing the time has a less relevant effect as shown in Table 5.6. The
changing the time, the greatest increase in the S/N ratio on the conversions of oleic
acid was achieved from 36 to 57 min, but the S/N ratio decreases when the time
increases above 57 min as shown in Figure 5.10.
30 40 50 60 70 8038.1
38.2
38.3
38.4
38.5
Time (min)
S/N Ratio
Figure 5.10 The effect of time (min) at different levels on the S/N ratio.
Increasing the reaction temperature from 100 to 130oC the S/N ratio on the
conversion of oleic acid increases too, as shown in Figure 5.11.
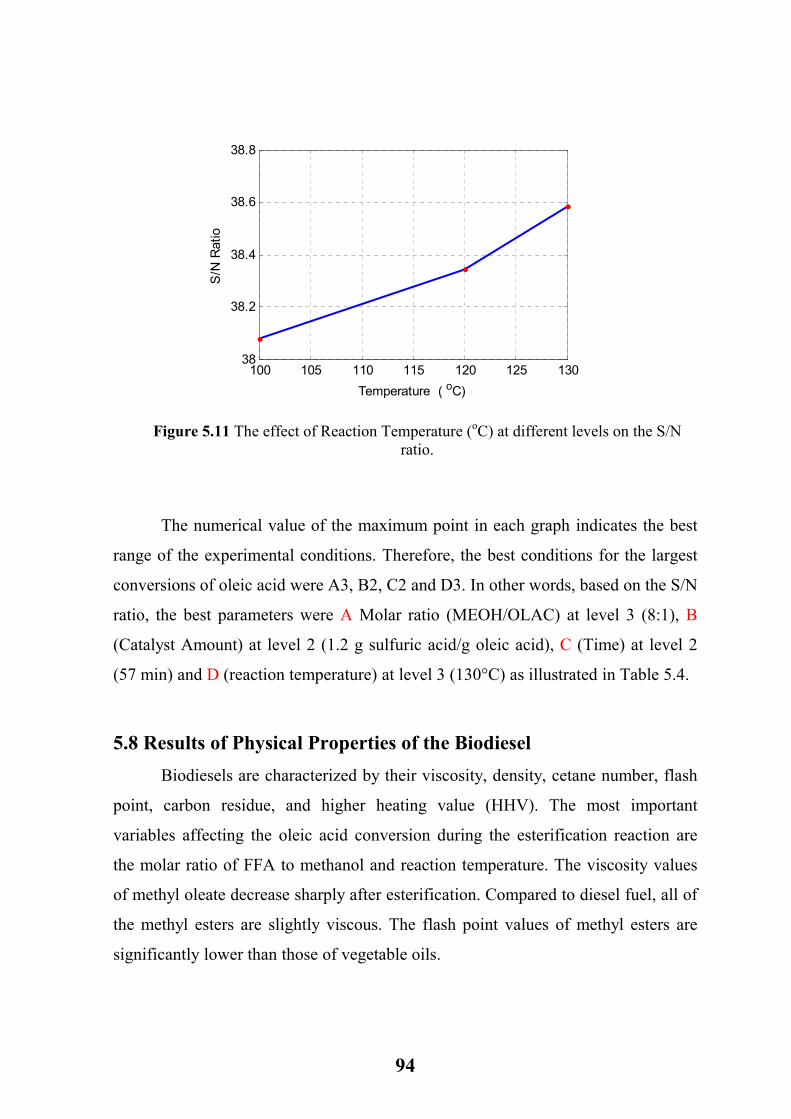
94
100 105 110 115 120 125 13038
38.2
38.4
38.6
38.8
Temperature ( oC)
S/N Ratio
Figure 5.11 The effect of Reaction Temperature (oC) at different levels on the S/N ratio.
The numerical value of the maximum point in each graph indicates the best
range of the experimental conditions. Therefore, the best conditions for the largest
conversions of oleic acid were A3, B2, C2 and D3. In other words, based on the S/N
ratio, the best parameters were A Molar ratio (MEOH/OLAC) at level 3 (8:1), B
(Catalyst Amount) at level 2 (1.2 g sulfuric acid/g oleic acid), C (Time) at level 2
(57 min) and D (reaction temperature) at level 3 (130°C) as illustrated in Table 5.4.
5.8 Results of Physical Properties of the Biodiesel
Biodiesels are characterized by their viscosity, density, cetane number, flash
point, carbon residue, and higher heating value (HHV). The most important
variables affecting the oleic acid conversion during the esterification reaction are
the molar ratio of FFA to methanol and reaction temperature. The viscosity values
of methyl oleate decrease sharply after esterification. Compared to diesel fuel, all of
the methyl esters are slightly viscous. The flash point values of methyl esters are
significantly lower than those of vegetable oils.

95
5.8.1 Density
The density of the biodiesel produced was conducted and found to be in the
range 0.87-0.88 g/ml. When comparing the average of the results 0.8787 g/ml with
the ASTM D6751 for biodiesel 0.870–0.890 g/ml which is acceptable.
Table 5.7 Density of the experimental results measured
Density g/ml
variables and their level Exp. Run Reaction
Temperature (oC)
Time (min)
Catalyst Amount g/g OLAC
Molar ratio (MEOH/ OLAC)
0.8830 100 36 0.6 4:1 1 0.8800 120 57 1.2 4:1 2 0.8794 130 75 1.8 4:1 3 0.8824 130 57 0.6 6:1 4 0.8828 100 75 1.2 6:1 5 0.8708 120 36 1.8 6:1 6 0.8786 120 75 0.6 8:1 7 0.8754 130 36 1.2 8:1 8 0.8760 100 57 1.8 8:1 9 0.8750 130 57 1.2 8:1 Best Exp.
In the present work the density of biodiesel decreased with increasing molar
ratio, this is because the amount of oleic acid decreased.
5.8.2 Kinematic Viscosity The viscosities of a sample of biodiesel analyzed are illustrated in Table 5.8.
The viscosities of the biodiesel produced at lower temperature (Exp.1) are higher
than that of the corresponding experiments conducted with the same feed ratio but
at higher temperatures (Exp.2 and 3) as gives in Table 5.8. Esterification reaction is responsible for minimizing the viscosity of free
fatty acid in order to use it as a fuel for engines, this because the high viscosity of
free fatty acid leads to operational problem such as engine deposit (Knothe et. al.,
2005b).
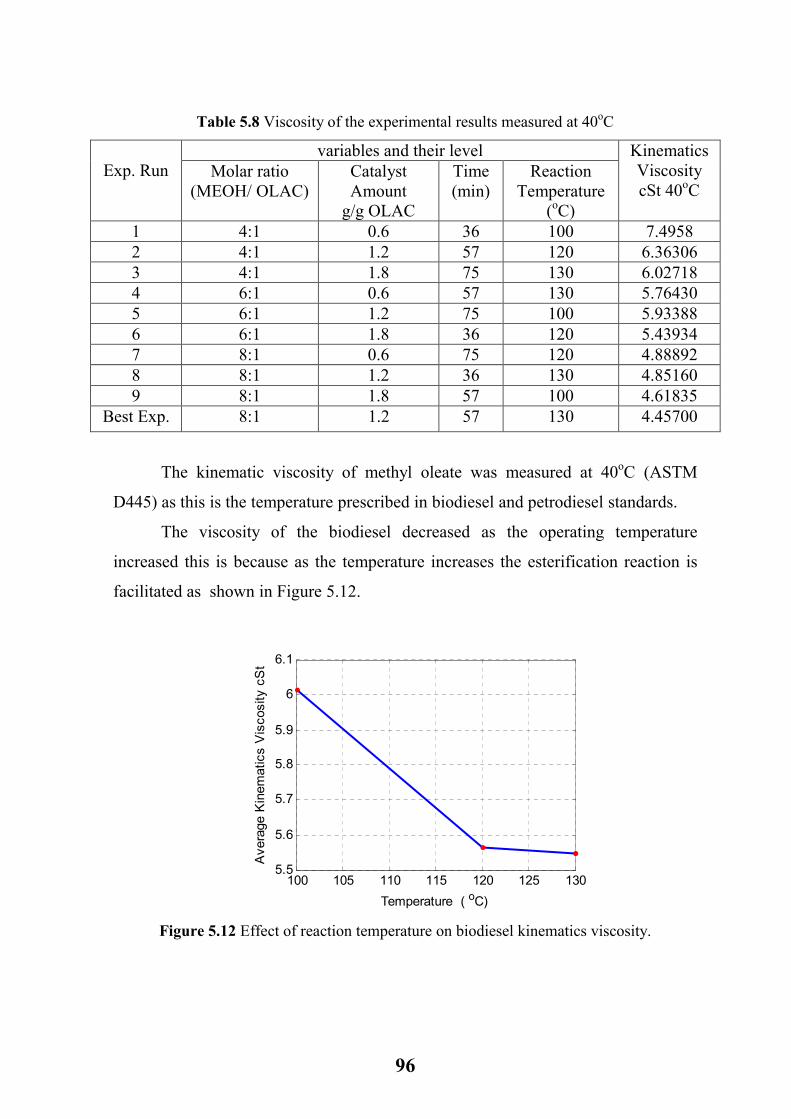
96
Table 5.8 Viscosity of the experimental results measured at 40oC
Kinematics Viscosity cSt 40oC
variables and their level Exp. Run Reaction
Temperature (oC)
Time (min)
Catalyst Amount g/g OLAC
Molar ratio (MEOH/ OLAC)
7.4958 100 36 0.6 4:1 1 6.36306 120 57 1.2 4:1 2 6.02718 130 75 1.8 4:1 3 5.76430 130 57 0.6 6:1 4 5.93388 100 75 1.2 6:1 5 5.43934 120 36 1.8 6:1 6 4.88892 120 75 0.6 8:1 7 4.85160 130 36 1.2 8:1 8 4.61835 100 57 1.8 8:1 9 4.45700 130 57 1.2 8:1 Best Exp.
The kinematic viscosity of methyl oleate was measured at 40oC (ASTM
D445) as this is the temperature prescribed in biodiesel and petrodiesel standards.
The viscosity of the biodiesel decreased as the operating temperature
increased this is because as the temperature increases the esterification reaction is
facilitated as shown in Figure 5.12.
100 105 110 115 120 125 1305.5
5.6
5.7
5.8
5.9
6
6.1
Temperature ( oC)
Average Kinem
atics Viscosity cSt
Figure 5.12 Effect of reaction temperature on biodiesel kinematics viscosity.

97
The viscosity decreases with an increase in feed molar ratio of methanol to
oleic acid for experiment conducted at a given temperature, this is due to the
increase in the conversion of oleic acid. The conversion of oleic acid increases with
increasing in excess methanol as shown in Figure 5.13.
4 5 6 7 84.5
5
5.5
6
6.5
7
Molar Ratio (MEOH/OLAC)
Average Kinem
atics Viscosity cSt
Figure 5.13 Effect of Molar ratio on biodiesel kinematics viscosity.
As the amount of catalyst increases the viscosity decreases, this is due to an
increase in the conversion of oleic acid as shown in Figure 5.14.
0 0.5 1 1.5 25.2
5.4
5.6
5.8
6
6.2
Catalyst Amount (g sulfuric acid / g oleic acid)
Average Kinem
atics Viscosity cSt
Figure 5.14 Effect of catalyst amount on biodiesel kinematics viscosity.
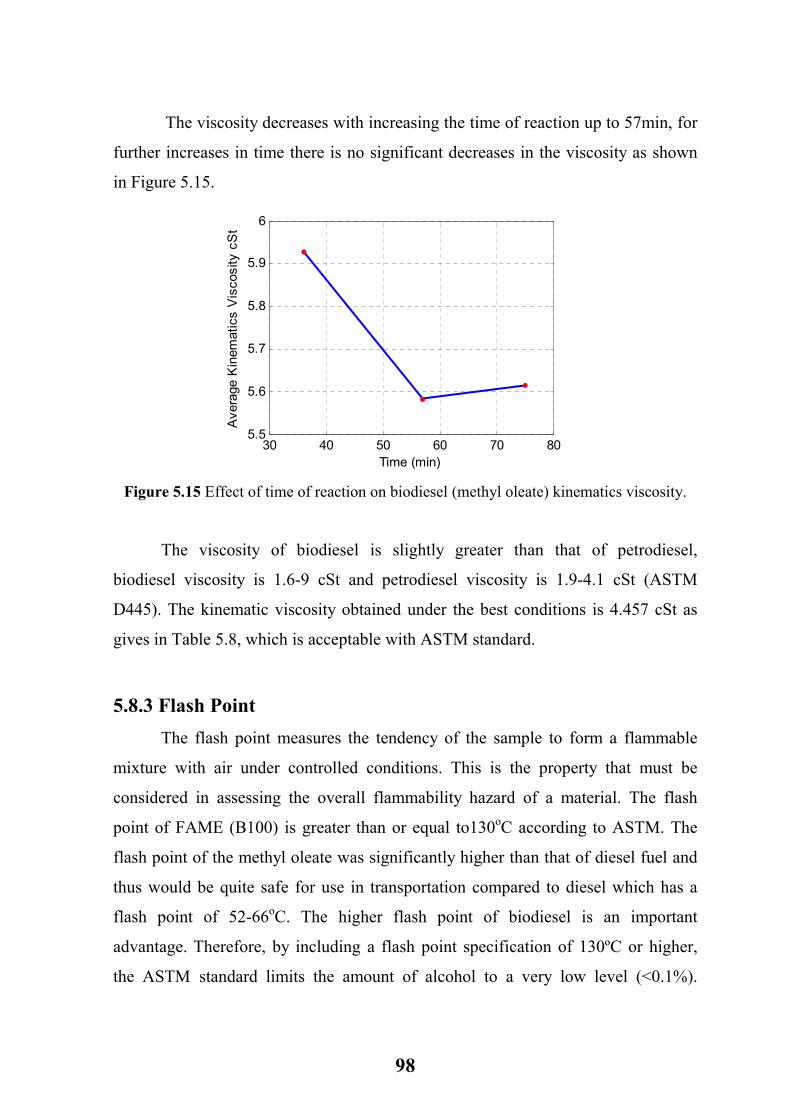
98
The viscosity decreases with increasing the time of reaction up to 57min, for
further increases in time there is no significant decreases in the viscosity as shown
in Figure 5.15.
30 40 50 60 70 805.5
5.6
5.7
5.8
5.9
6
Time (min)
Average Kinem
atics Viscosity cSt
Figure 5.15 Effect of time of reaction on biodiesel (methyl oleate) kinematics viscosity.
The viscosity of biodiesel is slightly greater than that of petrodiesel,
biodiesel viscosity is 1.6-9 cSt and petrodiesel viscosity is 1.9-4.1 cSt (ASTM
D445). The kinematic viscosity obtained under the best conditions is 4.457 cSt as
gives in Table 5.8, which is acceptable with ASTM standard.
5.8.3 Flash Point
The flash point measures the tendency of the sample to form a flammable
mixture with air under controlled conditions. This is the property that must be
considered in assessing the overall flammability hazard of a material. The flash
point of FAME (B100) is greater than or equal to130oC according to ASTM. The
flash point of the methyl oleate was significantly higher than that of diesel fuel and
thus would be quite safe for use in transportation compared to diesel which has a
flash point of 52-66oC. The higher flash point of biodiesel is an important
advantage. Therefore, by including a flash point specification of 130ºC or higher,
the ASTM standard limits the amount of alcohol to a very low level (<0.1%).

99
Residual alcohol left in biodiesel will generally be too small to have a negative
effect on fuel performance (Boog et. al., 2011). So in the present work the amount
of methanol in ester phase (organic phase) was neglected, this is because of the
higher flash point of sample, as shown in Table 5.9.
Table 5.9 Flash points of the biodiesel from some experiments in this study
Exp. Runs Molar ratio (MEOH/OLAC)
Catalyst Amount g/g OLAC
Reaction Temperature (oC)
Flash point (oC) Open
Flash point (oC) Close
1 4:1 0.6 100 175 - 2 4:1 1.2 120 - 160 3 4:1 1.8 130 - 162 4 6:1 0.6 130 179 - 5 6:1 1.2 100 177 - 6 6:1 1.8 120 180 - 7 8:1 0.6 120 179 - 8 8:1 1.2 130 190 - 9 8:1 1.8 100 - 161
Best Exp. 8:1 1.2 130 - 165
5.8.4 Carbon Residue
The carbon residue of the biodiesel obtained from the present work is
0.0392wt%, which is satisfied with the standard biodiesel (the maximum allowable
of carbon residue for a biodiesel is 0.05 wt %).

100
5.9 Results of FTIR
The functional group composition of methyl oleate (Biodiesel) obtained from
the experimental work of the present work was confirmed by FT-IR as shown in
Figure 5.16. Sharp band at 2924.09cm-1 is due to C H stretching vibration of
methylene groups. A sharp band 1743.65cm-1 is attributed to C O stretching
frequency. Absorption at 1435.04cm-1 and 1458.18cm-1 is assigned to asymmetric
CH3 or CH2 bending vibrations. Bands at 1242.16cm-1, 1195.87cm-1 and 1172.72
cm-1 are due to C O stretching of ester. The bands obtained at 1118.71cm-1,
1018.41cm-1 and 875.68cm-1 are due to C C stretching.
Figure 5.16 FT-IR spectrum of produced methyl oleate (Biodiesel).
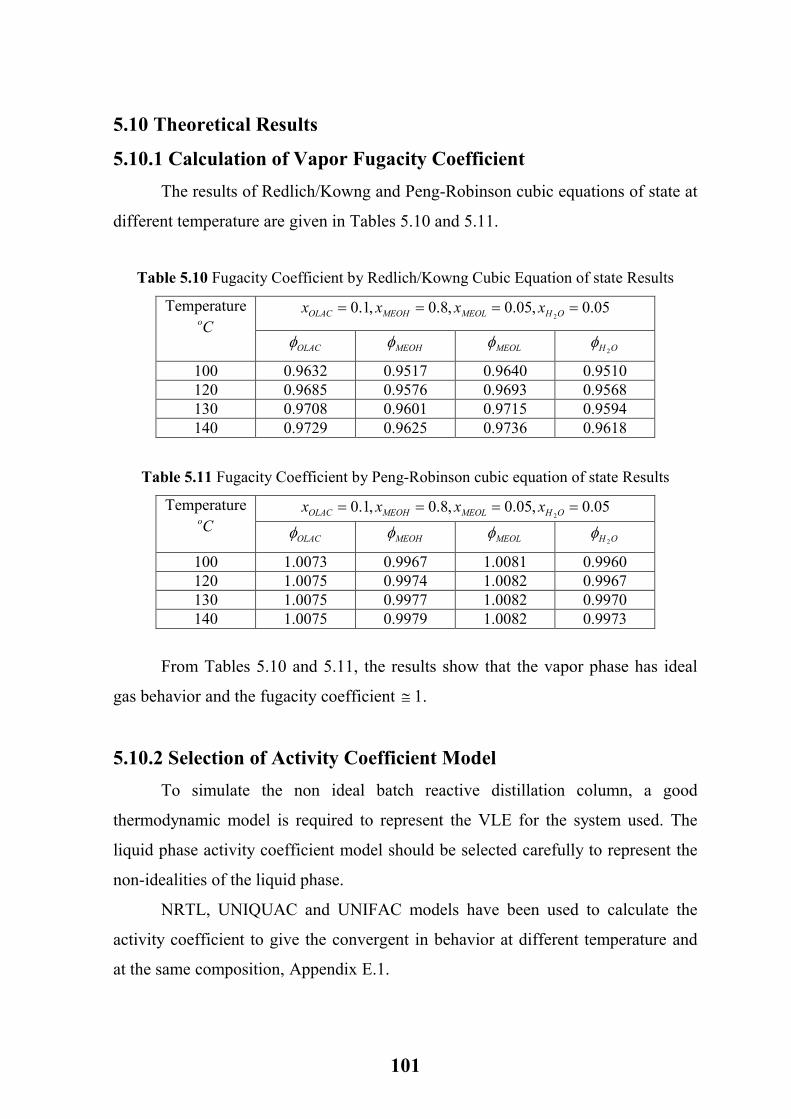
101
5.10 Theoretical Results
5.10.1 Calculation of Vapor Fugacity Coefficient
The results of Redlich/Kowng and Peng-Robinson cubic equations of state at
different temperature are given in Tables 5.10 and 5.11.
Table 5.10 Fugacity Coefficient by Redlich/Kowng Cubic Equation of state Results
Temperature Co
05.0,05.0,8.0,1.02==== OHMEOLMEOHOLAC xxxx
OLACφ MEOHφ MEOLφ OH 2φ
100 0.9632 0.9517 0.9640 0.9510 120 0.9685 0.9576 0.9693 0.9568 130 0.9708 0.9601 0.9715 0.9594 140 0.9729 0.9625 0.9736 0.9618
Table 5.11 Fugacity Coefficient by Peng-Robinson cubic equation of state Results
Temperature Co
05.0,05.0,8.0,1.02==== OHMEOLMEOHOLAC xxxx
OLACφ MEOHφ MEOLφ OH 2φ
100 1.0073 0.9967 1.0081 0.9960 120 1.0075 0.9974 1.0082 0.9967 130 1.0075 0.9977 1.0082 0.9970 140 1.0075 0.9979 1.0082 0.9973
From Tables 5.10 and 5.11, the results show that the vapor phase has ideal
gas behavior and the fugacity coefficient ≅ 1.
5.10.2 Selection of Activity Coefficient Model
To simulate the non ideal batch reactive distillation column, a good
thermodynamic model is required to represent the VLE for the system used. The
liquid phase activity coefficient model should be selected carefully to represent the
non-idealities of the liquid phase.
NRTL, UNIQUAC and UNIFAC models have been used to calculate the
activity coefficient to give the convergent in behavior at different temperature and
at the same composition, Appendix E.1.
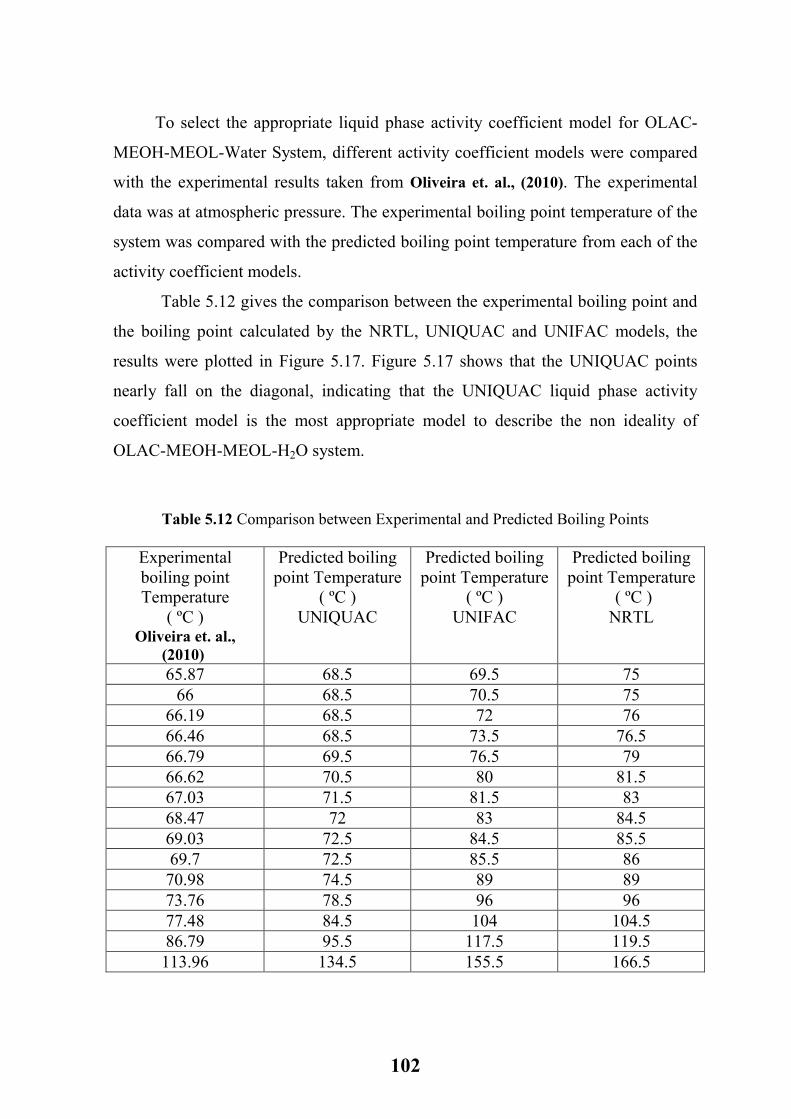
102
To select the appropriate liquid phase activity coefficient model for OLAC-
MEOH-MEOL-Water System, different activity coefficient models were compared
with the experimental results taken from Oliveira et. al., (2010). The experimental
data was at atmospheric pressure. The experimental boiling point temperature of the
system was compared with the predicted boiling point temperature from each of the
activity coefficient models.
Table 5.12 gives the comparison between the experimental boiling point and
the boiling point calculated by the NRTL, UNIQUAC and UNIFAC models, the
results were plotted in Figure 5.17. Figure 5.17 shows that the UNIQUAC points
nearly fall on the diagonal, indicating that the UNIQUAC liquid phase activity
coefficient model is the most appropriate model to describe the non ideality of
OLAC-MEOH-MEOL-H2O system.
Table 5.12 Comparison between Experimental and Predicted Boiling Points
Experimental boiling point Temperature
( ºC ) Oliveira et. al.,
(2010)
Predicted boiling point Temperature
( ºC ) UNIQUAC
Predicted boiling point Temperature
( ºC ) UNIFAC
Predicted boiling point Temperature
( ºC ) NRTL
65.87 68.5 69.5 75 66 68.5 70.5 75
66.19 68.5 72 76 66.46 68.5 73.5 76.5 66.79 69.5 76.5 79 66.62 70.5 80 81.5 67.03 71.5 81.5 83 68.47 72 83 84.5 69.03 72.5 84.5 85.5 69.7 72.5 85.5 86 70.98 74.5 89 89 73.76 78.5 96 96 77.48 84.5 104 104.5 86.79 95.5 117.5 119.5 113.96 134.5 155.5 166.5
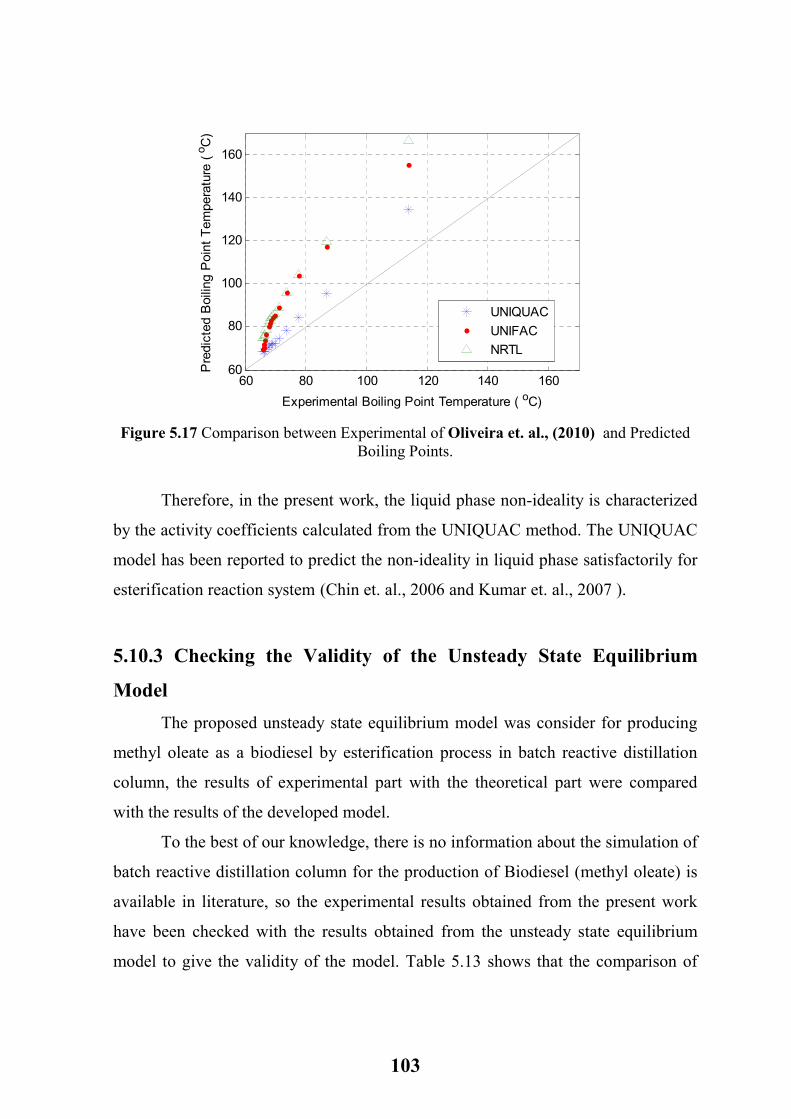
103
60 80 100 120 140 16060
80
100
120
140
160
Experimental Boiling Point Temperature ( oC)
Predicted Boiling Point Tem
perature ( oC)
UNIQUACUNIFACNRTL
Figure 5.17 Comparison between Experimental of Oliveira et. al., (2010) and Predicted
Boiling Points.
Therefore, in the present work, the liquid phase non-ideality is characterized
by the activity coefficients calculated from the UNIQUAC method. The UNIQUAC
model has been reported to predict the non-ideality in liquid phase satisfactorily for
esterification reaction system (Chin et. al., 2006 and Kumar et. al., 2007 ).
5.10.3 Checking the Validity of the Unsteady State Equilibrium
Model
The proposed unsteady state equilibrium model was consider for producing
methyl oleate as a biodiesel by esterification process in batch reactive distillation
column, the results of experimental part with the theoretical part were compared
with the results of the developed model.
To the best of our knowledge, there is no information about the simulation of
batch reactive distillation column for the production of Biodiesel (methyl oleate) is
available in literature, so the experimental results obtained from the present work
have been checked with the results obtained from the unsteady state equilibrium
model to give the validity of the model. Table 5.13 shows that the comparison of

104
the mole fractions of oleic acid and methyl oleate (biodiesel) of experimental and
unsteady state equilibrium model results.
Table 5.13 The comparison of experimental and equilibrium model results
Exp. No. Experimental results Equilibrium model xOLAC xMEOL xOLAC xMEOL
1 0.264581 0.735419 0.3879 0.6902 2 0.205630 0.794370 0.1447 0.8552 3 0.196430 0.803570 0.1623 0.8377 4 0.155199 0.844801 0.1494 0.8506 5 0.167119 0.832881 0.2589 0.7408 6 0.164824 0.835176 0.1713 0.8285 7 0.119887 0.880113 0.0372 0.9628 8 0.072096 0.927904 0.04 0.96 9 0.090707 0.909293 0.1122 0. 8878
Best Exp. 0.061446 0.938554 0.0402 0.9598
The comparison results give the ability of the model to predict the results of
experiment performed with the same parameters of experimental work. Figure 5.18
shows the points are nearly fall on the diagonal indicating that the developed model
is in good agreement with the experimental work.
0 0.2 0.4 0.6 0.8 10
0.2
0.4
0.6
0.8
1
x Equilibrium Model
x Experiment
OLACMEOL
Figure 5.18 Plot for the EQ model validation.
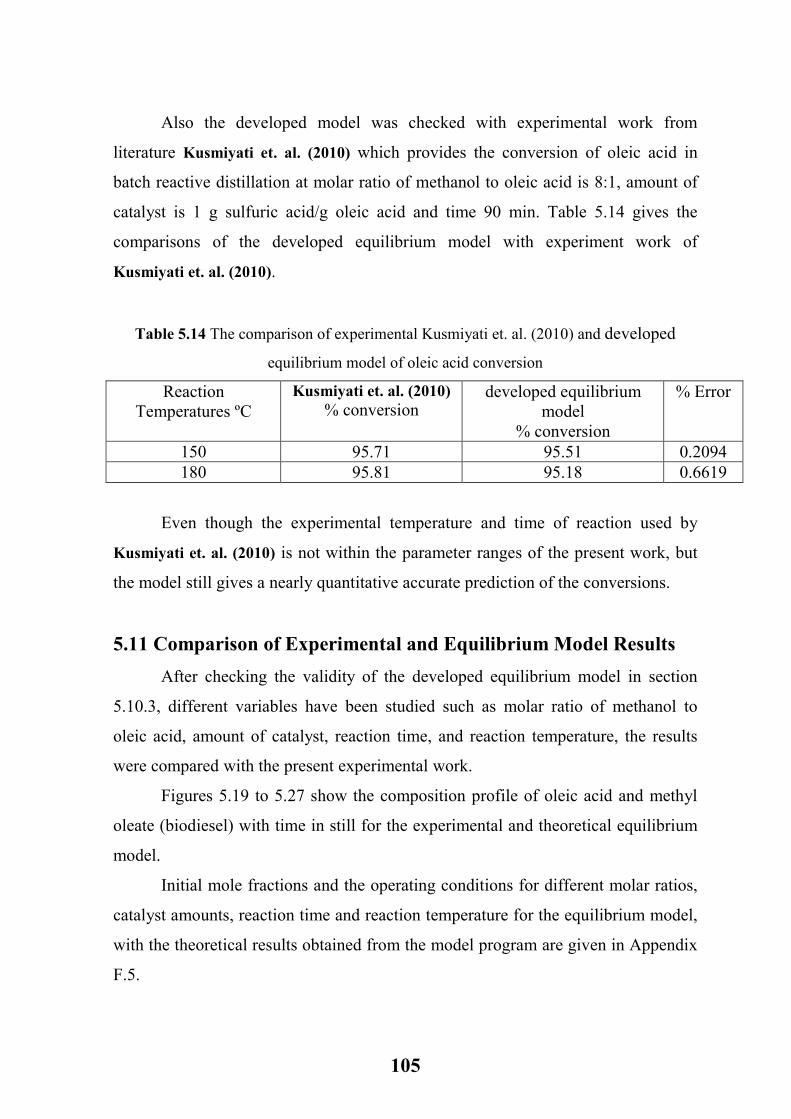
105
Also the developed model was checked with experimental work from
literature Kusmiyati et. al. (2010) which provides the conversion of oleic acid in
batch reactive distillation at molar ratio of methanol to oleic acid is 8:1, amount of
catalyst is 1 g sulfuric acid/g oleic acid and time 90 min. Table 5.14 gives the
comparisons of the developed equilibrium model with experiment work of
Kusmiyati et. al. (2010).
Table 5.14 The comparison of experimental Kusmiyati et. al. (2010) and developed
equilibrium model of oleic acid conversion
Reaction Temperatures ºC
Kusmiyati et. al. (2010) % conversion
developed equilibrium model
% conversion
% Error
150 95.71 95.51 0.2094 180 95.81 95.18 0.6619
Even though the experimental temperature and time of reaction used by
Kusmiyati et. al. (2010) is not within the parameter ranges of the present work, but
the model still gives a nearly quantitative accurate prediction of the conversions.
5.11 Comparison of Experimental and Equilibrium Model Results
After checking the validity of the developed equilibrium model in section
5.10.3, different variables have been studied such as molar ratio of methanol to
oleic acid, amount of catalyst, reaction time, and reaction temperature, the results
were compared with the present experimental work.
Figures 5.19 to 5.27 show the composition profile of oleic acid and methyl
oleate (biodiesel) with time in still for the experimental and theoretical equilibrium
model.
Initial mole fractions and the operating conditions for different molar ratios,
catalyst amounts, reaction time and reaction temperature for the equilibrium model,
with the theoretical results obtained from the model program are given in Appendix
F.5.

106
0 5 10 15 20 25 30 35 400
0.2
0.4
0.6
0.8
Time ( min)
Mole fraction - Still
OLAC EQ MEOL EQ OLAC Experimental MEOL Experimental
Figure 5.19 Experimental and theoretical equilibrium model results for composition
Profile in the still, molar ratio 4:1, catalyst amount 0.6, 36 min, 100oC.
0 10 20 30 40 50 600
0.2
0.4
0.6
0.8
1
Time ( min)
Mole fraction - Still
OLAC EQ MEOL EQ OLAC Experimental MEOL Experimental
Figure 5.20 Experimental and theoretical equilibrium model results for composition Profile in the still, molar ratio 4:1, catalyst amount 1.2, 57 min, 120oC.

107
0 10 20 30 40 50 60 70 800
0.2
0.4
0.6
0.8
1
Time ( min)
Mole fraction - Still
OLAC EQ MEOL EQ OLAC Experimental MEOL Experimental
Figure 5.21 Experimental and theoretical equilibrium model results for composition
Profile in the still, molar ratio 4:1, catalyst amount 1.8, 75 min, 130oC.
0 10 20 30 40 50 600
0.2
0.4
0.6
0.8
1
Time ( min)
Mole fraction - Still
OLAC EQ MEOL EQ OLAC Experimental MEOL Experimental
Figure 5.22 Experimental and theoretical equilibrium model results for composition Profile in the still, molar ratio 6:1, catalyst amount 0.6, 57 min, 130oC.
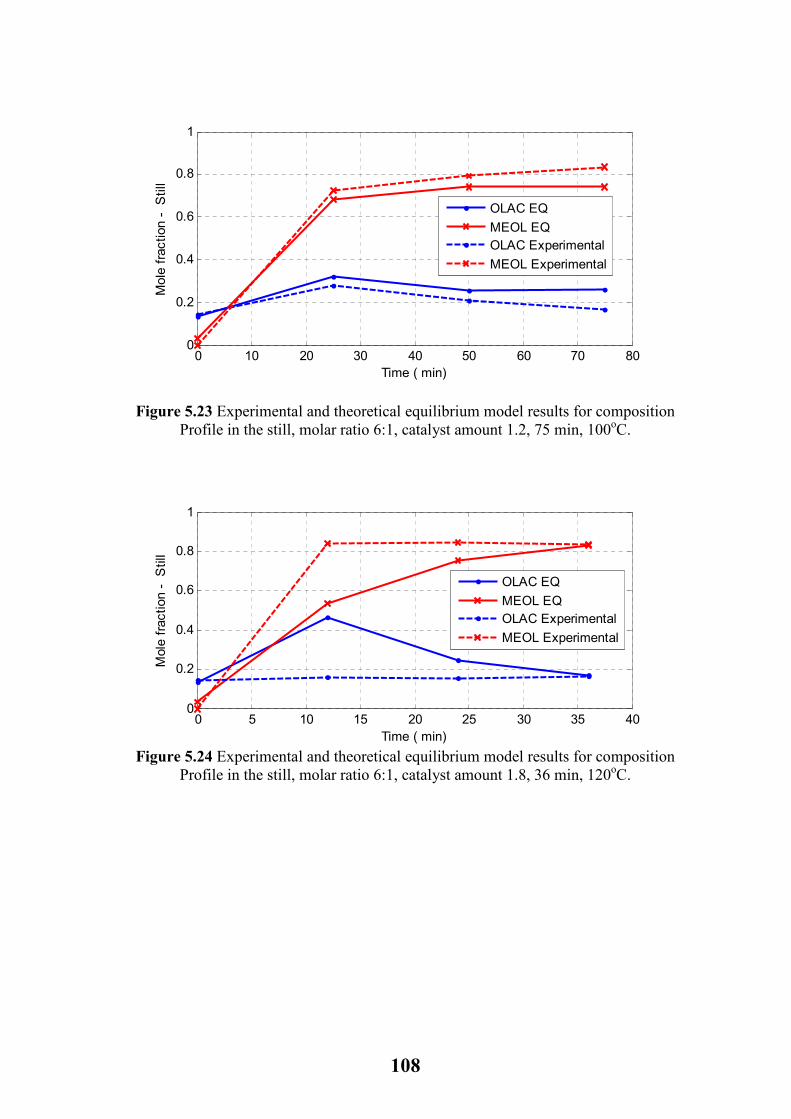
108
0 10 20 30 40 50 60 70 800
0.2
0.4
0.6
0.8
1
Time ( min)
Mole fraction - Still
OLAC EQMEOL EQOLAC ExperimentalMEOL Experimental
Figure 5.23 Experimental and theoretical equilibrium model results for composition Profile in the still, molar ratio 6:1, catalyst amount 1.2, 75 min, 100oC.
0 5 10 15 20 25 30 35 400
0.2
0.4
0.6
0.8
1
Time ( min)
Mole fraction - Still
OLAC EQMEOL EQOLAC ExperimentalMEOL Experimental
Figure 5.24 Experimental and theoretical equilibrium model results for composition
Profile in the still, molar ratio 6:1, catalyst amount 1.8, 36 min, 120oC.
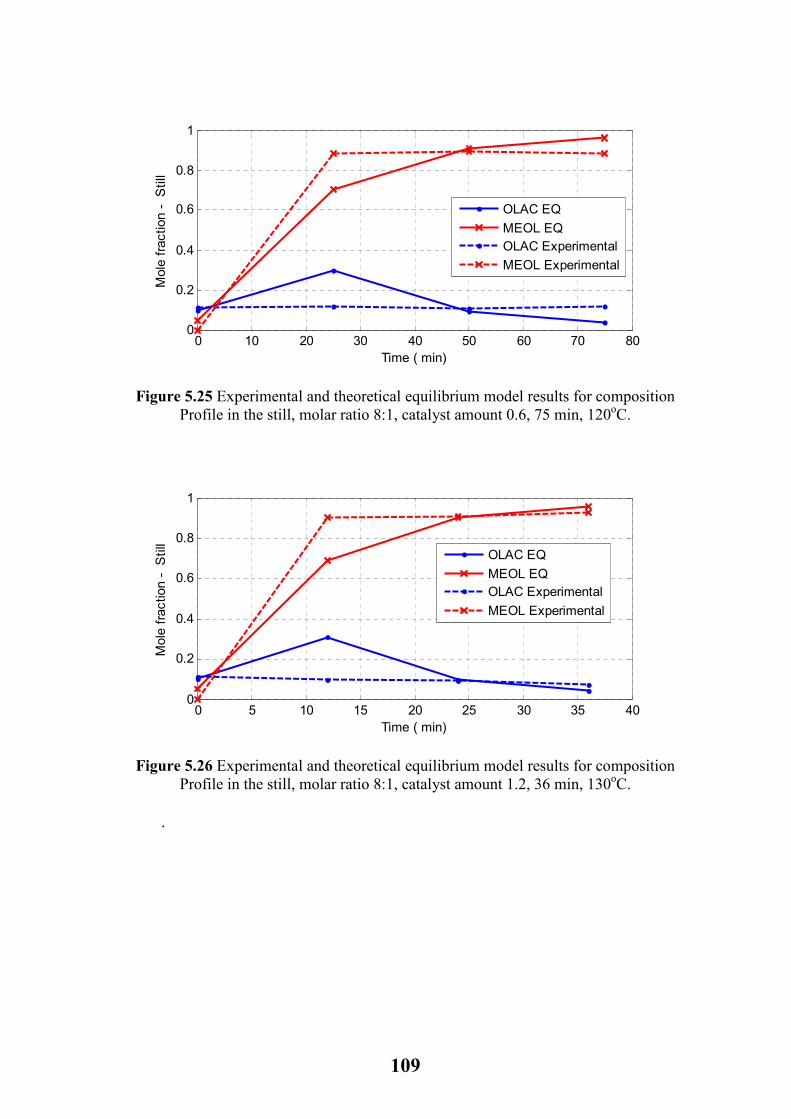
109
0 10 20 30 40 50 60 70 800
0.2
0.4
0.6
0.8
1
Time ( min)
Mole fraction - Still
OLAC EQMEOL EQOLAC ExperimentalMEOL Experimental
Figure 5.25 Experimental and theoretical equilibrium model results for composition Profile in the still, molar ratio 8:1, catalyst amount 0.6, 75 min, 120oC.
0 5 10 15 20 25 30 35 400
0.2
0.4
0.6
0.8
1
Time ( min)
Mole fraction - Still
OLAC EQMEOL EQOLAC ExperimentalMEOL Experimental
Figure 5.26 Experimental and theoretical equilibrium model results for composition Profile in the still, molar ratio 8:1, catalyst amount 1.2, 36 min, 130oC.
.
110
0 10 20 30 40 50 600
0.2
0.4
0.6
0.8
1
Time ( min)
Mole fraction - Still
OLAC EQMEOL EQOLAC ExperimentalMEOL Experimental
Figure 5.27 Experimental and theoretical equilibrium model results for composition
Profile in the still, molar ratio 8:1, catalyst amount 1.8, 57 min, 100oC.
Figure 5.28 shows the results of liquid composition profile with time in the
still for experimental and theoretical equilibrium model for best experiment.
0 10 20 30 40 50 600
0.2
0.4
0.6
0.8
1
Time ( min)
Mole fraction - Still
OLAC EQMEOL EQOLAC ExperimentalMEOL Experimental
Figure 5.28 Experimental and theoretical equilibrium model results for composition Profile in the still, molar ratio 8:1, catalyst amount 1.2, 57 min, 130oC.
These figures show that, at a first step time the composition of oleic acid
increases due to the removal of methanol is removed by distillation, hence the oleic
acid mole fraction increases (excess methanol), and the reaction temperature is
higher than the boiling point of methanol.

111
Figures 5.29 to 5.38 shows the % conversion of oleic acid with time for
experimental and theoretical equilibrium model. The comparison of % conversion
of oleic acid between experimental and theoretical equilibrium model are given in
Appendix F.6.
0 5 10 15 20 25 30 35 400
20
40
60
80
Time ( min)
% Conversion
equilibrium modelexperimental
Figure 5.29 % Conversion profile for experimental and theoretical equilibrium model Experiment 1.
0 10 20 30 40 50 600
20
40
60
80
100
Time ( min)
% Conversion
equilibrium modelexperimental
Figure 5.30 % Conversion profile for experimental and theoretical equilibrium model Experiment 2.
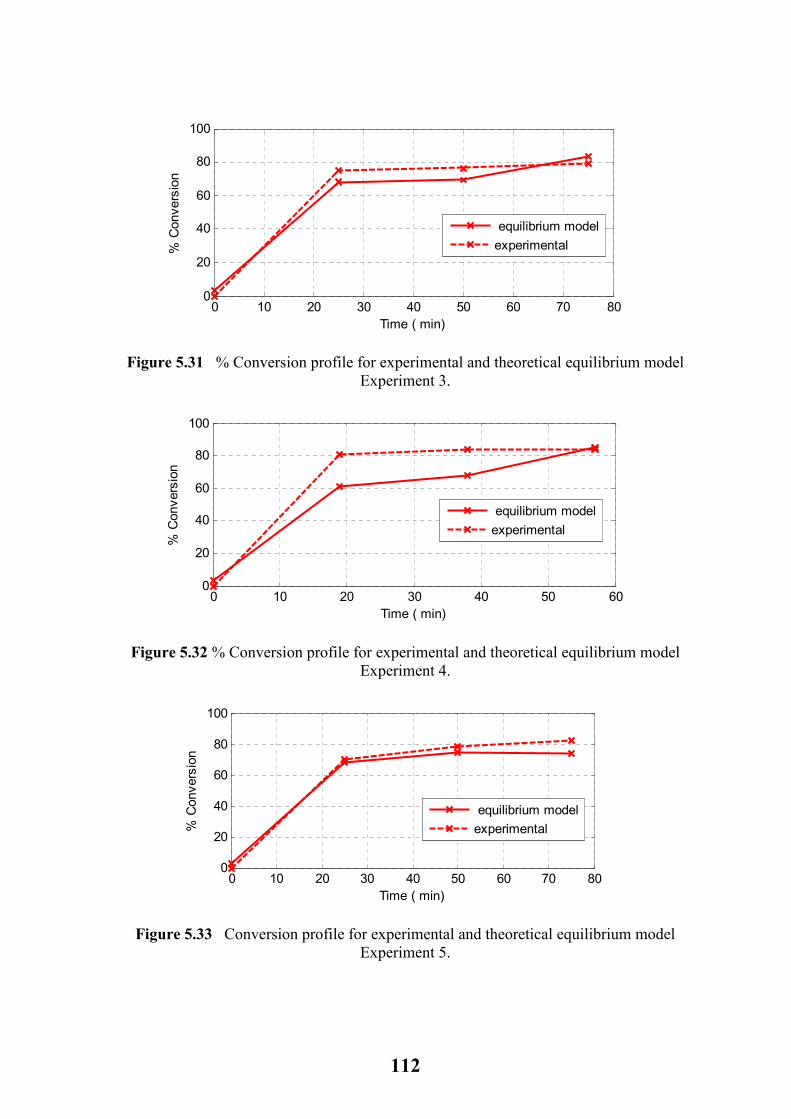
112
0 10 20 30 40 50 60 70 800
20
40
60
80
100
Time ( min)
% Conversion
equilibrium modelexperimental
Figure 5.31 % Conversion profile for experimental and theoretical equilibrium model Experiment 3.
0 10 20 30 40 50 600
20
40
60
80
100
Time ( min)
% Conversion
equilibrium modelexperimental
Figure 5.32 % Conversion profile for experimental and theoretical equilibrium model Experiment 4.
0 10 20 30 40 50 60 70 800
20
40
60
80
100
Time ( min)
% Conversion
equilibrium modelexperimental
Figure 5.33 Conversion profile for experimental and theoretical equilibrium model Experiment 5.
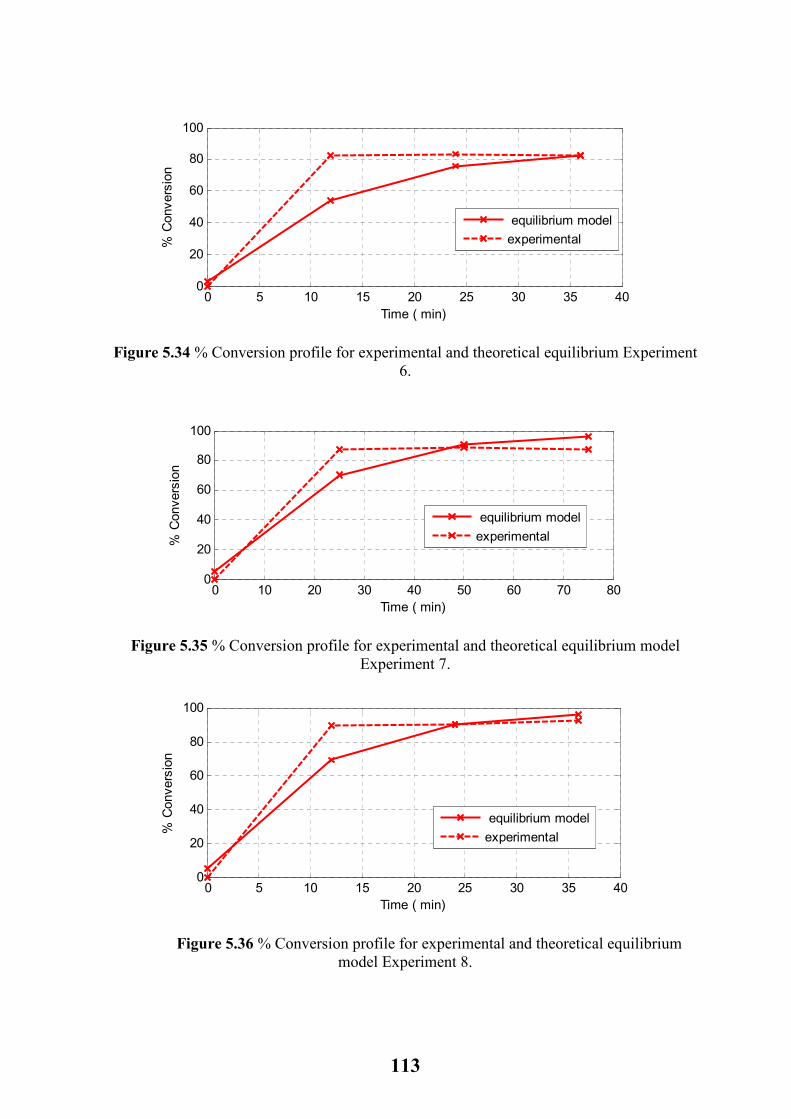
113
0 5 10 15 20 25 30 35 400
20
40
60
80
100
Time ( min)
% Conversion
equilibrium modelexperimental
Figure 5.34 % Conversion profile for experimental and theoretical equilibrium Experiment 6.
0 10 20 30 40 50 60 70 800
20
40
60
80
100
Time ( min)
% Conversion
equilibrium modelexperimental
Figure 5.35 % Conversion profile for experimental and theoretical equilibrium model Experiment 7.
0 5 10 15 20 25 30 35 400
20
40
60
80
100
Time ( min)
% Conversion
equilibrium modelexperimental
Figure 5.36 % Conversion profile for experimental and theoretical equilibrium model Experiment 8.
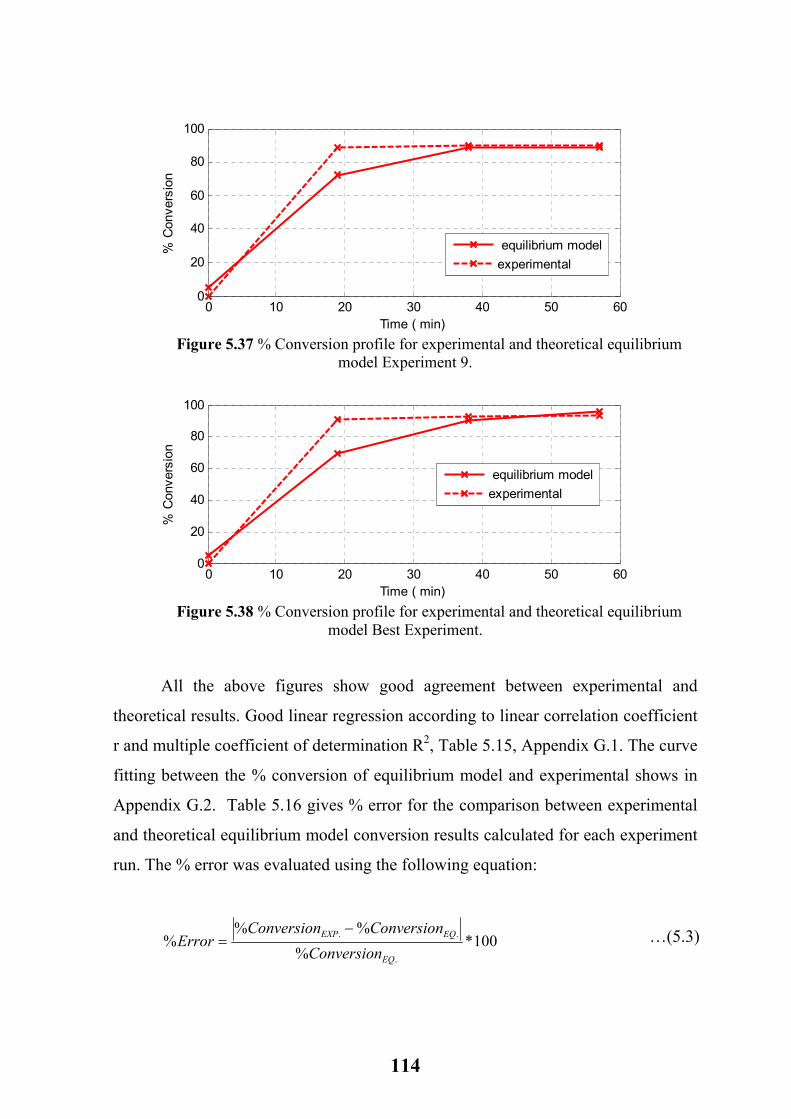
114
0 10 20 30 40 50 600
20
40
60
80
100
Time ( min)
% Conversion
equilibrium modelexperimental
Figure 5.37 % Conversion profile for experimental and theoretical equilibrium
model Experiment 9.
0 10 20 30 40 50 600
20
40
60
80
100
Time ( min)
% Conversion
equilibrium modelexperimental
Figure 5.38 % Conversion profile for experimental and theoretical equilibrium
model Best Experiment.
All the above figures show good agreement between experimental and
theoretical results. Good linear regression according to linear correlation coefficient
r and multiple coefficient of determination R2, Table 5.15, Appendix G.1. The curve
fitting between the % conversion of equilibrium model and experimental shows in
Appendix G.2. Table 5.16 gives % error for the comparison between experimental
and theoretical equilibrium model conversion results calculated for each experiment
run. The % error was evaluated using the following equation:
100*%
%%%
.
..
EQ
EQEXP
Conversion
ConversionConversionError
−=
…(5.3)
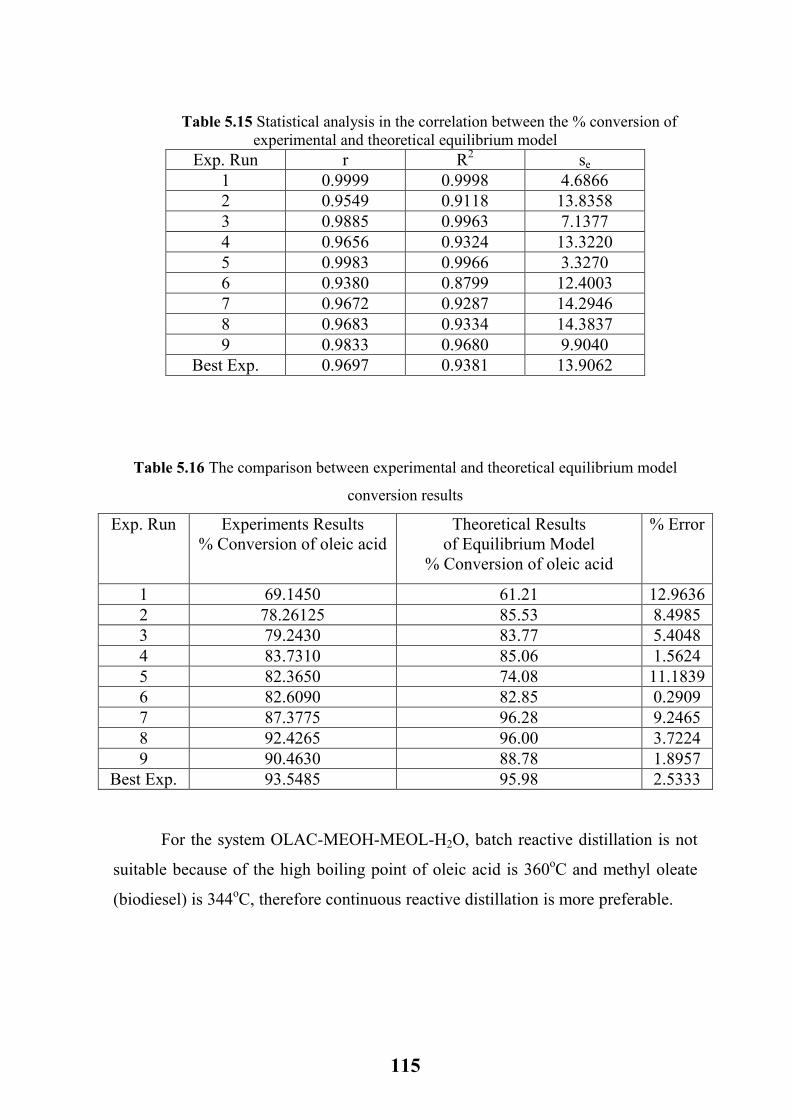
115
Table 5.15 Statistical analysis in the correlation between the % conversion of experimental and theoretical equilibrium model
Exp. Run r R2 se 1 0.9999 0.9998 4.6866 2 0.9549 0.9118 13.8358 3 0.9885 0.9963 7.1377 4 0.9656 0.9324 13.3220 5 0.9983 0.9966 3.3270 6 0.9380 0.8799 12.4003 7 0.9672 0.9287 14.2946 8 0.9683 0.9334 14.3837 9 0.9833 0.9680 9.9040
Best Exp. 0.9697 0.9381 13.9062
Table 5.16 The comparison between experimental and theoretical equilibrium model
conversion results
Exp. Run Experiments Results % Conversion of oleic acid
Theoretical Results of Equilibrium Model
% Conversion of oleic acid
% Error
1 69.1450 61.21 12.9636 2 78.26125 85.53 8.4985 3 79.2430 83.77 5.4048 4 83.7310 85.06 1.5624 5 82.3650 74.08 11.1839 6 82.6090 82.85 0.2909 7 87.3775 96.28 9.2465 8 92.4265 96.00 3.7224 9 90.4630 88.78 1.8957
Best Exp. 93.5485 95.98 2.5333
For the system OLAC-MEOH-MEOL-H2O, batch reactive distillation is not
suitable because of the high boiling point of oleic acid is 360oC and methyl oleate
(biodiesel) is 344oC, therefore continuous reactive distillation is more preferable.
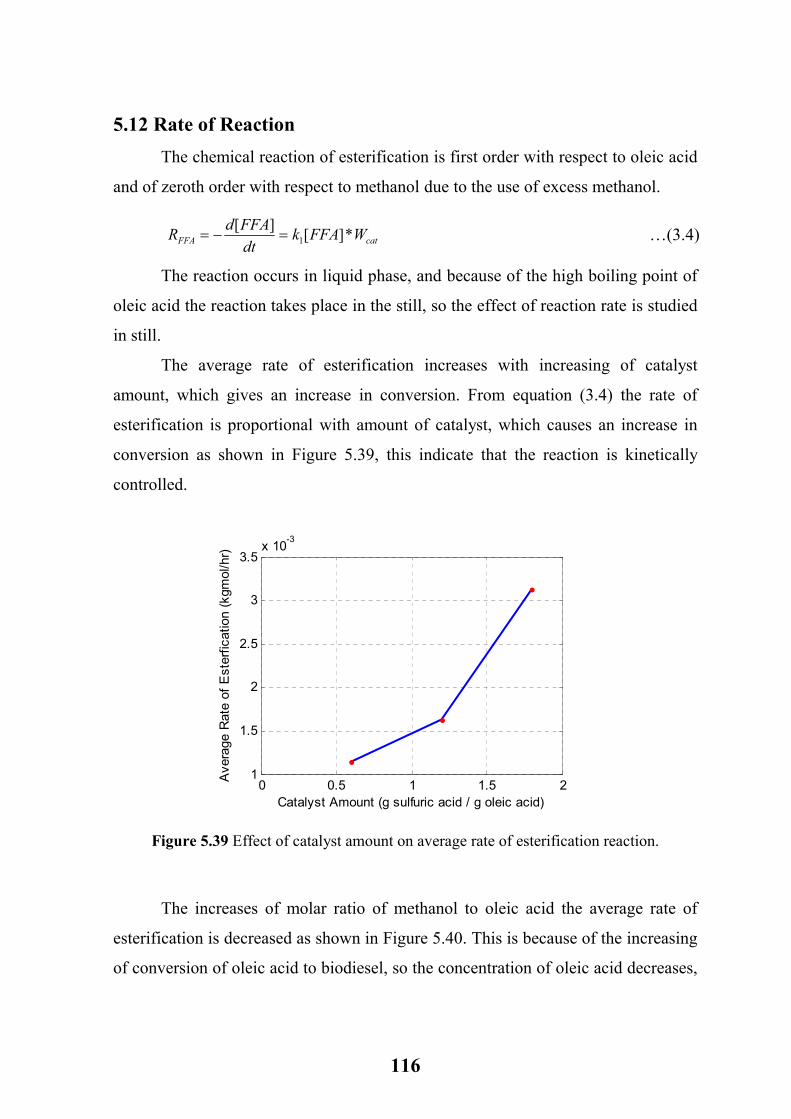
116
5.12 Rate of Reaction
The chemical reaction of esterification is first order with respect to oleic acid
and of zeroth order with respect to methanol due to the use of excess methanol.
catFFA WFFAkdtFFAd
R *][][
1=−=
The reaction occurs in liquid phase, and because of the high boiling point of
oleic acid the reaction takes place in the still, so the effect of reaction rate is studied
in still.
The average rate of esterification increases with increasing of catalyst
amount, which gives an increase in conversion. From equation (3.4) the rate of
esterification is proportional with amount of catalyst, which causes an increase in
conversion as shown in Figure 5.39, this indicate that the reaction is kinetically
controlled.
0 0.5 1 1.5 21
1.5
2
2.5
3
3.5x 10
-3
Catalyst Amount (g sulfuric acid / g oleic acid)
Average Rate of Esterfication (kgm
ol/hr)
Figure 5.39 Effect of catalyst amount on average rate of esterification reaction.
The increases of molar ratio of methanol to oleic acid the average rate of
esterification is decreased as shown in Figure 5.40. This is because of the increasing
of conversion of oleic acid to biodiesel, so the concentration of oleic acid decreases,
…(3.4)
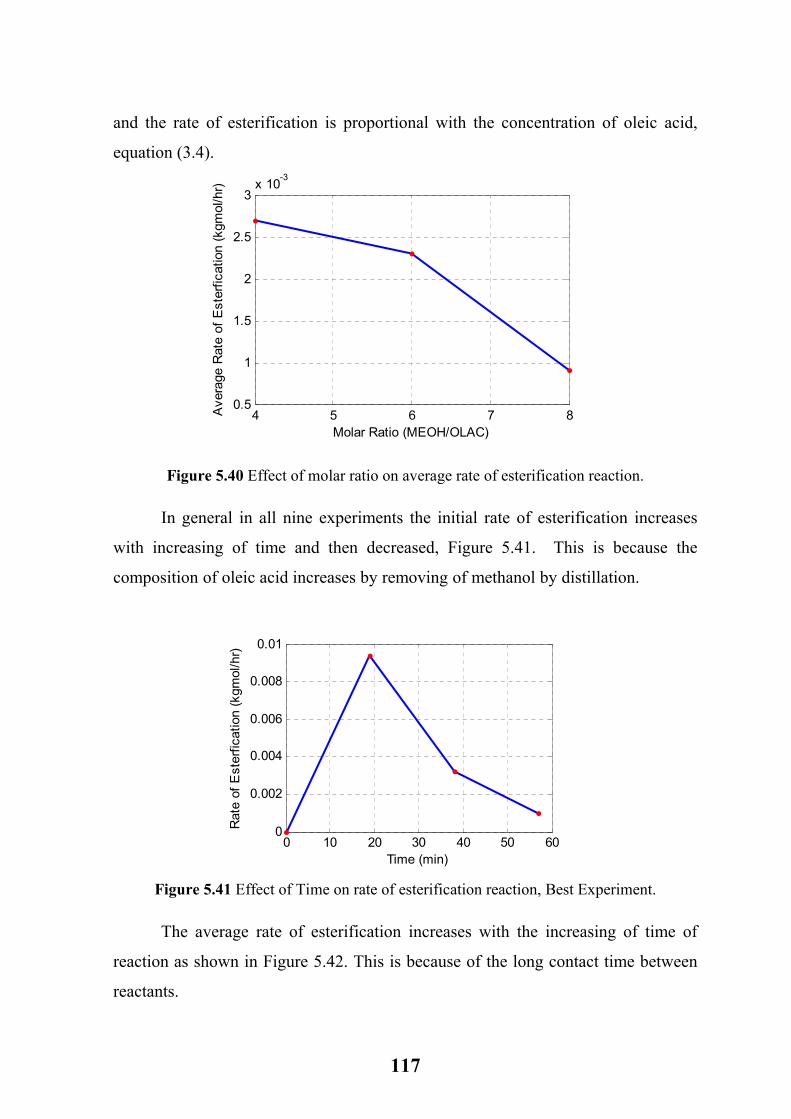
117
and the rate of esterification is proportional with the concentration of oleic acid,
equation (3.4).
4 5 6 7 80.5
1
1.5
2
2.5
3x 10
-3
Molar Ratio (MEOH/OLAC)
Average Rate of Esterfication (kgm
ol/hr)
Figure 5.40 Effect of molar ratio on average rate of esterification reaction.
In general in all nine experiments the initial rate of esterification increases
with increasing of time and then decreased, Figure 5.41. This is because the
composition of oleic acid increases by removing of methanol by distillation.
0 10 20 30 40 50 600
0.002
0.004
0.006
0.008
0.01
Time (min)
Rate of Esterfication (kgm
ol/hr)
Figure 5.41 Effect of Time on rate of esterification reaction, Best Experiment.
The average rate of esterification increases with the increasing of time of
reaction as shown in Figure 5.42. This is because of the long contact time between
reactants.
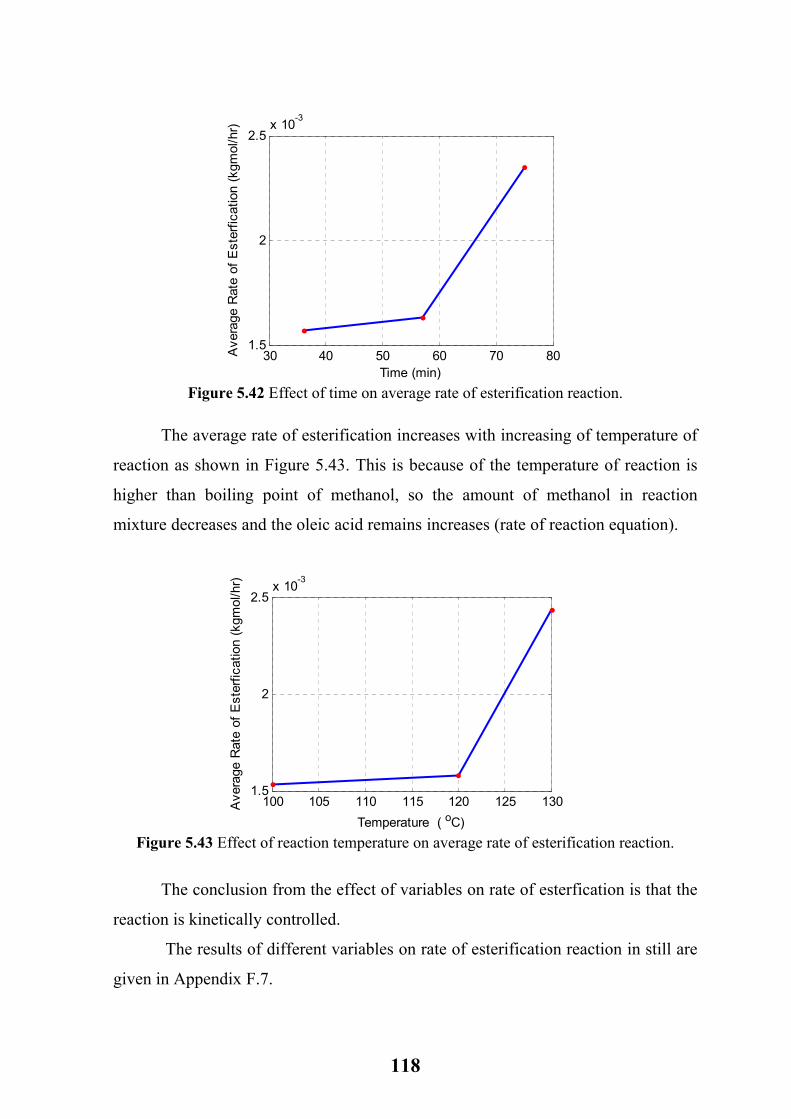
118
30 40 50 60 70 801.5
2
2.5x 10
-3
Time (min)
Average Rate of Esterfication (kgm
ol/hr)
Figure 5.42 Effect of time on average rate of esterification reaction.
The average rate of esterification increases with increasing of temperature of
reaction as shown in Figure 5.43. This is because of the temperature of reaction is
higher than boiling point of methanol, so the amount of methanol in reaction
mixture decreases and the oleic acid remains increases (rate of reaction equation).
100 105 110 115 120 125 1301.5
2
2.5x 10
-3
Temperature ( oC)
Average Rate of Esterfication (kgm
ol/hr)
Figure 5.43 Effect of reaction temperature on average rate of esterification reaction.
The conclusion from the effect of variables on rate of esterfication is that the
reaction is kinetically controlled.
The results of different variables on rate of esterification reaction in still are
given in Appendix F.7.
Chapter Six
Conclusions and Recommendations
6.1 Conclusions
From the present work can conclude the following:
1- The methanol to oleic acid feed molar ratio increases the average conversion
of oleic acid is 92.43% for 8:1 molar ratio of methanol to oleic acid.
2- When increasing the amount of catalyst to 1.2 g sulfuric acid/g oleic acid,
the average conversion of oleic acid increases, further increase of a catalyst
above 1.2, the average conversion of oleic acid is not significantly affected.
3- The average conversion of oleic acid increases with increasing the time of
reaction from 36 to 57 min then decreases when further increase in time to
75 min.
4- The average conversion of oleic acid increases when the reaction
temperature increase, the reaction shows the typical behavior of reactions
with high activation energy that are favored by higher temperatures
(endothermic reaction), in the present work the reaction temperature was
130oC.
5- According to Taguchi method, the molar ratio methanol to oleic acid was
the most influential parameter on the average conversion of oleic acid and
the time of reaction has a less effect with comparing to other variables. The
best parameters conditions according to Taguchi method from the present
work are methanol to oleic acid feed molar ratio 8:1, catalyst amount 1.2 g
sulfuric acid/g oleic acid, time of reaction 57 min and reaction temperature
130oC, for these best conditions the oleic acid conversion is 93.55%.
6- Biodiesel properties such as viscosity, flash point, density, and carbon
residue obtained from the present work show that the biodiesel formed can
be used as fuel.
119

7- UNIQUAC liquid phase activity coefficient model is the most appropriate
model to describe the non ideality of OLAC-MEOH-MEOL-H2O system.
8- Good linear regression between the experimental and theoretical results
according to linear correlation coefficient r and multiple coefficient of
determination R2, for the best operating conditions are 0.9697 and 0.9381
respectively, with percentage error of 2.5333%.
9- The reaction is kinetically controlled.
10- The continuous reactive distillation is more suitable for the production of
biodiesel than batch reactive distillation.
6.2 Recommendations for the Future Work
The following suggestions for future work can be considered:
1- Studying a continuous reactive distillation unit using packing and tray
column experimentally to produce biodiesel.
2- Reactive distillation catalyzed with heterogeneous solid acid catalyst (metal
oxide) as green catalyst such as niobic acid, sulfated zirconia, sulfated titania
and sulfated oxide.
3- Studying the effect of different alcohols such as (ethanol, isopropanol and n-
butanol) on the esterfication reaction.
4- Studying the use of supercritical conditions, to avoid use of catalyst and the
occurrence of the saponifacation and neutralization when use acid or base
catalyst, this process required high energy so thermally coupled reactive
distillation can be used to reduce the energy from this process.
5- Studying a continuous reactive distillation unit using rate-based model (non
equilibrium model) and comparing with equilibrium model
6- Fuzzy models were developed using adaptive neuro-fuzzy model to simulate
the reactive distillation.
7- Simulation of the esterifacation reaction by Aspen Plus, ChemCad, and CFD
programs.
120

8- Studying a production of biodiesel using other techniques such as
conventional reactors with stirrer, well-stirred slurry reactor (WSSR),
spray tower loop reactor (STLR), microwaves, static mixers, bioreactor,
adsorption tower, extractive distillation, plug flow reactor (PFR) and
nanoreactor.
121
122
References
Abrams, D.S. and Prausnitz, J.M. “Statistical Thermodynamics of Liquid Mixtures:
A New Expression for The Excess Gibbs Energy of Partly or Completely
Miscible Systems”, AIChE J., 21, p.116-128, (1975).
An, K.C.C. “Simulation of Heterogeneously Catalysed Esterification for the
Biodiesel Production using Reactive Distillation Column”, Faculty of
Chemical and Natural Resources Engineering University Malaysia Pahang,
(2009).
Aranda, D.A.G., Santo, R.P.T, Tapanes, N.C.O., Ramos, A.L.D. and Antunes,
O.A.C. “Acid-Catalyzed Homogenous Esterfication Reaction for Biodiesel
Production from Palm fatty Acids”, Springer, 122, 20–25, (2008).
Aranda, R., Kannan, G.R., Reddy, K.R. and Velmathi, S. “The Performance and
Emissions of a Variable Compression Ratio Diesel Engine Fuelled with
Biodiesel from Cotton Seed”, ARPN Journal of Engineering and Applied
Sciences, VOL. 4, NO. 9, (2009).
Azam, M.M., Waris, A. and Nahar, N.M. “Prospects and Potential of Fatty Acid
Methyl Esters of Some Non-traditional Seed Oils for use as biodiesel in
India”, Biomass and Bioenergy 29, 293–302, (2005).
Barnes, L.L. IL Waste Management and Research Center: IL, Vol. TN06-085,
(2006).
Berchmans, H.J. and Hirata, S. “Biodiesel Production from Crude Jatropha curcas
L. Seed Oil with a High Content of Free Fatty Acids”, Bioresour Technol,
99, 1716-1721, (2008).
Berrios, M., Siles, J., Martin, M.A. and Martin, A. “A Kinetic Study of The
Esterification of Free Fatty Acids (FFA) in Sunflower Oil”, Fuel, 86, 2383–
2388, (2007).
Bisowarno, B.H., Tian, Y.C., and Tade, M.O. “Application of Side Reactors on
ETBE Reactive Distillation”, Chem. Eng. J., 99, 35–43, (2004).
123
Boog, J.H.F., Silveira, E.L.C., de Caland, L.B. and Tubino, M. “Determining the
residual alcohol in biodiesel through its flash point”, Fuel 90, 905–907,
(2011).
Boucher, M.B., Unker, S.A., Hawley, K.R., Wilhite, B.A., Stuart, J.D. and Parnas,
R.S. “Variables affecting homogeneous acid catalyst recoverability and reuse
after esterification of concentrated omega-9 polyunsaturated fatty acids in
vegetable oil triglycerides”, Green Chem., 10, 1331–1336 (2008).
Budiman, A., Kusumaningtyas, R.D., Sutijan; Rochmadi and Purwono, S. “Second
Generation of Biodiesel Production from Indonesian Jatropha Oil by
Continuous Reactive Distillation Process”, AJCHE, vol.9, No. 2, 35-48,
(2009).
Camara, L.T.D. and Aranda, D.A.G. “ Reaction Kinetic Study of Biodiesel
Production from Fatty Acids Esterfication with Ethanol”, Ind. Eng. Chem.
Res., 50, 2544-2547, (2011).
Castro, F.I.G., Ramirez, V.R., Hernandez, JG.S. and Hernandez, S. “Feasibility
Study of a thermal coupled reactive distillation process for biodiesel
production”, Chemical Engineering and Processing: Process Intensification,
49, 262-269, (2010).
Castro, F.I.G., Ramirez, V.R., Hernandez, JG.S. and Hernandez, S. “Esterification of
Fatty Acids in a Thermally Coupled Reactive Distillation Column by the
two-step Supercritical Methanol Method”, Chemical Engineering Research
and Design, 89,480-490, (2011).
Cardoso, A.L., Neves, S.C.G. and da Silv., M.J. “Esterification of Oleic Acid for
Biodiesel Production Catalyzed by SnCl2: A Kinetic Investigation”,
energies,1, 79-92, (2008).
Carmo Jr. A.C., de Souza, L.K.C., da Costa, C.E.F., Longo, E.; Zamian, J.R., and
Filho, G.N.R. “Production of biodiesel by esterification of palmitic acid over
mesoporous aluminosilicate Al-MCM-41”, Fuel, 88, 461–468, (2009).
124
Chhetri, A.B., Watts, K.C., Islam, M. R. “Waste Cooking Oil as an Alternate
Feedstock for Biodiesel Production”, Energies, 1, 3-18, (2008).
Changi, S., Pinnarat, T. and Savage, P.E. “Modeling Hydrolysis and Esterfication
Kinetics for Biofules Processes”, Ind. Eng. Chem. Res., 50, 3206-3211,
(2011).
Chen, F., Sun, H., Naka, Y. and Kawasaki, J. “Reaction and Lquid-Liquid
Distribution Equilibria in Oleic Acid/Methanol/Methyl Oleate/Water System
at 73oC”, Journal of Chemical Engineering of Japan, Vol. 34, No. 12, 1479-
1485, (2001).
Chen, S.Y., Ahmad, A., Mohamed, A. and Bhatia, S. “Esterification of Palmitic
Acid with Iso-Propanol in a Catalytic Distillation Column: Modeling and
Simulation Studies”, International Journal of Chemical Reaction
Engineering, Vol. 4, Article A32, 1-11, (2006).
Chongkhong, S., Tongurai, C.; Chetpattananondh, P., and Bunyakan, C.
“Biodiesel production by esterification of palm fatty acid distillate”, Biomass
and Bioenergy, (2007).
Darnoko, D., Cheryan, M. “Kinetics of Palm Oil Transesterification in a Batch
Reactor”, JAOCS, Vol. 77, No. 12, 1263 – 1267, (2000).
De Boer, K. and Bahri, P.A. “Investigation of Liquid-Liquid Two Phase Flow in
Biodiesel Production”, Seventh International Conference on CFD in the
Minerals and Process Industries, CSIRO, Melbourne, Australia, 9-11
December (2009).
Demirbas, A. “Fuel Properties and Calculation of Higher Heating Values of
Vegetable oils”, Fuel, 77, 1117-1120, (1998).
Decot, M., Fred, F., Ortiz, N., Frasier, N. “Reactive Distillation for Esterification of
Bio-based Organic Acids”, Michigan State University, (2007).
Deng, X., Fang, Z., Liu, Y. “Ultrasonic transesterfication of Jatropha curcas L. oil to
biodiesel by a two step-process”, Energy Conversion & Management,
125
51,2802-2807, (2010).
Drapcho, C.M., Nhuan, N.P., Walker, T. H. “Biofuels Engineering Process
Technology”, The McGraw-Hill Companies, (2008).
Edreder, E.A., Mujtaba, I.M. and Emtir, M. “Optimization of Batch Reactive
Distillation Process: Production of Lactic Acid, 20th European Symposium
on Computer Aided Process Engineering-ESCAPE20, (2010).
Enweremadu, C.C. and Alamu, O.J. “Development and Characterization of
Biodiesel from Shea nut Better”, Int. Agrophysics, 24, 29-34, (2010).
Fortin, T. and Thériault, P., “Design of a continuous flow biodiesel production
research unit in India”, Collaboration project between McGill Univesity
Bioresource Engineering Department and Tamil Nadu Agriculture
University,(2008).
Felizardo, P., Correia, M.J.N., Rapos, I., Mendes, J.F., Berkemeier, R. and
Bordado, J.M. "Production of biodiesel from waste frying oils”, Waste
Management, Volume, , Pages 487-494, (2006).
Fredenslund, A., Jones, R. L. and Prausnitz, J. M. “Group-Contribution Estimation
of Activity Coefficients in Nonideal Liquid Mixtures”, AIChE Journal, Vol.
21, p.1086-1099, (1975).
Galindo, E.Y.M., Gabriel, J., et. al., “Design of Reactive Distillation with Thermal
Coupling for the synthesis of Biodiesel using Genetic Algorithms”, 19th
European Symposium on Computer Aided Process Engineering, (2009).
Gerpen, J. “Biodiesel processing and production”, Fuel Processing Technology 86,
1097– 1107(2005).
Glisic, S., Oscar, M., Orlovic, A. and Skala, D. “Vapor-Liquid equilibria of
triglycerides-methanol mixtures and their influence on the biodiesel
syntheseis under supercritical conditions of methanol”, J. Serb. Chem. Soc.,
72 (1), 13-27, (2007).
Haaland, P.D. “Experimental Design in Biotechnology”, Marcel Dekker, New York,
126
(1989), as sign in: Omar, W.N.N.W., et al., (2009).
Halek, F., Kavousi, A., Banifatemi, M. “Biodiesel as an Alternative Fuel for Diesel
Engines”, World Academy of Science, Engineering and Technology, 57
(2009).
Hanh, H. D., The Dong , N., Okitsu, K., Nishimura, R. and Maeda, Y. “Biodiesel
production by esterification of oleic acid with short-chain alcohols under
ultrasonic irradiation condition”, Renewable Energy, 34 ,780–783, (2009).
He, B. “A Novel Continuous-Flow Reactor Using Reactive Distillation Technique
for Economical Biodiesel Production”, National Institute for Advanced
Transportation Technology University of Idaho, (2006).
Isyama, Y. and Saka, S. “Biodiesel Production by Supercritical process with crude
bio-methanol prepared by wood gasification”, Bioresourse Technology, 99,
4775-4779, (2008).
Issariyakul, T. “Biodiesel Production from Fryer Grease”, M.SC. Thesis, University
of Saskatchewan, Saskatoon, Saskatchewan, June (2006).
Kim, S., Yim, B. and Park, Y. “Application of Taguchi Experimental Design for the
Optimization of Effective Parameters on the Rapeseed Methyl Ester
Production”, Environmental Engineering Research, 15, 3, 129-134, (2010).
Kiss, A.A., Dimian, A.C. and Rothenberg, G. “Biodiesel by Catalytic Reactive
Distillation Powered by Metal Oxides”, Energy & Fuels,22, 598-604, (2008).
Kiss, A.A., Omota, F., Dimian, A.C. and Rothenberg, G. “The heterogeneous
advantage: biodiesel by catalytic reactive distillation”, Springer, 40, 141-150,
(2006a).
Kiss, A.A., “Separative reactors for integrated production of bioethanol and
biodiesel”, Computers and Chemical Engineering, (2009).
Kiss, A.A., Dimian, A.C. and Rothenberg, G. “Solid Acid Catalysts for Biodiesel
Production - Towards Sustainable Energy”, Adv. Synth. Catal., 348, 75 – 81,
(2006b).

127
Kister, H. Z. “Distillation design”, McGraw-Hill, Inc., New York (1992).
Komintarachat, C., Chuepeng, S. “Methanol-Based Transesterification
Optimization of Waste Used Cooking Oil over Potassium Hydroxide
Catalyst”, American Journal of Applied Sciences, 7, 1073-1078, (2010).
Knothe, G., Gerpen, J. H. v.; Krahl, J. The biodiesel handbook; AOCS Press:
Champaign, IL, (2005a).
Knothe, G.; Steidley, K.R. “Kinematic Viscosity of Biodiesel Fuel Components and
Related Compounds”, Fuel, 84, 1059-1065, (2005b).
Krisnangkura, K. “A Simple Method for Estimation of Cetane Index of Vegetable
Oil Methyl Esters”, J. Am. Oil Chem. Soc., 63, 4, 552-553, (1986), as sign in
Enweremadu, C.C., (2010).
Kumar, R. and Mahjani “Esterification of Lactic Acid with n-Butanol by Reactive
Distillation”, Ind. Eng. Chem. Res., 46, 6873-6882, (2007).
Kusmiyati, Sugiharto, A. “Production of Biodiesel from Oleic Acid and Methanol
by Reactive Distillation”, Bulletin of Chemical Reaction Engineering &
Catalysis (BCREC), (2010).
Kusumaningtyas, R.D., Budiman, A., Rochmadi, Sutijan, Purwono, S.,
“Experimental Investigation of Biodiesel Synthesis from palm Oil using
Reactive Distillation Process”, Regional Symposium on Chemical
Engineering, RSCE, Manila, Philippine December (2009).
Lee, J. W. and Westerberg, A. W. “Visualization of Stage Calculations in Ternary
Reacting Mixtures”, Comp. Chem. Eng., 24, 639-644, (2000).
Lucena, I.L., Silva, G.F. and Fernandes, F.A.N. “Biodiesel Production by
Esterification of Oleic Acid with Methanol Using a Water Adsorption
Apparatus”, Ind. Eng. Res., 47, 6885-6889, (2008).
Ma, F., Hanna, M.A. “Biodiesel production: a review”, Bioresource Technology,
70, 1-15, (1999).

128
Machado, G.D., Aranda, D.A.G., Castier, M., Cabral, V.F. and Filho, L.C.
“Computer Simulation of Fatty Acid Esterification in Reactive Distillation
Columns”, Ind. Eng. Chem. Res., 50, 10176–10184, (2011).
Mahamuni, N.N. and Adewuyi, Y.G.. “Application of Taguchi Method to Investigate
the Effects of Process Parameters on the Transesterification of Soybean Oil
Using High Frequency Ultrasound”, Energy Fuels, 24, 2120-2126, (2010).
Marchetti, J.M., Miguel, V.U.,. Errazu, A.F. “Hetrogenous esterfication of oil with
high amount of free fatty acids”, Fuel, 86, 906-910, (2007).
Matallana, L.G., Gutierrez, L.F. and Cardona, C.A. “Biodiesel Production By
Reactive Distillation”, National University of Colombia at Manizales.
Maya, A., Viales, L.C., Arias, M.M., Mata, C.J.F. and Segreda “Kinetics of the
Fischer esterification of palm fatty acids with isopropanol and butyl-
cellosolve”, Ciencia y Technology, 24(2): 175-181, (2006).
Modia, G. “Reactive Pressure Swing Batch Distillation by a New Double Column
System”, Computers and Chemical Engineering, (2011).
Moser, B.R. Knothe, G., Vaughn, S.F. and Isbell, T.A “Production and Evaluation of
Biodiesel from Field Pennycress Oil”, Energy & Fuels, 23, 4149–4155,
(2009).
Melo Junior, C.A.R., Albuquerque, C.E.R. et. al., “Solid-Acid Catalyzed by
Microwave Heating”, Ind. Eng. Chem., (2010).
Mueanmas, C., Prasertsit, K, Tongurai, C. “Feasibility Study of Reactive
Distillation Column for Transesterification of Palm Oils”, nternational
Journal of Chemical Engineering and Applications, Vol. 1,(2010).
Mujtaba I. M. “Batch distillation design and operation”, Series on chemical
engineering, Vol. 3. (2004).
N. De Lima Da Siliva, Santander, C.M.G., et. al., “Biodiesel Production from
Integration Between Reaction and Separation System: Reactive Distillation
Process”, App Biochem Biotechnol , Springer Science, 161, 245-254,
129
(2010a).
N. De Lima Da Siliva, Santander, C.M.G., et. al., “Biodiesel Production from
Reactive Distillation Process: A comparative between experimental and the
simulation”, Distillation Absorption, 307-312, (2010b).
Neji, S.B., Trabelsi, M., and Frikha, M. H. “Esterification of Fatty Acids with
Short-Chain Alcohols over Commercial Acid Clays in a Semi-Continuous
Reactor”, Energies, 2, 1107-1117,(2009).
Neter, J., Kutner, M.H., Nachtsheim, C.J. and Wasserman, W. “Applied Linear
Statistical Method ”, The McGraw-Hill Companies, Inc., (1996).
Nouredini, H. ; Zhu, D. “Kinetic of Transesterfication of Soybean Oil”, JAOCS, 74,
1457-1463, (1997).
Oliveira, M.B., Miguel, S.I., Queimada, A.J., and Coutinho, J.A.P. “Phase Equilibria
of Ester + Alcohol Systems and Their Description with the Cubic-Plus-
Association Equation of State”, Ind. Eng. Chem. Res., 49, 3452-3458,
(2010).
Omar, W.N.N.W., Nordin, N., Mohamed, M. and Amin, N.A.S. “A Two Step
Biodiesel Production from Waste Cooking Oil: Optimization of Pre-
Treatment”, Journal of Applied Sciences, 9, 17, 3098-3103, (2009).
Patel, V. “Cetane Number of New Zealand Diesel”, Report Office of Chief Gas
Engineer, Engineer, Energy Inspection Group, Ministry of Commerce Press,
Wellington, New Zealand, (1999), as sign in Enweremadu, C.C., (2010).
Parthiban, K.T., Selvan, P.; Paramathma, M., Kanna, S.U., Subbulakshmi, V. and
Vennila, S. “Physico-chemical characterization of seed oil from Jatropha
curcas L. genetic resources”, Journal of Ecology and the Natural
Environment Vol. 3(5), pp. 163-167, May (2011).
Peng, D.Y., and D. B. Robinson “A new two-constant equation of state”, Ind. Eng.
Chem. Fundamentals, 15, 59-64 (1976).

130
Pereira, C.S.M., Pinho, S.P., Sliva, V.M.T.M. and Rodrigues, A.E.
“Thermodynamic Equilibrium and Reaction Kinetics for the Esterification of
Lactic Acid with Ethanol Catalyzed by Acid Ion-Exchange Resin”, Ind. Eng.
Chem. Res., 47, 5, 1453-1463, (2008)
Pinto, A.C., Guarieiro, L.L.N., Rezende, M.J.C., Ribeiro, N.M., Torres, E.A.,
Lopes, W.A., Pereira, P.A. and de Andrade, J.B. “Biodiesel: An Overview”,
J. Braz. Chem. Soc., Vol. 16, No. 6B, 1313-1330, (2005).
Reid, R.C., J. M. Prausnitz, and B. E. Poling “The properties of gases and liquids”,
fourth edition, McGraw-Hill, Inc., New York (1987).
Renon, H. and Prausnitz, J.M. “Local Compositions in Thermodynamic Excess
Functions for Liquid Mixtures”, AIChE Journal, 14, 135, p.45, (1968).
Roy, R.K. Design of experiments using the Taguchi approach: 16 steps to product
and process improvement. New York: Wiley, (2001), as sign in Kim, S. et. al.
(2010).
Saka, S., Minami, E., “A Novel Non-catalytic Biodiesel Production Process by
Supercritical Methanol”, The 2nd Joint International Conference on
“Sustainable Energy and Environment (SEE 2006)” 21-23 November 2006,
Bangkok, Thailand.
Saka, S., Kusdiana, D. and Minami, E. “Non-catalytic Biodiesel Fuel Production
Process with Supercritical Methanol Technologies”, Journal of Scientific and
Industrial Research, Vol. 65, 420-425, (2006).
Sanford, S.D., White, J.M., et. al., “Feedstock and Biodiesel Characteristics
Report”, Renewable Energy Group®, (2009).
Santacesaria, E., Tesser, R., Di Serio, M., Guida, M., Gaetano, D., Agreda, A.G.,
and Cammarota, F. “Comparison of Different Reactor Configurations for the
Reduction of Free Acidity in Raw Materials for Biodiesel Production”, Ind.
Eng. Chem. Res., 46, 8355-8362, (2007).
Santander, C.G.M., N. de Lima da Siliva, ., et. al., “Simulation of the Reactive
131
Distillation Process for Biodiesel Production”, 20th European Symposium on
Computer Aided Process Engineering – ESCAPE20, S. Pierucci and Buzzi
Ferraris, (2010).
Satriana, Supardan, M.D. “Kinetic Study of Esterification of Free Fatty Acid in
Low Grade Crude Palm Oil using Sulfuric Acid”, AJChE, Vol.8 , No.1 , 1-8
(2008).
Seader, J.D., and Henley, E.J. “Separation process principles”, John Wiley and
Sons, Inc., New York (1998).
Sendzikiene, E., Makareviciene, V., Janulis, P., Kitrys, S. “Kinetics of free fatty
acids esterification with methanol in the production of biodiesel fuel”, Eur. J.
Lipid Sci. Technol. 106, 831–836, (2004).
Singh, A. P., Thompson, J. C., He, B. B. “A Continuous-flow Reactive Distillation
for Biodiesel Preparation from Seed Oil”, ASAE/CSAE Meeting
presentation, 1-4 August (2004).
Sinnott, R.K. Coulson and Richardson’s chemical engineering, chemical
engineering design Volume 6, third edition: Butterworth Heinemann (1999).
Sinott, R.K. Coulson & Richardson's Chemical Engineering. Third edition. Volume
6 Chemical Engineering Design. Swansea: Butterworth-Heinemann
publications, (1983), as sign in Tenaw, S. (2010).
Sheehan, J., Dunahay, T., Benemann, J., Roessler, P. “A Look Back at the U.S.
Department of Energy’s Aquatic Species Program-Biodiesel from Algae”,
National Renewable Energy Laboratory, July (1998).
Shereena, K.M., Thangaraj, T. “Determination of Optimal Alkaline Catalyst
Concentration for the Maximum Production of Biodiesel from Edible and
non-edible oils”, Journal of Phytology, 1, 95- 99, (2009).
Smith, J.M., Van Ness, H.C. and Abbott, M.M. “Introduction to chemical
engineering”, sixth edition, McGraw-Hill Chemical Engineering Series, USA
(2001).
132
Sohpal, V.K., Singh, A., Dey, A. “Fuzzy Modeling to Evaluate the Effect of
Temperature on Batch Transesterification of Jatropha Curcas for Biodiesel
Production”, Bulletin of Chemical Reaction Engineering & Catalysis, 6 (1),
31 – 38, (2011).
Soave, G. “Equilibrium constants from a modified Redlich-Kowng equation of
state”, Chem. Eng. Sci., 27, 1197-1203 (1972).
Steinigeweg, S., Gmehling, J. “Esterfication of a Fatty Acid by Reactive
Distillation”, Ind. Eng. Chem., 42, 3612-3619, (2003).
Sulistyo, H., Rahayu, S. S., Winoto, G. and Suardjaja, I. M. “Biodiesel Production
from High Iodine Number Candlenut Oil”, World Academy of Science,
Engineering and Technology, 48, (2008).
Taguchi, G. Introduction to Quality Engineering; UNIPUB/Kraus International:
White Plains, (1986), as sign in Mahamuni, N.N., et. al. (2010).
Tenaw, S. “Biodiesel Production by Reactive Distillation”, M. Sc. Thesis, Addis
Ababa University School of Graduated Students Faculty of Technology
Department of Chemical Engineering, June, (2010).
Tesser, R., Di Serio, M., Guida, M., Nastasi, M. and Santacesaria, E. “ Kinetics of
Oleic Acid Esterfication with Methanol in the Presence of Triglycerides”,
Ind. Eng. Chem. Res., 44, 7978-7982, (2005).
Thotla, S. and Mahajani, S. “Reactive distillation with side draw”, Chemical
Engineering and Processing: Process Intensification, 48, 4, 927-937, (2009).
Thiruvengadaravi, K. V., et. al., “Kinetic study of the esterification of free fatty
acids in non-edible Pongamia pinnata oil using acid catalyst”, Indian Journal
of Science and Technology, 2, 12, Dec. (2009).
Triola, M.F. “Elementary Statistics”, Wesley Longman, Inc., Fourth Edition,
(1997).
Turner, L.T. “Modeling and Simulation of Reaction Kinetics of Biodiesel
Production”, M. Sc. Thesis, North Carolina State University Department of
133
Mechanical Engineering, (2005).
Viera, A. P. de A., da Silva, M. A. P. and Langone, M.A. “Biodiesel Production Via
Esterfication Reactors”, Latin America Applied Research, 36, 283-288,
(2006).
Vieville, C., Mouloungui, Z. and Gaset, A. “Esterification of Oleic Acid by
Methanol Catalyzed by p-Toluenesulfonic Acid and the Cation-Exchange
Resins K2411 and K1481 in Supercritical Carbon Dioxide”, Ind. Eng. Chem.
Res., 32, 2065-2068, (1993).
Uriarte, J.F. “Biofuels from Plant Oils”, the ASEAN Foundation, Jakarta, Indonesia,
(2010).
Walas, S.M. “Phase equilibria in chemical engineering”, Butterworth Publications,
London (1985).
Wagner, I., J. Stichlmair, and J. R. Fair “Mass transfer in beds of modern, high
efficiency random packings”, Ind. Eng. Chem. Res., 36, 227-237 (1997).
West, A. H.; Posarac, D. ; Ellis, N. “Assessment of four Production Processes using
HYSYS. Plant ”, Bioresource Technology, 99, 6587-6601, (2007).
Wilson, G.M. and Deal, “Experimental Data”, C.H., Ind. Eng. Chem. Fundam., 1,
20 (1962).
Yadav, P.K.S. Singh, O., Singh, R. P. “Palm Fatty Acid Biodiesel: Process
Optimization & Study of Reaction Kinetics”, Journal of Oil Science,
59,11,575-580, (2010).
Yuan, W., Hansen, A.C. and Zhang, Q. “Vapor pressure and normal boiling point
predictions for pure methyl esters and biodiesel fuel”, Fuel, 84, 943-950,
(2005).
Zhang, J., and Jiang, L. “Acid-catalyzed esterification of Zanthoxylum bungeanum
seed oil with high free fatty acids for biodiesel production”, Bioresource
Technology, 99, 8995–8998, (2008).
134
Zubir, M. I., Chin, S. Y. “Kinetics of Modified Zirconia-catalyst Heterogeneous
Esterification Reaction for Biodiesel Production ”, Journal of Applied
Science, 21, 10, 2584-2589, (2010).

A-1
Appendix A
Parameters of Activity Coefficient Model
A.1 NRTL Model Parameters Table A.1 NRTL parameters for the binary pairs of components in the reactive mixtures
(ChemCad database)
ji ijB jiB ij
OLAC - MEOH 199.884 479.688 1.1431
MEOH - H2O -24.4933 307.166 0.3001
OLAC - MEOL 37.63835 36.76161 0.2907206
OLAC - H2O -44.8289 2497.61 0.2250879
MEOH - MEOL 1388.564 -240.4565 0.399494
MEOL - H2O 106.4762 2499.963 0.200312
A.2 UNIQUAC Model Parameter Table A.2 UNIQUAC parameters for the oleic acid – methanol – methyl oleate – water
mixture, cal/mol (ChemCad database)
ji jjij uu iiji uu
OLAC - MEOH 952.028 -149.181
MEOH - H2O 95.259 -10.377
OLAC - MEOL 154.7875 -133.418
OLAC - H2O 1123.794 403.7021
MEOH - MEOL -54.20368 1205.077
MEOL - H2O 1573.999 481.5153
Click t
o buy NOW!
PDF-XChange
ww
w.tracker-software.c
om Click t
o buy NOW!
PDF-XChange
ww
w.tracker-software
.com
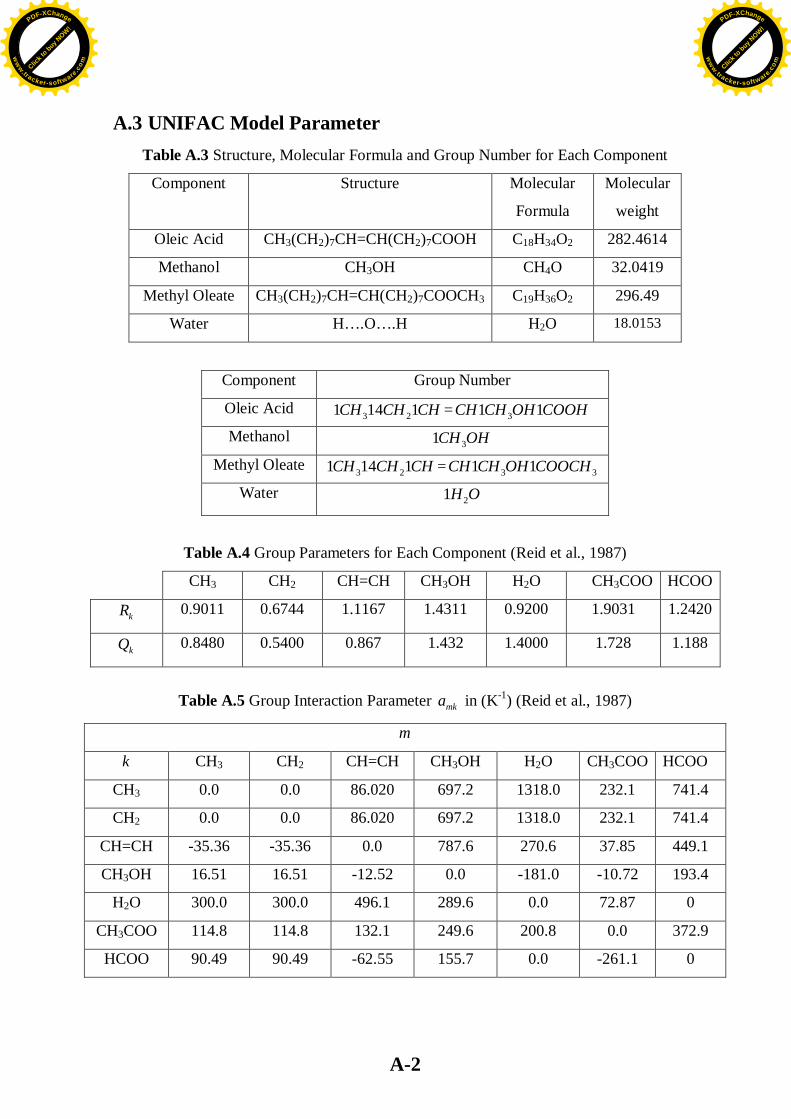
A-2
A.3 UNIFAC Model Parameter Table A.3 Structure, Molecular Formula and Group Number for Each Component
Component Structure Molecular
Formula
Molecular
weight
Oleic Acid CH3(CH2)7CH=CH(CH2)7COOH C18H34O2 282.4614
Methanol CH3OH CH4O 32.0419
Methyl Oleate CH3(CH2)7CH=CH(CH2)7COOCH3 C19H36O2 296.49
Water H….O….H H2O 18.0153
Component Group Number
Oleic Acid CHCHCH 1141 23 = COOHOHCHCH 11 3
Methanol OHCH31
Methyl Oleate CHCHCH 1141 23 = 33 11 COOCHOHCHCH
Water OH21
Table A.4 Group Parameters for Each Component (Reid et al., 1987)
HCOO CH3COO H2O CH3OH CH=CH CH2 CH3
1.2420 1.9031 0.9200 1.4311 1.1167 0.6744 0.9011 kR
1.188 1.728 1.4000 1.432 0.867 0.5400 0.8480 kQ
Table A.5 Group Interaction Parameter mka in (K-1) (Reid et al., 1987)
m
k CH3 CH2 CH=CH CH3OH H2O CH3COO HCOO
CH3 0.0 0.0 86.020 697.2 1318.0 232.1 741.4
CH2 0.0 0.0 86.020 697.2 1318.0 232.1 741.4
CH=CH -35.36 -35.36 0.0 787.6 270.6 37.85 449.1
CH3OH 16.51 16.51 -12.52 0.0 -181.0 -10.72 193.4
H2O 300.0 300.0 496.1 289.6 0.0 72.87 0
CH3COO 114.8 114.8 132.1 249.6 200.8 0.0 372.9
HCOO 90.49 90.49 -62.55 155.7 0.0 -261.1 0
Click t
o buy NOW!
PDF-XChange
ww
w.tracker-software.c
om Click t
o buy NOW!
PDF-XChange
ww
w.tracker-software
.com
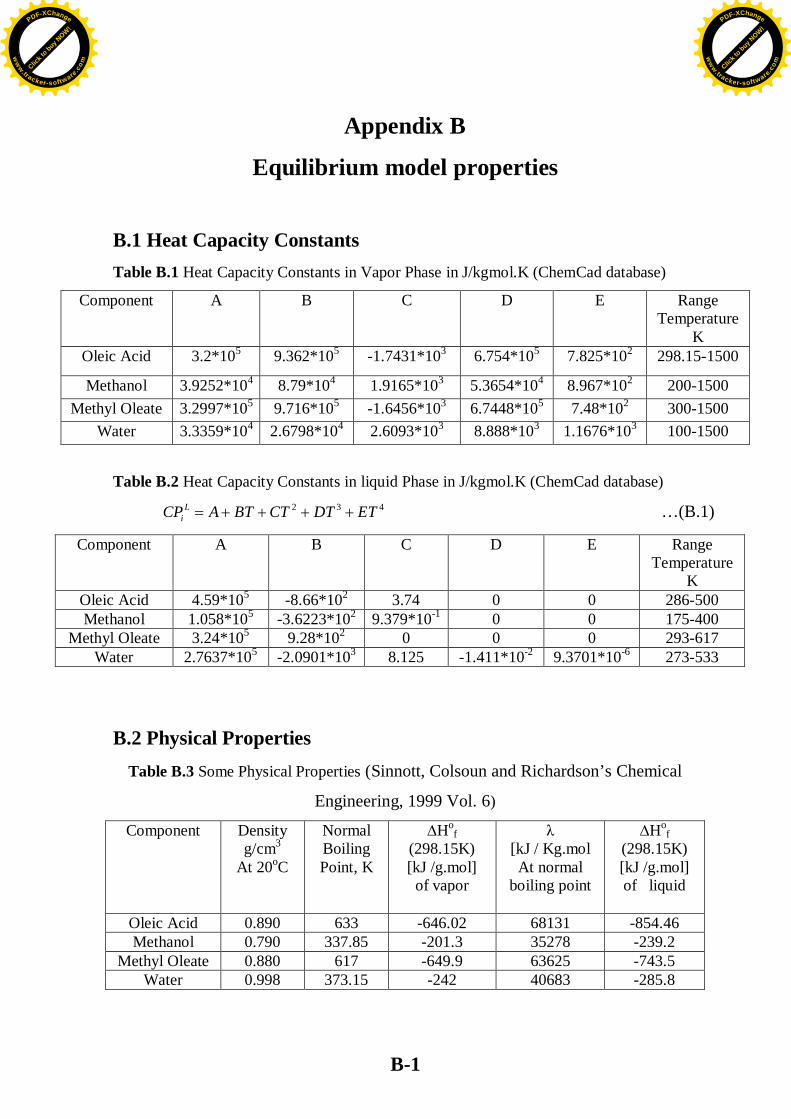
B-1
Appendix B
Equilibrium model properties
B.1 Heat Capacity Constants Table B.1 Heat Capacity Constants in Vapor Phase in J/kgmol.K (ChemCad database)
Component A B C D E
Range Temperature
K Oleic Acid 3.2*105 9.362*105 -1.7431*103 6.754*105 7.825*102 298.15-1500
Methanol 3.9252*104 8.79*104 1.9165*103 5.3654*104 8.967*102 200-1500 Methyl Oleate 3.2997*105 9.716*105 -1.6456*103 6.7448*105 7.48*102 300-1500
Water 3.3359*104 2.6798*104 2.6093*103 8.888*103 1.1676*103 100-1500
Table B.2 Heat Capacity Constants in liquid Phase in J/kgmol.K (ChemCad database) 432 ETDTCTBTACPL
i
Component A B C D E Range Temperature
K Oleic Acid 4.59*105 -8.66*102 3.74 0 0 286-500 Methanol 1.058*105 -3.6223*102 9.379*10-1 0 0 175-400
Methyl Oleate 3.24*105 9.28*102 0 0 0 293-617 Water 2.7637*105 -2.0901*103 8.125 -1.411*10-2 9.3701*10-6 273-533
B.2 Physical Properties Table B.3 Some Physical Properties (Sinnott, Colsoun and Richardson’s Chemical
Engineering, 1999 Vol. 6)
Component Density g/cm3
At 20oC
Normal Boiling Point, K
Hof
(298.15K) [kJ /g.mol]
of vapor
[kJ / Kg.mol At normal
boiling point
Hof
(298.15K) [kJ /g.mol] of liquid
Oleic Acid 0.890 633 -646.02 68131 -854.46 Methanol 0.790 337.85 -201.3 35278 -239.2
Methyl Oleate 0.880 617 -649.9 63625 -743.5 Water 0.998 373.15 -242 40683 -285.8
…(B.1)
Click t
o buy NOW!
PDF-XChange
ww
w.tracker-software.c
om Click t
o buy NOW!
PDF-XChange
ww
w.tracker-software
.com
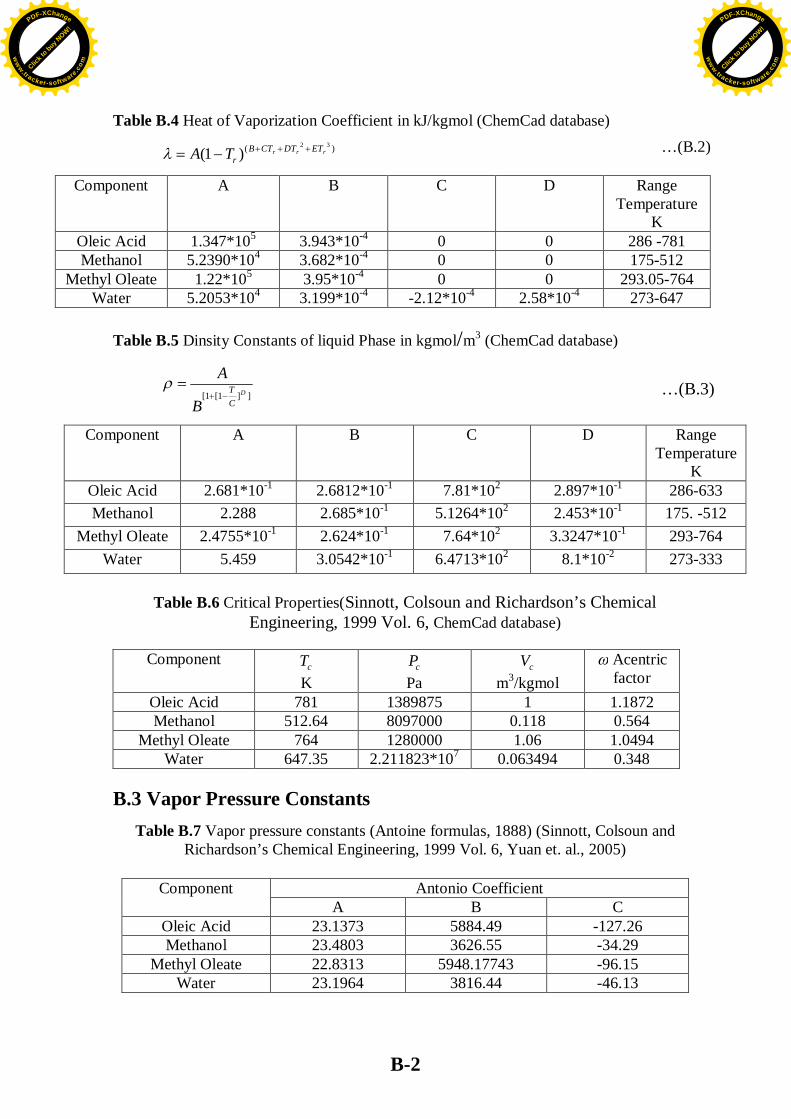
B-2
Table B.4 Heat of Vaporization Coefficient in kJ/kgmol (ChemCad database) )( 32
)1( rrr ETDTCTBrTA
Component A B C D Range Temperature
K Oleic Acid 1.347*105 3.943*10-4 0 0 286 -781 Methanol 5.2390*104 3.682*10-4 0 0 175-512
Methyl Oleate 1.22*105 3.95*10-4 0 0 293.05-764 Water 5.2053*104 3.199*10-4 -2.12*10-4 2.58*10-4 273-647
Table B.5 Dinsity Constants of liquid Phase in kgmol/m3 (ChemCad database)
]]1[1[ D
CT
B
A
Component A B C D Range Temperature
K Oleic Acid 2.681*10-1 2.6812*10-1 7.81*102 2.897*10-1 286-633 Methanol 2.288 2.685*10-1 5.1264*102 2.453*10-1 175. -512
Methyl Oleate 2.4755*10-1 2.624*10-1 7.64*102 3.3247*10-1 293-764 Water 5.459 3.0542*10-1 6.4713*102 8.1*10-2 273-333
Table B.6 Critical Properties(Sinnott, Colsoun and Richardson’s Chemical
Engineering, 1999 Vol. 6, ChemCad database)
B.3 Vapor Pressure Constants
Table B.7 Vapor pressure constants (Antoine formulas, 1888) (Sinnott, Colsoun and Richardson’s Chemical Engineering, 1999 Vol. 6, Yuan et. al., 2005)
Antonio Coefficient
C B A Component
-127.26 5884.49 23.1373 Oleic Acid -34.29 3626.55 23.4803 Methanol -96.15 5948.17743 22.8313 Methyl Oleate -46.13 3816.44 23.1964 Water
Acentric factor
cV m3/kgmol
cP Pa
cT K
Component
1.1872 1 1389875 781 Oleic Acid 0.564 0.118 8097000 512.64 Methanol 1.0494 1.06 1280000 764 Methyl Oleate 0.348 0.063494 2.211823*107 647.35 Water
…(B.2)
…(B.3)
Click t
o buy NOW!
PDF-XChange
ww
w.tracker-software.c
om Click t
o buy NOW!
PDF-XChange
ww
w.tracker-software
.com
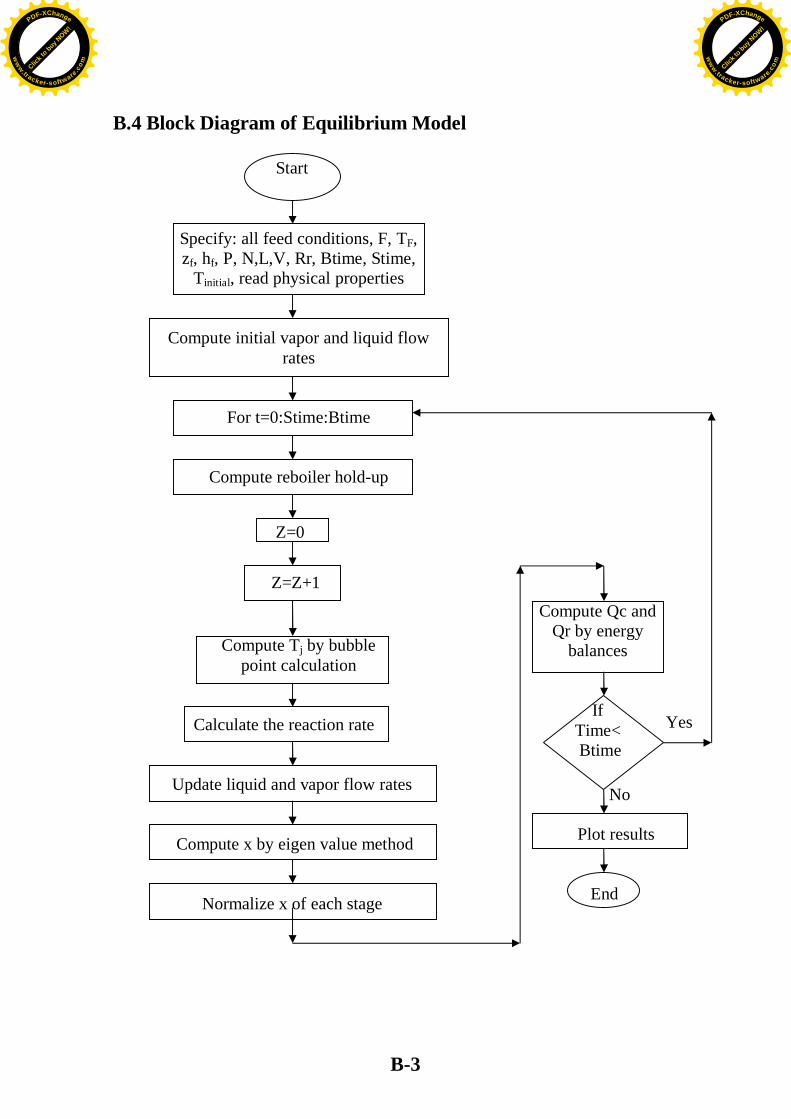
B-3
B.4 Block Diagram of Equilibrium Model
Compute Qc and Qr by energy
balances
If Time<
Btime
No
Plot results End
Start
Specify: all feed conditions, F, TF, zf, hf, P, N,L,V, Rr, Btime, Stime,
Tinitial, read physical properties
Compute initial vapor and liquid flow rates
For t=0:Stime:Btime
Compute reboiler hold-up
Z=0 Z=Z+1
Compute Tj by bubble point calculation
Calculate the reaction rate Update liquid and vapor flow rates Compute x by eigen value method Normalize x of each stage
Yes
Click t
o buy NOW!
PDF-XChange
ww
w.tracker-software.c
om Click t
o buy NOW!
PDF-XChange
ww
w.tracker-software
.com
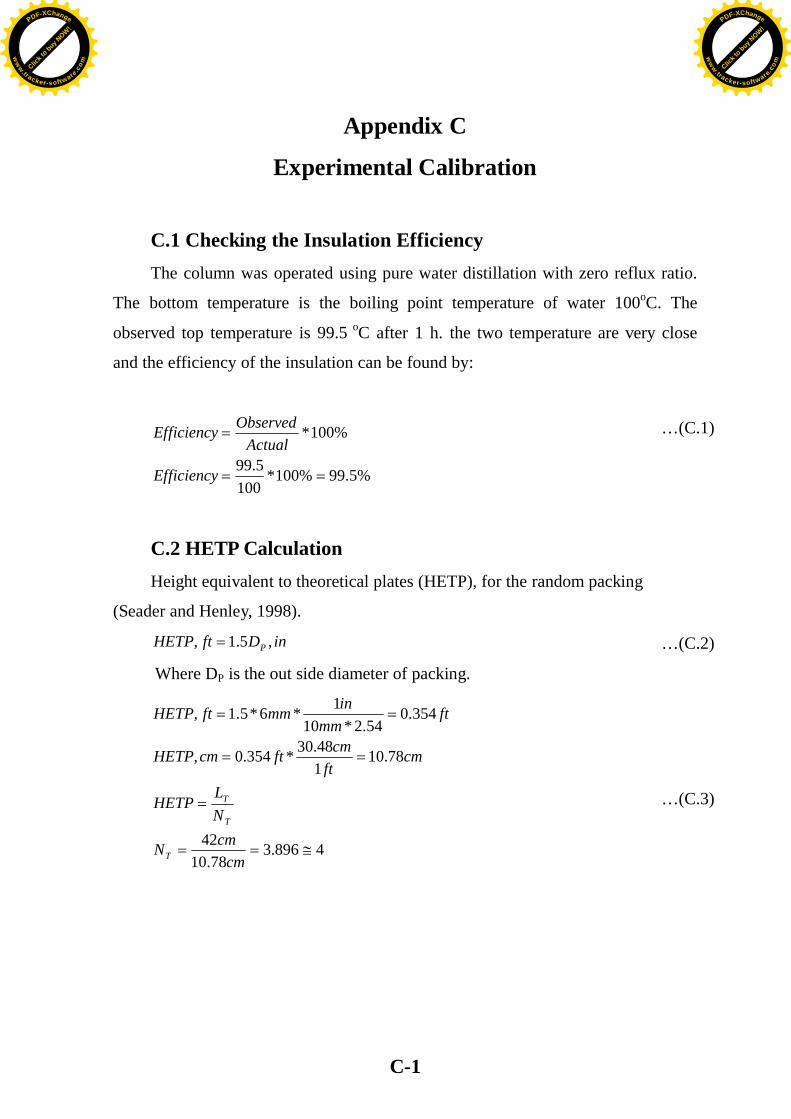
C-1
Appendix C
Experimental Calibration
C.1 Checking the Insulation Efficiency The column was operated using pure water distillation with zero reflux ratio.
The bottom temperature is the boiling point temperature of water 100oC. The
observed top temperature is 99.5 oC after 1 h. the two temperature are very close
and the efficiency of the insulation can be found by:
%5.99%100*100
5.99
%100*
Efficiency
ActualObservedEfficiency
C.2 HETP Calculation Height equivalent to theoretical plates (HETP), for the random packing
(Seader and Henley, 1998).
inDftHETP P ,5.1,
Where DP is the out side diameter of packing.
4896.378.10
42
78.10148.30*354.0,
354.054.2*10
1*6*5.1,
cmcmN
NLHETP
cmft
cmftcmHETP
ftmm
inmmftHETP
T
T
T
…(C.1)
…(C.2)
…(C.3)
Click t
o buy NOW!
PDF-XChange
ww
w.tracker-software.c
om Click t
o buy NOW!
PDF-XChange
ww
w.tracker-software
.com
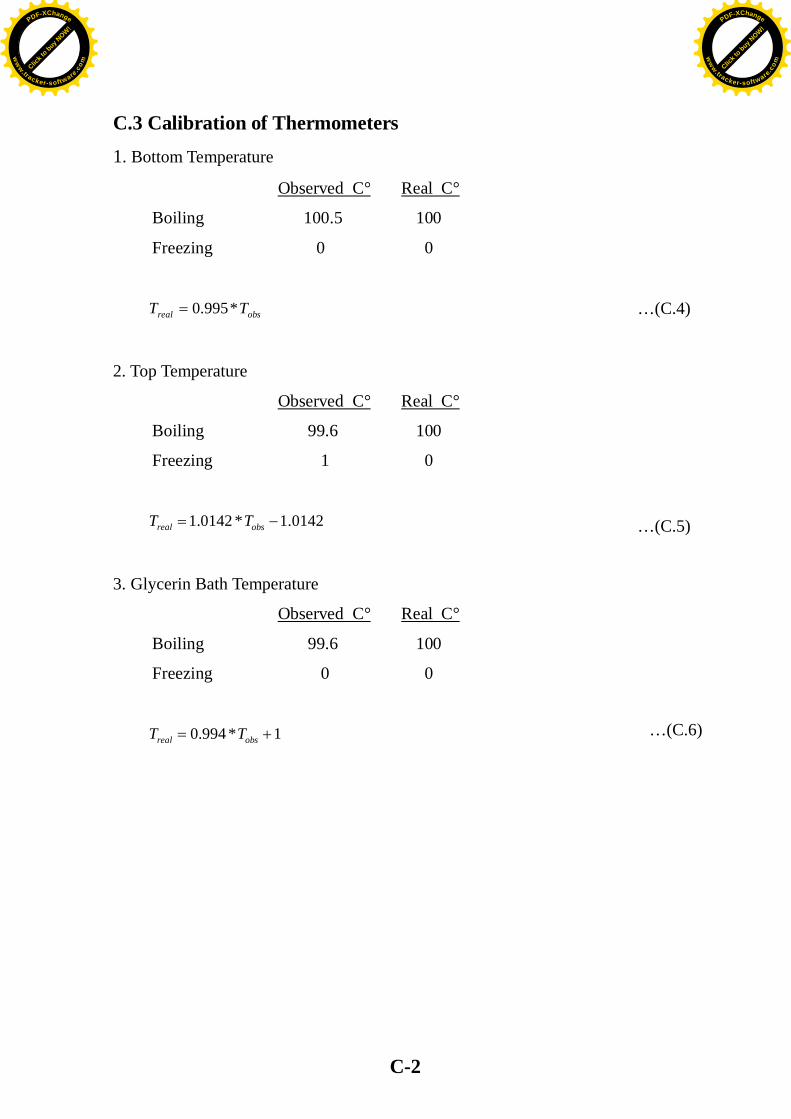
C-2
C.3 Calibration of Thermometers 1. Bottom Temperature
Observed C° Real C°
Boiling 100.5 100
Freezing 0 0
obsreal TT *995.0
2. Top Temperature
Observed C° Real C°
Boiling 99.6 100
Freezing 1 0
0142.1*0142.1 obsreal TT
3. Glycerin Bath Temperature
Observed C° Real C°
Boiling 99.6 100
Freezing 0 0
1*994.0 obsreal TT
…(C.6)
…(C.5)
…(C.4)
Click t
o buy NOW!
PDF-XChange
ww
w.tracker-software.c
om Click t
o buy NOW!
PDF-XChange
ww
w.tracker-software
.com
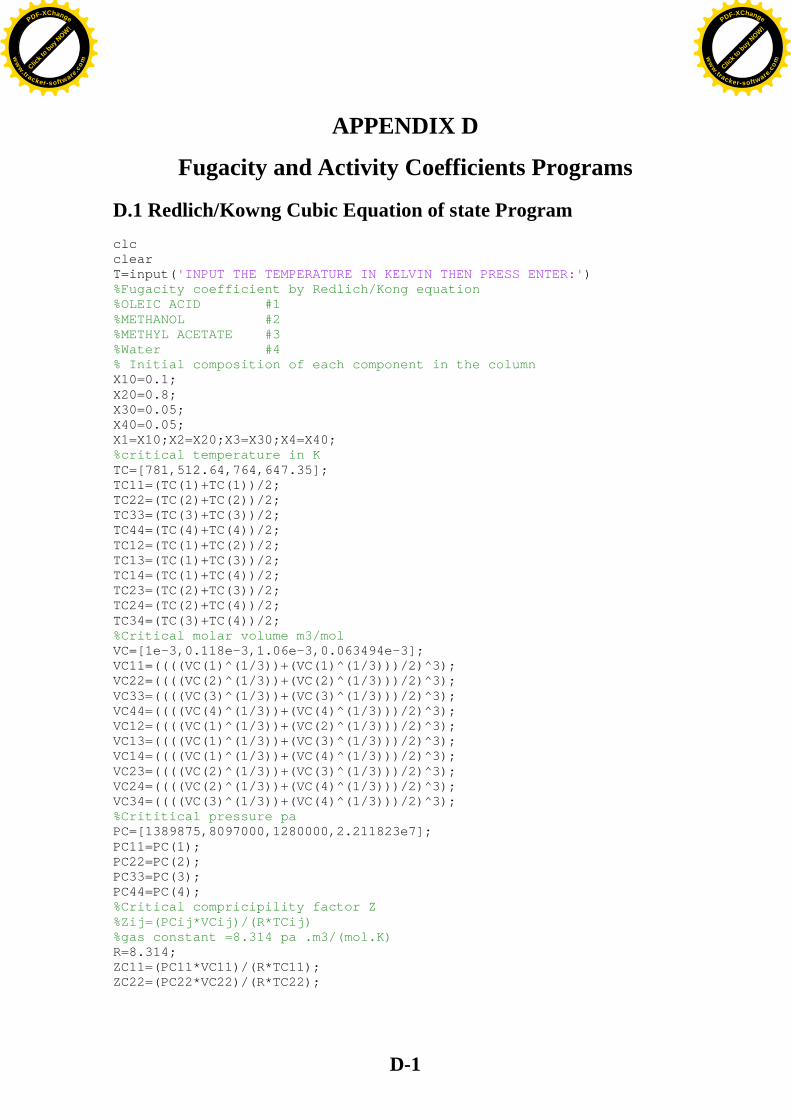
D-1
APPENDIX D
Fugacity and Activity Coefficients Programs D.1 Redlich/Kowng Cubic Equation of state Program clc clear T=input('INPUT THE TEMPERATURE IN KELVIN THEN PRESS ENTER:') %Fugacity coefficient by Redlich/Kong equation %OLEIC ACID #1 %METHANOL #2 %METHYL ACETATE #3 %Water #4 % Initial composition of each component in the column X10=0.1; X20=0.8; X30=0.05; X40=0.05; X1=X10;X2=X20;X3=X30;X4=X40; %critical temperature in K TC=[781,512.64,764,647.35]; TC11=(TC(1)+TC(1))/2; TC22=(TC(2)+TC(2))/2; TC33=(TC(3)+TC(3))/2; TC44=(TC(4)+TC(4))/2; TC12=(TC(1)+TC(2))/2; TC13=(TC(1)+TC(3))/2; TC14=(TC(1)+TC(4))/2; TC23=(TC(2)+TC(3))/2; TC24=(TC(2)+TC(4))/2; TC34=(TC(3)+TC(4))/2; %Critical molar volume m3/mol VC=[1e-3,0.118e-3,1.06e-3,0.063494e-3]; VC11=((((VC(1)^(1/3))+(VC(1)^(1/3)))/2)^3); VC22=((((VC(2)^(1/3))+(VC(2)^(1/3)))/2)^3); VC33=((((VC(3)^(1/3))+(VC(3)^(1/3)))/2)^3); VC44=((((VC(4)^(1/3))+(VC(4)^(1/3)))/2)^3); VC12=((((VC(1)^(1/3))+(VC(2)^(1/3)))/2)^3); VC13=((((VC(1)^(1/3))+(VC(3)^(1/3)))/2)^3); VC14=((((VC(1)^(1/3))+(VC(4)^(1/3)))/2)^3); VC23=((((VC(2)^(1/3))+(VC(3)^(1/3)))/2)^3); VC24=((((VC(2)^(1/3))+(VC(4)^(1/3)))/2)^3); VC34=((((VC(3)^(1/3))+(VC(4)^(1/3)))/2)^3); %Crititical pressure pa PC=[1389875,8097000,1280000,2.211823e7]; PC11=PC(1); PC22=PC(2); PC33=PC(3); PC44=PC(4); %Critical compricipility factor Z %Zij=(PCij*VCij)/(R*TCij) %gas constant =8.314 pa .m3/(mol.K) R=8.314; ZC11=(PC11*VC11)/(R*TC11); ZC22=(PC22*VC22)/(R*TC22);
Click t
o buy NOW!
PDF-XChange
ww
w.tracker-software.c
om Click t
o buy NOW!
PDF-XChange
ww
w.tracker-software
.com
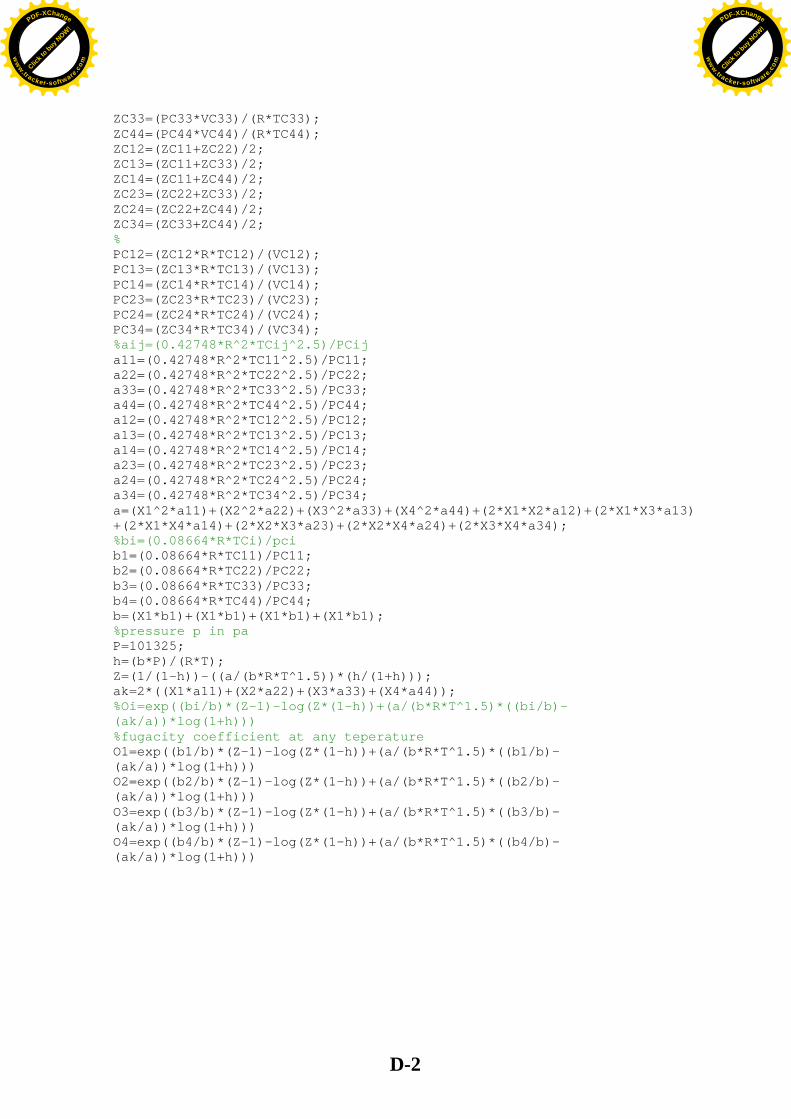
D-2
ZC33=(PC33*VC33)/(R*TC33); ZC44=(PC44*VC44)/(R*TC44); ZC12=(ZC11+ZC22)/2; ZC13=(ZC11+ZC33)/2; ZC14=(ZC11+ZC44)/2; ZC23=(ZC22+ZC33)/2; ZC24=(ZC22+ZC44)/2; ZC34=(ZC33+ZC44)/2; % PC12=(ZC12*R*TC12)/(VC12); PC13=(ZC13*R*TC13)/(VC13); PC14=(ZC14*R*TC14)/(VC14); PC23=(ZC23*R*TC23)/(VC23); PC24=(ZC24*R*TC24)/(VC24); PC34=(ZC34*R*TC34)/(VC34); %aij=(0.42748*R^2*TCij^2.5)/PCij a11=(0.42748*R^2*TC11^2.5)/PC11; a22=(0.42748*R^2*TC22^2.5)/PC22; a33=(0.42748*R^2*TC33^2.5)/PC33; a44=(0.42748*R^2*TC44^2.5)/PC44; a12=(0.42748*R^2*TC12^2.5)/PC12; a13=(0.42748*R^2*TC13^2.5)/PC13; a14=(0.42748*R^2*TC14^2.5)/PC14; a23=(0.42748*R^2*TC23^2.5)/PC23; a24=(0.42748*R^2*TC24^2.5)/PC24; a34=(0.42748*R^2*TC34^2.5)/PC34; a=(X1^2*a11)+(X2^2*a22)+(X3^2*a33)+(X4^2*a44)+(2*X1*X2*a12)+(2*X1*X3*a13)+(2*X1*X4*a14)+(2*X2*X3*a23)+(2*X2*X4*a24)+(2*X3*X4*a34); %bi=(0.08664*R*TCi)/pci b1=(0.08664*R*TC11)/PC11; b2=(0.08664*R*TC22)/PC22; b3=(0.08664*R*TC33)/PC33; b4=(0.08664*R*TC44)/PC44; b=(X1*b1)+(X1*b1)+(X1*b1)+(X1*b1); %pressure p in pa P=101325; h=(b*P)/(R*T); Z=(1/(1-h))-((a/(b*R*T^1.5))*(h/(1+h))); ak=2*((X1*a11)+(X2*a22)+(X3*a33)+(X4*a44)); %Oi=exp((bi/b)*(Z-1)-log(Z*(1-h))+(a/(b*R*T^1.5)*((bi/b)-(ak/a))*log(1+h))) %fugacity coefficient at any teperature O1=exp((b1/b)*(Z-1)-log(Z*(1-h))+(a/(b*R*T^1.5)*((b1/b)-(ak/a))*log(1+h))) O2=exp((b2/b)*(Z-1)-log(Z*(1-h))+(a/(b*R*T^1.5)*((b2/b)-(ak/a))*log(1+h))) O3=exp((b3/b)*(Z-1)-log(Z*(1-h))+(a/(b*R*T^1.5)*((b3/b)-(ak/a))*log(1+h))) O4=exp((b4/b)*(Z-1)-log(Z*(1-h))+(a/(b*R*T^1.5)*((b4/b)-(ak/a))*log(1+h)))
Click t
o buy NOW!
PDF-XChange
ww
w.tracker-software.c
om Click t
o buy NOW!
PDF-XChange
ww
w.tracker-software
.com
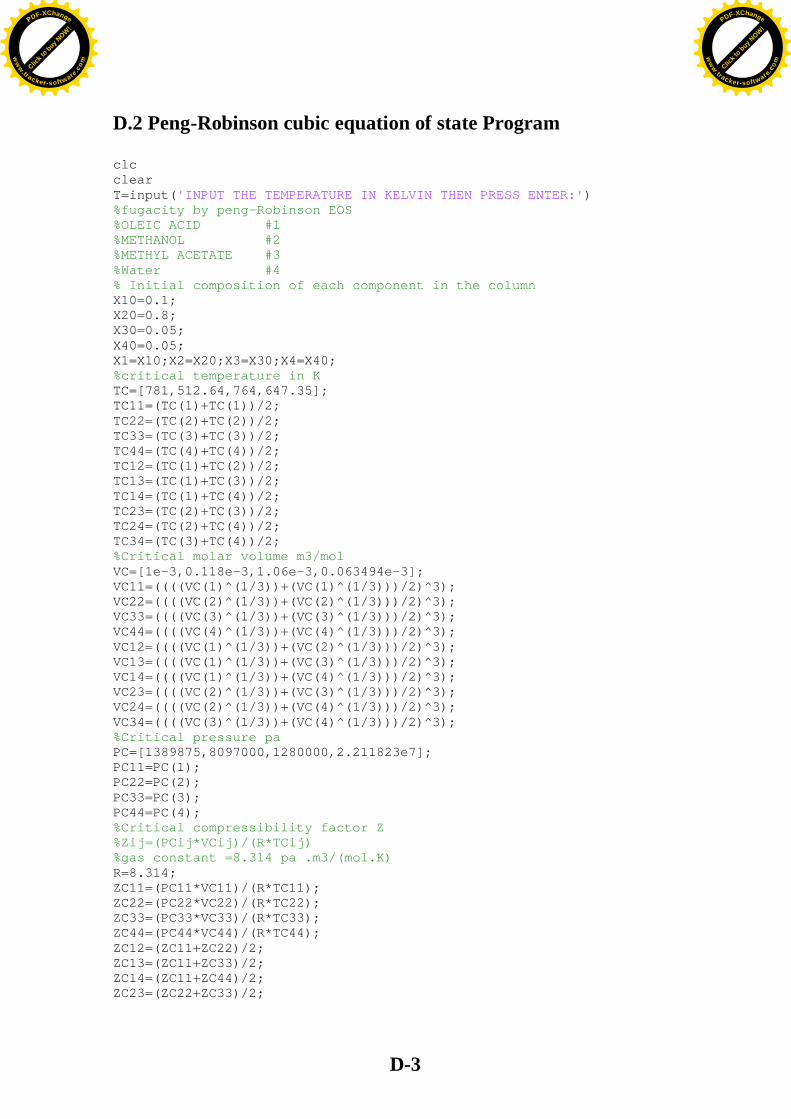
D-3
D.2 Peng-Robinson cubic equation of state Program clc clear T=input('INPUT THE TEMPERATURE IN KELVIN THEN PRESS ENTER:') %fugacity by peng-Robinson EOS %OLEIC ACID #1 %METHANOL #2 %METHYL ACETATE #3 %Water #4 % Initial composition of each component in the column X10=0.1; X20=0.8; X30=0.05; X40=0.05; X1=X10;X2=X20;X3=X30;X4=X40; %critical temperature in K TC=[781,512.64,764,647.35]; TC11=(TC(1)+TC(1))/2; TC22=(TC(2)+TC(2))/2; TC33=(TC(3)+TC(3))/2; TC44=(TC(4)+TC(4))/2; TC12=(TC(1)+TC(2))/2; TC13=(TC(1)+TC(3))/2; TC14=(TC(1)+TC(4))/2; TC23=(TC(2)+TC(3))/2; TC24=(TC(2)+TC(4))/2; TC34=(TC(3)+TC(4))/2; %Critical molar volume m3/mol VC=[1e-3,0.118e-3,1.06e-3,0.063494e-3]; VC11=((((VC(1)^(1/3))+(VC(1)^(1/3)))/2)^3); VC22=((((VC(2)^(1/3))+(VC(2)^(1/3)))/2)^3); VC33=((((VC(3)^(1/3))+(VC(3)^(1/3)))/2)^3); VC44=((((VC(4)^(1/3))+(VC(4)^(1/3)))/2)^3); VC12=((((VC(1)^(1/3))+(VC(2)^(1/3)))/2)^3); VC13=((((VC(1)^(1/3))+(VC(3)^(1/3)))/2)^3); VC14=((((VC(1)^(1/3))+(VC(4)^(1/3)))/2)^3); VC23=((((VC(2)^(1/3))+(VC(3)^(1/3)))/2)^3); VC24=((((VC(2)^(1/3))+(VC(4)^(1/3)))/2)^3); VC34=((((VC(3)^(1/3))+(VC(4)^(1/3)))/2)^3); %Critical pressure pa PC=[1389875,8097000,1280000,2.211823e7]; PC11=PC(1); PC22=PC(2); PC33=PC(3); PC44=PC(4); %Critical compressibility factor Z %Zij=(PCij*VCij)/(R*TCij) %gas constant =8.314 pa .m3/(mol.K) R=8.314; ZC11=(PC11*VC11)/(R*TC11); ZC22=(PC22*VC22)/(R*TC22); ZC33=(PC33*VC33)/(R*TC33); ZC44=(PC44*VC44)/(R*TC44); ZC12=(ZC11+ZC22)/2; ZC13=(ZC11+ZC33)/2; ZC14=(ZC11+ZC44)/2; ZC23=(ZC22+ZC33)/2;
Click t
o buy NOW!
PDF-XChange
ww
w.tracker-software.c
om Click t
o buy NOW!
PDF-XChange
ww
w.tracker-software
.com
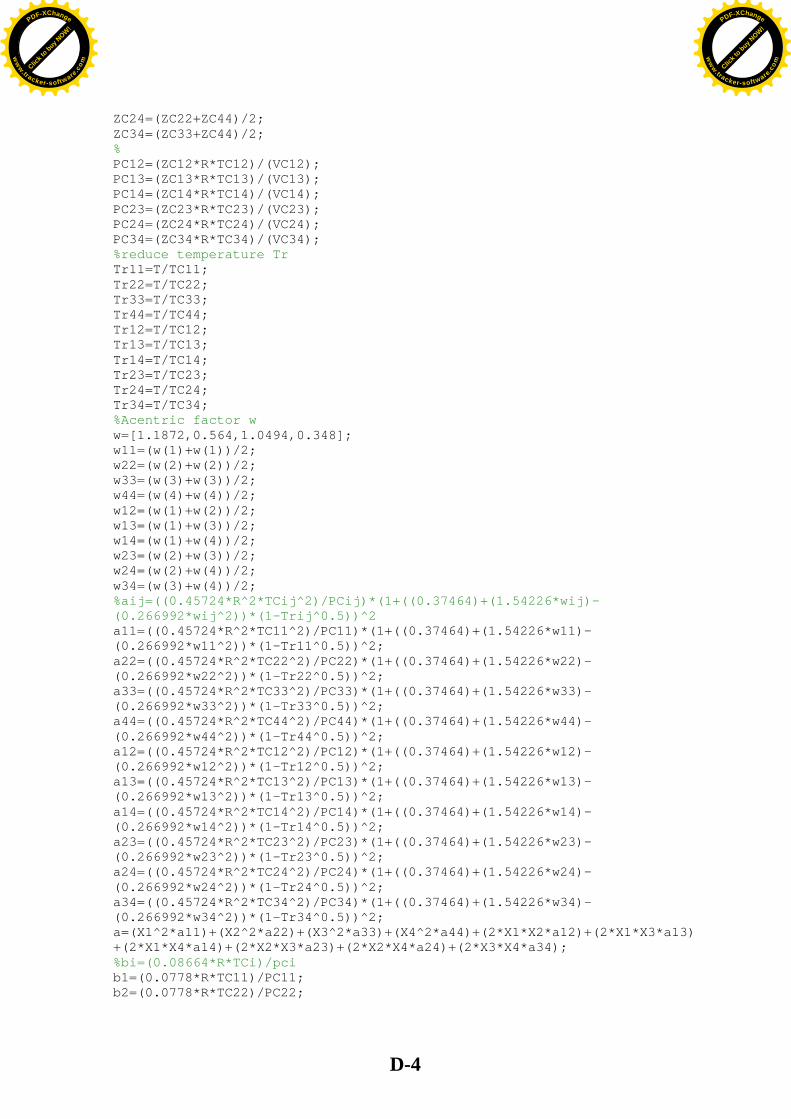
D-4
ZC24=(ZC22+ZC44)/2; ZC34=(ZC33+ZC44)/2; % PC12=(ZC12*R*TC12)/(VC12); PC13=(ZC13*R*TC13)/(VC13); PC14=(ZC14*R*TC14)/(VC14); PC23=(ZC23*R*TC23)/(VC23); PC24=(ZC24*R*TC24)/(VC24); PC34=(ZC34*R*TC34)/(VC34); %reduce temperature Tr Tr11=T/TC11; Tr22=T/TC22; Tr33=T/TC33; Tr44=T/TC44; Tr12=T/TC12; Tr13=T/TC13; Tr14=T/TC14; Tr23=T/TC23; Tr24=T/TC24; Tr34=T/TC34; %Acentric factor w w=[1.1872,0.564,1.0494,0.348]; w11=(w(1)+w(1))/2; w22=(w(2)+w(2))/2; w33=(w(3)+w(3))/2; w44=(w(4)+w(4))/2; w12=(w(1)+w(2))/2; w13=(w(1)+w(3))/2; w14=(w(1)+w(4))/2; w23=(w(2)+w(3))/2; w24=(w(2)+w(4))/2; w34=(w(3)+w(4))/2; %aij=((0.45724*R^2*TCij^2)/PCij)*(1+((0.37464)+(1.54226*wij)-(0.266992*wij^2))*(1-Trij^0.5))^2 a11=((0.45724*R^2*TC11^2)/PC11)*(1+((0.37464)+(1.54226*w11)-(0.266992*w11^2))*(1-Tr11^0.5))^2; a22=((0.45724*R^2*TC22^2)/PC22)*(1+((0.37464)+(1.54226*w22)-(0.266992*w22^2))*(1-Tr22^0.5))^2; a33=((0.45724*R^2*TC33^2)/PC33)*(1+((0.37464)+(1.54226*w33)-(0.266992*w33^2))*(1-Tr33^0.5))^2; a44=((0.45724*R^2*TC44^2)/PC44)*(1+((0.37464)+(1.54226*w44)-(0.266992*w44^2))*(1-Tr44^0.5))^2; a12=((0.45724*R^2*TC12^2)/PC12)*(1+((0.37464)+(1.54226*w12)-(0.266992*w12^2))*(1-Tr12^0.5))^2; a13=((0.45724*R^2*TC13^2)/PC13)*(1+((0.37464)+(1.54226*w13)-(0.266992*w13^2))*(1-Tr13^0.5))^2; a14=((0.45724*R^2*TC14^2)/PC14)*(1+((0.37464)+(1.54226*w14)-(0.266992*w14^2))*(1-Tr14^0.5))^2; a23=((0.45724*R^2*TC23^2)/PC23)*(1+((0.37464)+(1.54226*w23)-(0.266992*w23^2))*(1-Tr23^0.5))^2; a24=((0.45724*R^2*TC24^2)/PC24)*(1+((0.37464)+(1.54226*w24)-(0.266992*w24^2))*(1-Tr24^0.5))^2; a34=((0.45724*R^2*TC34^2)/PC34)*(1+((0.37464)+(1.54226*w34)-(0.266992*w34^2))*(1-Tr34^0.5))^2; a=(X1^2*a11)+(X2^2*a22)+(X3^2*a33)+(X4^2*a44)+(2*X1*X2*a12)+(2*X1*X3*a13)+(2*X1*X4*a14)+(2*X2*X3*a23)+(2*X2*X4*a24)+(2*X3*X4*a34); %bi=(0.08664*R*TCi)/pci b1=(0.0778*R*TC11)/PC11; b2=(0.0778*R*TC22)/PC22;
Click t
o buy NOW!
PDF-XChange
ww
w.tracker-software.c
om Click t
o buy NOW!
PDF-XChange
ww
w.tracker-software
.com

D-5
b3=(0.0778*R*TC33)/PC33; b4=(0.0778*R*TC44)/PC44; b=(X1*b1)+(X1*b1)+(X1*b1)+(X1*b1); %pressure p in pa P=101325; h=(b*P)/(R*T); Z=(1/(1-h))-((a/(b*R*T^1.5))*(h/(1+h))); ak=2*((X1*a11)+(X2*a22)+(X3*a33)+(X4*a44)); %Oi=exp((bi/b)*(Z-1)-log(Z*(1-h))+(a/(b*R*T^1.5)*((bi/b)-(ak/a))*log(1+h))) %fugacity coefficient at any temperature O1=exp((b1/b)*(Z-1)-log(Z*(1-h))+(a/(b*R*T^1.5)*((b1/b)-(ak/a))*log(1+h))) O2=exp((b2/b)*(Z-1)-log(Z*(1-h))+(a/(b*R*T^1.5)*((b2/b)-(ak/a))*log(1+h))) O3=exp((b3/b)*(Z-1)-log(Z*(1-h))+(a/(b*R*T^1.5)*((b3/b)-(ak/a))*log(1+h))) O4=exp((b4/b)*(Z-1)-log(Z*(1-h))+(a/(b*R*T^1.5)*((b4/b)-(ak/a))*log(1+h)))
D.3 NRTL Activity Coefficient Program clear all clc % input temperature in kelvin T=input('Temperature(K):') %oleic acid #1 OLAC %methanol #2 MEOH %methyl oleate #3 MEOL %Water #4 H20 % Initial composition of each component in the column X10=0.1; X20=0.8; X30=0.05; X40=0.05; X1=X10;X2=X20;X3=X30;X4=X40; %NRTL parameters for the binary pairs of the components in reactive %mixtures (required 6 molecular binary pairs): % OLAC-MEOL H2O-MEOH OLAC-MEOL H2O-OLAC MEOH-MEOL H2O-MEOL B12=199.884;B21=479.688; B24=-24.4933;B42=307.166; B13=-37.63835;B31=36.76161; B14=-44.8289;B41=2497.61; B23=1388.564;B32=-240.4565; B34=106.4762;B43=2499.963; c12=1.1431; c24=0.3001; c13=0.2907206;c14=0.2250879; c23=0.399494;c34=0.200312; R=1.987; t12=(B12)/(R*T);t21=(B21)/(R*T);
Click t
o buy NOW!
PDF-XChange
ww
w.tracker-software.c
om Click t
o buy NOW!
PDF-XChange
ww
w.tracker-software
.com
D-6
t24=(B24)/(R*T);t42=(B42)/(R*T); t13=(B13)/(R*T);t31=(B31)/(R*T); t14=(B14)/(R*T);t41=(B41)/(R*T); t23=(B23)/(R*T);t32=(B32)/(R*T); t34=(B34)/(R*T);t43=(B43)/(R*T); t11=0;t22=0;t33=0;t44=0; G12=exp(-c12*t12);G21=exp(-c12*t21); G24=exp(-c24*t24);G42=exp(-c24*t42); G13=exp(-c13*t13);G31=exp(-c13*t31); G14=exp(-c14*t14);G41=exp(-c14*t41); G23=exp(-c23*t23);G32=exp(-c23*t32); G34=exp(-c34*t34);G43=exp(-c34*t43); G11=1;G22=1;G33=1;G44=1; % Activity coefficient for each component in mixture by NRTL O1=exp((((t11*G11*X1)+(t21*G21*X2)+(t31*G31*X3)+(t41*G41*X4))/((G11*X1)+(G21*X2)+(G31*X3)+(G41*X4)))+(((G11*X1)/(X1+(G12*X2)+(G13*X3)+(G14*X4)))*(t11-(((X2*t21*G21)+(X3*t31*G31)+(X4*t41*G41))/(X1+(X2*G21)+(X3*G31)+(X4*G41)))))+(((G12*X2)/(X2+(G12*X1)+(G23*X3)+(G42*X4)))*(t12-(((X1*t12*G12)+(X3*t32*G32)+(X4*t42*G42))/(X2+(X1*G12)+(X3*G32)+(X4*G42)))))+(((G13*X3)/(X3+(G23*X2)+(G13*X3)+(G43*X4)))*(t13-(((X1*t13*G13)+(X2*t23*G23)+(X4*t43*G43))/(X3+(X1*G13)+(X2*G23)+(X4*G43)))))+(((G14*X4)/(X4+(G14*X1)+(G34*X3)+(G24*X2)))*(t14-(((X1*t14*G14)+(X2*t24*G24)+(X3*t34*G34))/(X4+(X1*G14)+(X2*G24)+(X3*G34)))))) O2=exp((((t12*G12*X1)+(t22*G22*X2)+(t32*G32*X3)+(t42*G42*X4))/((G12*X1)+(G22*X2)+(G32*X3)+(G42*X4)))+(((G11*X1)/(X1+(G12*X2)+(G13*X3)+(G14*X4)))*(t11-(((X2*t21*G21)+(X3*t31*G31)+(X4*t41*G41))/(X1+(X2*G21)+(X3*G31)+(X4*G41)))))+(((G22*X2)/(X2+(G12*X1)+(G23*X3)+(G42*X4)))*(t22-(((X1*t12*G12)+(X3*t32*G32)+(X4*t42*G42))/(X2+(X1*G12)+(X3*G32)+(X4*G42)))))+(((G23*X3)/(X3+(G23*X2)+(G13*X3)+(G43*X4)))*(t23-(((X1*t13*G13)+(X2*t23*G23)+(X4*t43*G43))/(X3+(X1*G13)+(X2*G23)+(X4*G43)))))+(((G24*X4)/(X4+(G14*X1)+(G34*X3)+(G24*X2)))*(t24-(((X1*t14*G14)+(X2*t24*G24)+(X3*t34*G34))/(X4+(X1*G14)+(X2*G24)+(X3*G34)))))) O3=exp((((t13*G13*X1)+(t23*G23*X2)+(t33*G33*X3)+(t43*G43*X4))/((G13*X1)+(G23*X2)+(G33*X3)+(G43*X4)))+(((G31*X1)/(X1+(G12*X2)+(G13*X3)+(G14*X4)))*(t11-(((X2*t21*G21)+(X3*t31*G31)+(X4*t41*G41))/(X1+(X2*G21)+(X3*G31)+(X4*G41)))))+(((G32*X2)/(X2+(G12*X1)+(G23*X3)+(G42*X4)))*(t32-(((X1*t12*G12)+(X3*t32*G32)+(X4*t42*G42))/(X2+(X1*G12)+(X3*G32)+(X4*G42)))))+(((G33*X3)/(X3+(G23*X2)+(G13*X3)+(G43*X4)))*(t33-(((X1*t13*G13)+(X2*t23*G23)+(X4*t43*G43))/(X3+(X1*G13)+(X2*G23)+(X4*G43)))))+(((G34*X4)/(X4+(G14*X1)+(G34*X3)+(G24*X2)))*(t34-(((X1*t14*G14)+(X2*t24*G24)+(X3*t34*G34))/(X4+(X1*G14)+(X2*G24)+(X3*G34)))))) O4=exp((((t14*G14*X1)+(t24*G24*X2)+(t34*G34*X3)+(t44*G44*X4))/((G14*X1)+(G24*X2)+(G34*X3)+(G44*X4)))+(((G41*X1)/(X1+(G12*X2)+(G13*X3)+(G14*X4)))*(t41-(((X2*t21*G21)+(X3*t31*G31)+(X4*t41*G41))/(X1+(X2*G21)+(X3*G31)+(X4*G41)))))+(((G42*X2)/(X2+(G12*X1)+(G23*X3)+(G42*X4)))*(t42-(((X1*t12*G12)+(X3*t32*G32)+(X4*t42*G42))/(X2+(X1*G12)+(X3*G32)+(X4*G42))
Click t
o buy NOW!
PDF-XChange
ww
w.tracker-software.c
om Click t
o buy NOW!
PDF-XChange
ww
w.tracker-software
.com
D-7
)))+(((G43*X3)/(X3+(G23*X2)+(G13*X3)+(G43*X4)))*(t43-(((X1*t13*G13)+(X2*t23*G23)+(X4*t43*G43))/(X3+(X1*G13)+(X2*G23)+(X4*G43)))))+(((G44*X4)/(X4+(G14*X1)+(G34*X3)+(G24*X2)))*(t44-(((X1*t14*G14)+(X2*t24*G24)+(X3*t34*G34))/(X4+(X1*G14)+(X2*G24)+(X3*G34))))))
D.4 UNIQUAC Activity Coefficient Program clear all clc % input temperature in kelvin T=input('Temperature(K):') %oleic acid #1 %methanol #2 %methyl oleate #3 %Water #4 % Initial composition of each component in the column X10=0.1; X20=0.8; X30=0.05; X40=0.05; X1=X10;X2=X20;X3=X30;X4=X40; %%% 1: COMBINATORIAL TERM r=[12.7607,1.4311,13.7405,0.92]; q=[10.499,1.432,11.323,1.4]; J1=(r(1)*X1)/(r(1)*X1+r(2)*X2+r(3)*X3+r(4)*X4); J2=(r(2)*X2)/(r(1)*X1+r(2)*X2+r(3)*X3+r(4)*X4); J3=(r(3)*X3)/(r(1)*X1+r(2)*X2+r(3)*X3+r(4)*X4); J4=(r(4)*X4)/(r(1)*X1+r(2)*X2+r(3)*X3+r(4)*X4); L1=(q(1)*X1)/(q(1)*X1+q(2)*X2+q(3)*X3+q(4)*X4); L2=(q(2)*X2)/(q(1)*X1+q(2)*X2+q(3)*X3+q(4)*X4); L3=(q(3)*X3)/(q(1)*X1+q(2)*X2+q(3)*X3+q(4)*X4); L4=(q(4)*X4)/(q(1)*X1+q(2)*X2+q(3)*X3+q(4)*X4); l1=5*(r(1)-q(1))-(r(1)-1); l2=5*(r(2)-q(2))-(r(2)-1); l3=5*(r(3)-q(3))-(r(3)-1); l4=5*(r(4)-q(4))-(r(4)-1); SUMl=(X1*l1)+(X2*l2)+(X3*l3)+(X4*l4); % uic=ln Oc u1c=log(J1/X1)+(5*q(1)*log(L1/J1))+l1-((J1/X1)*SUMl); u2c=log(J2/X2)+(5*q(2)*log(L2/J2))+l2-((J2/X2)*SUMl); u3c=log(J3/X3)+(5*q(3)*log(L3/J3))+l3-((J3/X3)*SUMl); u4c=log(J4/X4)+(5*q(4)*log(L4/J4))+l4-((J4/X4)*SUMl); %%% 2:RESIDUAL TERM % unit of gas constant R= cal/(mol.K) R=1.987; %%%%%UNIQUAC PARAMETERS uij= cal/mol %parameters for the interactions parameters of UNIQAC t11=1;t12=exp((-952.028)/(R*T));t13=exp((-154.7875)/(R*T));t14=exp((-1123.794)/(R*T)); t21=exp((149.181)/(R*T));t22=1;t23=exp((54.20368)/(R*T));t24=exp((-95.259)/(R*T)); t31=exp((133.418)/(R*T));t32=exp((-1205.077)/(R*T));t33=1;t34=exp((-1573.999)/(R*T));
Click t
o buy NOW!
PDF-XChange
ww
w.tracker-software.c
om Click t
o buy NOW!
PDF-XChange
ww
w.tracker-software
.com
D-8
t41=exp((-403.7021)/(R*T));t42=exp((10.377)/(R*T));t43=exp((-481.5153)/(R*T));t44=1; %%%%% U1R=(q(1)*(1-log(L1*t11+L2*t21+L3*t31+L4*t41)-((L1*t11/(L1+L2*t21+L3*t31+L4*t41))+(L2*t12/(L1*t12+L2+L3*t32+L4*t42))+(L3*t13/(L1*t13+L2*t23+L3+L4*t43))+(L4*t14/(L1*t14+L2*t24+L3*t34+L4))))); U2R=(q(2)*(1-log(L1*t12+L2*t22+L3*t32+L4*t42)-((L1*t21/(L1+L2*t21+L3*t31+L4*t41))+(L2*t22/(L1*t12+L2+L3*t32+L4*t42))+(L3*t23/(L1*t13+L2*t23+L3+L4*t43))+(L4*t24/(L1*t14+L2*t24+L3*t34+L4))))); U3R=(q(3)*(1-log(L1*t13+L2*t23+L3*t33+L4*t43)-((L1*t31/(L1+L2*t21+L3*t31+L4*t41))+(L2*t32/(L1*t12+L2+L3*t32+L4*t42))+(L3*t33/(L1*t13+L2*t23+L3+L4*t43))+(L4*t34/(L1*t14+L2*t24+L3*t34+L4))))); U4R=(q(4)*(1-log(L1*t14+L2*t24+L3*t34+L4*t44)-((L1*t41/(L1+L2*t21+L3*t31+L4*t41))+(L2*t42/(L1*t12+L2+L3*t32+L4*t42))+(L3*t43/(L1*t13+L2*t23+L3+L4*t43))+(L4*t44/(L1*t14+L2*t24+L3*t34+L4))))); %%%%% O1=exp(u1c+U1R) O2=exp(u2c+U2R) O3=exp(u3c+U3R) O4=exp(u4c+U4R)
D.5 UNIFAC Activity Coefficient Program clc clear T=input('INPUT THE TEMPERATURE IN KELVIN THEN PRESS ENTER:') %OLEIC ACID #1 %METHANOL #2 %METHYL ACETATE #3 %Water #4 % Initial composition of each component in the column X10=0.1; X20=0.8; X30=0.05; X40=0.05; X1=X10;X2=X20;X3=X30;X4=X40; %%% 1: COMBINATORIAL TERM r=[12.7607,1.4311,13.7405,.92]; q=[10.499,1.432,11.323,1.4]; J1=r(1)/(r(1)*X1+r(2)*X2+r(3)*X3+r(4)*X4); J2=r(2)/(r(1)*X1+r(2)*X2+r(3)*X3+r(4)*X4); J3=r(3)/(r(1)*X1+r(2)*X2+r(3)*X3+r(4)*X4); J4=r(4)/(r(1)*X1+r(2)*X2+r(3)*X3+r(4)*X4); L1=q(1)/(q(1)*X1+q(2)*X2+q(3)*X3+q(4)*X4); L2=q(2)/(q(1)*X1+q(2)*X2+q(3)*X3+q(4)*X4); L3=q(3)/(q(1)*X1+q(2)*X2+q(3)*X3+q(4)*X4); L4=q(4)/(q(1)*X1+q(2)*X2+q(3)*X3+q(4)*X4); % uic=ln Oc u1c=1-J1+log(J1)-5*q(1)*(1-(J1/L1)+log(J1/L1)); u2c=1-J2+log(J2)-5*q(2)*(1-(J2/L2)+log(J2/L2)); u3c=1-J3+log(J3)-5*q(3)*(1-(J3/L3)+log(J3/L3)); u4c=1-J4+log(J4)-5*q(4)*(1-(J4/L4)+log(J4/L4));
Click t
o buy NOW!
PDF-XChange
ww
w.tracker-software.c
om Click t
o buy NOW!
PDF-XChange
ww
w.tracker-software
.com
D-9
%%% 2:RESIDUAL TERM %%%% eki e11=.08104750072;e21=.72225461149;e31=.08286342349;e41=0;e51=0;e61=0;e71=0.1135429609; e12=0;e22=0;e32=0;e42=1;e52=0;e62=0;e72=0; e13=0.07706989003;e23=.6870853404;e33=.07879669181;e43=0;e53=0;e63=0.1570480778;e73=0; e14=0;e24=0;e34=0;e44=0;e54=1;e64=0;e74=0; %% t=exp(-amk/T) t11=1;t12=1;t13=exp(-86.02/T);t14=exp(-697.2/T);t15=exp(-1318/T);t16=exp(-232.1/T);t17=exp(-741.4/T); t21=1;t22=1;t23=exp(-86.02/T);t24=exp(-697.2/T);t25=exp(-1318/T);t26=exp(-232.1/T);t27=exp(-741.4/T); t31=exp(35.36/T);t32=exp(35.36/T);t33=1;t34=exp(-787.6/T);t35=exp(-270.6/T);t36=exp(-37.85/T);t37=exp(-449.1/T); t41=exp(-16.51/T);t42=exp(-16.51/T);t43=exp(-12.52/T);t44=1;t45=exp(181/T);t46=exp(10.72/T);t47=exp(-193.4/T); t51=exp(-300/T);t52=exp(-300/T);t53=exp(-496.1/T);t54=exp(-289.6/T);t55=1;t56=exp(-72.87/T);t57=1; t61=exp(-114.8/T);t62=exp(-114.8/T);t63=exp(-132.1/T);t64=exp(-249.6/T);t65=exp(-200.8/T);t66=1;t67=exp(-372.9/T); t71=exp(-90.49/T);t72=exp(-90.49/T);t73=exp(62.55/T);t74=exp(-155.7/T);t75=1;t76=exp(261.1/T);t77=1; %B ik B11=e11*t11+e21*t21+e31*t31+e41*t41+e51*t51+e61*t61+e71*t71; B21=e12*t11+e22*t21+e32*t31+e42*t41+e52*t51+e62*t61+e72*t71; B31=e13*t11+e23*t21+e33*t31+e43*t41+e53*t51+e63*t61+e73*t71; B41=e14*t11+e24*t21+e34*t31+e44*t41+e54*t51+e64*t61+e74*t71; B12=e11*t12+e21*t22+e31*t32+e41*t42+e51*t52+e61*t62+e71*t72; B22=e12*t12+e22*t22+e32*t32+e42*t42+e52*t52+e62*t62+e72*t72; B32=e13*t12+e23*t22+e33*t32+e43*t42+e53*t52+e63*t62+e73*t72; B42=e14*t12+e24*t22+e34*t32+e44*t42+e54*t52+e64*t62+e74*t72; B13=e11*t13+e21*t23+e31*t33+e41*t43+e51*t53+e61*t63+e71*t73; B23=e12*t13+e22*t23+e32*t33+e42*t43+e52*t53+e62*t63+e72*t73; B33=e13*t13+e23*t23+e33*t33+e43*t43+e53*t53+e63*t63+e73*t73; B43=e14*t13+e24*t23+e34*t33+e44*t43+e54*t53+e64*t63+e74*t73; B14=e11*t14+e21*t24+e31*t34+e41*t44+e51*t54+e61*t64+e71*t74; B24=e12*t14+e22*t24+e32*t34+e42*t44+e52*t54+e62*t64+e72*t74; B34=e13*t14+e23*t24+e33*t34+e43*t44+e53*t54+e63*t64+e73*t74; B44=e14*t14+e24*t24+e34*t34+e44*t44+e54*t54+e64*t64+e74*t74; B15=e11*t15+e21*t25+e31*t35+e41*t45+e51*t55+e61*t65+e71*t75; B25=e12*t15+e22*t25+e32*t35+e42*t45+e52*t55+e62*t65+e72*t75; B35=e13*t15+e23*t25+e33*t35+e43*t45+e53*t55+e63*t65+e73*t75; B45=e14*t15+e24*t25+e34*t35+e44*t45+e54*t55+e64*t65+e74*t75; B16=e11*t16+e21*t26+e31*t36+e41*t46+e51*t56+e61*t66+e71*t76; B26=e12*t16+e22*t26+e32*t36+e42*t46+e52*t56+e62*t66+e72*t76; B36=e13*t16+e23*t26+e33*t36+e43*t46+e53*t56+e63*t66+e73*t76; B46=e14*t16+e24*t26+e34*t36+e44*t46+e54*t56+e64*t66+e74*t76; B17=e11*t17+e21*t27+e31*t37+e41*t47+e51*t57+e61*t67+e71*t77; B27=e12*t17+e22*t27+e32*t37+e42*t47+e52*t57+e62*t67+e72*t77; B37=e13*t17+e23*t27+e33*t37+e43*t47+e53*t57+e63*t67+e73*t77; B47=e14*t17+e24*t27+e34*t37+e44*t47+e54*t57+e64*t67+e74*t77; % Q= fi
Click t
o buy NOW!
PDF-XChange
ww
w.tracker-software.c
om Click t
o buy NOW!
PDF-XChange
ww
w.tracker-software
.com

D-10
% k=1 Q1=((X1*q(1)*e11)+(X2*q(2)*e12)+(X3*q(3)*e13)+(X4*q(4)*e14))/(q(1)*X1+q(2)*X2+q(3)*X3+q(4)*X4); % k=2 Q2=((X1*q(1)*e21)+(X2*q(2)*e22)+(X3*q(3)*e23)+(X4*q(4)*e24))/(q(1)*X1+q(2)*X2+q(3)*X3+q(4)*X4); % k=3 Q3=((X1*q(1)*e31)+(X2*q(2)*e32)+(X3*q(3)*e33)+(X4*q(4)*e34))/(q(1)*X1+q(2)*X2+q(3)*X3+q(4)*X4); % k=4 Q4=((X1*q(1)*e41)+(X2*q(2)*e42)+(X3*q(3)*e43)+(X4*q(4)*e44))/(q(1)*X1+q(2)*X2+q(3)*X3+q(4)*X4); % k=5 Q5=((X1*q(1)*e51)+(X2*q(2)*e52)+(X3*q(3)*e53)+(X4*q(4)*e54))/(q(1)*X1+q(2)*X2+q(3)*X3+q(4)*X4); % k=6 Q6=((X1*q(1)*e61)+(X2*q(2)*e62)+(X3*q(3)*e63)+(X4*q(4)*e64))/(q(1)*X1+q(2)*X2+q(3)*X3+q(4)*X4); % k=7 Q7=((X1*q(1)*e71)+(X2*q(2)*e72)+(X3*q(3)*e73)+(X4*q(4)*e74))/(q(1)*X1+q(2)*X2+q(3)*X3+q(4)*X4); % s s1=Q1*t11+Q2*t21+Q3*t31+Q4*t41+Q5*t51+Q6*t61+Q7*t71; s2=Q1*t12+Q2*t22+Q3*t32+Q4*t42+Q5*t52+Q6*t62+Q7*t71; s3=Q1*t13+Q2*t23+Q3*t33+Q4*t43+Q5*t53+Q6*t63+Q7*t71; s4=Q1*t14+Q2*t24+Q3*t34+Q4*t44+Q5*t54+Q6*t64+Q7*t71; s5=Q1*t15+Q2*t25+Q3*t35+Q4*t45+Q5*t55+Q6*t65+Q7*t71; s6=Q1*t16+Q2*t26+Q3*t36+Q4*t46+Q5*t56+Q6*t66+Q7*t71; s7=Q1*t17+Q2*t27+Q3*t37+Q4*t47+Q5*t57+Q6*t67+Q7*t71; %UiR U1R=q(1)*(1-(((Q1*B11/s1)-(e11*log(B11/s1))+((Q2*B12/s2)-(e21*log(B12/s2)))+((Q3*B13/s3)-(e31*log(B13/s3)))+((Q4*B14/s4)-(e41*log(B14/s4)))+((Q5*B15/s5)-(e51*log(B15/s5)))+((Q6*B16/s6)-(e61*log(B16/s6)))+((Q7*B17/s7)-(e71*log(B17/s7)))))); U2R=q(2)*(1-(((Q1*B21/s1)-e12*log(B21/s1)+((Q2*B22/s2)-e22*log(B22/s2))+((Q3*B23/s3)-e32*log(B23/s3))+((Q4*B24/s4)-e42*log(B24/s4))+((Q5*B25/s5)-e52*log(B25/s5))+((Q6*B26/s6)-e62*log(B26/s6))+((Q6*B27/s7)-e72*log(B27/s7))))); U3R=q(3)*(1-(((Q1*B31/s1)-e13*log(B31/s1))+((Q2*B32/s2)-e23*log(B32/s2)+((Q3*B33/s3)-e33*log(B33/s3))+((Q4*B34/s4)-e43*log(B34/s4))+((Q5*B35/s5)-e53*log(B35/s5))+((Q6*B36/s6)-e63*log(B36/s6))+((Q7*B37/s7)-e73*log(B37/s7))))); U4R=q(4)*(1-(((Q1*B41/s1)-e14*log(B41/s1))+((Q2*B42/s2)-e24*log(B42/s2)+((Q3*B43/s3)-e34*log(B43/s3))+((Q4*B44/s4)-e44*log(B44/s4))+((Q5*B45/s5)-e54*log(B45/s5))+((Q6*B46/s6)-e64*log(B46/s6))+((Q7*B47/s7)-e74*log(B47/s7))))); O1=exp(u1c+U1R) O2=exp(u2c+U2R) O3=exp(u3c+U3R) O4=exp(u4c+U4R)
Click t
o buy NOW!
PDF-XChange
ww
w.tracker-software.c
om Click t
o buy NOW!
PDF-XChange
ww
w.tracker-software
.com

E-1
Appendix E
Results of Activity Coefficient models
E.1 Results of Activity Coefficient models
Table E.1 Comparison of Methods of Activity Coefficient
1. For temperature=100 Co , 05.0,05.0,8.0,1.02OHMEOLMEOHOLAC xxxx .
Activity coefficient OLAC MEOH MEOL OH 2
NRTL method 1.6874 0.9501 2.4148 1.7067 UNIQUAC method 1.5313 1.0483 5.5964 3.3574 UNIFAC method 3.0657 1.1208 3.7704 2.7899
2. For temperature=120 Co , 05.0,05.0,8.0,1.02OHMEOLMEOHOLAC xxxx
Activity coefficient OLAC MEOH MEOL OH 2
NRTL method 1.6600 0.9523 2.3536 1.6681 UNIQUAC method 1.4151 1.046 4.9777 3.2681 UNIFAC method 2.8186 1.1166 3.4140 2.796
3. For temperature=130 Co , 05.0,05.0,8.0,1.02OHMEOLMEOHOLAC xxxx
Activity coefficient OLAC MEOH MEOL OH 2
NRTL method 1.6468 0.9533 2.3240 1.6503 UNIQUAC method 1.3629 1.0446 4.7052 3.2681 UNIFAC method 2.7070 1.1145 3.2539 2.7973
3. For temperature=140 Co , 05.0,05.0,8.0,1.02OHMEOLMEOHOLAC xxxx
Activity coefficient OLAC MEOH MEOL OH 2
NRTL method 1.6340 0.9544 2.2952 1.6334 UNIQUAC method 1.3141 1.0432 4.4544 3.1858 UNIFAC method 2.6026 1.1123 3.1047 2.7975
Click t
o buy NOW!
PDF-XChange
ww
w.tracker-software.c
om Click t
o buy NOW!
PDF-XChange
ww
w.tracker-software
.com
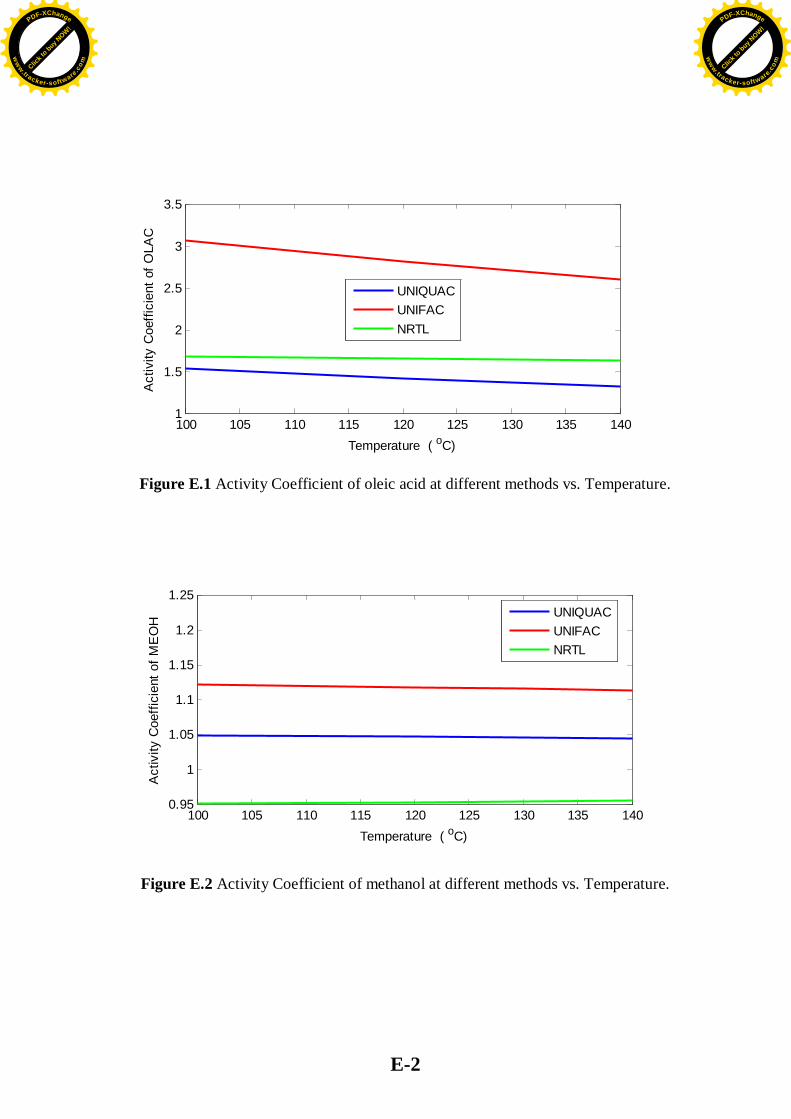
E-2
100 105 110 115 120 125 130 135 1401
1.5
2
2.5
3
3.5
Temperature ( oC)
Act
ivity
Coe
ffici
ent o
f OLA
C
UNIQUACUNIFACNRTL
Figure E.1 Activity Coefficient of oleic acid at different methods vs. Temperature.
100 105 110 115 120 125 130 135 1400.95
1
1.05
1.1
1.15
1.2
1.25
Temperature ( oC)
Act
ivity
Coe
ffici
ent o
f ME
OH
UNIQUACUNIFACNRTL
Figure E.2 Activity Coefficient of methanol at different methods vs. Temperature.
Click t
o buy NOW!
PDF-XChange
ww
w.tracker-software.c
om Click t
o buy NOW!
PDF-XChange
ww
w.tracker-software
.com
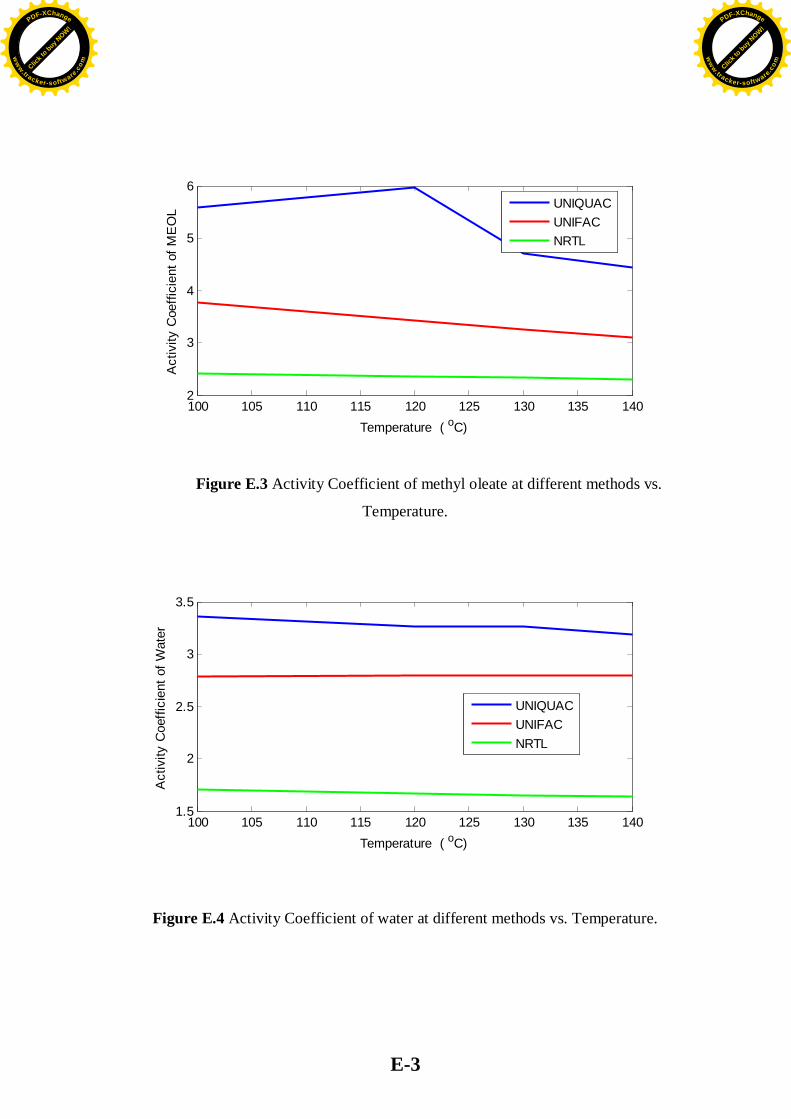
E-3
100 105 110 115 120 125 130 135 1402
3
4
5
6
Temperature ( oC)
Act
ivity
Coe
ffici
ent o
f ME
OL
UNIQUACUNIFACNRTL
Figure E.3 Activity Coefficient of methyl oleate at different methods vs.
Temperature.
100 105 110 115 120 125 130 135 1401.5
2
2.5
3
3.5
Temperature ( oC)
Act
ivity
Coe
ffici
ent o
f Wat
er
UNIQUACUNIFACNRTL
Figure E.4 Activity Coefficient of water at different methods vs. Temperature.
Click t
o buy NOW!
PDF-XChange
ww
w.tracker-software.c
om Click t
o buy NOW!
PDF-XChange
ww
w.tracker-software
.com
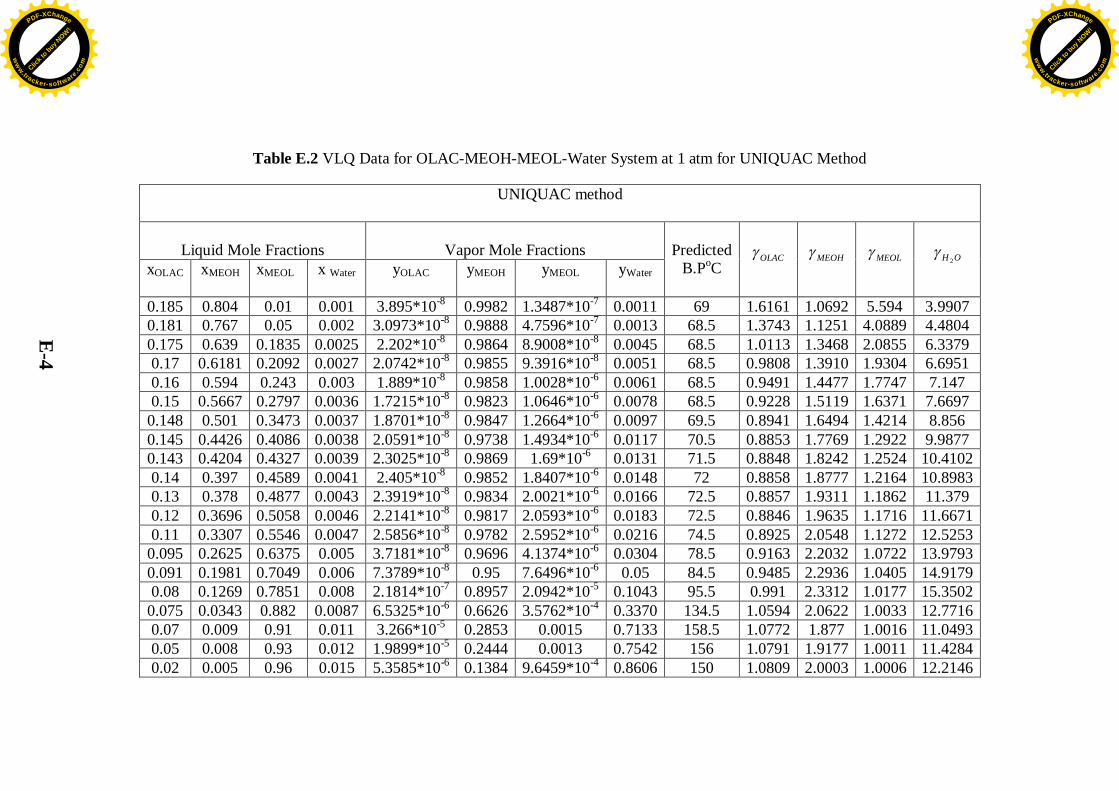
E-4
Table E.2 VLQ Data for OLAC-MEOH-MEOL-Water System at 1 atm for UNIQUAC Method
UNIQUAC method
Liquid Mole Fractions
Vapor Mole Fractions
xOLAC
xMEOH
xMEOL x Water
yOLAC
yMEOH
yMEOL
yWater
Predicted
B.PoC
OLAC
MEOH
MEOL
OH 2
0.185 0.804 0.01 0.001 3.895*10-8 0.9982 1.3487*10-7 0.0011 69 1.6161 1.0692 5.594 3.9907 0.181 0.767 0.05 0.002 3.0973*10-8 0.9888 4.7596*10-7 0.0013 68.5 1.3743 1.1251 4.0889 4.4804 0.175 0.639 0.1835 0.0025 2.202*10-8 0.9864 8.9008*10-8 0.0045 68.5 1.0113 1.3468 2.0855 6.3379 0.17 0.6181 0.2092 0.0027 2.0742*10-8 0.9855 9.3916*10-8 0.0051 68.5 0.9808 1.3910 1.9304 6.6951 0.16 0.594 0.243 0.003 1.889*10-8 0.9858 1.0028*10-6 0.0061 68.5 0.9491 1.4477 1.7747 7.147 0.15 0.5667 0.2797 0.0036 1.7215*10-8 0.9823 1.0646*10-6 0.0078 68.5 0.9228 1.5119 1.6371 7.6697
0.148 0.501 0.3473 0.0037 1.8701*10-8 0.9847 1.2664*10-6 0.0097 69.5 0.8941 1.6494 1.4214 8.856 0.145 0.4426 0.4086 0.0038 2.0591*10-8 0.9738 1.4934*10-6 0.0117 70.5 0.8853 1.7769 1.2922 9.9877 0.143 0.4204 0.4327 0.0039 2.3025*10-8 0.9869 1.69*10-6 0.0131 71.5 0.8848 1.8242 1.2524 10.4102 0.14 0.397 0.4589 0.0041 2.405*10-8 0.9852 1.8407*10-6 0.0148 72 0.8858 1.8777 1.2164 10.8983 0.13 0.378 0.4877 0.0043 2.3919*10-8 0.9834 2.0021*10-6 0.0166 72.5 0.8857 1.9311 1.1862 11.379 0.12 0.3696 0.5058 0.0046 2.2141*10-8 0.9817 2.0593*10-6 0.0183 72.5 0.8846 1.9635 1.1716 11.6671 0.11 0.3307 0.5546 0.0047 2.5856*10-8 0.9782 2.5952*10-6 0.0216 74.5 0.8925 2.0548 1.1272 12.5253
0.095 0.2625 0.6375 0.005 3.7181*10-8 0.9696 4.1374*10-6 0.0304 78.5 0.9163 2.2032 1.0722 13.9793 0.091 0.1981 0.7049 0.006 7.3789*10-8 0.95 7.6496*10-6 0.05 84.5 0.9485 2.2936 1.0405 14.9179 0.08 0.1269 0.7851 0.008 2.1814*10-7 0.8957 2.0942*10-5 0.1043 95.5 0.991 2.3312 1.0177 15.3502
0.075 0.0343 0.882 0.0087 6.5325*10-6 0.6626 3.5762*10-4 0.3370 134.5 1.0594 2.0622 1.0033 12.7716 0.07 0.009 0.91 0.011 3.266*10-5 0.2853 0.0015 0.7133 158.5 1.0772 1.877 1.0016 11.0493 0.05 0.008 0.93 0.012 1.9899*10-5 0.2444 0.0013 0.7542 156 1.0791 1.9177 1.0011 11.4284 0.02 0.005 0.96 0.015 5.3585*10-6 0.1384 9.6459*10-4 0.8606 150 1.0809 2.0003 1.0006 12.2146
Click t
o buy NOW!
PDF-XChange
ww
w.tracker-software.c
om Click t
o buy NOW!
PDF-XChange
ww
w.tracker-software
.com
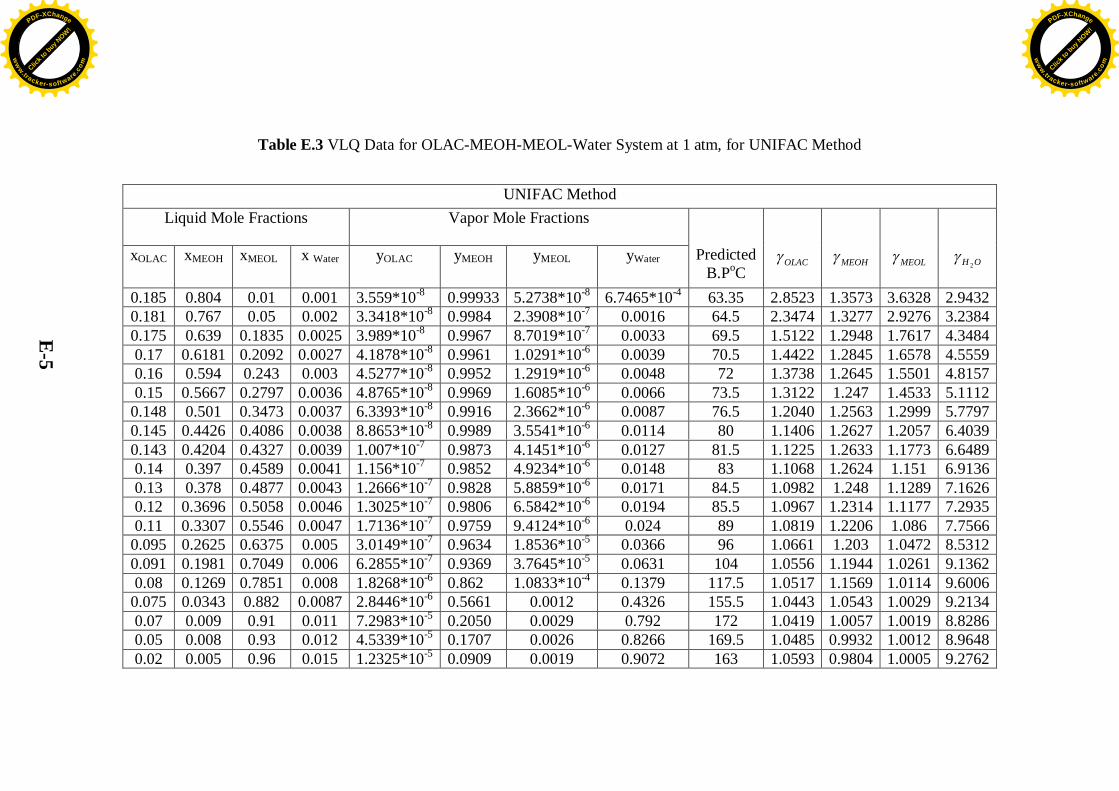
E-5
Table E.3 VLQ Data for OLAC-MEOH-MEOL-Water System at 1 atm, for UNIFAC Method
UNIFAC Method
Liquid Mole Fractions
Vapor Mole Fractions
xOLAC
xMEOH
xMEOL x Water
yOLAC
yMEOH
yMEOL
yWater
Predicted B.PoC
OLAC
MEOH
MEOL
OH 2
0.185 0.804 0.01 0.001 3.559*10-8 0.99933 5.2738*10-8 6.7465*10-4 63.35 2.8523 1.3573 3.6328 2.9432 0.181 0.767 0.05 0.002 3.3418*10-8 0.9984 2.3908*10-7 0.0016 64.5 2.3474 1.3277 2.9276 3.2384 0.175 0.639 0.1835 0.0025 3.989*10-8 0.9967 8.7019*10-7 0.0033 69.5 1.5122 1.2948 1.7617 4.3484 0.17 0.6181 0.2092 0.0027 4.1878*10-8 0.9961 1.0291*10-6 0.0039 70.5 1.4422 1.2845 1.6578 4.5559 0.16 0.594 0.243 0.003 4.5277*10-8 0.9952 1.2919*10-6 0.0048 72 1.3738 1.2645 1.5501 4.8157 0.15 0.5667 0.2797 0.0036 4.8765*10-8 0.9969 1.6085*10-6 0.0066 73.5 1.3122 1.247 1.4533 5.1112
0.148 0.501 0.3473 0.0037 6.3393*10-8 0.9916 2.3662*10-6 0.0087 76.5 1.2040 1.2563 1.2999 5.7797 0.145 0.4426 0.4086 0.0038 8.8653*10-8 0.9989 3.5541*10-6 0.0114 80 1.1406 1.2627 1.2057 6.4039 0.143 0.4204 0.4327 0.0039 1.007*10-7 0.9873 4.1451*10-6 0.0127 81.5 1.1225 1.2633 1.1773 6.6489 0.14 0.397 0.4589 0.0041 1.156*10-7 0.9852 4.9234*10-6 0.0148 83 1.1068 1.2624 1.151 6.9136 0.13 0.378 0.4877 0.0043 1.2666*10-7 0.9828 5.8859*10-6 0.0171 84.5 1.0982 1.248 1.1289 7.1626 0.12 0.3696 0.5058 0.0046 1.3025*10-7 0.9806 6.5842*10-6 0.0194 85.5 1.0967 1.2314 1.1177 7.2935 0.11 0.3307 0.5546 0.0047 1.7136*10-7 0.9759 9.4124*10-6 0.024 89 1.0819 1.2206 1.086 7.7566
0.095 0.2625 0.6375 0.005 3.0149*10-7 0.9634 1.8536*10-5 0.0366 96 1.0661 1.203 1.0472 8.5312 0.091 0.1981 0.7049 0.006 6.2855*10-7 0.9369 3.7645*10-5 0.0631 104 1.0556 1.1944 1.0261 9.1362 0.08 0.1269 0.7851 0.008 1.8268*10-6 0.862 1.0833*10-4 0.1379 117.5 1.0517 1.1569 1.0114 9.6006
0.075 0.0343 0.882 0.0087 2.8446*10-6 0.5661 0.0012 0.4326 155.5 1.0443 1.0543 1.0029 9.2134 0.07 0.009 0.91 0.011 7.2983*10-5 0.2050 0.0029 0.792 172 1.0419 1.0057 1.0019 8.8286 0.05 0.008 0.93 0.012 4.5339*10-5 0.1707 0.0026 0.8266 169.5 1.0485 0.9932 1.0012 8.9648 0.02 0.005 0.96 0.015 1.2325*10-5 0.0909 0.0019 0.9072 163 1.0593 0.9804 1.0005 9.2762
Click t
o buy NOW!
PDF-XChange
ww
w.tracker-software.c
om Click t
o buy NOW!
PDF-XChange
ww
w.tracker-software
.com
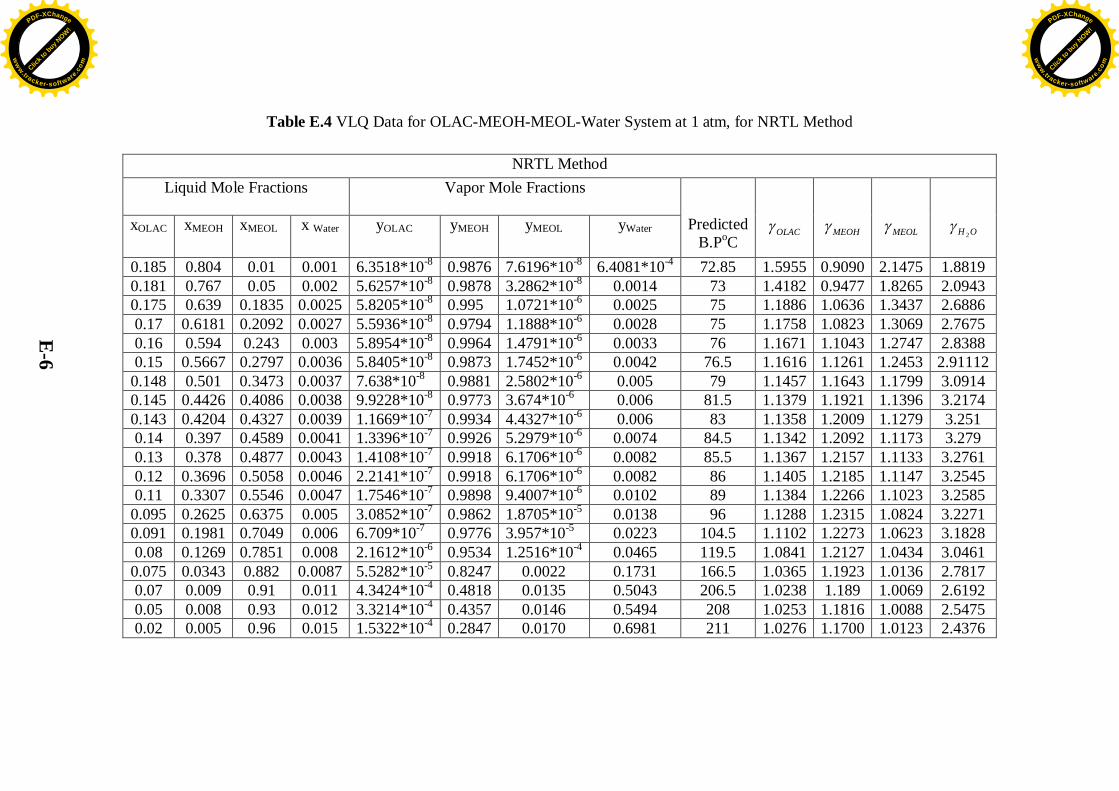
E-6
Table E.4 VLQ Data for OLAC-MEOH-MEOL-Water System at 1 atm, for NRTL Method
NRTL Method Liquid Mole Fractions
Vapor Mole Fractions
xOLAC
xMEOH
xMEOL x Water
yOLAC
yMEOH
yMEOL
yWater
Predicted B.PoC
OLAC
MEOH
MEOL
OH 2
0.185 0.804 0.01 0.001 6.3518*10-8 0.9876 7.6196*10-8 6.4081*10-4 72.85 1.5955 0.9090 2.1475 1.8819 0.181 0.767 0.05 0.002 5.6257*10-8 0.9878 3.2862*10-8 0.0014 73 1.4182 0.9477 1.8265 2.0943 0.175 0.639 0.1835 0.0025 5.8205*10-8 0.995 1.0721*10-6 0.0025 75 1.1886 1.0636 1.3437 2.6886 0.17 0.6181 0.2092 0.0027 5.5936*10-8 0.9794 1.1888*10-6 0.0028 75 1.1758 1.0823 1.3069 2.7675 0.16 0.594 0.243 0.003 5.8954*10-8 0.9964 1.4791*10-6 0.0033 76 1.1671 1.1043 1.2747 2.8388 0.15 0.5667 0.2797 0.0036 5.8405*10-8 0.9873 1.7452*10-6 0.0042 76.5 1.1616 1.1261 1.2453 2.91112
0.148 0.501 0.3473 0.0037 7.638*10-8 0.9881 2.5802*10-6 0.005 79 1.1457 1.1643 1.1799 3.0914 0.145 0.4426 0.4086 0.0038 9.9228*10-8 0.9773 3.674*10-6 0.006 81.5 1.1379 1.1921 1.1396 3.2174 0.143 0.4204 0.4327 0.0039 1.1669*10-7 0.9934 4.4327*10-6 0.006 83 1.1358 1.2009 1.1279 3.251 0.14 0.397 0.4589 0.0041 1.3396*10-7 0.9926 5.2979*10-6 0.0074 84.5 1.1342 1.2092 1.1173 3.279 0.13 0.378 0.4877 0.0043 1.4108*10-7 0.9918 6.1706*10-6 0.0082 85.5 1.1367 1.2157 1.1133 3.2761 0.12 0.3696 0.5058 0.0046 2.2141*10-7 0.9918 6.1706*10-6 0.0082 86 1.1405 1.2185 1.1147 3.2545 0.11 0.3307 0.5546 0.0047 1.7546*10-7 0.9898 9.4007*10-6 0.0102 89 1.1384 1.2266 1.1023 3.2585
0.095 0.2625 0.6375 0.005 3.0852*10-7 0.9862 1.8705*10-5 0.0138 96 1.1288 1.2315 1.0824 3.2271 0.091 0.1981 0.7049 0.006 6.709*10-7 0.9776 3.957*10-5 0.0223 104.5 1.1102 1.2273 1.0623 3.1828 0.08 0.1269 0.7851 0.008 2.1612*10-6 0.9534 1.2516*10-4 0.0465 119.5 1.0841 1.2127 1.0434 3.0461
0.075 0.0343 0.882 0.0087 5.5282*10-5 0.8247 0.0022 0.1731 166.5 1.0365 1.1923 1.0136 2.7817 0.07 0.009 0.91 0.011 4.3424*10-4 0.4818 0.0135 0.5043 206.5 1.0238 1.189 1.0069 2.6192 0.05 0.008 0.93 0.012 3.3214*10-4 0.4357 0.0146 0.5494 208 1.0253 1.1816 1.0088 2.5475 0.02 0.005 0.96 0.015 1.5322*10-4 0.2847 0.0170 0.6981 211 1.0276 1.1700 1.0123 2.4376
Click t
o buy NOW!
PDF-XChange
ww
w.tracker-software.c
om Click t
o buy NOW!
PDF-XChange
ww
w.tracker-software
.com
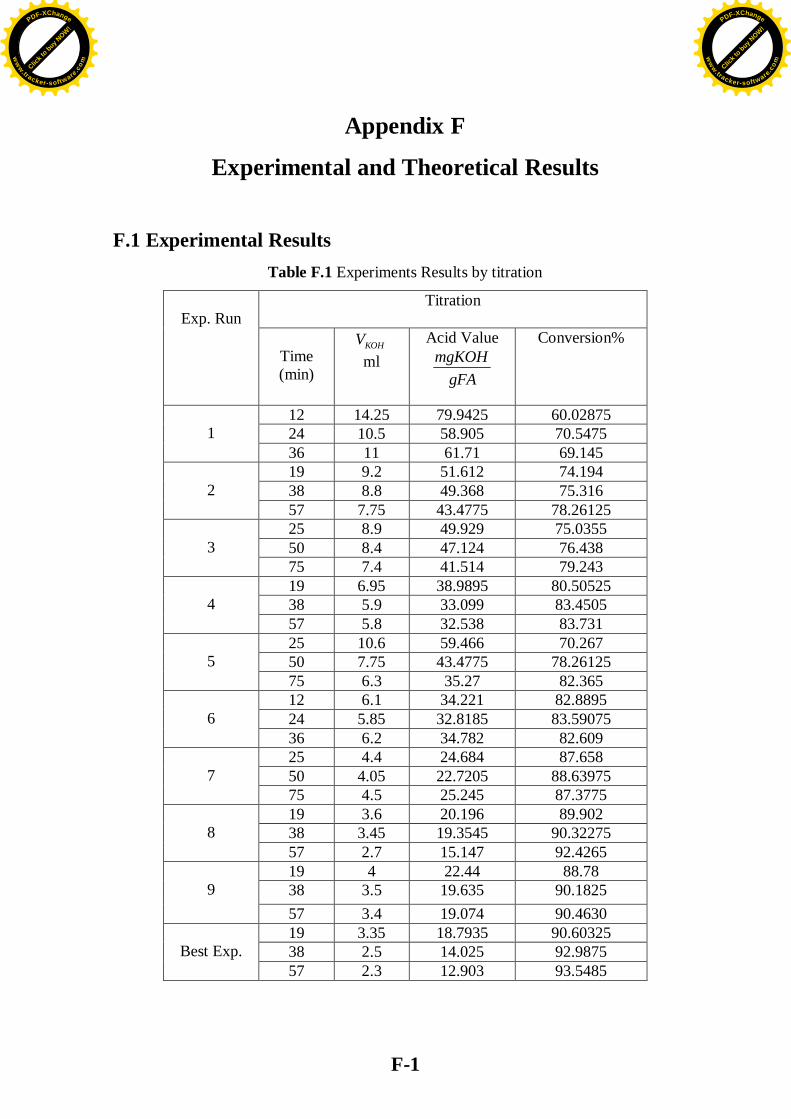
F-1
Appendix F
Experimental and Theoretical Results
F.1 Experimental Results Table F.1 Experiments Results by titration
Titration
Conversion% Acid Value
gFAmgKOH
KOHV ml
Time (min)
Exp. Run
60.02875 79.9425 14.25 12 70.5475 58.905 10.5 24 69.145 61.71 11 36
1
74.194 51.612 9.2 19 75.316 49.368 8.8 38
78.26125 43.4775 7.75 57
2
75.0355 49.929 8.9 25 76.438 47.124 8.4 50 79.243 41.514 7.4 75
3
80.50525 38.9895 6.95 19 83.4505 33.099 5.9 38 83.731 32.538 5.8 57
4
70.267 59.466 10.6 25
78.26125 43.4775 7.75 50 82.365 35.27 6.3 75
5
82.8895 34.221 6.1 12 83.59075 32.8185 5.85 24 82.609 34.782 6.2 36
6
87.658 24.684 4.4 25 88.63975 22.7205 4.05 50 87.3775 25.245 4.5 75
7
89.902 20.196 3.6 19
90.32275 19.3545 3.45 38 92.4265 15.147 2.7 57
8
88.78 22.44 4 19
90.1825 19.635 3.5 38 90.4630 19.074 3.4 57
9
90.60325 18.7935 3.35 19 92.9875 14.025 2.5 38 93.5485 12.903 2.3 57
Best Exp.
Click t
o buy NOW!
PDF-XChange
ww
w.tracker-software.c
om Click t
o buy NOW!
PDF-XChange
ww
w.tracker-software
.com

F-2
Table F.2 % Weight of organic phase by GC
GC wt% Water wt% MEOL wt%
MEOH wt%
OLAC
Time (min)
Exp. Run
0.6754 60.8897 1.8036 36.6313 12 0.7812 69.1908 1.1764 28.8516 24 1.0239 69.6352 1.0239 28.3169 36
1
- 74.7518 - 25.2482 19 - 76.3829 - 23.6171 38 - 78.3039 - 21.6961 57
2
- 76.794 - 23.2060 25 - 80.5879 - 19.4121 50 - 85.0238 - 14.9762 75
3
- - - - 19 - - - - 38 - - - - 57
4
- - - - 25 - - - - 50 - - - - 75
5
- - - - 12 - - - - 24 - - - - 36
6
- - - - 25 - - - - 50 - - - - 75
7
- - - - 12 - - - - 24 - - - - 36
8
- 90.6381 - 9.3619 19 - 91.1300 - 8.8700 38 - 91.8201 - 8.1799 57
9
- - - - 19 - - - - 38 - - - - 57
Best Exp.
Click t
o buy NOW!
PDF-XChange
ww
w.tracker-software.c
om Click t
o buy NOW!
PDF-XChange
ww
w.tracker-software
.com

F-3
Table F.3 %Weight and %mole of organic phase by titration
Titration
mol% MEOL
mol% OLAC
wt% ester MEOL
wt% OLAC
Time (min)
Exp. Run
62.4969 37.5031 63.6262 36.3738 12 72.2364 27.7636 73.1982 26.8018 24 73.5419 26.4581 74.4745 25.5255 36
1
75.6341 24.3659 76.5165 23.4835 19 76.6818 23.3182 77.53756 22.46244 38 79.4370 20.5630 80.2177 19.7823 57
2
76.4198 23.5802 77.2823 22.7177 25 77.7306 22.2694 78.55858 21.44142 50 80.3570 19.6430 81.1111 18.8889 75
3
81.5412 18.4588 82.2598 17.7402 19 84.3092 15.6908 84.9400 15.0600 38 84.4801 15.5199 85.10521 14.89479 57
4
71.9755 28.0245 72.94297 27.05703 25 79.4370 20.5630 80.2177 19.7823 50 83.2881 16.7119 83.9521 16.0479 75
5
83.7813 16.2187 84.4294 15.5706 12 84.4412 15.5588 85.0676 14.9324 24 83.5176 16.4824 84.1742 15.8258 36
6
88.2763 11.7237 88.7688 11.2312 25 89.2041 10.7959 89.6622 10.3378 50 88.0113 11.9887 88.5135 11.4865 75
7
90.3981 9.6019 90.8108 9.1892 12 90.7965 9.2035 91.1937 8.8063 24 92.7904 7.2096 93.1081 6.8919 36
8
89.3366 10.6634 89.7898 10.2102 19 90.6637 9.3363 91.0661 8.9339 38 90.9293 9.0707 91.3213 8.6787 57
9
91.0621 8.9379 91.4489575 8.5510435 19 93.3228 6.6772 93.618625 6.381375 38 93.8554 6.1446 94.1291 5.8709 57
Best Exp.
Click t
o buy NOW!
PDF-XChange
ww
w.tracker-software.c
om Click t
o buy NOW!
PDF-XChange
ww
w.tracker-software
.com
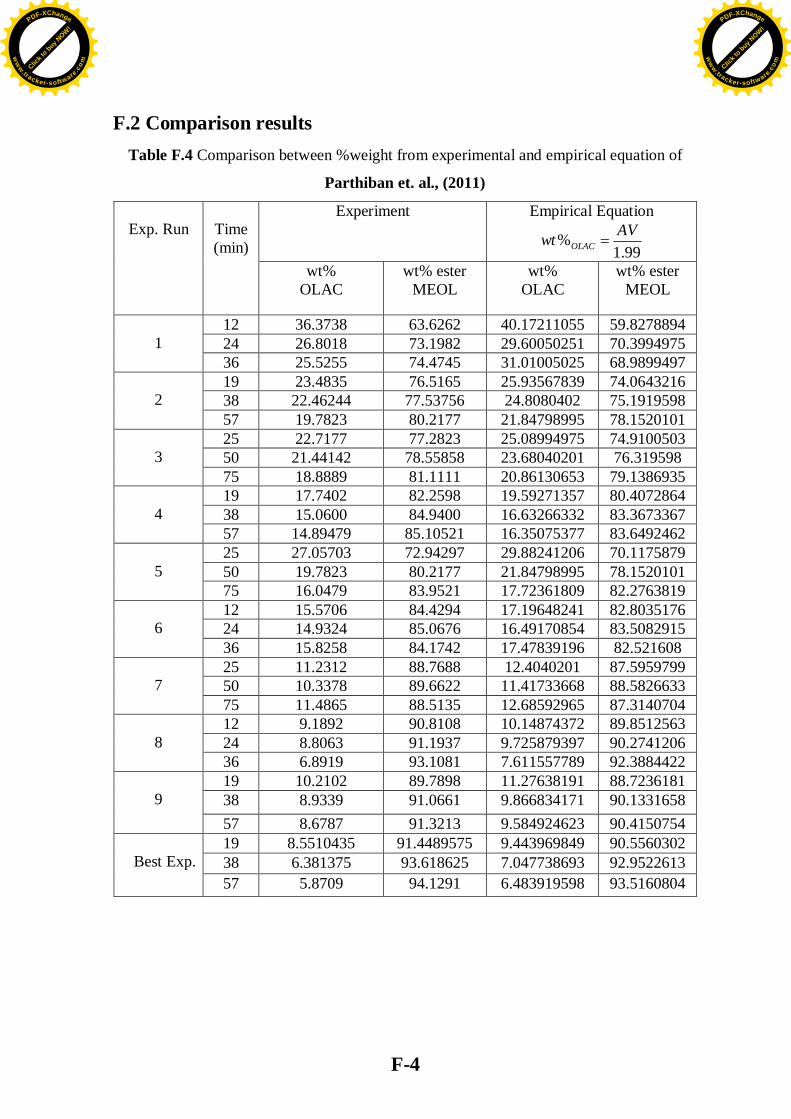
F-4
F.2 Comparison results Table F.4 Comparison between %weight from experimental and empirical equation of
Parthiban et. al., (2011) Empirical Equation
99.1% AVwt OLAC
Experiment
wt% ester MEOL
wt% OLAC
wt% ester MEOL
wt% OLAC
Time (min)
Exp. Run
59.8278894 40.17211055 63.6262 36.3738 12 70.3994975 29.60050251 73.1982 26.8018 24 68.9899497 31.01005025 74.4745 25.5255 36
1
74.0643216 25.93567839 76.5165 23.4835 19 75.1919598 24.8080402 77.53756 22.46244 38 78.1520101 21.84798995 80.2177 19.7823 57
2
74.9100503 25.08994975 77.2823 22.7177 25 76.319598 23.68040201 78.55858 21.44142 50
79.1386935 20.86130653 81.1111 18.8889 75
3
80.4072864 19.59271357 82.2598 17.7402 19 83.3673367 16.63266332 84.9400 15.0600 38 83.6492462 16.35075377 85.10521 14.89479 57
4
70.1175879 29.88241206 72.94297 27.05703 25 78.1520101 21.84798995 80.2177 19.7823 50 82.2763819 17.72361809 83.9521 16.0479 75
5
82.8035176 17.19648241 84.4294 15.5706 12 83.5082915 16.49170854 85.0676 14.9324 24 82.521608 17.47839196 84.1742 15.8258 36
6
87.5959799 12.4040201 88.7688 11.2312 25 88.5826633 11.41733668 89.6622 10.3378 50 87.3140704 12.68592965 88.5135 11.4865 75
7
89.8512563 10.14874372 90.8108 9.1892 12 90.2741206 9.725879397 91.1937 8.8063 24 92.3884422 7.611557789 93.1081 6.8919 36
8
88.7236181 11.27638191 89.7898 10.2102 19 90.1331658 9.866834171 91.0661 8.9339 38 90.4150754 9.584924623 91.3213 8.6787 57
9
90.5560302 9.443969849 91.4489575 8.5510435 19 92.9522613 7.047738693 93.618625 6.381375 38 93.5160804 6.483919598 94.1291 5.8709 57
Best Exp.
Click t
o buy NOW!
PDF-XChange
ww
w.tracker-software.c
om Click t
o buy NOW!
PDF-XChange
ww
w.tracker-software
.com

F-5
Table F.5 Comparison between %weight from GC, Titration and empirical equation of
Felizardo et. al., (2006) Exp. Run wt% MEOL
from GC wt% MEOL
from Titration Wt% MEOL
From viscosity 85..162ln*055.45%FAME
1 69.6352 74.4745 71.94867748 2 78.3039 80.2177 79.47529927 3 85.0238 81.1111 81.91863886 4 - 85.10521 83.92788982 5 - 83.9521 82.62153923 6 - 84.1742 85.54183000 7 - 88.5135 91.34900266 8 - 93.1081 91.69425339 9 91.8201 91.3213 93.91416051
Best Exp. - 94.1291 95.51638886
F.3 Results of Different Variables on the % Conversion of Oleic
Acid
Table F.6 Results of changing the molar ratio on the % conversion of oleic acid
Molar ratio 4:1 Exp. Run Conversion%
1 69.1450 2 78.26125 3 79.2430
%Average conversion 75.5498 Molar ratio 6:1
Exp. Run Conversion% 4 83.7310 5 82.3650 6 82.6090
%Average conversion 82.9017 Molar ratio 8:1
Exp. Run Conversion% 7 87.3775 8 92.4265 9 90.4630
%Average conversion 90.0890
Click t
o buy NOW!
PDF-XChange
ww
w.tracker-software.c
om Click t
o buy NOW!
PDF-XChange
ww
w.tracker-software
.com

F-6
Table F.7 Results of changing the catalyst amount on the % conversion of oleic acid
Catalyst Amount 0.6 g sulfuric acid/g oleic acid Exp. Run Conversion%
1 69.1450 4 83.7310 7 87.3775
%Average conversion 80.0845 Catalyst Amount 1.2 g sulfuric acid/g oleic acid
Exp. Run Conversion%
2 78.26125 5 82.3650 8 92.4265
%Average conversion 84.3509 Catalyst Amount 1.8 g sulfuric acid/g oleic acid
Exp. Run Conversion%
3 79.2430 6 82.6090 9 90.4630
%Average conversion 84.105
Table F.8 Results of changing the time on the % conversion of oleic acid
Time 36min Exp. Run Conversion%
1 69.1450 6 82.6090 8 92.4265
%Average conversion 81.3935 Time 57min
Exp. Run Conversion%
2 78.26125 4 83.7310 9 90.4630
%Average conversion 84.1518 Time 75min
Exp. Run Conversion%
3 79.2430 5 82.3650 7 87.3775
%Average conversion 82.9952
Click t
o buy NOW!
PDF-XChange
ww
w.tracker-software.c
om Click t
o buy NOW!
PDF-XChange
ww
w.tracker-software
.com

F-7
Table F.9 Results of changing the reaction temperature on the % conversion of oleic acid
Reaction Temperature 100oC Exp. Run Conversion%
1 69.1450 5 82.3650 9 90.4630
%Average conversion 80.658 Reaction Temperature 120oC
Exp. Run Conversion%
2 78.26125 6 82.6090 7 87.3775
%Average conversion 82.7493 Reaction Temperature 130oC
Exp. Run Conversion%
3 79.2430 4 83.7310 8 92.4265
%Average conversion 85.1335
F.4 Results of Different Variables on Biodiesel Viscosity
Table F.10 Effect of molar ratio on biodiesel (methyl oleate) viscosities
Molar ratio 4:1 Exp. Run Kinematics Viscosity cSt 40oC
1 7.4958 2 6.36306 3 6.02718
%Average Kinematics Viscosity cSt 40oC 6.62868 Molar ratio 6:1
Exp. Run Kinematics Viscosity cSt 40oC 4 5.7643 5 5.93388 6 5.43934
%Average Kinematics Viscosity cSt 40oC 5.71248 Molar ratio 8:1
Exp. Run Kinematics Viscosity cSt 40oC 7 4.88892 8 4.85160 9 4.61835
%Average Kinematics Viscosity cSt 40oC 4.78629
Click t
o buy NOW!
PDF-XChange
ww
w.tracker-software.c
om Click t
o buy NOW!
PDF-XChange
ww
w.tracker-software
.com

F-8
Table F.11 Effect of catalyst amount on biodiesel (methyl oleate) viscosities
Catalyst Amount 0.6 g sulfuric acid/g oleic acid Exp. Run Kinematics Viscosity cSt 40oC
1 7.4958 4 5.7643 7 4.88892
%Average Kinematics Viscosity cSt 40oC 6.04967 Catalyst Amount 1.2 g sulfuric acid/g oleic acid
Exp. Run Kinematics Viscosity cSt 40oC
2 6.36306 5 5.93388 8 4.85160
%Average Kinematics Viscosity cSt 40oC 5.71618 Catalyst Amount 1.8 g sulfuric acid/g oleic acid
Exp. Run Kinematics Viscosity cSt 40oC
3 6.02718 6 5.43934 9 4.61835
%Average Kinematics Viscosity cSt 40oC 5.36162
Table F.12 Effect of time on biodiesel (methyl oleate) viscosities
Time 36min Exp. Run Kinematics Viscosity cSt 40oC
1 7.4958 6 5.43934 8 4.85160
%Average Kinematics Viscosity cSt 40oC 5.9289 Time 57min
Exp. Run Kinematics Viscosity cSt 40oC
2 6.36306 4 5.7643 9 4.61835
%Average Kinematics Viscosity cSt 40oC 5.58190 Time 75min
Exp. Run Kinematics Viscosity cSt 40oC
3 6.02718 5 5.93388 7 4.88892
%Average Kinematics Viscosity cSt 40oC 5.61666
Click t
o buy NOW!
PDF-XChange
ww
w.tracker-software.c
om Click t
o buy NOW!
PDF-XChange
ww
w.tracker-software
.com
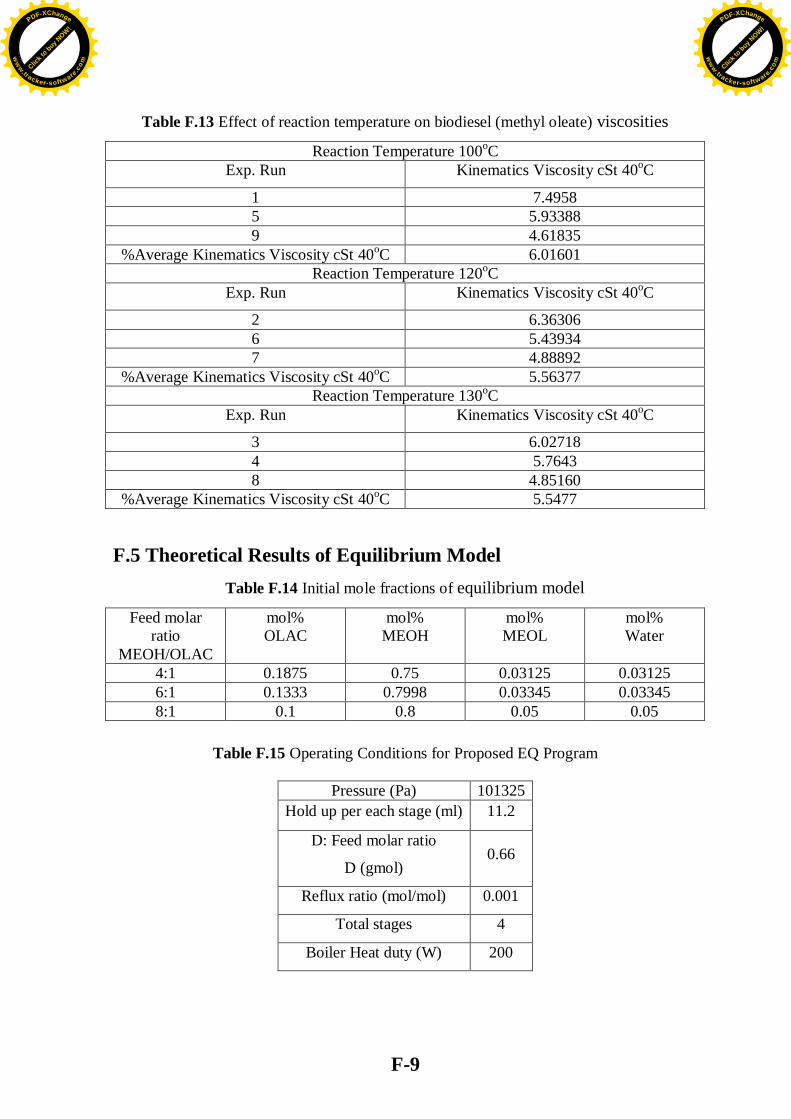
F-9
Table F.13 Effect of reaction temperature on biodiesel (methyl oleate) viscosities
Reaction Temperature 100oC Exp. Run Kinematics Viscosity cSt 40oC
1 7.4958 5 5.93388 9 4.61835
%Average Kinematics Viscosity cSt 40oC 6.01601 Reaction Temperature 120oC
Exp. Run Kinematics Viscosity cSt 40oC
2 6.36306 6 5.43934 7 4.88892
%Average Kinematics Viscosity cSt 40oC 5.56377 Reaction Temperature 130oC
Exp. Run Kinematics Viscosity cSt 40oC
3 6.02718 4 5.7643 8 4.85160
%Average Kinematics Viscosity cSt 40oC 5.5477
F.5 Theoretical Results of Equilibrium Model Table F.14 Initial mole fractions of equilibrium model
Feed molar ratio
MEOH/OLAC
mol% OLAC
mol% MEOH
mol% MEOL
mol% Water
4:1 0.1875 0.75 0.03125 0.03125 6:1 0.1333 0.7998 0.03345 0.03345 8:1 0.1 0.8 0.05 0.05
Table F.15 Operating Conditions for Proposed EQ Program
Pressure (Pa) 101325
Hold up per each stage (ml) 11.2
D: Feed molar ratio
D (gmol) 0.66
Reflux ratio (mol/mol) 0.001
Total stages 4
Boiler Heat duty (W) 200
Click t
o buy NOW!
PDF-XChange
ww
w.tracker-software.c
om Click t
o buy NOW!
PDF-XChange
ww
w.tracker-software
.com

F-10
Table F.16 Theoretical Results of Equilibrium Model
Liquid Mole Fractions in Reactor
Time (min)
Rate of Reaction in Still
(kgmol/hr) xOLAC xMEOL
Exp. Run
0 0.03125 0.1875 0 0.0032 0.5374 0.4626 12 0.0017 0.6174 0.3826 24 0.0014 0.6902 0.3879 36
1
0 0.03125 0.1875 0 0.0079 0.5636 0.4369 19 0.004 0.7832 0.2168 38 0.002 0.8552 0.1447 57
2
0 0.03345 0.1333 0 0.0083 0.6836 0.3164 25 0.0092 0.6953 0.3047 50 0.0047 0.8377 0.1623 75
3
0 0.03345 0.1333 0 0.0035 0.6091 0.3909 19 0.0029 0.6801 0.3199 38 0.0016 0.8506 0.1494 57
4
0 0.05 0.1333 0 0.006 0.6792 0.3208 25 0.0024 0.7429 0.2570 50 0.0019 0.7408 0.2589 75
5
0 0.03345 0.1333 0 0.0112 0.5359 0.4641 12
0.0064 0.7552 0.2448 24 0.0034 0.8285 0.1713 36
6
0 0.05 0.1 0 0.0043 0.7018 0.2982 25 0.0014 0.9075 0.0925 50
4.417*10-4 0.9628 0.0372 75
7
0 0.05 0.1 0 0.0094 0.6925 0.3075 12 0.0032 0.9027 0.0973 24 0.001 0.96 0.04 36
8
0 0.05 0.1 0 0.0103 0.7230 0.2770 19 0.0031 0.888 0.112 38 0.0013 0. 8878 0.1122 57
9
0 0.05 0.1 0 0.0094 0.6925 0.3075 19 0.0032 0.9021 0.0979 38 0.001 0.9598 0.0402 57
Best Exp.
Click t
o buy NOW!
PDF-XChange
ww
w.tracker-software.c
om Click t
o buy NOW!
PDF-XChange
ww
w.tracker-software
.com
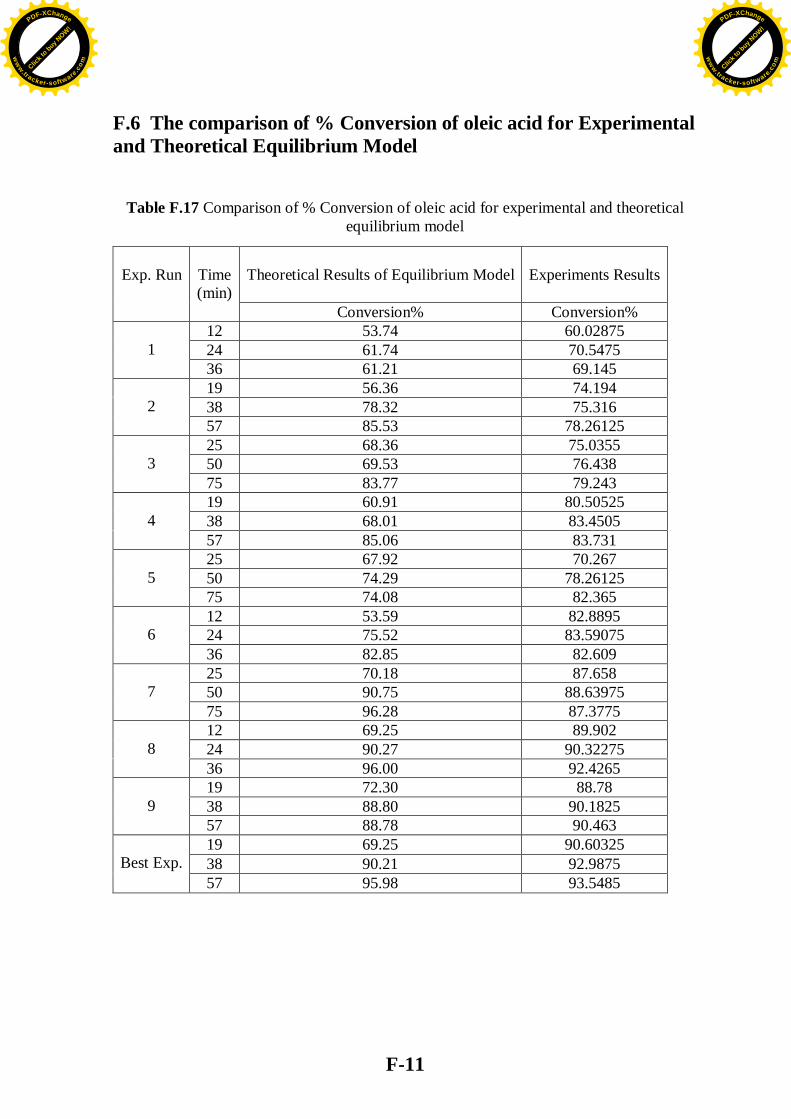
F-11
F.6 The comparison of % Conversion of oleic acid for Experimental and Theoretical Equilibrium Model
Table F.17 Comparison of % Conversion of oleic acid for experimental and theoretical
equilibrium model
Experiments Results
Theoretical Results of Equilibrium Model
Conversion% Conversion%
Time (min)
Exp. Run
60.02875 53.74 12 70.5475 61.74 24 69.145 61.21 36
1
74.194 56.36 19 75.316 78.32 38
78.26125 85.53 57
2
75.0355 68.36 25 76.438 69.53 50 79.243 83.77 75
3
80.50525 60.91 19 83.4505 68.01 38 83.731 85.06 57
4
70.267 67.92 25 78.26125 74.29 50 82.365 74.08 75
5
82.8895 53.59 12 83.59075 75.52 24 82.609 82.85 36
6
87.658 70.18 25 88.63975 90.75 50 87.3775 96.28 75
7
89.902 69.25 12 90.32275 90.27 24 92.4265 96.00 36
8
88.78 72.30 19
90.1825 88.80 38 90.463 88.78 57
9
90.60325 69.25 19 92.9875 90.21 38 93.5485 95.98 57
Best Exp.
Click t
o buy NOW!
PDF-XChange
ww
w.tracker-software.c
om Click t
o buy NOW!
PDF-XChange
ww
w.tracker-software
.com
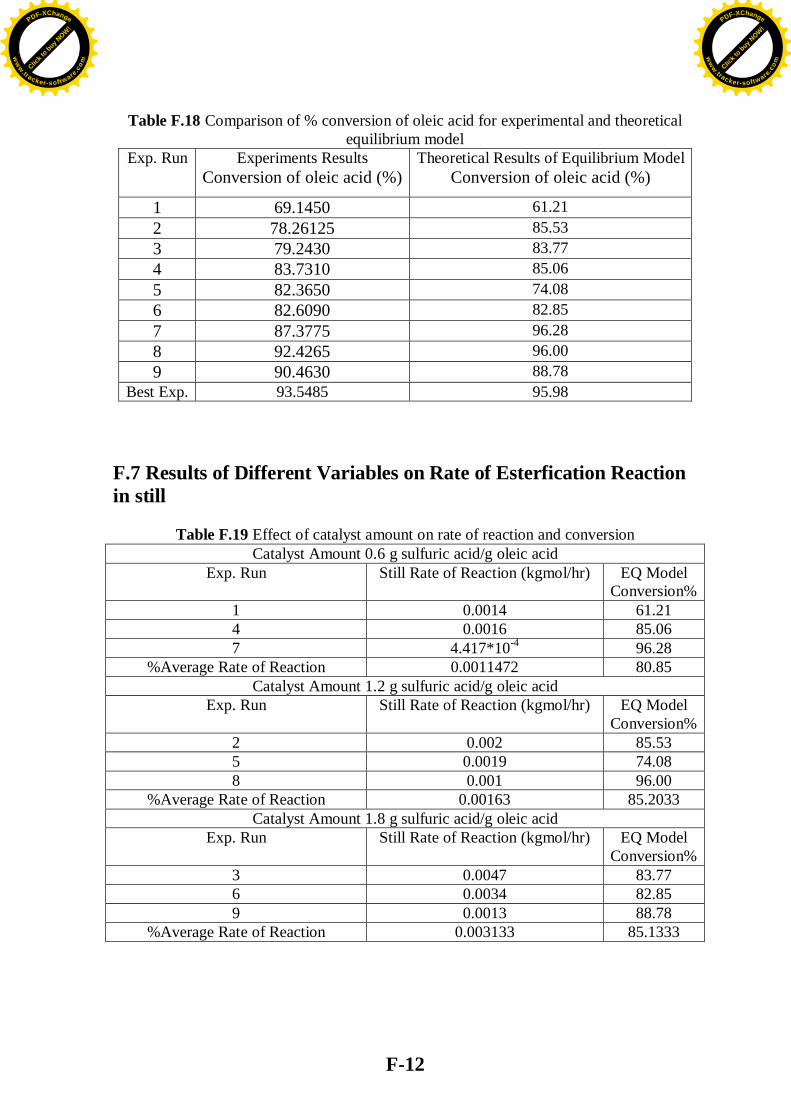
F-12
Table F.18 Comparison of % conversion of oleic acid for experimental and theoretical equilibrium model
Exp. Run Experiments Results Conversion of oleic acid (%)
Theoretical Results of Equilibrium Model Conversion of oleic acid (%)
1 69.1450 61.21 2 78.26125 85.53 3 79.2430 83.77 4 83.7310 85.06 5 82.3650 74.08 6 82.6090 82.85 7 87.3775 96.28 8 92.4265 96.00 9 90.4630 88.78
Best Exp. 93.5485 95.98 F.7 Results of Different Variables on Rate of Esterfication Reaction in still
Table F.19 Effect of catalyst amount on rate of reaction and conversion Catalyst Amount 0.6 g sulfuric acid/g oleic acid
Exp. Run Still Rate of Reaction (kgmol/hr) EQ Model Conversion%
1 0.0014 61.21 4 0.0016 85.06 7 4.417*10-4 96.28
%Average Rate of Reaction 0.0011472 80.85 Catalyst Amount 1.2 g sulfuric acid/g oleic acid
Exp. Run Still Rate of Reaction (kgmol/hr) EQ Model Conversion%
2 0.002 85.53 5 0.0019 74.08 8 0.001 96.00
%Average Rate of Reaction 0.00163 85.2033 Catalyst Amount 1.8 g sulfuric acid/g oleic acid
Exp. Run Still Rate of Reaction (kgmol/hr) EQ Model Conversion%
3 0.0047 83.77 6 0.0034 82.85 9 0.0013 88.78
%Average Rate of Reaction 0.003133 85.1333
Click t
o buy NOW!
PDF-XChange
ww
w.tracker-software.c
om Click t
o buy NOW!
PDF-XChange
ww
w.tracker-software
.com

F-13
Table F.20 Effect of molar ratio on rate of reaction and conversion Molar ratio 4:1
Exp. Run Still Rate of Reaction (kgmol/hr) EQ Model Conversion%
1 0.0014 61.21 2 0.002 85.53 3 0.0047 83.77
%Average Rate of Reaction 0.0027 76.8367 Molar ratio 6:1
Exp. Run Still Rate of Reaction (kgmol/hr) EQ Model Conversion%
4 0.0016 85.06 5 0.0019 74.08 6 0.0034 82.85
%Average Rate of Reaction 0.0023 80.6633 Molar ratio 8:1
Exp. Run Still Rate of Reaction (kgmol/hr) EQ Model Conversion%
7 4.417*10-4 96.28 8 0.001 96.00 9 0.0013 88.78
%Average Rate of Reaction 0.0009139 93.6867
Table F.21 Effect of time on rate of reaction and conversion Time 36min
Exp. Run Still Rate of Reaction (kgmol/hr) EQ Model Conversion%
1 0.0014 61.21 6 0.0023 80.6633 8 0.001 96.00
%Average Rate of Reaction 0.001567 79.2911 Time 57min
Exp. Run Still Rate of Reaction (kgmol/hr) EQ Model Conversion%
2 0.002 85.53 4 0.0016 85.06 9 0.0013 88.78
%Average Rate of Reaction 0.001633 86.4567 Time 75min
Exp. Run Still Rate of Reaction (kgmol/hr) EQ Model Conversion%
3 0.0047 83.77 5 0.0019 74.08 7 4.417*10-4 96.28
%Average Rate of Reaction 0.00235 84.71
Click t
o buy NOW!
PDF-XChange
ww
w.tracker-software.c
om Click t
o buy NOW!
PDF-XChange
ww
w.tracker-software
.com

F-14
Table F.22 Effect of reaction temperature on rate of reaction and conversion
Reaction Temperature 100oC Exp. Run Still Rate of Reaction (kgmol/hr) EQ Model
Conversion% 1 0.0014 61.21 5 0.0019 74.08 9 0.0013 88.78
%Average Rate of Reaction 0.001533 74.69 Reaction Temperature 120oC
Exp. Run Still Rate of Reaction (kgmol/hr) EQ Model Conversion%
2 0.002 85.53 6 0.0023 80.6633 7 4.417*10-4 96.28
%Average Rate of Reaction 0.001581 87.4911 Reaction Temperature 130oC
Exp. Run Still Rate of Reaction (kgmol/hr) EQ Model Conversion%
3 0.0047 83.77 4 0.0016 85.06 8 0.001 96.00
%Average Rate of Reaction 0.002433 88.2767
Click t
o buy NOW!
PDF-XChange
ww
w.tracker-software.c
om Click t
o buy NOW!
PDF-XChange
ww
w.tracker-software
.com

G-1
Appendix G
Statistical Analysis
G.1 Liner Regression
Regression is the relationship between two variables. The graph of the
regression equation is called regression line (or line of best fit, or least-squares line).
The regression equation is:
xbbyTrue 10
Figure G.1 True line (predicted line) and an observed data point.
Linear correlation coefficient for sample r, the values of r is always between
-1 and 1. r measures the strength of linear relationship, r calculated as follows:
(Triola 1997).
2222 )()()()(
))((
yynxxn
yxxynr
The value of r must test to determine whether there is a significant linear
correlation between two variables, there are two method, in the present work using a
formal hypothesis test, by compared the value of r form equation G.2 with critical
value in Table A-6 in Triola (1997).
…(G.1)
…(G.2)
Click t
o buy NOW!
PDF-XChange
ww
w.tracker-software.c
om Click t
o buy NOW!
PDF-XChange
ww
w.tracker-software
.com

G-2
Coefficient of Multiple determination R2 it is measures the proportionate
reduction of total variation in y associated with the use of set of x variables. R2 was
evaluated using the following equation: (Neter et. al., 1996).
Total
reg
SSSS
R .2 , 10 2R
SStotal, SSreg and SSresidual are show in Fig. G.2.
Figure G.2 Coefficient of Multiple determination R2.
The empirical model is adequate to explain most of the variability in assay
reading which should me at least R2 is 0.75 (Haaland 1989).
n
iii
n
i
n
iii yyyyyy
1
2
1 1
22 )ˆ()ˆ()(
C A
B
A
yi
x
y
yi
C
B
iTruei xbby 10
Meany
…(G.3)
A2 B2 C2 SStotal
Total squared distance of observations from naïve mean of y
SSreg Distance from regression line to naïve mean of y Variability due to x
SSresidual Variance around the regression line Additional variability
…(G.4)
Click t
o buy NOW!
PDF-XChange
ww
w.tracker-software.c
om Click t
o buy NOW!
PDF-XChange
ww
w.tracker-software
.com

G-3
The standard error of estimate, denoted by se, is a measure of the differences
(or distances) between the observed sample values and the predicted values that are
obtained using the regression equation. se calculated as follows: (Triola 1997).
210
2
nxybyby
se
…(G.5)
Click t
o buy NOW!
PDF-XChange
ww
w.tracker-software.c
om Click t
o buy NOW!
PDF-XChange
ww
w.tracker-software
.com
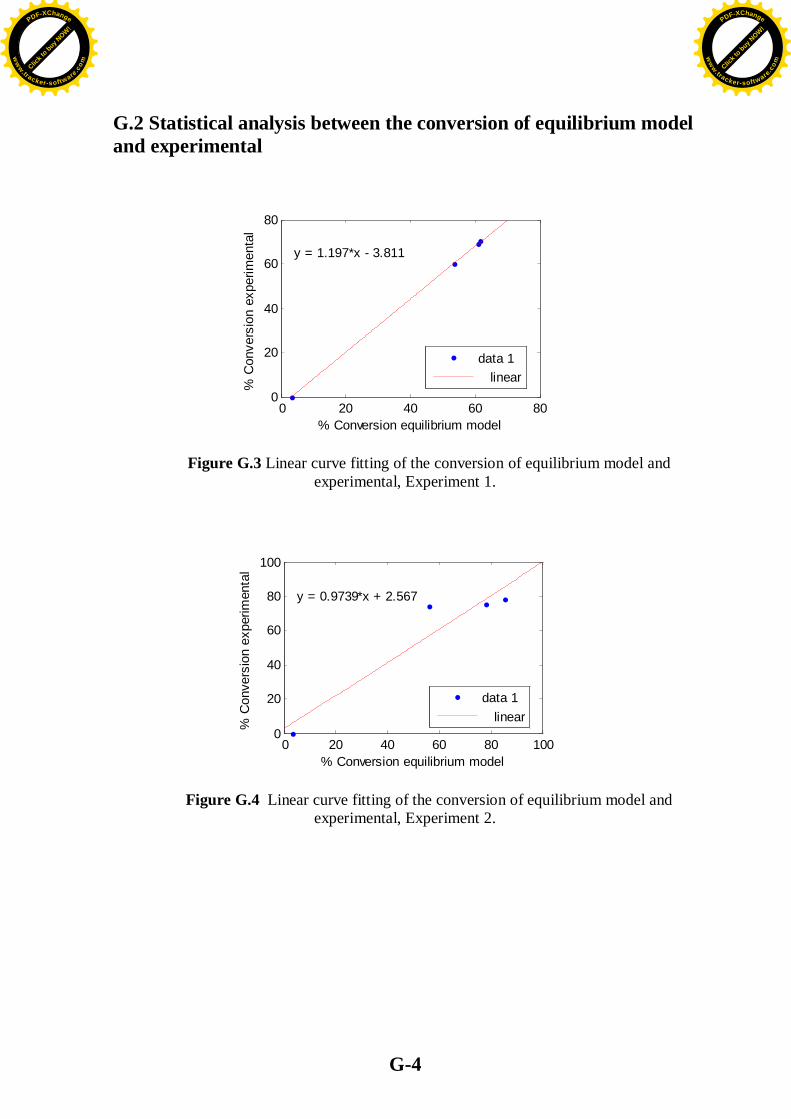
G-4
G.2 Statistical analysis between the conversion of equilibrium model and experimental
0 20 40 60 800
20
40
60
80
% Conversion equilibrium model
% C
onve
rsio
n ex
perim
enta
l
y = 1.197*x - 3.811
data 1 linear
Figure G.3 Linear curve fitting of the conversion of equilibrium model and experimental, Experiment 1.
0 20 40 60 80 1000
20
40
60
80
100
% Conversion equilibrium model
% C
onve
rsio
n ex
perim
enta
l
y = 0.9739*x + 2.567
data 1 linear
Figure G.4 Linear curve fitting of the conversion of equilibrium model and experimental, Experiment 2.
Click t
o buy NOW!
PDF-XChange
ww
w.tracker-software.c
om Click t
o buy NOW!
PDF-XChange
ww
w.tracker-software
.com
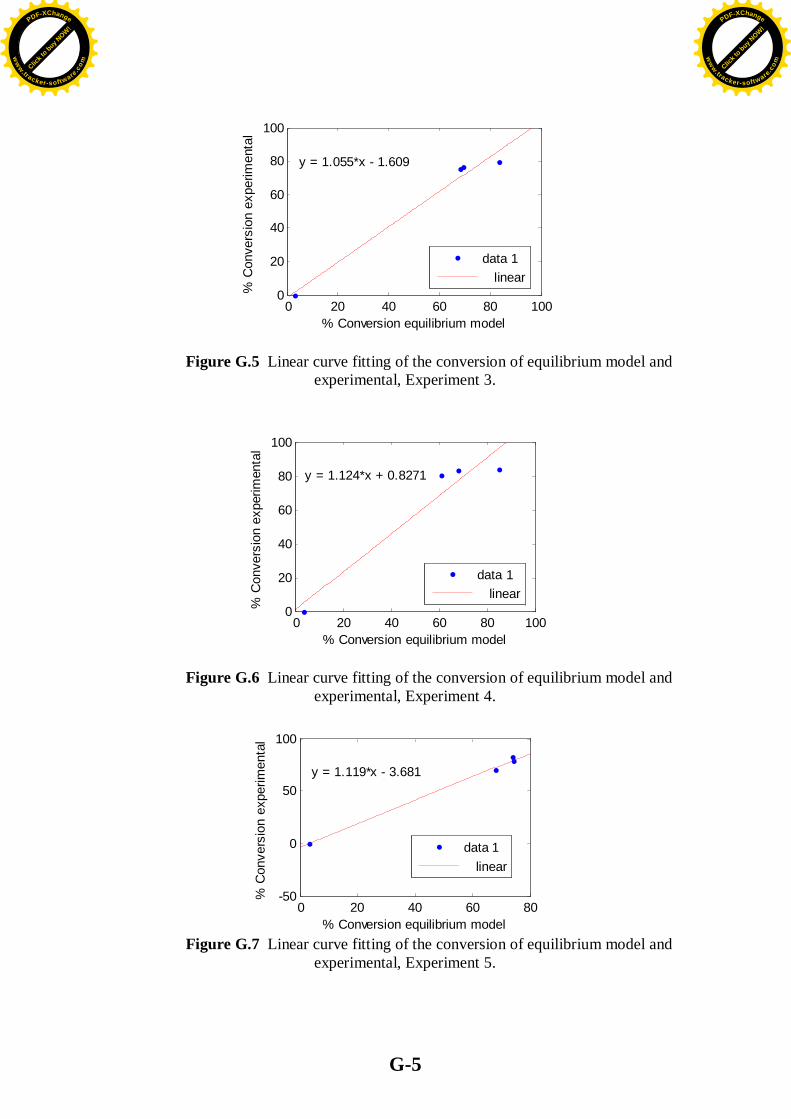
G-5
0 20 40 60 80 1000
20
40
60
80
100
% Conversion equilibrium model
% C
onve
rsio
n ex
perim
enta
l
y = 1.055*x - 1.609
data 1 linear
Figure G.5 Linear curve fitting of the conversion of equilibrium model and experimental, Experiment 3.
0 20 40 60 80 1000
20
40
60
80
100
% Conversion equilibrium model
% C
onve
rsio
n ex
perim
enta
l
y = 1.124*x + 0.8271
data 1 linear
Figure G.6 Linear curve fitting of the conversion of equilibrium model and experimental, Experiment 4.
0 20 40 60 80-50
0
50
100
% Conversion equilibrium model
% C
onve
rsio
n ex
perim
enta
l
y = 1.119*x - 3.681
data 1 linear
Figure G.7 Linear curve fitting of the conversion of equilibrium model and
experimental, Experiment 5.
Click t
o buy NOW!
PDF-XChange
ww
w.tracker-software.c
om Click t
o buy NOW!
PDF-XChange
ww
w.tracker-software
.com

G-6
0 20 40 60 80 1000
20
40
60
80
100
% Conversion equilibrium model
% C
onve
rsio
n ex
perim
enta
l
y = 1.083*x + 4.045
data 1 linear
Figure G.8 Linear curve fitting of the conversion of equilibrium model and experimental, Experiment 6.
0 20 40 60 80 1000
20
40
60
80
100
% Conversion equilibrium model
% C
onve
rsio
n ex
perim
enta
l
y = 1.011*x - 0.3421
data 1 linear
Figure G.9 Linear curve fitting of the conversion of equilibrium model and
experimental, Experiment 7.
0 20 40 60 80 1000
20
40
60
80
100
% Conversion equilibrium model
% C
onve
rsio
n ex
perim
enta
l
y = 1.053*x - 0.4218
data 1 linear
Figure G.10 Linear curve fitting of the conversion of equilibrium model and
experimental, Experiment 8.
Click t
o buy NOW!
PDF-XChange
ww
w.tracker-software.c
om Click t
o buy NOW!
PDF-XChange
ww
w.tracker-software
.com
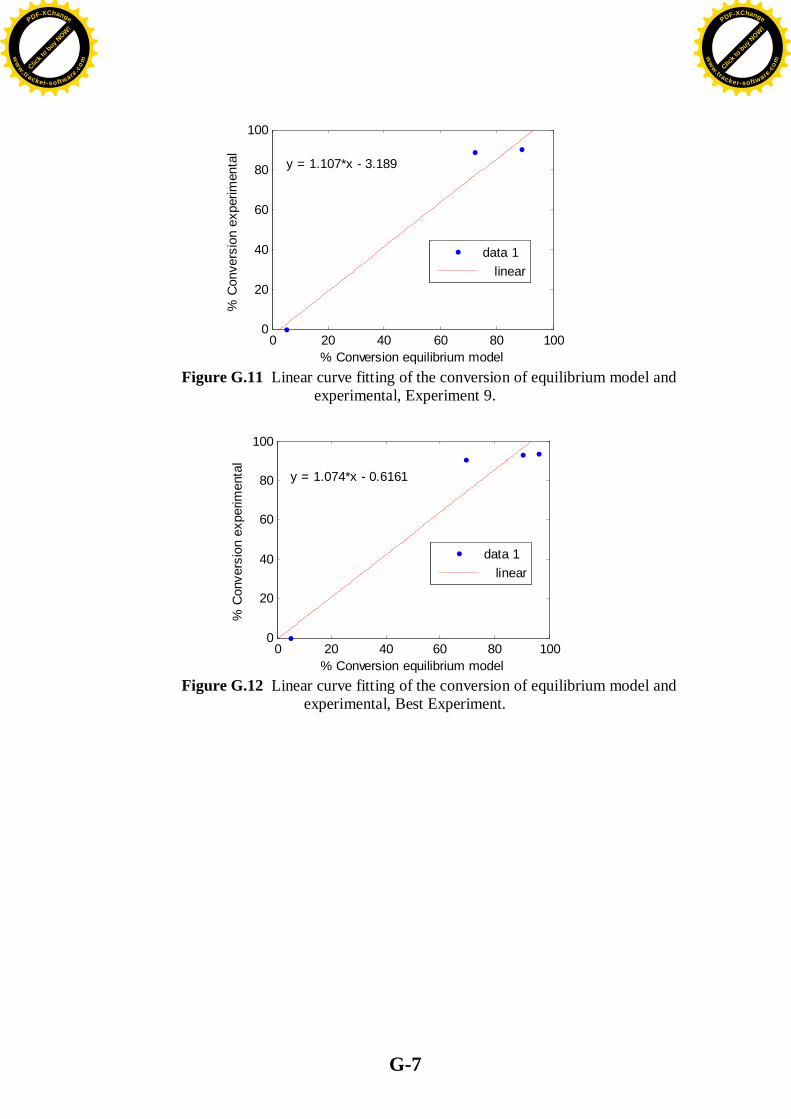
G-7
0 20 40 60 80 1000
20
40
60
80
100
% Conversion equilibrium model
% C
onve
rsio
n ex
perim
enta
l
y = 1.107*x - 3.189
data 1 linear
Figure G.11 Linear curve fitting of the conversion of equilibrium model and
experimental, Experiment 9.
0 20 40 60 80 1000
20
40
60
80
100
% Conversion equilibrium model
% C
onve
rsio
n ex
perim
enta
l
y = 1.074*x - 0.6161
data 1 linear
Figure G.12 Linear curve fitting of the conversion of equilibrium model and
experimental, Best Experiment.
Click t
o buy NOW!
PDF-XChange
ww
w.tracker-software.c
om Click t
o buy NOW!
PDF-XChange
ww
w.tracker-software
.com

.
)( .
) (.
) (
.
Rashing Ring Glass
.
/
)
(.
Taguchi )(
/
.%
. )(
(ASTM) .
.
)EQ ( MATLAB (R2010a)
MESHR . UNIQUAC
---.
. (EQ)
Click t
o buy NOW!
PDF-XChange
ww
w.tracker-software.c
om Click t
o buy NOW!
PDF-XChange
ww
w.tracker-software
.com

.
(EQ) .
)(EQ
r
R2 .%
Click t
o buy NOW!
PDF-XChange
ww
w.tracker-software.c
om Click t
o buy NOW!
PDF-XChange
ww
w.tracker-software
.com

:
.
/ /
/ /
Click t
o buy NOW!
PDF-XChange
ww
w.tracker-software.c
om Click t
o buy NOW!
PDF-XChange
ww
w.tracker-software
.com

Click t
o buy NOW!
PDF-XChange
ww
w.tracker-software.c
om Click t
o buy NOW!
PDF-XChange
ww
w.tracker-software
.com


