
1
Short Run Impacts of Accountability on School Quality
Jonah Rockoff Lesley J. Turner∗
In the fall of 2007, New York City began using student tests and other measures to assign each school a grade (A to F), and linked grades to rewards and consequences, including possible school closure. These grades were released in late September, arguably too late for schools to make major changes in programs or personnel, and students were tested again in January (English) and March (math). Despite this time frame, regression discontinuity estimates indicate that receipt of a low grade significantly increased student achievement, more so in math than English, and improved parental evaluations of school quality.
School accountability systems link rewards and consequences to a set of measurable
outcomes, typically student scores on standardized tests. While these systems aim to improve
school quality and academic achievement, a substantial literature on accountability has focused
on how schools may act in ways that improve accountability measures but do not actually raise
achievement (e.g., exempting low performing students from testing) or raise achievement for a
subset of students (i.e., those given more weight in the accountability system) at their classmates’
expense.1 In short, there is a great deal of evidence on the pitfalls of school accountability, but
far less evidence that these systems can lead to increases in student achievement.
The New York City Department of Education (hereafter the DOE) launched its
accountability system in the fall of 2007. In this system, schools are evaluated according to a set
of continuous metrics, but each school is assigned a letter grade (from A to F) based on sharp
∗ Jonah Rockoff: Graduate School of Business, Columbia University, 3022 Broadway #603, New York, NY 10027-6903 and National Bureau of Economic Research (email: [email protected]); Lesley J. Turner: Department of Economics, Columbia University, 1022 International Affairs Building, 420 West 118th Street, New York, NY 10027 (email: [email protected]). We would like to thank Jesse Margolis, Raji Chakrabarti, David Figlio, Miguel Urquiola, and seminar participants at the New York City Department of Education, Cornell, Yale, Wharton, Universidad de San Andres, NYU, and the NBER Education Program meetings for their very helpful comments. 1 See, for example, Brian A. Jacob and Steven D. Levitt (2003), David N. Figlio and Joshua Winicki (2005), Jacob (2005), Julie B. Cullen and Randall Reback (2006), Figlio (2006), Figlio and Lawrence S. Getzler (2006), Figlio and Cecilia E. Rouse (2006), John M. Krieg (2008), Reback (2008), and Derek A. Neal and Diane Whitmore Schanzenbach (forthcoming).

2
cutoffs. Much of the publicity surrounding the launch of the accountability system focused on
the letter grades and, more importantly, these grades were directly linked to rewards and
consequences.2 Specifically, schools that received an A or B were eligible for increased per
pupil funding and bonuses for principals, while schools that received a D or F faced a series of
formal corrective actions, the prospect of losing students (and funding) through a special transfer
program, and a credible threat of school closure or principal dismissal if performance under the
accountability system did not improve. The discontinuities inherent in the assignment of grades
present an opportunity to study the short run effects of accountability on student achievement in
a way that can uncover the causal impacts of accountability grades on student and school
outcomes.
Our work is most similar to recent papers by Rouse et al. (2007) and Hanley Chiang
(2009) that use a regression discontinuity approach to study the June 2002 release of letter grades
for schools in Florida. In addition to increasing student achievement, these papers find that
schools receiving a failing grade substantially altered instructional time, class schedules,
professional development and teacher training, and they increased expenditures on curriculum
development and technology. As in New York City, the Florida accountability system pledged
serious consequences for receiving a second failing grade. However, in contrast to Florida, New
York City released accountability grades to school principals in late September and made them
public in early November, arguably too late for schools to respond with major changes to
scheduling, curriculum, personnel, or technology, and too late for students or teachers to respond
2 See Medina, Jennifer and Elissa Gootman. 2007. “New York Schools Brace to be Scored, A to F.” New York
Times. November 4. (available at: http://www.nytimes.com/2007/11/04/education/04reportcard.html); Gootman, Elissa and Jennifer Medina. 2007. “50 New York Schools Fail Under Rating System.” New York Times, November 6. (available at: http://www.nytimes.com/2007/11/06/education/06reportcards.html); and Gootman, Elissa. 2007. “The Day After School Grades Come In, Parents Are Buzzing.” New York Times, November 7. (available at: http://www.nytimes.com/2007/11/07/education/07schools.html); all accessed January 13, 2010.

3
by moving to a different school.3 Our measures of student achievement are drawn from tests
administered in January (English Language Arts, hereafter English) and March (math), leaving
four to six months for school administrators to respond to their accountability grade.
Despite this limited time frame, we find that giving a school an F or D grade resulted in
significantly increased student achievement in math, and receipt of an F also increased
achievement in English. These effects are economically significant, but, consistent with the
short period we examine, they are smaller than those found in Florida. They are also smaller for
English than math, consistent with the fact that English exams were taken much earlier in the
school year. We also find complementary evidence that parents’ evaluations of school quality
rose significantly for schools receiving F and D grades.
While accountability pressure can lead to changes in measured student achievement
through a variety of mechanisms, we can rule out some noteworthy explanations. We find no
relationship between accountability grades and a student’s probability of being tested—one
measure of possible gaming—and no evidence that accountability grades affected course
offerings, consistent with the late grade announcement. However, the results from our analysis
of student surveys indicate that schools which received a low grade spent less time on group
work and “hands-on learning activities,” which may indicate closer alignment of instruction with
the high stakes math and English examinations. These results suggest the impacts we document
are driven by genuine changes in the education provided by schools receiving low grades.
The paper proceeds as follows. We describe New York City’s accountability system in
Section I. Section II describes the data and provides descriptive statistics. In Section III we
3 See Li Feng, Figlio, and Tim Sass (2009) for a study of how teacher mobility was affected by the 2002 Florida grade release. Another notable difference with New York City is that Florida gave additional funding to failing schools.

4
describe our empirical strategy and discuss results from graphical and regression analyses.
Section IV concludes.
I. School Progress Reports in New York City
While the No Child Left Behind Act (NCLB) placed school accountability at the
forefront of educational policy in the U.S., various states and cities have implemented their own
systems of accountability. NCLB outcomes are determined by the fraction of students in a
school (and within various subgroups) scoring above a proficiency threshold, and has been
criticized as a blunt measure of school quality that provides suboptimal incentives for schools to
increase student achievement. Motivated by perceived shortcomings with NCLB, the New York
City DOE implemented its own accountability system. In this paper, we focus on the central
piece of the system—school progress reports, which assigned schools a letter grade, ranging
from A to F, based on several continuous measures.
To determine accountability grades, each school was placed in one of four types
(elementary, middle, K-8, or high school) and, within each type, schools received scores based
on student achievement tests, attendance, and evaluations of the school environment from a set
of annual surveys given to students, parents, and teachers.4 The DOE calculated performance
within three separate elements of the progress report: school environment (15 percent of the
overall score), student performance (30 percent), and student progress (55 percent). The school
environment score was determined by responses to surveys of students (in grades 6 and above),
parents, and teachers, as well as student attendance rates. Student performance and progress
scores were based on achievement levels and changes in achievement as measured by statewide
4 Middle school structures are grades 5–8, 6–8, and 6–12 (excluding 9-12 graders), K-8 school structures are K–7, K–8, and K–12 (excluding 9-12 graders), and elementary school structures are all other combinations serving grades lower than 7. Different metrics were used to evaluate high schools, and we exclude them from our analysis.

5
math and English examinations.5 Schools also could receive “additional credit” for making
sizeable achievement gains among particular student subgroups: students with performance in
the lowest third of all students citywide who were Hispanic, Black, or other ethnicities, and
students in English Language Learner (ELL) or Special Education programs.6
A school’s score for each element (e.g., environmental) was determined both by that
school’s performance relative to all schools in the city of the same type and relative to a group of
“peer schools” with similar students.7 Performance relative to peer schools was given double the
weight of citywide relative performance. A school’s overall score was calculated using the
weighted sum of the scores within each element plus any additional credit received.
5 Each of the three categories contains four to six components. The environment score components are a school’s attendance rate and indices of school safety, academic quality, student engagement, and communication taken from an annual survey of parents, teachers, and students. The student performance components include the percentage of students achieving proficiency and the median English and math score on examinations given to all students in grades 3 to 8. The student progress components are the average change in individual students’ English and math scores, the average change in proficiency among all students in the school, and the average change in the proficiency of the lowest third of students, as determined by students’ prior year proficiency ratings. If a student transfers mid-year, the credit that the sending and receiving schools receive for his/her performance is determined by the portion of time a student spent at each school during the period between the current and previous state examinations. 6 To receive additional credit, the percentage of students within a subgroup whose achievement scores increased by “half of a performance level or more” must fall within the top 40 percent of all schools of its type (e.g., elementary, middle, or K-8 school) citywide. Performance levels, which range from 1 to 4.5, are simply a rescaled version of the scaled score. Overlap across student groups was allowed in these calculations. For example, if an ELL student was in the lowest third citywide, he/she would be counted in the calculation of additional credit for both groups. Additional credit was only given if the subgroup contained at least 20 students; if fewer than 20, Hispanic or Black students would be aggregated with students of other ethnicities. Schools received 0.75 additional points for having gains within a particular group that fell within the top 40 percent of schools of its type and an additional 0.75 points (for a total of 1.5) if the gains were within the top 20 percent. 7 Specifically, Elementary/K-8 schools received a “peer index” score ranging from 0 to 100 determined by the percentage of students eligible for free lunch (40 percent of the score), the percentage of students that are Black or Hispanic (40 percent), and the percent of the school categorized as Special Education students (10 percent) or English Language Learners (10 percent). Middle schools were assigned a peer index score ranging from 1 to 4.5 based on the average performance level received by currently enrolled students on their fourth grade state exams. Within each school type, schools were ordered according to their peer index and compared with the 20 schools just above and the 20 schools just below, thus each school was designated a unique peer group. Schools at either end of the distribution of the peer index scores were assigned a group of less than 40 schools – among the 985 schools we examine, 62 percent had a full group of 40 peer schools. All schools had at least 20 peer schools. In some cases, peer schools included charter schools. Charter schools that were at least two years old and had test score results for third and fourth graders received a progress report. However, accountability grades received by charter schools are not comparable with those received by other schools, as the environment category score was only based on attendance.

6
Within each school type, the DOE ranked schools by their pre-additional credit scores
and assigned each school a percentile. These percentiles were then used to determine the cutoff
scores between accountability grades for each type of school. The cutoff score to receive an A
was set at the 85th percentile, B at the 45th percentile, C schools at the 15th percentile, and D at
the 5th percentile. However, schools were assigned grades based on whether their overall score,
which included additional credit, exceeded these thresholds. Of the 985 schools we examine,
approximately 75 percent received additional credit. The impact of additional credit points was
not negligible – 161 schools received a higher grade due to additional credit. Of these schools, 6
moved from an F to a D, 22 moved from a D to a C, 57 moved from a C to a B, and 76 moved
from a B to an A. Thus, the percentage of schools receiving each accountability grade does not
precisely correspond to the original percentile cutoffs. Specifically, among the 985 schools we
examine, 23 percent received A’s, 38 percent received B’s, 26 percent received C’s, 9 percent
received D’s, and 4 percent received F’s. Figure 1 shows the relationship between accountability
grades and overall scores. There are clear discontinuities in the assignment of grades as we
move up the continuous distribution of overall scores.
[Figure 1 approximately here]
In addition to letter grades, each school was given a “quality review” score based on an
independent qualitative evaluation, in which the school was ranked as “Well Developed,”
“Proficient,” or “Undeveloped.” In the first year of the accountability program, these qualitative
evaluations were conducted by teams of external consultants and took place throughout the
school year 2006-2007. These reviews were used as secondary evidence, along with the letter
grades, in determining rewards and consequences for schools.

7
Figure 2 displays a timeline of events that occurred as the accountability system was
developed and implemented. Principals received progress reports on September 24th, 2007, and
reports were released to the general public on November 5th. However, principals first learned
about the progress report methodology in April of 2007. At this time, principals received a pilot
progress report with numeric scores based on achievement data from 2005 and 2006.
Nevertheless, these pilot reports used a different methodology (e.g., environmental scores were
not available) and lacked accountability grades. Thus, we believe it is highly unlikely that
schools could have predicted the grades they received in the fall of 2007 with the limited amount
of information they were given earlier that spring. Anecdotally, some principals receiving low
grades were quite surprised.8
[Figure 2 approximately here]
There are several reasons why accountability grades may create pressure for schools to
raise student achievement. First, the system generated consequences for schools performing
poorly. The DOE made it clear that schools receiving low grades could face leadership changes
or even closure. In December of 2007, the DOE announced that 7 of the 42 schools receiving F
grades and 2 of the 87 schools receiving D grades would be closed or phased out in the follow
year as a consequence of their performance, providing a clear signal to other recipients of low
grades that the threat of closure was credible.9 Notably, the accountability scores of the schools
facing closure did not fall at the bottom among those receiving F and D grades, and only half of
them received the lowest quality rating (“Undeveloped”). Thus, the threat of closure is likely to
8 See Medina and Gootman 2007 (available at: http://www.nytimes.com/2007/11/04/education/04reportcard.html), accessed January 13, 2010. 9 One of the schools we consider to have closed was reduced in size from serving grades 6-12 to only grades 9-12. Principals and teachers in schools that close do not face unemployment. They can search for another position within the district through normal channels, and, if not successful, teachers work as substitutes throughout the city and principals are assigned to serve as additional administrators in schools or central district offices.

8
have broadly affected all schools with low grades. Additionally, though we do not know if
principals were removed due to progress report grades, 17 percent of the F school principals and
12 percent of the D school principals (excluding schools facing closure) did not return in the
school year 2008-2009, relative to 9 percent of principals in schools receiving higher grades.
In addition to the possibility of principal dismissal or closure, students in F schools were
eligible to transfer out through a special application process in the summer of 2008, raising the
possibility of decreased enrollment and financial resources for F schools. Finally, all schools
receiving D or F grades were required to implement formal “school improvement measures and
target setting.” Schools receiving a C grade for three years also faced these consequences.
The system also linked financial rewards to accountability grades. While some
accountability systems (e.g., Florida’s system) offer additional funding for school improvement
to poor performing schools, F and D schools in New York did not receive any additional funds.
Schools that were granted an A grade and a “Well Developed” quality review rating received
additional funding for the following school year of roughly $33 per student, which can be used at
the school administrator’s discretion.10 These payments totaled $3.4 million in the school year
2007-2008. Schools that received an A or B grade and a “Well Developed” or “Proficient”
quality review rating were also eligible for payments of $1,500 to $3,000 per student per year for
any student accepted as a transfer from a school that received an F or a school not in good
standing under NCLB. Last, but not least, principals of schools with an overall score among the
10 Expenditure per pupil in the DOE for the school year 2005-2006 for general education students was $9,526 (see http://www.emsc.nysed.gov/irts/reportcard/2007/supplement/300000010000.pdf). Assuming 5 percent growth in spending, the $33 bonus would amount to a 0.3 percent budget increase.

9
top 20 percent citywide (within each type of school) and a “Well Developed” or “Proficient”
rating for their quality review were eligible to receive monetary bonuses of $7,000 to $25,000.11
The publicity surrounding the accountability grades likely generated additional pressure
(e.g., from parents) for schools receiving low grades to improve their performance. News reports
at the time provide a clear indication that the release of progress report grades captured the
attention of principals and parents alike, although reactions were mixed among both high and
low rated schools.12 Principals and parents worried that the progress reports put too much
emphasis on testing and did not accurately reflect their school’s quality, but also emphasized the
incentives for schools to “keep up” with peer schools. Although many found the methodology
involved with assigning grades complicated, the status of receiving a high grade and the
consequences attached to receiving a failing grade appeared to be quite clear.
II. Data
Our primary source of data is a set of publicly available files from the DOE website. The
first two files provide achievement test results from 2006 to 2008 at the school-grade cell level
for every school in the DOE serving grades 3 to 8. Students in these grades are tested annually
in English and math in accordance with NCLB. These data include the number of students tested
and the average scale score, by year and grade level.13 The third file from the DOE contains the
11 The progress reports released in November, 2007 did not result in bonuses; they were given out for the first time in the fall of 2008 and depended on progress reports based on 2007-2008 performance. The top 1 percent of all principals receives $25,000, the next 4 percent receives $17,000, the next 5 percent receives $12,000 and the next 10 percent receives $7,000. Assistant principals get half of the bonus that their principals receive. 12 See Medina and Gootman 2007 (available at: http://www.nytimes.com/2007/11/04/education/04reportcard.html); Gootman and Medina 2007 (available at: http://www.nytimes.com/2007/11/06/education/06reportcards.html); and Gootman 2007 (available at: http://www.nytimes.com/2007/11/07/education/07schools.html); all accessed January 13, 2010. 13 Scale scores are measured so that, under the assumptions of item response theory, they can be averaged across students in different grades to obtain a valid measure of group level achievement.

10
accountability grade assigned to each school, the overall score used to assign that grade, the
elements of the overall score, and the school’s NCLB status.
There are 1,092 elementary, K-8, and middle schools with 2008 student math and English
achievement data. We exclude 40 schools serving only disabled children and the 25 schools that
did not have math or English achievement data for the school year 2006-2007.14 Of the
remaining schools, an additional 42 did not receive an accountability grade for various reasons.
For example, one of these schools specializes in serving recent immigrants for one year, making
it impossible to measure changes over time in achievement for their students, while a number of
other schools were already in the process of closing. Our final sample consists of 985 schools,
representing 90 percent of the schools with 2007-2008 achievement data and 91 percent of the
total student population in grades 4 through 8.
We present summary statistics by accountability grade in Table 1. The distribution of
grades is similar across elementary, K-8, and middle schools. Relative to the city average,
enrollment is lower in schools receiving an F, D, or A grade, and the fraction enrolled in tested
grades (3-8) is also particularly low in F schools.15 We find that schools receiving an A are more
likely to be in good standing under the NCLB accountability system than schools receiving a B
or lower, yet there are no other noticeable differences in NCLB status by accountability grade
among schools not receiving an A.
[Table 1 approximately here]
14 Of these schools, 24 were not assigned accountability grades and the one school that did receive a grade did not have 2007 math achievement data. 15 There are two plausible reasons for this pattern. One is the fact that variance in test score outcomes will be greater for smaller populations of tested students (see Thomas J. Kane and Douglas O. Staiger (2002)), making them more likely to end up with either very high or low measured performance. However, compared to Kane and Staiger’s study, the schools in our sample are not small in an absolute sense – no school has an enrollment less than 100 students and the even F schools in the 25th percentile of enrollment served around 300 students. The second concern is that school size and/or grade composition are related to other characteristics that are indicative of high or low performance. Distinguishing between these explanations is beyond the scope of this paper.

11
To further characterize schools with different accountability grades, we merged the DOE
data with student level data from the school year 2006-2007 covering all students in grades 3 to
8. Higher accountability grades are associated with fewer students receiving free lunch, fewer
special education students, fewer black students, and more white and Asian students.
Interestingly, we see weaker relationships between accountability grades and the fraction of
Hispanic students and English Language Learner students.
The middle of Table 1 presents average student achievement outcomes by accountability
grade for the school years 2006-2007 and 2007-2008. As we might expect, 2006-2007
achievement outcomes increase monotonically with progress report grades. The gap between the
test score averages for A and F schools in 2006-2007 is 17.9 points in English and 23.8 points in
math. In the school year 2007-2008, the monotonic relationship between accountability grades
and test scores remains. However, while average test scores improved for schools receiving
every grade, the greatest improvements were made by schools receiving lower grades. The gap
between the test score averages for A and F schools shrank to 12.8 points in English and 19.1
points in math, and the standard deviation of achievement across schools fell from 17.2 to 15.3
points in English and from 21.2 to 19.5 in math. To give a better sense of this compression, we
plot kernel densities of school average scale scores by year (Figure 3). Test scores among
schools in New York improved at nearly every percentile in both subjects, but noticeably greater
gains were made at the bottom of the distribution.16
[Figure 3 approximately here]
These simple statistics do not necessarily indicate a causal relationship between
accountability grades and student achievement. Test scores are a noisy measure of achievement,
and we might expect considerable “regression to the mean” in school average performance
16 Distributions of test scores at the student level are quite similar, and can be found in the online appendix.

12
(Kane and Staiger 2002), i.e., schools receiving low grades may have only experienced a
temporary negative shock to test scores in the school year 2006-07. This is one of the
motivations for the regression discontinuity methodology we employ. Regression to the mean
will not bias our results as long as it is controlled for with a flexible continuous function of the
variables that determine school grades (Kenneth Y. Chay, Patrick J. McEwan, and Miguel
Urquiola 2005).
The bottom half of Table 1 shows the continuous metrics underlying the accountability
grade and quality review ratings. For ease of exposition, we normalize the peer indices within
school type to have a mean of zero and standard deviation of one, and reverse the sign of the
elementary and K-8 school peer indices (which are based on percentage of students by ethnicity
and program participation) so that they are positively correlated with school average
achievement levels. Not surprisingly, the average overall score and scores for the report
elements increase monotonically as we move from F to A. Schools receiving lower grades also
had lower peer indices, indicating that these schools served more disadvantaged students (for
elementary/K-8 schools) or students who had scored poorly on the achievement tests in the past
(for middle schools).17
III. Empirical Methods and Results
The empirical methods we employ are very much in the spirit of previous work on the
impacts of school accountability grades (e.g., Figlio and Maurice E. Lucas 2004, Rouse et al.
2007, Alejandra Mizala and Urquiola 2008) and other work using regression discontinuities to
17 To serve as a point of comparison, we also examined school characteristics according to NCLB status. As mentioned above, NLCB status is based on the same achievement tests but uses a very different formula, looking only at the percentage of students scoring above a passing threshold. We find that demographic differences between schools in good standing and those planning or currently in the process of restructuring are somewhat larger than those found when we examine schools receiving low and high accountability grades. Given that NCLB performance is based only on current performance, this finding is not surprising.

13
identify the impact of educational policies (e.g., Wilbert Van der Klaauw 2002, Jacob and Lars
Lefgren 2004, Chay, McEwan, and Urquiola 2005). We use the discontinuous relationship
between accountability grades and the numeric inputs that determine the grades to compare the
subsequent outcomes in schools that received different accountability grades but were otherwise
similar. When we compare schools that fall on either side of a grade cut-off, after controlling for
a flexible function of the factors used to determine grades, whether or not a school receives a
high or low grade is as good as randomly assigned.
To estimate this impact, we use a reduced form regression specification represented by
Equation 1.
(1) jtGjt fA εβλα +++= )( jt
G
jt PD
Here, Ajt is the average achievement of students in school j and year t, Djt is an indicator for the
accountability grade (G) assigned to the school, Pjt is a vector of the continuous measures used
to determine the accountability grade (i.e., environmental, performance, and progress scores,
additional credit, and peer index), and εjt is an idiosyncratic noise term. We include a quartic in
Pjt; including higher order polynomials does not noticeably change our results. Also, because the
accountability grade cutoffs and the scaling of the peer index differed across the three school
types, we include indicators for school type and interactions of school type with the quartic in the
continuous measures Pjt in all of our specifications. The estimated impact of accountability
grades on student achievement, λG, can be interpreted as causal under the assumption that,
conditional on all the factors used to determine a school’s grade, the assignment of grades is
exogenous and uncorrelated with the error term εjt.
One implication of using a regression discontinuity design is that there should be no
discontinuities in predetermined characteristics at the cut-offs between grades (Guido W. Imbens

14
and Thomas Lemieux 2009). Students’ demographic characteristics (race, poverty, special
education, and ELL status) and student absences from the prior year are well predicted by our
control function, but this is a weak test since these data were used to calculate the accountability
score elements which serve as our controls. We therefore also test for discontinuities in other
characteristics from the year prior to the assignment of accountability grades, including student
suspensions, school average class size, expenditures per student, and teacher characteristics
(experience, education, certification), and find no evidence that these characteristics vary
discontinuously at grade cut-offs. These results can be found in Table A1 of the Online
Appendix.
A. Graphical Analysis
Before proceeding to our regression analysis, we present a graphical depiction of our
estimation strategy in Figures 4 and 5. First, we plot school average math and English scale
scores against the overall accountability score received by each school, using different symbols
to distinguish schools that received different accountability grades. Then, we plot the residuals
from regressions of scale scores in math and English on inputs that determined the accountability
grade (i.e. peer index, report element scores, and additional credit). Specifically, we allow for a
quartic polynomial in each input and allow for different relationships within each type of school
(i.e., elementary, K-8, middle). To aid with interpretation, each graph includes a line tracing the
results of a locally weighted “Fan” regression (Jianqing Fan and Irene Gijbels 1997) that
provides a weighted average of performance at various levels of schools’ overall scores,
calculated separately within each group of schools that received the same grade. Breaks in the
locally weighted regression line at the margins between accountability grades indicate a change
in the performance of schools with similar overall scores but different grade assignments.

15
Figure 4 presents these graphs for 2006-2007 scale scores. As student performance
played a significant role in the calculation of grades, contributing 30 percent to the overall score,
it would not be surprising if the overall score and the raw scale scores were related. However,
we see some interesting and unexpected patterns. Scale scores in both subjects rise on average
between each of the five grades, but within grades, scale scores are increasing in overall score
only for schools receiving grades of F or D. For schools receiving C and A grades, the
relationship is fairly flat, and for schools receiving B grades there appears to be a slightly
negative relationship between scale scores and the overall accountability score. We also see
what appear to be significant breaks at every grade margin, which is unexpected. It is not clear
to us why these breaks would occur, though it may simply be an artifact of an interaction
between the manner in which grades were assigned and the cutoff values between grades, the
fact that there is a large amount of variance in average test scores among schools receiving very
similar overall accountability scores, and the relatively thin density of schools, especially among
those receiving lower grades. Given the manner in which the cutoffs were determined (i.e.,
based on percentiles) and the fact that no school was assigned a grade for which their overall
score did not warrant, we still regard the grade assignments as exogenous conditional on the
inputs into the overall score.
[Figure 4 approximately here]
The bottom panel of Figure 4 supports this notion. When we plot residuals from
regressions that control for the overall score inputs, we find essentially no differences between
schools receiving different grades, no noticeable trends within these groups of schools, and
(consequently) no major breaks at the margins between grades. Thus, when we control for the
inputs used in assigning grades, the actual letter grades received by schools have no predictive

16
power for 2006-2007 test results. The only detectable difference at any margin is found between
F and D schools, where average scores for D schools are slightly higher.
Figure 5 displays the same information but using 2007-2008 scale scores. The graphs of
raw scores in the top panel show the same noticeable differences in average test scores, trends
(both positive and negative), and breaks at the margin that were seen in the prior year. However,
the bottom panel, which plots the residuals, looks quite different. For math scores, we can see
noticeably higher test scores for F and D schools, and breaks at the F-D and D-C grade margins,
but no differences or breaks at the margins for C, B, and A schools. For English scores, we see
higher scores among F schools and a break at the F-D margin, with no differences or breaks at
the higher grades. These results indicate a positive impact on both English and math scores for
schools on the margin of receiving an F and a D, and for math results, a positive impact for
schools on the margin of receiving a D and a C. These graphs at the bottom panel of Figure 5
represent our essential findings. In the next section we present evidence from regression analysis
that provides point estimates and standard errors on the qualitative findings from these graphs.
[Figure 5 approximately here]
B. Regression Estimates of Impacts on Average Test Scores
In this section, we present results of regression specifications in the form of Equation 1.
School average scale scores are regressed on indicators for accountability grade and the inputs
that determined the overall score and regressions are weighted by the number of students taking
math and English tests, respectively. In Table 2, we first present results that examine test scores
from the school year 2006-2007. We expect to find no significant differences in scale scores
across grades conditional on the inputs for the overall score. This is confirmed by the data; none

17
of the indicator variables for grade are statistically significant, and tests for the equality of the
coefficients between adjacent grades cannot be rejected (Table 2, Columns 1 and 2).
[Table 2 approximately here]
We see very different results when we examine test scores from 2007-2008. As
foreshadowed by our graphical analysis, we find significantly higher test scores for F and D
schools in math and F schools in English, conditional on our flexible controls for overall score
inputs. A test of equality between the D and F coefficients can be rejected at the 3 percent level
for math and the 8 percent level for English (Columns 3 and 6).
The remaining columns in Table 2 provide two additional specifications. The first
includes a quadratic polynomial of the school’s prior average scale score as additional control
variables. While this steps outside the set of variables that directly enter the accountability grade
calculation, it further controls for any pre-existing differences between schools receiving
different grades. One might be concerned in this regard given that in the 2006-2007 test score
regressions we find positive, though statistically insignificant, coefficients for F and D schools.
Although adding these controls (Columns 4 and 7) causes a small reduction in the point
estimates, it does not affect the significance of our initial findings that schools receiving F and D
grades experienced an improvement in test scores. In fact, the addition of these controls reduces
the standard errors considerably, and the negative point estimate for schools that received an A is
now marginally significantly different than schools that received a B for both math and English
performance (at the 7 and 9 percent level, respectively), suggesting that schools assigned a grade
of B improved their scores relative to A schools.
The final specification drops a small number of schools that received an overall score
either well below or well above the rest of the schools. Specifically, we drop 10 schools with an

18
overall score below 15 or above 90 (more than two standard deviations from the average overall
score; these include 5 A and 5 F schools). This has little impact on the results. Taking the point
estimates from this final specification, we estimate that receipt of an F grade increased math and
English scores by 2.1 and 1.8 scale score points, respectively, relative to a receiving a D, and that
receipt of a D grade increased math scores by 2.1 scale score points (relative to a C). We also
find some suggestive evidence that receipt of a B may have increased math and English scores
by 1.3 and 0.8 points, respectively, relative to schools receiving an A.
There are several ways we can gauge the magnitudes of these effects. First, we can
compare the effects we find to the citywide standard deviation of changes in school average scale
scores from 2007 to 2008, which were 5.7 points in math and 4.8 points in English. Thus, the
impact of receiving an F, relative to a D, increased scores in math and English by nearly 0.4
standard deviations on this distribution, with a similar impact of receiving a D, relative to a C, on
math scores. Second, note that the difference in average scale scores between C schools and F
schools was approximately 11.8 points in math and 9 points in English. The gaps between A and
D schools are roughly the same: 13.2 points in math and 9.6 points in English. Thus, our
estimates suggest that the short run impact on achievement of students in schools receiving F
grades was about 18 percent and 20 percent of the C-F gap in math and English, respectively.
Additionally, the impact on D schools was about 16 percent of the A-D gap in math.
Finally, we can also judge these effects as the fraction of a student level standard
deviation. The standard deviations of math and English in 2008 were roughly 40 and 35 scale
score points, respectively. Thus, the increases in math test scores for F and D schools (relative to
C schools) were 0.1 and 0.05 standard deviations, while the increase in English test scores for F
schools (relative to D schools) was 0.05 standard deviations. These magnitudes are somewhat

19
smaller than the estimated impact of receiving an F grade in the state of Florida on student
performance one year later, though this is consistent with shorter amount of time between the
announcement of the grades and test administration. Nevertheless, the effects we find are
economically significant and of similar magnitude to other estimates of how improvements in
school quality affect student achievement, such as attending a school with higher achievement
levels (Caroline M. Hoxby and Gretchen Weingarth 2005, Hastings and Jeffrey M. Weinstein
2008, and Hastings, Kane, and Staiger 2009) or being assigned a highly experienced teacher
(Kane, Jonah E. Rockoff, and Staiger 2008).18 Nevertheless, it is also important to note the
possibility that the accountability system induced test score increases at low performing schools
through the teaching of test-taking skills, rather than a true increase in the quality of math or
English instruction.19
One might hypothesize that the impact of accountability grades might vary across schools
with different characteristics. In several specifications we allow the estimated impact of grades
to differ by school characteristics: whether a school is passing under NCLB, grade structure (i.e.,
middle schools vs. elementary and K-8 schools), whether the school’s prior average test score
was below the citywide median, and whether the proportion of free lunch recipients was above
18 Hoxby and Weingarth (2005), Hastings and Weinstein (2008), and Hastings, Kane, and Staiger (2009) estimate that moving elementary or middle school students to a school whose average test scores are a student-level standard deviation higher is expected to raise their test scores by about 0.15 to 0.5 standard deviations. To put this result into context, the gap in average achievement between F and C schools in New York is about 0.25 student level standard deviations in math, implying that moving students from F schools to C schools would raise their achievement by 0.04 to 0.12 standard deviations in expectation. Using data from New York City, Kane, Rockoff, and Staiger (2008) find that elementary and middle school students assigned a highly experienced teacher (as compared to a rookie) are expected to have 0.08 student level standard deviations higher math achievement. 19 A randomized evaluation of a short-run preparation program for the Scholastic Aptitude Test (Donald L. Alderman and Donald E. Powers 1980) indicates an effect on SAT Verbal scores of roughly 0.08 standard deviations.

20
the median level. However, we find no evidence that our results are driven by any of the other
subgroups of schools.20
C. Robustness Checks
The regressions discussed above are weighted by student enrollment because the use of
average test scores as our dependent variable is likely to create heteroskedasticity of a particular
form. If the effects of accountability grades on achievement and other outcomes are
homogenous across students, estimates obtained from weighted regressions will be efficient.
However, to be sure that the weights are unimportant to our findings, we present results from
unweighted regressions (Table 3, Columns 3 and 4) that are quite similar.
Our analysis includes nine schools that received F or D grades and, because of their
performance, were told in December of 2007 that they were to be closed or phased out after the
end of the school year 2007-2008. These schools did not face any threat of further consequences
and thus were likely not as responsive to receiving low grades as other schools. Although none
of the schools that were closed were among the schools closest to the D/F margin, one still might
be concerned if our results were substantially driven by test score changes in these schools. We
therefore repeat our analysis dropping these schools from our sample. We generally find slightly
larger point estimates for the impact of accountability on student achievement in F and D schools
(Table 3, Columns 5 and 6), suggesting that, if anything, the response among F and D schools
was indeed greater among those not facing imminent closure.
[Table 3 approximately here]
In Table 3, we address the additional concern that the extra credit received by schools
making large gains with particular student subgroups was awarded in a way that affects our
20 These results are shown in Table A2 in the Online Appendix.

21
results. Although we doubt this possibility, one might speculate that the DOE calculated extra
credit in order to move schools with politically connected administrators over a cut-off. In order
to investigate whether the provision of extra credit is driving our results, we re-estimate our basic
specification using an instrumental variables strategy where we predict accountability grades
based on scores that do not include extra credit (Table 3, Columns 7 and 8). The standard errors
in the two stage procedure—which are corrected for sampling error in the first stage via
bootstrapping—are somewhat larger, and the result on English scores for F schools is only
significant at the 18 percent level. However, the point estimates from these regressions are quite
close to those from the OLS regressions.
We also examine if our results are robust to narrowing the range of observations used to
estimate the impact of receiving a low accountability grade. Since only a small number of
schools received an F, we calculate pooled estimates of the impact of receiving a lower
accountability grade on math scores using both the F/D and D/C discontinuities. To do so, we
first take schools receiving D grades and divide them into two groups based on whether their
score places them below or above the median for their grade and school type (i.e., elementary,
middle, or K-8 schools). Schools in the lower half of the D distribution serve as comparisons
with F schools, and schools in the upper half of the D distribution serve as comparisons with C
schools. In Table 4, we present estimates that limit the sample to schools within specific
distances from the discontinuities. First, we use a cut-off of 10 points, which includes all of the
D schools and most of the F schools, and then we use much smaller cut-offs (3 points and 2
points) which dramatically decrease our sample size. The estimates for the three samples range
between 1.7 and 2 scale score points. The estimates for cut-offs of 10 and 3 points are both
statistically significant (the estimate for a cut-off 2 points has a p-value of 0.17), and we cannot

22
reject a test of the equality of these coefficients with our main estimates of the impact of
receiving and F (relative to a D) or a D (relative to a C) of about 2.8 scale score points.21
[Table 4 approximately here]
D. Student Testing and Mobility
As mentioned earlier, previous researchers have shown that schools may try to game
accountability systems (e.g., Figlio and Winicki 2005, Cullen and Reback 2006, Figlio 2006, and
Figlio and Getzler 2006). While we cannot address all potential concerns regarding this issue,
we test whether accountability grades are associated with the portion of students taking math and
English tests to address the possibility that schools removed students from the pool of test takers
in response to accountability pressure. We note, however, that the scope for removing students
from testing is limited by NCLB, which mandates that at least 95 percent of students in each of a
number of student subgroups be tested.
There is little relationship between the percentage of students tested and a school’s
accountability grade (Table 1). However, we formally address this possibility by running
regression specifications as above with percentage tested as the dependent variable (Table 5).
We find no significant differences in the percentage of students tested by accountability grade,
either in 2007 or 2008, once we control for continuous functions of the report elements, and the
point estimates are very small (less than 1 percentage point) and precisely estimated. Results (not
reported) are very similar if we control for the percent tested in the prior school year. Thus,
while we cannot rule out other forms of gaming, we find no evidence that schools receiving low
accountability grades excluded more students from testing.
21 Specifically, we test for the equality of the point estimates presented in Table A4 with the average of the difference between the F and D coefficients and the D coefficient in column 3 of Table 2. All of the point estimates in Table 4 fall easily within the 95 percent confidence interval of this estimate.

23
[Table 5 approximately here]
Another important issue is student mobility. One might worry that the variation in test
scores we attribute to accountability grades is driven by lower achieving students transferring out
of schools that received a low grade. However, the public announcement of grades in November
2007 and the delay of formal transfers from F schools until the summer of 2008 meant that any
student transfers in response to accountability grades would need to be initiated by a residential
move and occur in the middle of the school year. Such moves are likely to be viewed by parents
as costly and highly disruptive (see Eric A. Hanushek, John F. Kain, and Steven G. Rivkin
2004). Second, we can observe whether students are present in the same school in both the fall
and spring. A very small percentage of students change schools or exit the district in the middle
of the school year, and we find no relationship between grades and mid-year school changes.
E. Outcomes from School Environment Surveys
We are fortunate in that the DOE surveyed teachers, parents, and students (in grades 6
and higher) as part of the new accountability system, asking them a series of questions focused
on four broad areas: academics, safety, engagement, and communication.22 In both 2007 and
2008, surveys were completed after student testing in English and math but prior to the release
of test score results for the year. Surveys were confidential for parents and students and
anonymous for teachers, and were collected and analyzed by an external entity contracted by the
DOE. 23 All survey questions had multiple choice answers. For example, students were asked
for their agreement with statements such as “my school is kept clean” on a 4 point scale ranging
22 Information on the surveys including the complete survey instruments and guides to how they were scored can be found online at http://schools.nyc.gov/Accountability/SchoolReports/Surveys/default.htm. The “educator’s guides” provided on this site contain information on the specific question items used in constructing the domain scores. 23 Parent surveys were distributed to elementary students to be taken home, while middle and high school parents received their surveys by mail. Teacher surveys were distributed in school and students took their surveys during class time. Parents and teachers returned their completed surveys in pre-addressed, postage-paid envelopes, while schools collected student surveys. Parents and teachers also could complete their surveys online.

24
from “Strongly Disagree” to “Strongly Agree.” Scores in each domain and scores on each
question range from 0 to 10, but we normalize these variables to have a mean of 0 and standard
deviation of 1 for ease of interpretation, within each school level.24
In this section, we first examine the relationship between accountability grades and a
school’s score for each of the four domains, and then proceed to examine individual questions or
small groups of questions that focus on particular mechanisms through which schools behaviors
may have affected student test scores.25 Two sets of questions were directed to all three
respondent groups. First, they were asked whether high expectations were set for students,
which reflects a common belief among educators (and some work by economists, see Figlio
(2005)) that setting high expectations is helpful in raising student achievement. All groups were
also asked whether the school offered courses in art, music, dance, theater, foreign language, and
computer skills/technology, which addresses a concern that high stakes accountability systems
cause schools to shift resources away from teaching material that may be beneficial to students
but is not tested.26 The remaining questions we examine were selected because they addressed
particular mechanisms via which schools with low accountability grades may have improved
performance.27
24 There are a few instances where we scale responses differently than the DOE. When respondents marked “don’t know” or “does not apply,” the DOE sometimes assigned half of the total possible score. This convention may not be neutral and we therefore treat these responses as missing values. Second, for questions related to offering of classes and activities in non-tested subjects (e.g., art, music) and questions to students related to frequency of certain assignments and teaching methods, the DOE assigned scores in a non-linear way (e.g., maximum points were awarded for both of the top two answer choices). We make the scoring linear; responses to a question with N answer choices are coded as having values 1 to N. 25 See Table A3 in the Online Appendix for a complete accounting of where these questions are located in the environmental surveys. 26 Rouse et al. (2007) find evidence that failing schools offer extra help to struggling students and lengthen instructional time. Unfortunately, these issues were not focused on in the DOE surveys. One item asked about the offering of tutoring/enrichment activities before or after school, but the wording of the question inextricably ties tutoring with enrichment; while the former typically targets struggling students, the latter might apply to all students or advanced students. Indeed, responses to this question are highly correlated with offering of foreign languages. 27 For parents, we examine overall satisfaction with the quality of their child’s teacher and their overall satisfaction with the quality of their child’s education. For teachers, we examine the extent to which administrators focus on

25
Summary statistics on survey outcomes are shown in Tables 6 and 7. Response rates for
all three groups of respondents were fairly low in 2007, particularly among parents, and response
rates grew in 2008, with somewhat larger increases among respondents from with schools
receiving low accountability grades, again, particularly among parents. Our data on parent and
student survey outcomes allow us to limit our analysis to individuals who responded to the
survey in both years, but we cannot control for the composition of respondents among teachers.
Thus, response rates are important for considering how results on teacher surveys should be
interpreted, and we return to this issue below.
[Table 6 approximately here]
Nearly all of the 2007 outcomes improve considerably and monotonically as we move
from F to A schools. In most cases, schools receiving an F grade had scores close to 0.5 standard
deviations below average, while schools receiving an A grade tended to score about 0.3 standard
deviations above average. While some of this relationship is mechanical (10 percent of the
overall score determining accountability grades were based on these survey results), these results
strongly suggest that survey responses are also highly correlated with the student achievement
outcomes (levels and growth) that largely determine the accountability grade. However, the
parent and teacher survey results for schools receiving low accountability grades improved,
sometimes dramatically, between 2007 and 2008. For instance, overall parental satisfaction with
their child’s education increased considerably for schools that received an F grade but was
virtually unchanged for schools that received an A grade between 2007 and 2008.
[Table 7 approximately here]
teacher quality issues, the extent to which student achievement data is used to direct instruction. For students, we examine two sets of questions. The first set address the frequency with which students were asked to complete essays or projects using “multiple sources of information” or “evidence to defend [their] opinion[s] or ideas.” The second set address the frequency with which students “worked in groups of 2 to 6,” “had whole-class discussions,” or “participated in hands-on activities such as science.”

26
Our analysis of parent and student survey outcomes uses only individuals who responded
to the survey in both years. This ensures that any changes in evaluations of school environment
are not driven by sample selection, though our findings are similar without this restriction. There
are two schools in which no parents answered the survey in both years; however, these schools
received grades of C and B, respectively, and estimates of test score impacts are very similar
when these schools are excluded. Estimates using data from student surveys exclude schools
that did not have students in grades 6 through 8; however our main results are robust to this
sample restriction as well. All schools received surveys from some teachers, but we cannot link
surveys across years and therefore present results using all respondents. Thus, any significant
results on teacher surveys may be driven by changes in the pool of teachers responding to the
survey, and should be interpreted with caution.
We present results on 2008 survey outcomes using specifications that drop extreme
accountability scores and include a quadratic polynomial of the school’s survey outcome in
2007. These controls do not greatly affect point estimates but noticeably reduce the standard
errors. For teacher survey outcomes, we also present specifications that control for a quartic in
the school’s response rate. While this is not by any means a foolproof way of removing possible
endogeneity, it provides useful information on the potential importance of this source of bias.
We see consistent evidence of significant improvement in parental satisfaction in the
schools that received F and D grades (Table 8). For all four domain scores, the overall quality of
education, teacher quality, and holding high expectations for students, the coefficient estimates
for these grade indicators are positive and significant at conventional levels. The coefficient on
receiving an F is larger for all outcomes, though it is only statistically significantly different than

27
the D coefficient for the academic domain score and parents’ assessment teacher quality.28
Parents’ views on the extent of course offerings in non-tested subjects were not significantly
related to the accountability grades. Thus, parental survey evidence indicates a strong positive
reaction to changes made by schools that received low accountability grades.29
[Table 8 approximately here]
Interestingly, the results for parents are not replicated among (older) elementary and
middle school students (Table 9). The estimated coefficient on receipt of an F grade is negative
in all specifications and (marginally) significant for three of the four domains, the frequency of
essays/projects, the frequency of group/hands-on activities, and whether the school holds high
expectations for students. The coefficients on receipt of a D grade are also significant and
negative for the communication domain, frequency of essays/projects and frequency of
group/hands-on activities.30 Thus, older students in schools receiving a low accountability grade
appear to be unhappy with some of changes put into place at their schools after the accountability
grades were received. In particular, they perceive that their schools moved away from their
preferred instructional methods (e.g., group discussions, hands-on activities, research projects)
and lowered their expectations for student performance. Again, we do not find evidence that
schools reduced course offerings or activities in non-tested subjects.
[Table 9 approximately here]
28 For the academic domain score and parents’ assessment teacher quality, we also find significant negative coefficients on indicators for receiving B and A grades, with significantly larger coefficients (in absolute value) on the A grade indicator. This suggests that receipt of a grade other than D or F may have also affected the perceived quality of teaching, though we see no effects on test scores. 29 Even with a balanced panel, it is possible that parents in schools receiving low accountability grades misstated their opinions in order to increase their school’s score on the environmental portion of the progress report and avoid costs associated with continued low performance (e.g., school closure). In order to investigate this possibility, we replicate our analyses using only parents whose children are in a school’s terminal grade, since they are likely to have much weaker incentives to make the school appear more effective. The coefficient estimates (available upon request) on F and D grades remain significant and increase in magnitude, lending support to the idea that the parent survey results reflect real changes in opinion. 30 The questions relating to the frequency of group work or hands-on learning activities comprised half of the questions related to the communications domain score.
28
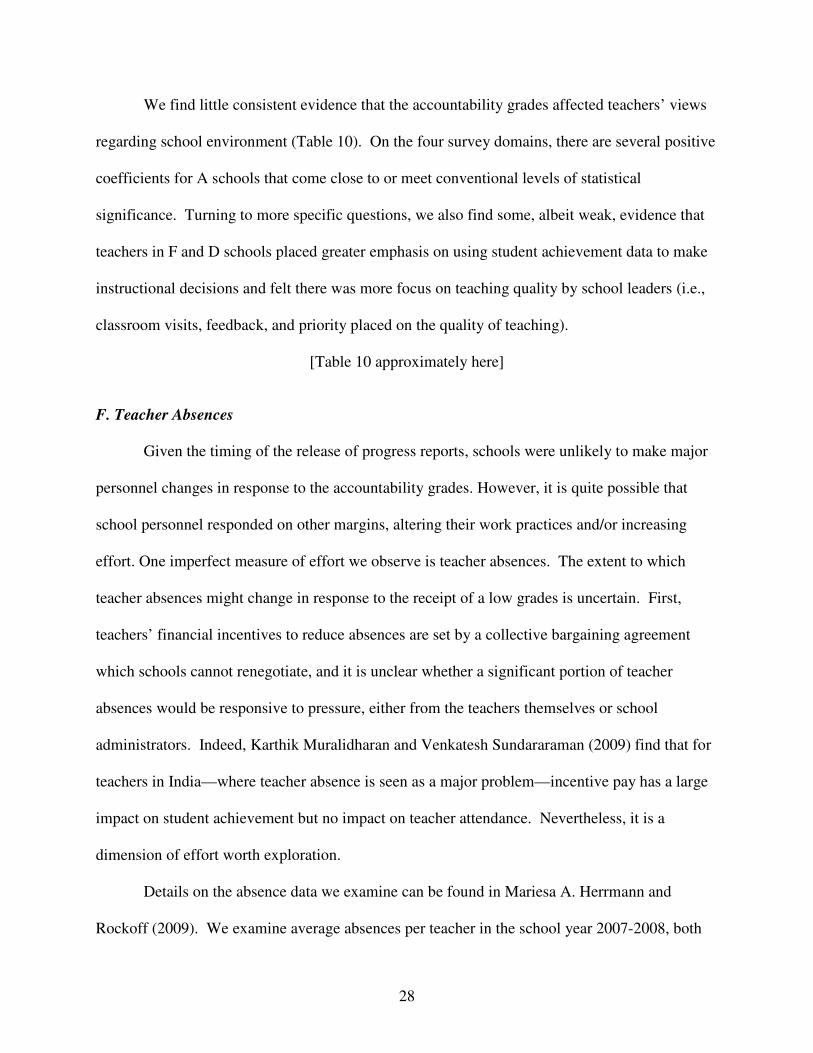
We find little consistent evidence that the accountability grades affected teachers’ views
regarding school environment (Table 10). On the four survey domains, there are several positive
coefficients for A schools that come close to or meet conventional levels of statistical
significance. Turning to more specific questions, we also find some, albeit weak, evidence that
teachers in F and D schools placed greater emphasis on using student achievement data to make
instructional decisions and felt there was more focus on teaching quality by school leaders (i.e.,
classroom visits, feedback, and priority placed on the quality of teaching).
[Table 10 approximately here]
F. Teacher Absences
Given the timing of the release of progress reports, schools were unlikely to make major
personnel changes in response to the accountability grades. However, it is quite possible that
school personnel responded on other margins, altering their work practices and/or increasing
effort. One imperfect measure of effort we observe is teacher absences. The extent to which
teacher absences might change in response to the receipt of a low grades is uncertain. First,
teachers’ financial incentives to reduce absences are set by a collective bargaining agreement
which schools cannot renegotiate, and it is unclear whether a significant portion of teacher
absences would be responsive to pressure, either from the teachers themselves or school
administrators. Indeed, Karthik Muralidharan and Venkatesh Sundararaman (2009) find that for
teachers in India—where teacher absence is seen as a major problem—incentive pay has a large
impact on student achievement but no impact on teacher attendance. Nevertheless, it is a
dimension of effort worth exploration.
Details on the absence data we examine can be found in Mariesa A. Herrmann and
Rockoff (2009). We examine average absences per teacher in the school year 2007-2008, both

29
during the entire year and only during the period from October (after grades were released to
principals) through March (when math tests were taken). As some absences are likely to be
more responsive to accountability pressure than others, we do not examine absences for jury or
military duty, death of a family member, or personal injury, but rather focus on absences taken
for illness, personal leave, and other reasons over which a teacher has some control (e.g.,
religious holidays, conferences). We find no evidence that the accountability grades had a
significant effect on teacher absences; these results are presented in Table A4 of the Online
Appendix. Thus, the increases in student achievement and parental satisfaction for schools
receiving low accountability grades were likely caused by changes in on-the-job behaviors of
teachers and administrators, not by changes in the frequency of teacher absence.
IV. Conclusion
The results of our analysis suggest that the new accountability system put in place in New
York City had important effects in the months that followed its launch in the fall of 2007. Math
and English test scores improved in schools that received very low accountability grades. For
example, we estimate that the impact of attending an F school (as compared to a C school) on
students’ math test scores was roughly 0.1 student-level standard deviations. Our use of the
discontinuous assignment of accountability grades supports the notion that our analysis provides
causal estimates of the impact of accountability on student academic achievement and is not
confounded by a spurious relationship between grade assignment and other factors affecting
student performance.
We provide additional insight into the impact of accountability pressure on low
performing schools by examining a set of complementary outcomes using surveys of parents,
teachers, and students. The student survey results indicate that schools may have achieved test

30
score improvements through greater use of direct instructional methods and basic skills
assignments (as opposed to group discussions, essay writing, or research projects) designed to
raise test scores. However, while students appear unhappy with this shift, parents of children in
F and D schools show considerable increases in their satisfaction with the quality of their schools
and teachers, consistent with the notion that focusing on tested material may be optimal for
students who are less advanced (Edward P. Lazear 2005).
These results suggest that accountability pressure can induce improvements in student
achievement over a short period of time, notably without manipulation of the pool of tested
students or reductions in course offerings of non-tested subjects. Moreover, accountability
pressure may spur actions by schools that parents support but students do not like, such as
greater focus on teaching basic skills covered on standardized exams. However, many questions
remain regarding how variation in the type and severity of accountability incentives impact the
behavior of principals and teachers. For example, is the stigma of an “F” or the possibility of
being fired the crucial factor in motivating principals of poor performing schools? Are financial
bonuses more effective if paid to principals, teachers, or the students themselves? More research
is needed on these and other questions regarding behavioral responses to incentives generated by
accountability.

31
References
Alderman, Donald L. and Donald E. Powers. 1980. “The Effects of Special Preparation on SAT-Verbal Scores.” American Educational Research Journal, 17(2): 239–251.
Chay, Kenneth Y., Patrick J. McEwan, and Miguel Urquiola. 2005. “The Central Role of
Noise in Evaluating Interventions That Use Test Scores to Rank Schools.” American
Economic Review, 95(4): 1237–1258. Chiang, Hanley. 2009. “How Accountability Pressure on Failing Schools Affects Student
Achievement.” Journal of Public Economics, 93(9-10): 1045–1057. Cullen, Julie B. and Randall Reback. 2006. “Tinkering Toward Accolades: School Gaming
Under a Performance Accountability System.” In Advances in Applied Microeconomics,
Volume 14, ed. Timothy J. Gronberg and Dennis W. Jansen, 1–34. Oxford: Elsevier. Fan, Jianqing and Irene Gijbels. 1997. Local Polynomial Modeling and its Applications.
London: Chapman and Hall. Feng, Li, David Figlio, and Tim Sass. 2009. “School Accountability and Teacher Mobility.”
http://www.econ.wisc.edu/~scholz/Seminar/Figlio.pdf. Figlio, David N. 2005. “Names, Expectations, and the Black-White Test Score Gap.” National
Bureau of Economic Research Working Paper 11195. Figlio, David N. 2006. “Testing, Crime, and Punishment.” Journal of Public Economics, 90(4-
5): 837–851.
Figlio, David N. and Lawrence S. Getzler. 2006. “Accountability, Ability, and Disability: Gaming the System?” In Advances in Applied Microeconomics, Volume 14, ed. Timothy J. Gronberg and Dennis W. Jansen, 35–49. Oxford: Elsevier Science Press.
Figlio, David N. and Maurice E. Lucas. 2004. “What's in a Grade? School Report Cards and the Housing Market.” American Economic Review, 94(3): 591–604
Figlio, David N. and Cecilia E. Rouse. 2006. “Do Accountability and Voucher Threats Improve
Low-Performing Schools?” Journal of Public Economics, 90(1-2): 239–255. Figlio, David N. and Joshua Winicki. 2005. “Food for Thought? The Effects of School
Accountability Plans on School Nutrition.” Journal of Public Economics, 89(2-3): 381–394.
Hastings, Justine S., Thomas J. Kane, and Douglas O. Staiger. 2009. “Heterogeneous
Preferences and the Efficacy of Public School Choice.” http://aida.econ.yale.edu/~jh529/papers/HKS_Combined_200806.pdf.

32
Hastings, Justine S. and Jeffrey M. Weinstein. 2008. “Information, School Choice, and Academic Achievement: Evidence from Two Experiments.” Quarterly Journal of
Economics, 123(4): 1373–1414. Hanushek, Eric A., John F. Kain, and Steven G. Rivkin. 2004. “Disruption Versus Tiebout
Improvement: The Costs and Benefits of Switching Schools.” Journal of Public
Economics, 88(9-10): 1721–1746. Herrmann, Mariesa A. and Jonah E. Rockoff. 2009. “Work Disruption, Worker Health, and
Productivity: Evidence from Teaching.” http://www0.gsb.columbia.edu/faculty/jrockoff/herrmann_rockoff_teaching_disruptions_oct_09.pdf
Hoxby, Caroline M. and Gretchen Weingarth. 2005. “Taking Race Out of the Equation:
School Reassignment and the Structure of Peer Effects,” Unpublished. Imbens, Guido W. and Thomas Lemieux. 2009. “Regression Discontinuity Designs: A Guide
to Practice.” Journal of Econometrics, 14(2), 615–635. Jacob, Brian A. 2005. “Accountability, Incentives and Behavior: the Impact of High-stakes
Testing in the Chicago Public Schools.” Journal of Public Economics, 89(5-6), 761–796. Jacob, Brian A. and Lars Lefgren. 2004. “Remedial Education and Student Achievement: A
Regression-Discontinuity Analysis.” Review of Economics and Statistics, 86(1): 226–244.
Jacob, Brian A. and Steven D. Levitt. 2003. “Rotten Apples: An Investigation of the
Prevalence and Predictors of Teacher Cheating.” Quarterly Journal of Economics, 118(3), 843–877.
Kane, Thomas J. and Douglas O. Staiger. 2002. “The Promise and Pitfalls of Using Imprecise
School Accountability Measures.” Journal of Economic Perspectives, 16(4): 91–114 Kane, Thomas J., Jonah E. Rockoff, and Douglas O. Staiger. 2008. “What Does Certification
Tell us about Teacher Effectiveness? Evidence from New York City.” Economics of
Education Review, 27(6): 615–631. Krieg, John M. 2008. “Are Students Left Behind? The Distributional Effects of the No Child
Left Behind Act.” Education Finance and Policy, 3(2), 250–281. Lazear, Edward P. 2005. “Speeding, Tax Fraud, and Teaching to the Test.” National Center for
Research on Evaluation, Standards, and Student Testing, Report 659. Mizala, Alejandra and Miguel S. Urquiola. 2008. “School Markets: The Impact of Information
Approximating Schools’ Effectiveness.” http://www.columbia.edu/~msu2101/MizalaUrquiola(2008).pdf.

33
Muralidharan, Karthik and Venkatesh Sundararaman. 2009. “Teacher Performance Pay:
Experimental Evidence from India.” National Bureau of Economic Research Working Paper 15323.
Neal, Derek A. and Diane Whitmore Schanzenbach. Forthcoming. “Left Behind By Design:
Proficiency Counts and Test-Based Accountability.” Review of Economics and Statistics.. Reback, Randall. 2008. “Teaching to the Rating: School Accountability and the Distribution of
Student Achievement.” Journal of Public Economics, 92(5-6): 1394–1415. Rouse, Cecilia E., Jane Hannaway, Dan Goldhaber, and David N. Figlio. 2007. “Feeling the
Florida Heat? How Low-Performing Schools Respond to Voucher and Accountability Pressure.” National Bureau of Economic Research Working Paper 13681.
Van der Klaauw, Wilbert. 2002. “Estimating the Effect of Financial Aid Offers on College
Enrollment: A Regression–Discontinuity Approach.” International Economic Review, 43(4): 1249–1287.

F D C B A
Number of Schools 42 87 259 371 226
Type of School
Elementary 59.5% 58.6% 59.8% 60.1% 56.2%
K-8 11.9% 9.2% 12.0% 12.4% 11.5%
Middle 28.6% 32.2% 28.2% 27.5% 32.3%
Enrollment 518 622 681 717 635
% of Enrollment in Grades 3-8 56.4% 61.5% 64.5% 64.4% 64.0%
NCLB Status
Restructuring 11.9% 16.1% 15.1% 14.4% 9.3%
Needs Improvement 16.7% 14.9% 14.7% 16.3% 11.6%
In Good Standing 71.4% 69.0% 70.2% 69.4% 79.1%
Student Characteristics
% Free Lunch 76.7% 77.7% 67.2% 68.9% 67.6%
% Special Education 10.9% 10.3% 10.4% 8.5% 7.7%
% English Language Learner 9.8% 11.6% 11.4% 13.0% 12.6%
% Black 44.9% 44.6% 37.9% 32.4% 27.3%
% Hispanic 40.7% 40.8% 37.3% 39.9% 42.9%
% White 9.7% 9.6% 15.1% 14.2% 13.1%
% Asian 4.1% 4.4% 9.1% 13.0% 16.1%
Test Score Outcomes '06-'07
Average Scale Score English 641.8 644.7 650.8 654.3 659.7
Above Median English Score 23.8% 25.3% 44.0% 53.1% 66.4%
% Students Tested in English (Grades 3 - 8) 93.7% 95.1% 94.4% 95.0% 94.7%
Average Scale Score Math 653.5 657.3 665.3 670.5 677.2
Above Median Math Score 19.0% 23.0% 42.5% 54.4% 67.7%
% Students Tested in Math (Grades 3 - 8) 94.5% 96.3% 96.0% 96.6% 96.3%
Test Score Outcomes '07-'08
Average Scale Score English 648.4 648.8 654.1 656.9 661.2
Above Median English Score 23.8% 28.7% 45.2% 54.2% 61.9%
% Students Tested in English (Grades 3 - 8) 97.0% 97.1% 96.9% 97.2% 97.5%
Average Scale Score Math 662.0 664.2 669.9 675.3 681.1
Above Median Math Score 23.8% 25.3% 41.3% 53.9% 68.1%
% Students Tested in Math (Grades 3 - 8) 98.0% 98.3% 98.4% 98.8% 98.9%
Progress Report Scores
Overall Score 23.0 35.0 44.9 56.5 72.1
Environment Score 4.9 5.7 6.8 7.9 9.1
Performance Score 10.2 12.0 14.7 16.8 20.4
Progress Score 7.6 16.7 22.2 29.4 38.2
Additional Credit 0.3 0.7 1.2 2.4 4.3Peer Index (mean = 0, s.d. = 1) -0.389 -0.299 -0.031 0.044 0.151
Quality Review Rating
Undeveloped 16.7% 14.9% 8.5% 6.7% 2.2%
Proficient 66.7% 67.8% 56.0% 53.4% 50.0%
Well Developed 16.7% 17.2% 35.1% 39.9% 47.8%
Progress Report Grade
Table 1: Descriptive Statistics by Accountability Grade

Table 2: The Impact of Accountability Grades on Achievement
Math English
(1) (2) (3) (4) (5) (6) (7) (8)
Accountability Grade
F 1.672 0.118 5.745 4.374 4.207 2.682 2.585 2.196
(1.177) (0.965) (1.556)** (1.206)** (1.229)** (1.292)* (1.144)* (1.148)+
D 0.884 0.206 2.873 2.119 2.109 0.657 0.454 0.389
(0.607) (0.521) (0.823)** (0.684)** (0.693)** (0.630) (0.547) (0.548)
B -0.167 0.392 -0.160 -0.113 -0.133 -0.420 -0.620 -0.603
(0.684) (0.500) (0.845) (0.622) (0.626) (0.555) (0.478) (0.474)
A -0.341 1.282 -1.603 -1.399 -1.411 -0.792 -1.555 -1.396
(1.218) (0.903) (1.557) (1.153) (1.165) (1.011) (0.907)+ (0.888)
Test that D = F (p-value) 0.38 0.91 0.03 0.04 0.06 0.08 0.04 0.07
Test that A = B (p-value) 0.81 0.11 0.14 0.07 0.08 0.53 0.09 0.14
Report Element Scores & Peer Index (Quartic) √ √ √ √ √ √ √ √
Prior Scale Score (Quadratic) √ √ √ √
Extreme A and F Schools Dropped √ √
Observations 985 985 985 985 975 985 985 975
Notes: Robust standard errors in parentheses. + significant at 10%; * significant at 5%; ** significant at 1%. Regressions weighted by number of math
or English test takers. Report elements include additional credit and progress, performance, and environment scores. All specifications also include
controls for school levels and a quartic in interactions between school levels and report element scores/peer index.
English
20082007 (Placebo)
Math

Table 3: Robustness Checks on Weighting, School Closures, and Extra Credit
Math English
(1) (2) (3) (4) (5) (6) (7) (8)
Accountability Grade
F 5.745 2.682 5.066 3.290 5.850 2.745 3.953 2.440
(1.556)** (1.292)* (1.721)** (1.368)* (1.641)** (1.410)+ (1.945)* (1.849)
D 2.873 0.657 2.462 0.762 2.960 0.912 2.024 0.614
(0.823)** (0.630) (0.847)** (0.754) (0.830)** (0.614) (0.929)* (0.671)
B -0.160 -0.420 0.478 -0.370 -0.178 -0.409 -1.334 -0.542
(0.845) (0.555) (0.799) (0.637) (0.850) (0.558) (1.232) (0.624)
A -1.603 -0.792 -0.404 -0.712 -1.642 -0.757 -1.792 -0.951
(1.557) (1.011) (1.510) (1.203) (1.568) (1.017) (2.009) (1.047)
Test that D = F (p-value) 0.03 0.08 0.08 0.04 0.05 0.16 0.26 0.27
Test that A = B (p-value) 0.14 0.53 0.34 0.64 0.13 0.56 0.67 0.52
Report Element Scores & Peer Index (Quartic) √ √ √ √ √ √ √ √
Observations 985 985 985 985 976 976 985 985
UnweightedMain Results (Table 2)
Math
Notes: Robust standard errors (in parentheses) are shown in Columns 1 to 6; standard errors in Columns 7 and 8 are bootsrapped to account for predicted
variables from the first stage. + significant at 10%; * significant at 5%; ** significant at 1%. Regressions other than those in columns 3 and 4 are
weighted by the number of math or English test takers. All specifications include controls for school levels and a quartic in interactions between school
levels and report element scores/peer index.
English
Drop Closing Schools
Math English Math
2SLS (No Extra Credit)
English

Table 4: Accountability Grades and Math Achievement, Small Bandwidths
10 points 3 points 2 points
Receipt of Low Grade (F or D) 1.700 2.042 1.698
(0.990)+ (1.020)* (1.244)
Observations 243 134 95Notes: Robust standard errors in parentheses. + significant at 10%; * significant at
5%; ** significant at 1%. The dependent variable is average math scale score. F/D
and D/C discontinuities estimated jointly. Each cell denotes a separate regression
where the sample is limited to schools receiving F, D, or C grades whose scores
were within the specified distance of F or D discontinuities. Regressions are
weighted by number of students taking math exams. All regressions include
controls for school level, linear controls for report element scores (additional
credit and progress, performance, and environment scores) and peer index, and an
interaction between school level and report element scores/peer index.
Minimum distance to cut-off:

Table 5: School Accountability and Percentage of Students Tested
Accountability Grade
F 0.007 0.002 -0.000 -0.001
(0.008) (0.007) (0.009) (0.007)
D 0.006 -0.001 -0.000 -0.001
(0.005) (0.004) (0.005) (0.004)
B 0.003 -0.001 0.005 0.003
(0.004) (0.004) (0.004) (0.003)
A -0.005 -0.002 0.000 0.009
(0.007) (0.006) (0.007) (0.006)
Report Elements & Peer Index (Quartic) √ √ √ √
Observations 985 985 985 985
Notes: Robust standard errors in parentheses. + significant at 10%; * significant at 5%; ** significant
at 1%. Percent of students tested is equal to the total number of tested students divided by enrollment
in grades three to eight as measured in October 31st, 2006 (for 2007) and November 5, 2007 (for
2008). Regressions weighted by student enrollment. Report elements include additional credit and
progress, performance, and environment scores. All specifications also include controls for school
level and a quartic in interactions between school level and report element scores/peer index.
EnglishMath
2007 2008 2007 2008

F D C B A
Number of Schools 42 87 259 371 226
Parent Survey Results, 2007
Response Rate 24.5% 25.3% 30.1% 31.3% 34.0%
Academic -0.598 -0.104 -0.116 0.051 0.191
Safety -0.553 -0.460 -0.112 0.034 0.347
Engagement -0.257 -0.148 -0.123 0.014 0.213
Communication -0.383 -0.228 -0.143 0.018 0.283
Parent Survey Results, 2008
Response Rate 49.0% 53.3% 51.7% 49.4% 49.4%
Academic -0.109 -0.046 -0.121 -0.031 0.226
Safety -0.150 -0.224 -0.188 -0.020 0.362
Engagement -0.079 0.024 -0.169 -0.050 0.277
Communication -0.105 0.103 -0.192 -0.055 0.286
Student Survey Results, 2007
Response Rate 62.0% 73.8% 72.8% 73.7% 78.1%
Academic -0.362 -0.371 -0.205 0.111 0.296
Safety -0.505 -0.468 -0.290 0.058 0.476
Engagement -0.434 -0.455 -0.199 0.130 0.267
Communication -0.106 -0.241 -0.210 0.022 0.323
Student Survey Results, 2008
Response Rate (for applicable grades) 81.6% 86.6% 86.7% 88.6% 91.0%
Academic -0.445 -0.146 -0.140 -0.035 0.317
Safety -0.569 -0.317 -0.283 -0.023 0.516
Engagement -0.393 -0.182 -0.184 -0.014 0.330
Communication 0.111 -0.134 -0.211 -0.037 0.281
Teacher Survey Results, 2007
Response Rate 46.4% 42.7% 46.1% 46.3% 49.1%
Academic -0.965 -0.538 -0.162 0.122 0.373
Safety -0.849 -0.610 -0.192 0.094 0.460
Engagement -0.781 -0.438 -0.187 0.126 0.319
Communication -0.775 -0.411 -0.136 0.106 0.285
Teacher Survey Results, 2008
Response Rate 67.1% 72.5% 65.8% 63.0% 65.3%
Academic -0.631 -0.236 -0.181 0.044 0.340
Safety -0.445 -0.398 -0.201 0.038 0.402
Engagement -0.429 -0.166 -0.148 0.032 0.254
Communication -0.449 -0.115 -0.142 0.048 0.208
Table 6: Descriptive Statistics on Environment Survey Response Rates and Scores
Progress Report Grade
Note: The number of schools with student survey data differs from the total number of schools, as only students
that were in 6th or a higher grade were surveyed. The number of schools with student survey data in both
2007and 2008 is as follows: 15 (F), 34 (D), 100 (C), 148 (B), 97 (A). Additionally, 2 schools, receiving a B and a
C, did not have parent respondents in both years.

F D C B A
Number of Schools 42 87 259 371 226
Parent Survey Results, 2007
Course Offerings -0.082 -0.240 -0.013 0.084 -0.013
High Expectations -0.395 -0.232 -0.092 0.037 0.203
Teacher Quality -0.830 -0.188 -0.077 0.064 0.205
Overall Satisfaction with Education -0.936 -0.161 -0.072 0.054 0.225
Parent Survey Results, 2008
Course Offerings -0.390 -0.206 -0.063 0.020 0.193
High Expectations -0.306 -0.163 -0.169 0.014 0.293
Teacher Quality 0.036 -0.140 -0.089 -0.026 0.188
Overall Satisfaction -0.287 -0.095 -0.143 -0.026 0.296
Student Survey Results, 2007
Course Offerings -0.200 -0.240 -0.108 0.074 0.146
High Expectations -0.489 -0.547 -0.238 0.144 0.368
Essays and Projects -0.728 -0.198 -0.084 0.163 0.096
Group and Hands-on Learning Activities -0.224 -0.320 -0.234 0.101 0.231
Student Survey Results, 2008
Course Offerings -0.277 -0.225 -0.122 0.073 0.156
High Expectations -0.489 -0.256 -0.208 0.003 0.363
Essays and Projects -0.351 -0.469 0.000 0.076 0.103
Group and Hands-on Learning Activities -0.097 -0.465 -0.131 0.045 0.224
Teacher Survey Results, 2007
Course Offerings -0.527 -0.266 -0.059 0.089 0.124
High Expectations -0.892 -0.370 -0.150 0.090 0.333
Focus on Teaching by School Leaders -0.863 -0.304 -0.157 0.137 0.233
Use of Student Data -0.859 -0.189 -0.156 0.130 0.196
Teacher Survey Results, 2008
Course Offerings -0.362 -0.069 -0.095 0.025 0.168
High Expectations -0.720 -0.305 -0.189 0.042 0.397
Focus on Teaching by School Leaders -0.603 -0.185 -0.172 0.099 0.216
Use of Student Data -0.367 -0.003 -0.134 0.040 0.151
Table 7: Descriptive Statistics on Specific Outcomes from Environment Survey
Progress Report Grade
Note: The number of schools with student survey data differs from the total number of schools, as only students
that were in 6th or a higher grade were surveyed. The number of schools with student survey data in both
2007and 2008 is as follows: 15 (F), 34 (D), 100 (C), 148 (B), 97 (A). Additionally, 2 schools, receiving a B and
a C, did not have parents respondents in both years.

Table 8: The Impact of Accountability Grades on Parent Survey Outcomes
Accountability Grade (1) (2) (3) (4) (5) (6) (7) (8)
F 0.750 0.465 0.568 0.380 0.636 0.728 0.448 0.161
(0.175)** (0.197)* (0.191)** (0.187)* (0.155)** (0.183)** (0.171)** (0.254)
D 0.358 0.336 0.449 0.276 0.375 0.207 0.241 0.154
(0.112)** (0.114)** (0.116)** (0.104)** (0.104)** (0.128) (0.116)* (0.204)
B -0.224 -0.119 -0.085 -0.066 -0.125 -0.213 -0.098 -0.168
(0.090)* (0.081) (0.081) (0.071) (0.079) (0.101)* (0.088) (0.137)
A -0.468 -0.175 -0.152 -0.039 -0.292 -0.489 -0.151 -0.155
(0.177)** (0.157) (0.159) (0.143) (0.154)+ (0.192)* (0.179) (0.257)
Test that D = F (p-value) 0.01 0.48 0.50 0.56 0.07 0.00 0.19 0.98
Test that A = B (p-value) 0.04 0.60 0.53 0.78 0.10 0.03 0.65 0.93
Report Elements & Peer Index (Quartic) √ √ √ √ √ √ √ √
Prior Survey Score (Quadratic) √ √ √ √ √ √ √ √
Extreme A and F Schools Dropped √ √ √ √ √ √ √ √
Observations 973 973 973 973 973 973 973 973
Notes: All dependent variables have been standardized to have mean zero and standard deviation one. Robust standard errors in parentheses. +
significant at 10%; * significant at 5%; ** significant at 1%. Regressions weighted by number of survey respondents. Report elements include additional
credit and progress, performance, and environment scores. All specifications also include controls for school levels and a quartic in interactions between
school levels and report element scores/peer index.
Academics Engagement Communication Safety
Course
Offerings
Survey Domain ScoresOverall
Educational
Quality
Teacher
Quality
High
Expectations
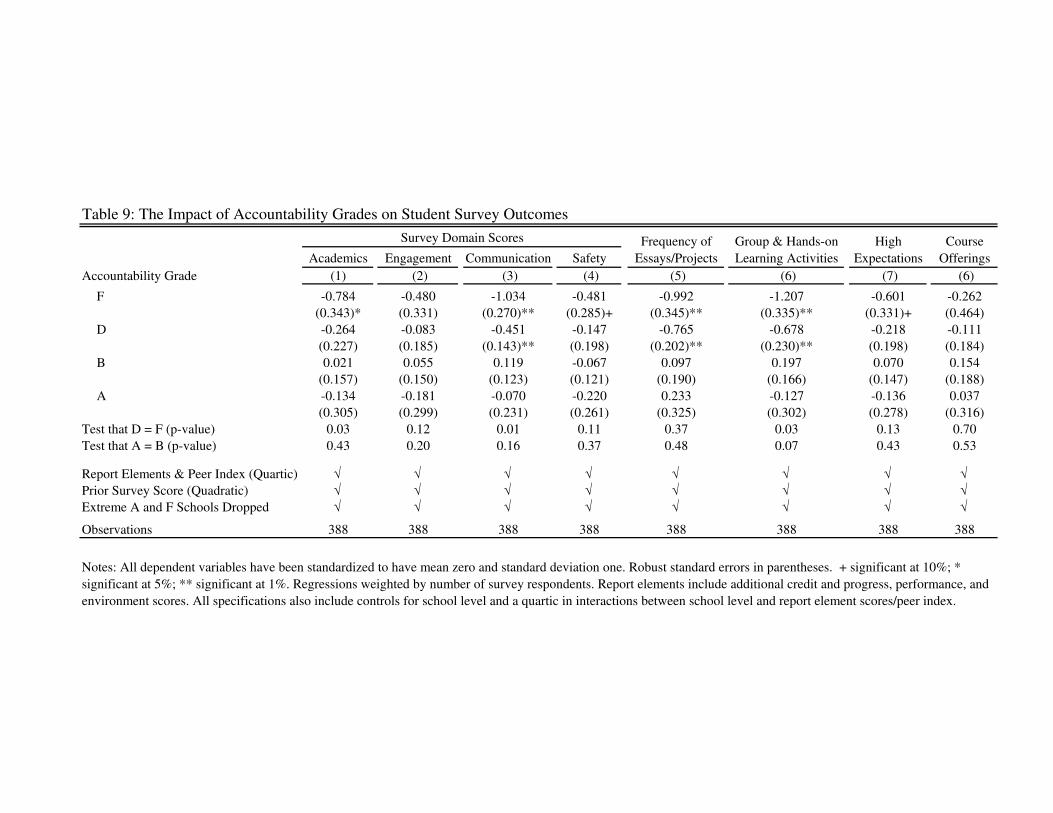
Table 9: The Impact of Accountability Grades on Student Survey Outcomes
Accountability Grade (1) (2) (3) (4) (5) (6) (7) (6)
F -0.784 -0.480 -1.034 -0.481 -0.992 -1.207 -0.601 -0.262
(0.343)* (0.331) (0.270)** (0.285)+ (0.345)** (0.335)** (0.331)+ (0.464)
D -0.264 -0.083 -0.451 -0.147 -0.765 -0.678 -0.218 -0.111
(0.227) (0.185) (0.143)** (0.198) (0.202)** (0.230)** (0.198) (0.184)
B 0.021 0.055 0.119 -0.067 0.097 0.197 0.070 0.154
(0.157) (0.150) (0.123) (0.121) (0.190) (0.166) (0.147) (0.188)
A -0.134 -0.181 -0.070 -0.220 0.233 -0.127 -0.136 0.037
(0.305) (0.299) (0.231) (0.261) (0.325) (0.302) (0.278) (0.316)
Test that D = F (p-value) 0.03 0.12 0.01 0.11 0.37 0.03 0.13 0.70
Test that A = B (p-value) 0.43 0.20 0.16 0.37 0.48 0.07 0.43 0.53
Report Elements & Peer Index (Quartic) √ √ √ √ √ √ √ √
Prior Survey Score (Quadratic) √ √ √ √ √ √ √ √
Extreme A and F Schools Dropped √ √ √ √ √ √ √ √
Observations 388 388 388 388 388 388 388 388
Notes: All dependent variables have been standardized to have mean zero and standard deviation one. Robust standard errors in parentheses. + significant at 10%; *
significant at 5%; ** significant at 1%. Regressions weighted by number of survey respondents. Report elements include additional credit and progress, performance, and
environment scores. All specifications also include controls for school level and a quartic in interactions between school level and report element scores/peer index.
Academics Engagement Communication Safety
Course
Offerings
Survey Domain Scores Frequency of
Essays/Projects
Group & Hands-on
Learning Activities
High
Expectations

Table 10: The Impact of Accountability Grades on Teacher Survey Outcomes
Academics Engagement Communication Safety
Accountability Grade (1) (2) (3) (4) (5) (6) (7) (8)
F 0.109 0.091 0.034 0.283 0.212 0.161 0.002 0.161
(0.174) (0.178) (0.183) (0.159)+ (0.216) (0.234) (0.157) (0.234)
D 0.161 0.107 0.135 0.098 0.216 0.218 0.120 0.218
(0.119) (0.126) (0.125) (0.106) (0.140) (0.130)+ (0.104) (0.130)+
B 0.109 0.123 0.179 0.089 0.064 -0.019 0.081 -0.019
(0.085) (0.090) (0.090)* (0.077) (0.097) (0.097) (0.079) (0.097)
A 0.266 0.309 0.351 0.240 0.143 0.035 0.214 0.035
(0.158)+ (0.170)+ (0.163)* (0.149) (0.183) (0.176) (0.149) (0.176)
Test that D = F (p-value) 0.761 0.93 0.58 0.23 0.986 0.796 0.42 0.80
Test that A = B (p-value) 0.121 0.09 0.09 0.12 0.499 0.596 0.16 0.60
Report Elements & Peer Index (Quartic) √ √ √ √ √ √ √ √
Prior Survey Score (Quadratic) √ √ √ √ √ √ √ √
Extreme A and F Schools Dropped √ √ √ √ √ √ √ √
Response Rate (Quartic) √ √ √ √ √ √ √ √
Observations 963 963 963 963 975 975 975 975
Survey Domain Scores
Notes: All dependent variables have been standardized to have mean zero and standard deviation one. Robust standard errors in parentheses. + significant at 10%; *
significant at 5%; ** significant at 1%. Regressions weighted by number of survey respondents. Report elements include additional credit and progress, performance,
and environment scores. All specifications also include controls for school level and a quartic in interactions between school level and report element scores/peer
index.
Use of
Student Data
Focus on
Teaching by
School Leaders
High
Expectations
Course
Offerings

FD
CB
AF
DC
BA
FD
CB
A
0 25 50 75 100
Elementary Schools
K-8 Schools
Middle Schools
Gra
de
Figure 1: Accountability Grade Plotted Against Overall Score, by Type of School
Overall Score

September 24, 2007: Schools receive progress reports and grades.
May Jun Jul Aug Sept Oct Nov
November 5, 2007: Progress reports and grades released to the public.
Jan Feb Mar Apr May
April 30 – June 6, 2007: Environmental survey administered for the school year 2006-2007.
January 8 – 17, 2008: Students take ELA exams.
March 4- 11, 2008: Students take math exams.
March 12–April 18, 2008: Environmental survey administered for the school year 2007-2008.
Jun
2008
June 23, 2008: ELA and math exam results released.
Figure 2: Timeline of Events Related to Accountability Implementation
Dec
December 2007: Closure of 7 F and 2 D schools announced.
April 2007: Progress Report Methodology released to principals. Principals also receive a pilot report with 2005-2006 data but without a grade.
Apr
2007

Figure 3: Distribution of School Average Test Scores in 2006-2007 and 2007-2008
0.0
1.0
2.0
3D
ensi
ty
550 600 650 700 750Scaled Score
English Language Arts '06-'07 Math '06-'07
English Language Arts '07-'08 Math '07-'08
Note: Densities shown for the 985 schools used in our empirical analysis.

600
640
680
720
Raw
Mat
h T
est
Sco
re
0 20 40 60 80 100Overall Score
600
640
680
720
Raw
Eng
lish
Tes
t S
core
0 20 40 60 80 100Overall Score
A B C D F
-15
-10
-50
510
15
Resi
dual
Mat
h T
est
Sco
re
0 20 40 60 80 100Overall Score
-15
-10
-50
510
15
Resi
dual
Eng
lish
Tes
t S
core
0 20 40 60 80 100Overall Score
A B C D F
Figure 4: School Average Math and English Scale Scores by Progress Report Grade
Raw Test Scores, 2006-2007
Residual Test Scores, 2006-2007
Note: Residuals from a regression of test scores on the elements of the overall score: peer index, progress, performance, environment, and additional credit. We also include quartic polynomial for each element, and the impact of these variables is allowed to vary across the three types of schools (Elementary, K-8, and Middle). The solid lines plot estimates from a locally weighted polynomial (Fan) regression with a bandwidth of 8 points performed separately within each group of schools with the same progress report grade.

600
640
680
720
Raw
Mat
h T
est
Sco
re
0 20 40 60 80 100Overall Score
600
640
680
720
Raw
Eng
lish
Tes
t S
core
0 20 40 60 80 100Overall Score
A B C D F
-15
-10
-50
510
15
Resi
dual
Mat
h T
est
Sco
re
0 20 40 60 80 100Overall Score
-15
-10
-50
510
15
Resi
dual
Eng
lish
Tes
t S
core
0 20 40 60 80 100Overall Score
A B C D F
Figure 5: School Average Math and English Scale Scores by Progress Report Grade
Raw Test Scores, 2007-2008
Residual Test Scores, 2007-2008
Note: Residuals from a regression of test scores on the elements of the overall score: peer index, progress, performance, environment, and additional credit. We also include a quartic polynomial for each element, and the impact of these variables is allowed to vary across the three types of schools (Elementary, K-8, and Middle). The solid lines plot estimates from a locally weighted polynomial (Fan) regression with a bandwidth of 8 points performed separately within each group of schools with the same progress report grade.


