changes and impacts a & s may 2013 1. accountability history accountability changes and impact...
TRANSCRIPT

1
FDOE Accountability and School Grading System
Changes and Impacts
A & SMay 2013

2
Accountability History
Accountability Changes and Impact
Discussion
Assessment &Accountability Changes

3
History of Accountability Changes
2013
Add Biology, Geometry; New Writing Standard; Revise 5-year Graduation Rate
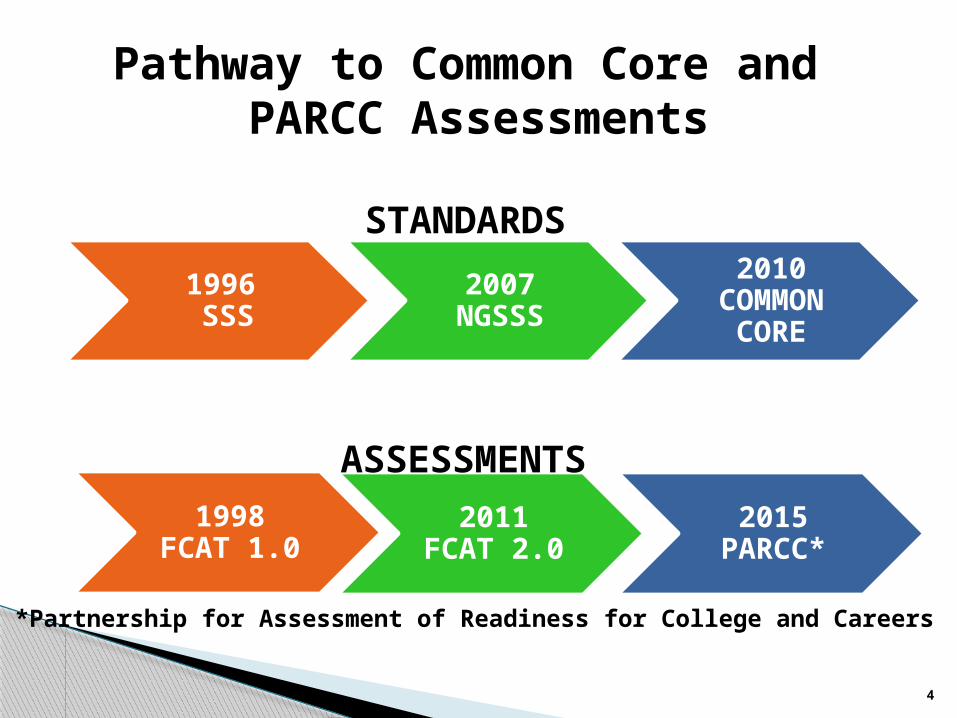
1996 SSS
2007NGSSS
2010COMMON
CORE
Pathway to Common Core and PARCC Assessments
1998FCAT 1.0
2011FCAT 2.0
2015PARCC*
STANDARDS
ASSESSMENTS
4
*Partnership for Assessment of Readiness for College and Careers
5
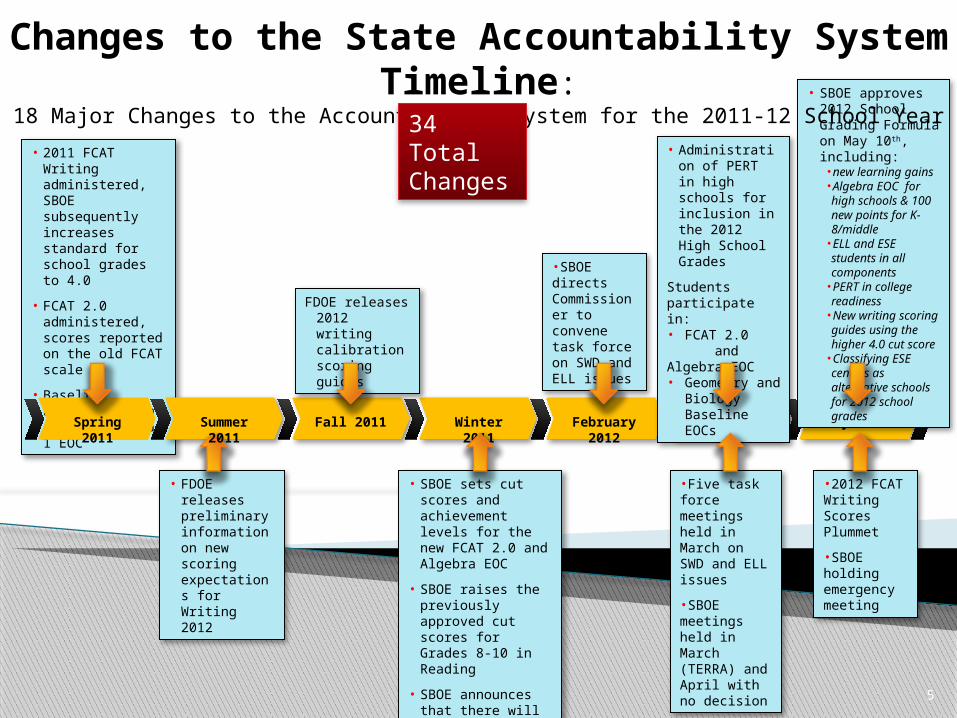
• 2011 FCAT Writing administered, SBOE subsequently increases standard for school grades to 4.0
• FCAT 2.0 administered, scores reported on the old FCAT scale
• Baseline administration of the Algebra 1 EOC
Spring 2011
• FDOE releases preliminary information on new scoring expectations for Writing 2012
Winter 2011Summer 2011 Fall 2011 February 2012 Spring 2012 May 2012
FDOE releases 2012 writing calibration scoring guides
• SBOE sets cut scores and achievement levels for the new FCAT 2.0 and Algebra EOC
• SBOE raises the previously approved cut scores for Grades 8-10 in Reading
• SBOE announces that there will be two scorers for Writing in 2012
•SBOE directs Commissioner to convene task force on SWD and ELL issues
• Administration of PERT in high schools for inclusion in the 2012 High School Grades
Students participate in:• FCAT 2.0 and Algebra EOC• Geometry and
Biology Baseline EOCs
• SBOE approves 2012 School Grading Formula on May 10th, including:•new learning gains•Algebra EOC for high
schools & 100 new points for K-8/middle •ELL and ESE students
in all components•PERT in college
readiness •New writing scoring
guides using the higher 4.0 cut score•Classifying ESE centers
as alternative schools for 2012 school grades
•Five task force meetings held in March on SWD and ELL issues
•SBOE meetings held in March (TERRA) and April with no decision
•2012 FCAT Writing Scores Plummet
•SBOE holding emergency meeting
Changes to the State Accountability System Timeline:18 Major Changes to the Accountability System for the 2011-12 School Year
34 Total Changes

6
Increased Expectations for Proficiency ELL Students in US School for 365 Days ESE Students on Florida Alternate
Assessment Middle School Acceleration Component Reading Performance Penalty Social Studies EOC in MS and HS More Rigorous Graduation Rate
Accountability Changes Impacting School Grades

7
3.0 FCAT Writing proficiency standard One school letter grade drop limit
◦ Adjusted points
Suspended Penalties◦ Adequate Progress of Lowest 25%
Reading/Math Learning Gains◦ Reading Performance Threshold
FY2012 School GradesDue to number of changes and late notice to districts, FLDOE implemented the following temporary measures:

8
One Letter Grade Drop Limit◦ 3 Elementary Schools would have dropped
2 or more letter grades
Lowest 25% Math Learning Gains◦ Impact 6 High Schools
Only Level 1 and Level 2 Students
More Rigorous Algebra 1
No FCAT Math for 9th and 10th Graders
Reading Performance Penalty◦ 2 Elementary Schools
◦ 1 Middle School
Impact of Accountability Changes on FY2012 SDPBC School Grades

9
A B C D F0
20
40
60
80
100
120
96
29 31
80
89
2436
114
REPORTED UNADJUSTED
Impact of Accountability Changes on FY2012 SDPBC Schools*
Reported School Grades vs. Unadjusted School Grades
*Charter Schools not included

10
A B C D F0
20
40
60
80
100
62
18 20
70
60
11
23
103
EL REPORTED EL UNADJUSTED
Impact of Accountability Changes on FY2012 Elementary Schools*
Reported School Grades vs. Unadjusted School Grades
*Charter Schools not included

11
A B C D F0
5
10
15
20
25
30
35
22
64
1 0
20
57
0 1
MS REPORTED MS UNADJUSTED
Impact of Accountability Changes on FY2012 Middle Schools*
Reported School Grades vs. Unadjusted School Grades
*Charter Schools not included

12
A B C D F0
5
10
15
20
25
12
57
0 0
9 86
1
HS REPORTED HS UNADJUSTED
Impact of Accountability Changes on FY2012 High Schools*
Reported School Grades vs. Unadjusted School Grades
*Charter Schools not included

13
A B C D F A B C D F0%
10%
20%
30%
40%
50%
60%
70%
59%
18% 19%
5%
0%
33%
40%
7%
13%
7%
54%
15%
22%
7%2%
33%
13%
33%
13%
7%
Reported Unadjusted
Regular Schools Charter Schools
Impact of Accountability Changes on FY2012 SDPBC School GradesReported School Grades vs. Unadjusted School Grades

14
FY2012 & Beyond School Grading
FormulaChanges

15
Increased Writing Standard
One Letter Grade Drop Limit Expired
New Cut Scores For Science, Biology 1, Geometry
Reading Performance Penalty
Lowest 25% Penalties Reinstated
More Rigorous Graduation Standard
Automatic School Grade Scale Adjustment
What to Expect in FY2013

16
FCAT 2.0 Writing: FY12 Percent Meeting Standard 3.0 and 3.5 out of 6.0
Elementary School Middle School High School0%
10%
20%
30%
40%
50%
60%
70%
80%
90%
100%
84% 84%89%
53%61%
73%
3.0 & Above 3.5 & Above

17
FCAT 2.0 Writing Impact of 3.5 Proficiency Standard on FY12 SDPBC School Grades
*Charter Schools not included
A B C D F0
20
40
60
80
100
120
96
29 31
80
73
24
36
2011
Reported Writing 3.5

18
New Achievement Level Cut ScoresFY2012 and FY2013
FCAT 2.0 End of Course
Reading
Mathematics
Science
Algebra 1
Geometry
Biology 1

19
Impact of FCAT 2.0 Reading and Math Cut Scores on SDPBC Elementary Schools
Students Scoring Proficient and Above
Grade 3 Grade 4 Grade 5 Grade 3 Grade 4 Grade 50%
10%
20%
30%
40%
50%
60%
70%
80%
90%
100%
70% 70% 70%75% 75%
64%
54%61% 61%
56%62%
57%
FY2011 FCAT 1.0 FY2012 FCAT 2.0
--------- Reading --------- ---------- Math ----------

20
Impact of FCAT 2.0 Reading Cut Scores on SDPBC Middle Schools
Students Scoring Proficient and Above
Grade 6 Grade 7 Grade 80%
10%
20%
30%
40%
50%
60%
70%
80%
90%
100%
69% 70%
58%56% 58% 59%
FY2011 FCAT 1.0 FY2012 FCAT 2.0
--------- Reading ---------

Requires using Algebra 1 and Geometry EOCs for Math components of High School Grades
Requires using Biology 1 EOC for theScience component of High School Grades
21
High School End-of-Course Exams Replace FCAT Math and Science
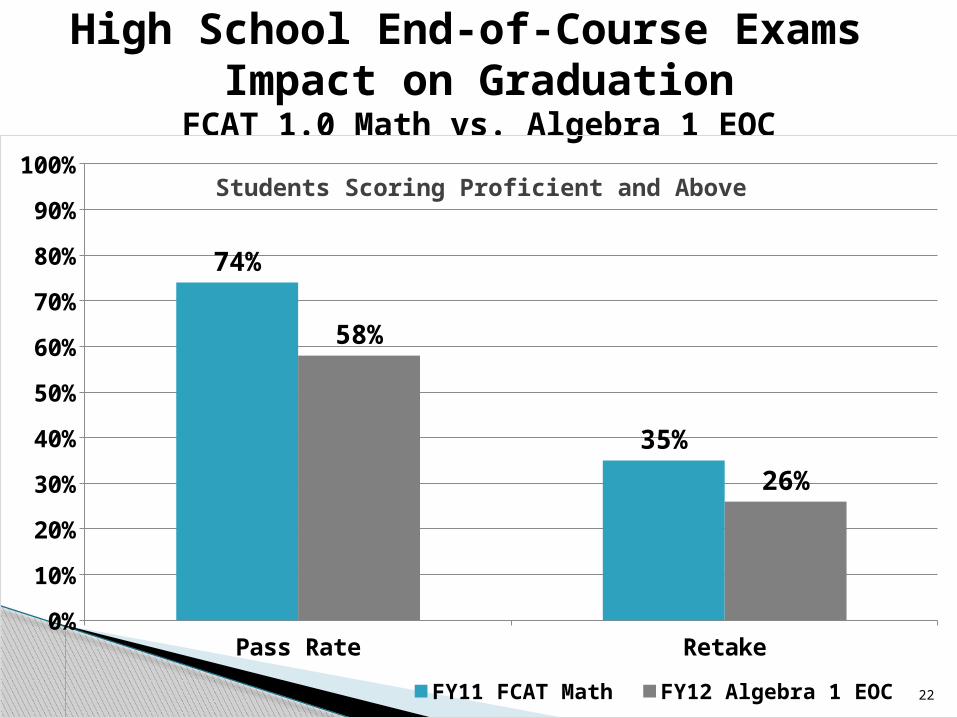
22
High School End-of-Course Exams Impact on Graduation
FCAT 1.0 Math vs. Algebra 1 EOC
Pass Rate Retake0%
10%
20%
30%
40%
50%
60%
70%
80%
90%
100%
74%
35%
58%
26%
FY11 FCAT Math FY12 Algebra 1 EOC
Students Scoring Proficient and Above

NGA Rate ◦ Includes all Standard and Special Diploma recipients
Federal Rate:◦ Only includes Standard Diplomas
◦ Students receiving a Special Diploma or withdrawn to Adult Education are considered dropouts
23
Replacement of the NGA Graduation Rate with the
Federal Graduation Rate
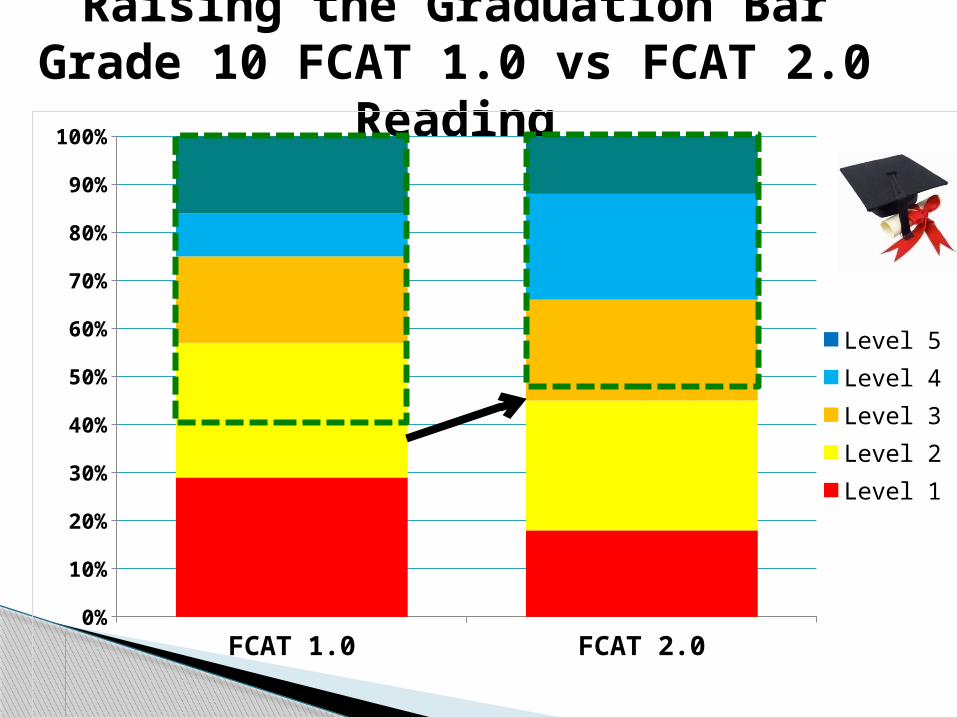
Raising the Graduation BarGrade 10 FCAT 1.0 vs FCAT 2.0 Reading
FCAT 1.0 FCAT 2.00%
10%
20%
30%
40%
50%
60%
70%
80%
90%
100%
Level 5Level 4Level 3Level 2Level 1

25
Raising the Graduation BarReading Concordant Scores
Into 9th Grade
SAT ACT
Concordant Score
Concordant Score
FY2011 + 430 19FY2010 + 420 18

26
Changing Grading Scales
School Grading Scale Revision for 2014-2015• If ‘A’ and ‘B’ schools reach 75% in a current year,
minimum required points for grades of A, B, C, and D would be increased
School Grading Scale
Grading Scale Old 2011-14 2014-15Elementary Schools 800 800 800Middle Schools 800 900 1000Senior High Schools 1600 1600 1600

27
Lower graduation rates Increased dropout rates Higher retention rates More intensive support courses Fewer A and B schools, more C, D, F
schools More schools under State sanction
What are the potential impacts of these changes?
“The Common Core State Standards are higher; they’re fewer; they require more critical thinking skills,” Jeb Bush said, “and they will, unfortunately, at the beginning, they will probably show that close to two-thirds of our children are not college and career ready” (Nov 2012)

28
Questions and
Discussion

29
FDOE SCHOOL GRADE COMPONENTS AND SCALES Elementary School Grade Matrix and Scale Middle School Grade Matrix and Scale High School Grade Matrix and Scale
FDOE SCHOOL GRADES CALCULATIONS 2012 School Grades Guide Sheet (PDF) School Grades Technical Assistance Paper 2011-12 (PDF)
ESEA WAIVER Florida Gets Flexibility Waiver From US Department of Education Frequently Asked Questions about School Grade Modifications and the ESEA Waiver
FDOE GRADUATION REQUIREMENTS Graduation Requirements for Statewide Assessments Students Entering Ninth Grade - 2011-2012 School Year Students Entering Ninth Grade - 2012-2013 School Year Students Entering Ninth Grade - 2013-2014 School Year
RESOURCES

30
Next Generation Sunshine State Standards (NGSSS) 2007 Reading/Language Arts Next Generation Sunshine State Standards 2010 Next Generation Sunshine State Standards (Common Core) – English La
nguage Arts
FCAT 2.0 2012-13 FCAT 2.0 Fact Sheet and Spanish 2013 FCAT 2.0 Writing and Spanish End of Course Exams 2012-13 Algebra 1 EOC Assessment Fact Sheet 2012-13 Biology 1 EOC Assessment Fact Sheet 2012-13 Geometry EOC Assessment Fact Sheet 2013 U.S. History EOC Assessment Fact Sheet 2013 Civics EOC Assessment Field Test Fact Sheet
PARCC vs. FCAT A Parent’s Guide To How New Common Core Tests Are Different From FCAT
RESOURCES