
Selection of ESH solvents for cleaning applicationsin semiconductor manufacturing
E. Kesters1, M. Claes1, Q. T. Le1, K. Barthomeuf 2, M. Lux1, G. Vereecke1*, T. Bearda1, and J.B. Durkee3**
1 IMEC, Kapeldreef 75, 3001 Leuven, Belgium2 INSA, 20 av. A. Einstein, 69621 Villeurbanne, France3 Precisioncleaning, PO Box 847, Hunt TX 78024, USA* [email protected]** [email protected]
E. Kesters et al. imec 2008 2
11th POS 2008
Outline
• Introduction
• Materials & methods
• Results & first discussion
• Analysis of the Hansen “spherical” approach to solvent selection
• Conclusions
E. Kesters et al. imec 2008 3
11th POS 2008
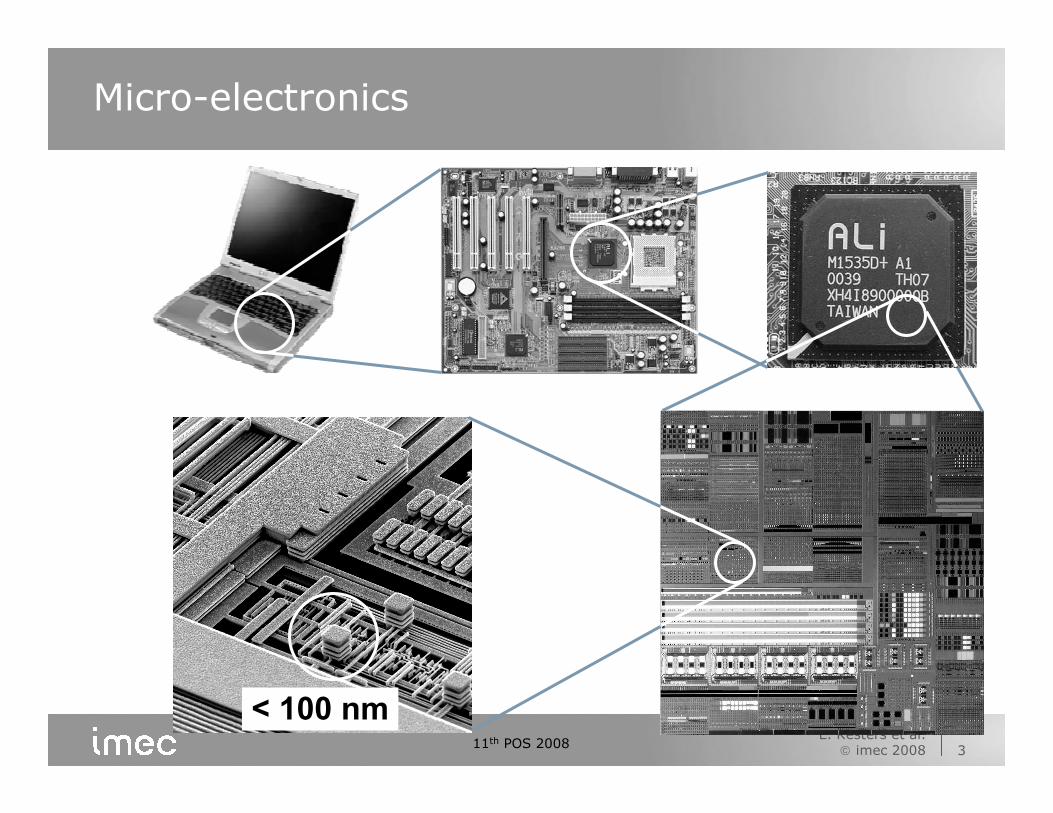
Micro-electronics
< 100 nm
E. Kesters et al. imec 2008 4
11th POS 2008
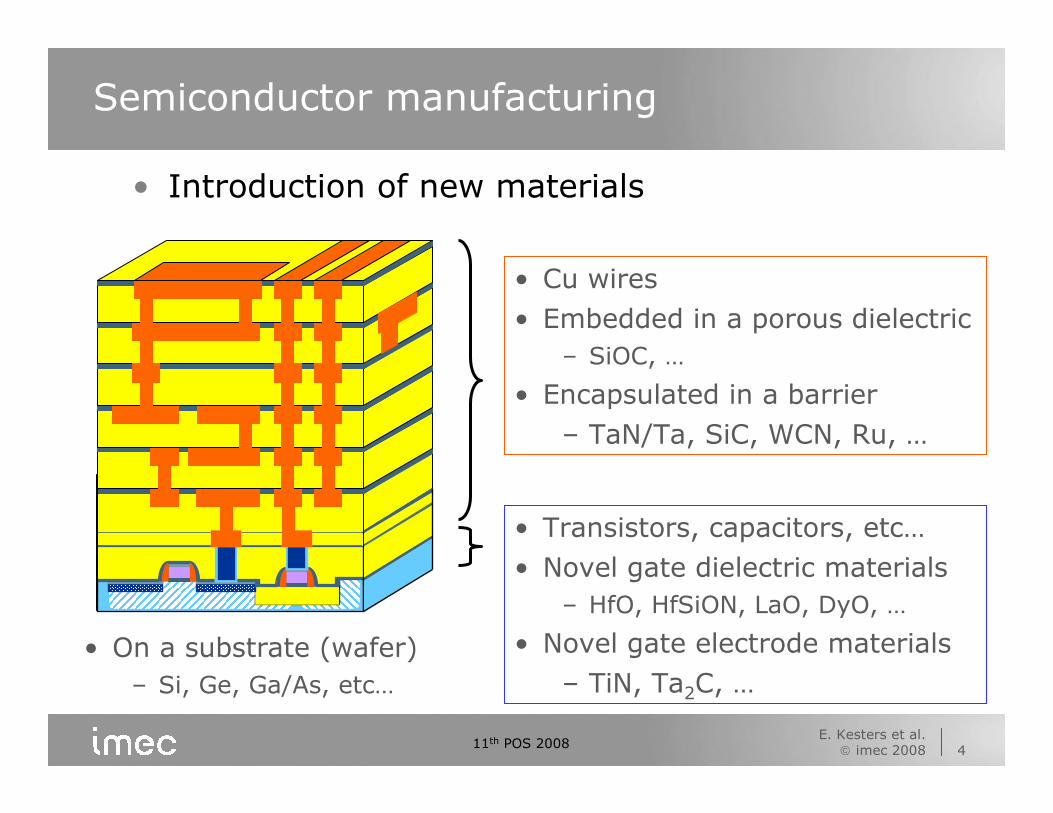
Semiconductor manufacturing
• Introduction of new materials
• Cu wires
• Embedded in a porous dielectric
– SiOC, …
• Encapsulated in a barrier
– TaN/Ta, SiC, WCN, Ru, …
• Transistors, capacitors, etc…
• Novel gate dielectric materials
– HfO, HfSiON, LaO, DyO, …
• Novel gate electrode materials
– TiN, Ta2C, …
• On a substrate (wafer)
– Si, Ge, Ga/As, etc…
E. Kesters et al. imec 2008 5
11th POS 2008
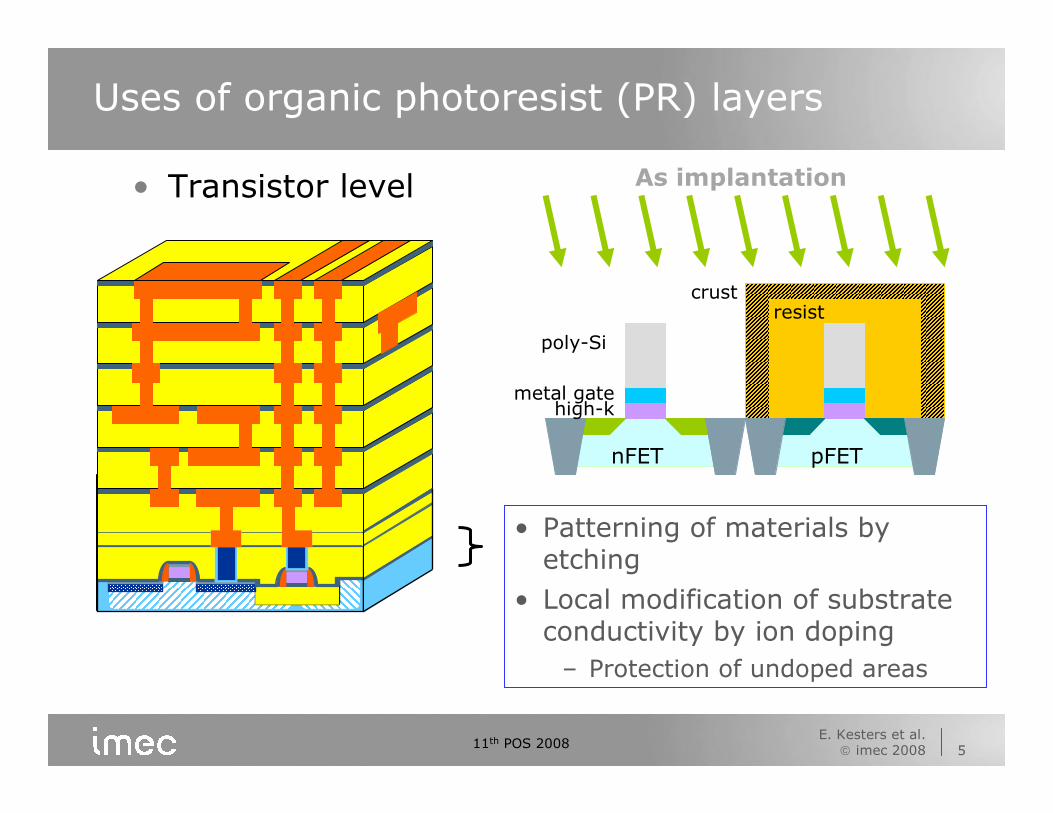
Uses of organic photoresist (PR) layers
• Transistor level
• Patterning of materials by etching
• Local modification of substrate conductivity by ion doping
– Protection of undoped areas
nFET pFET
poly-Si
metal gatehigh-k
resistcrust
As implantation

E. Kesters et al. imec 2008 6
11th POS 2008
Uses of organic photoresist (PR) layers
• Cu wiring
• Patterning of dielectric layers by plasma etching
– Before Cu filling
substrate
dielectricetch
photoresist
E. Kesters et al. imec 2008 7
11th POS 2008
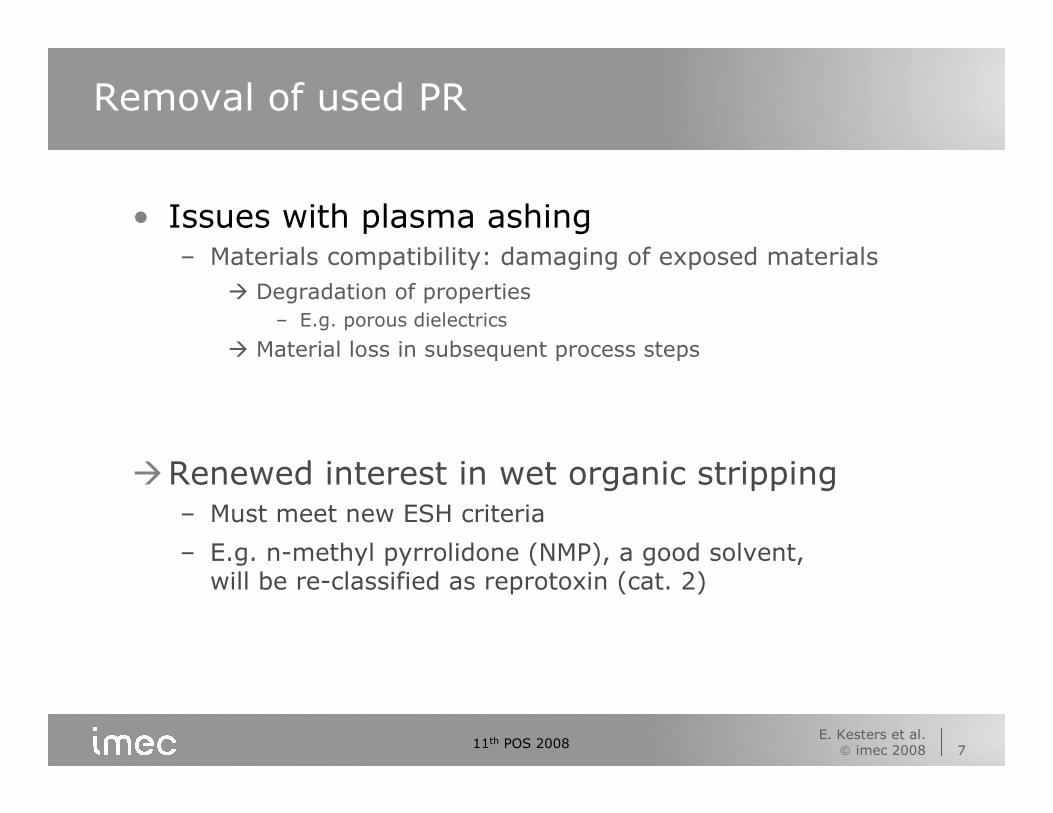
Removal of used PR
• Issues with plasma ashing– Materials compatibility: damaging of exposed materials
� Degradation of properties
– E.g. porous dielectrics
� Material loss in subsequent process steps
�Renewed interest in wet organic stripping– Must meet new ESH criteria
– E.g. n-methyl pyrrolidone (NMP), a good solvent, will be re-classified as reprotoxin (cat. 2)
E. Kesters et al. imec 2008 8
11th POS 2008
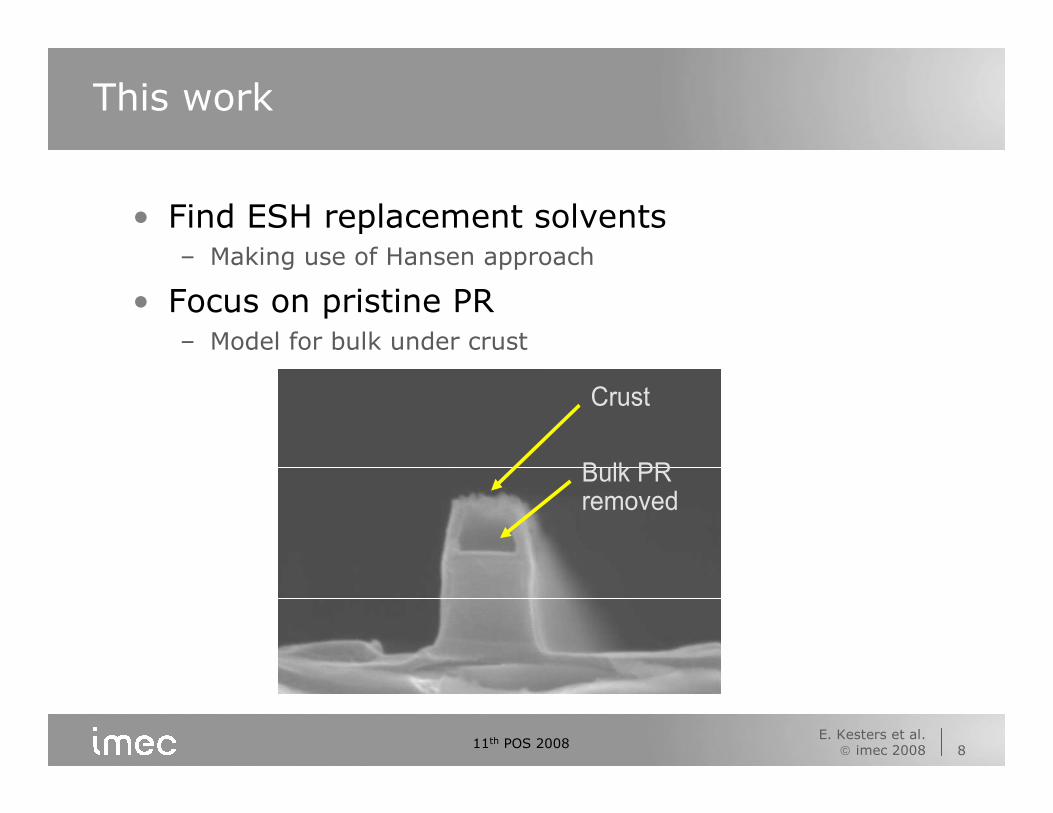
This work
• Find ESH replacement solvents– Making use of Hansen approach
• Focus on pristine PR– Model for bulk under crust
Crust
Bulk PR removed
Crust
Bulk PR removed
E. Kesters et al. imec 2008 9
11th POS 2008
Outline
• Introduction
• Materials & methods– PR materials
– Solvents selection
– Experimentals
• Results & first discussion
• Analysis of the Hansen “spherical” approach to solvent selection
• Conclusions
E. Kesters et al. imec 2008 10
11th POS 2008
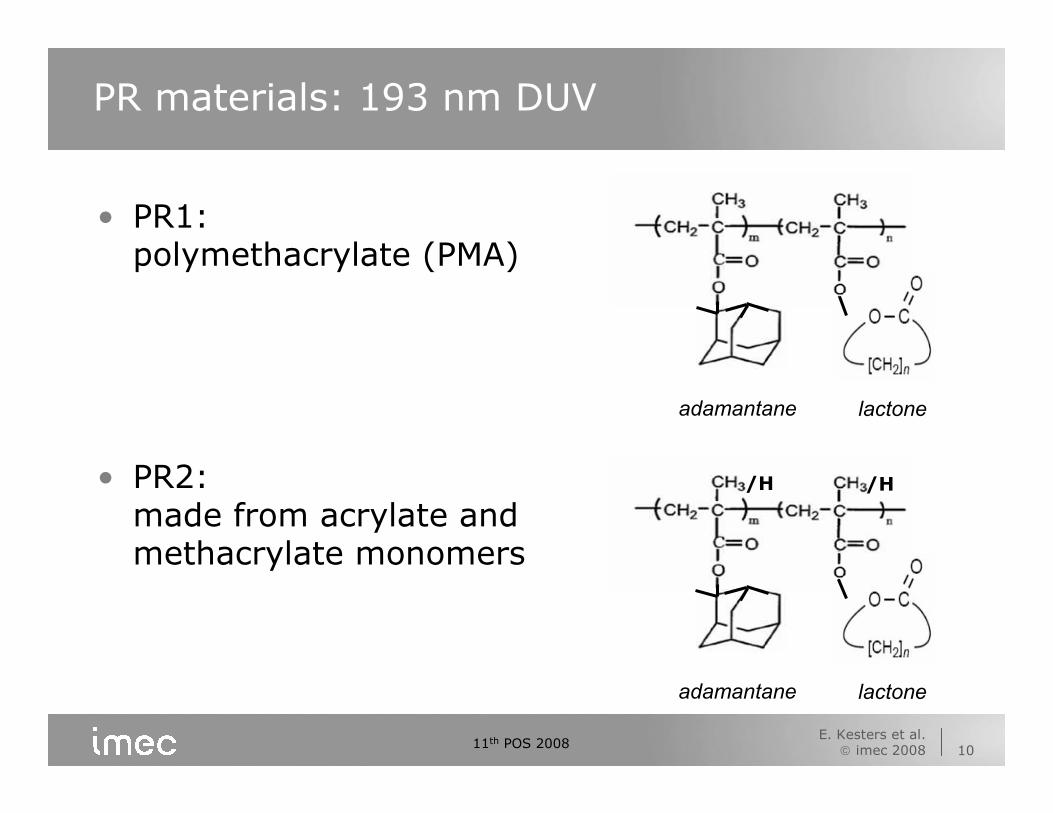
PR materials: 193 nm DUV
• PR1: polymethacrylate (PMA)
• PR2: made from acrylate and methacrylate monomers
adamantane lactone
adamantane lactone
/H /H
E. Kesters et al. imec 2008 11
11th POS 2008
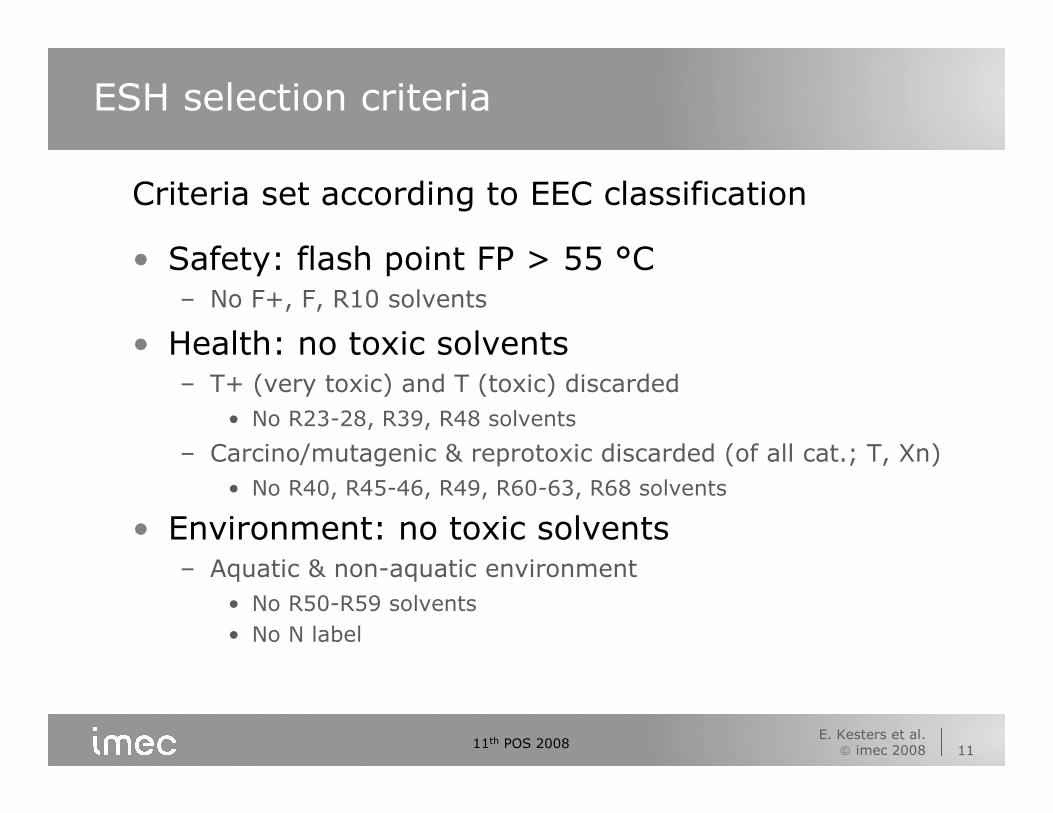
ESH selection criteria
Criteria set according to EEC classification
• Safety: flash point FP > 55 °C– No F+, F, R10 solvents
• Health: no toxic solvents– T+ (very toxic) and T (toxic) discarded
• No R23-28, R39, R48 solvents
– Carcino/mutagenic & reprotoxic discarded (of all cat.; T, Xn)
• No R40, R45-46, R49, R60-63, R68 solvents
• Environment: no toxic solvents – Aquatic & non-aquatic environment
• No R50-R59 solvents
• No N label
E. Kesters et al. imec 2008 12
11th POS 2008
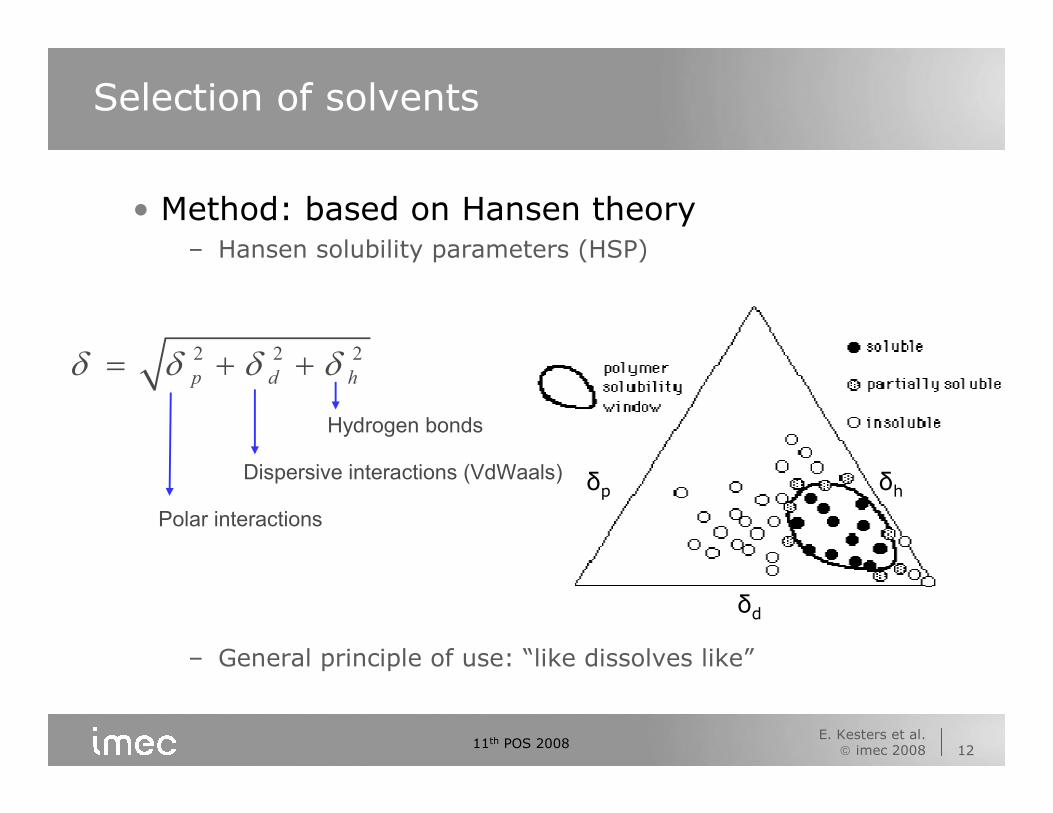
Selection of solvents
• Method: based on Hansen theory– Hansen solubility parameters (HSP)
– General principle of use: “like dissolves like”
δd
δp δh
2 2 2
p d hδ δ δ δ= + +
Hydrogen bonds
Dispersive interactions (VdWaals)
Polar interactions
E. Kesters et al. imec 2008 13
11th POS 2008
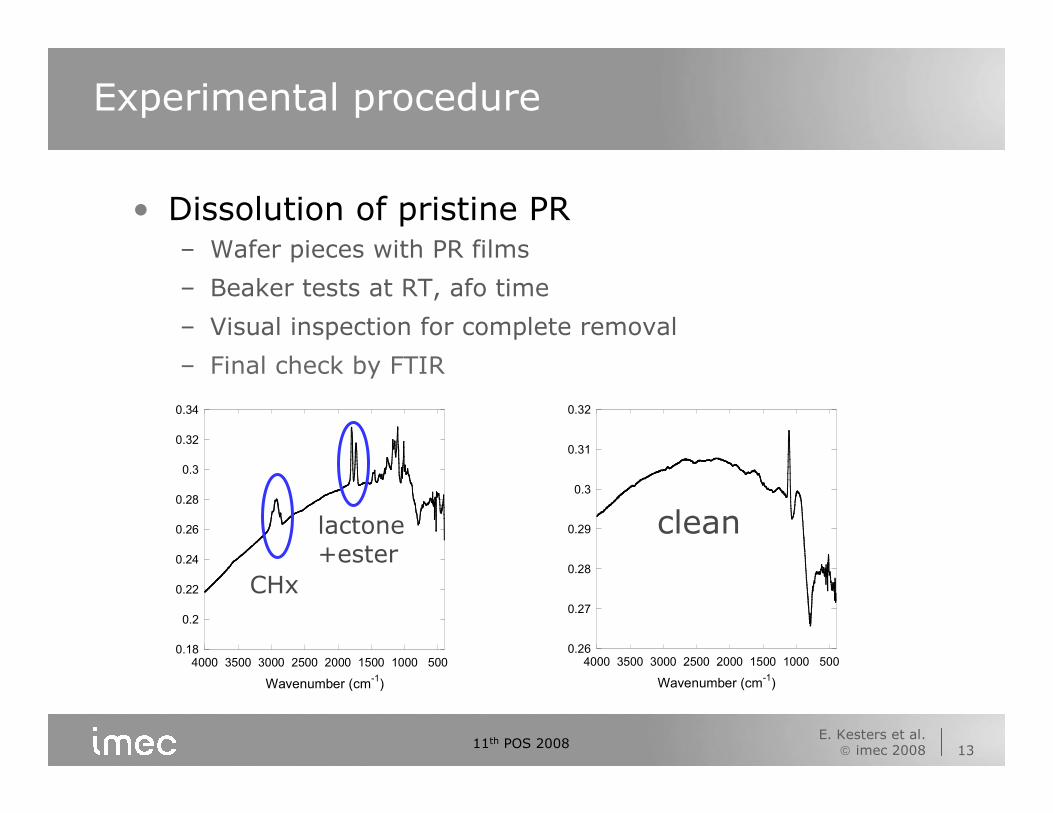
Experimental procedure
• Dissolution of pristine PR– Wafer pieces with PR films
– Beaker tests at RT, afo time
– Visual inspection for complete removal
– Final check by FTIR
0.18
0.2
0.22
0.24
0.26
0.28
0.3
0.32
0.34
5001000150020002500300035004000
Wavenumber (cm-1
)
0.26
0.27
0.28
0.29
0.3
0.31
0.32
5001000150020002500300035004000
Wavenumber (cm-1
)
CHx
lactone+ester
clean
E. Kesters et al. imec 2008 14
11th POS 2008
Outline
• Introduction
• Materials & methods
• Results & first discussion– Selected solvents & mixtures
– Evaluation of organics solvents & mixtures
• Analysis of the Hansen “spherical” approach to solvent selection
• Conclusions
E. Kesters et al. imec 2008 15
11th POS 2008
0
5
10
15
20
0 5 10 15 20 25 30
Hydrogen bonding parameter
Polar parameter
NMP
Ac
PGMEDCM
MIBK
TCE
CHex
EATHF
PC
EG
Tex
BA
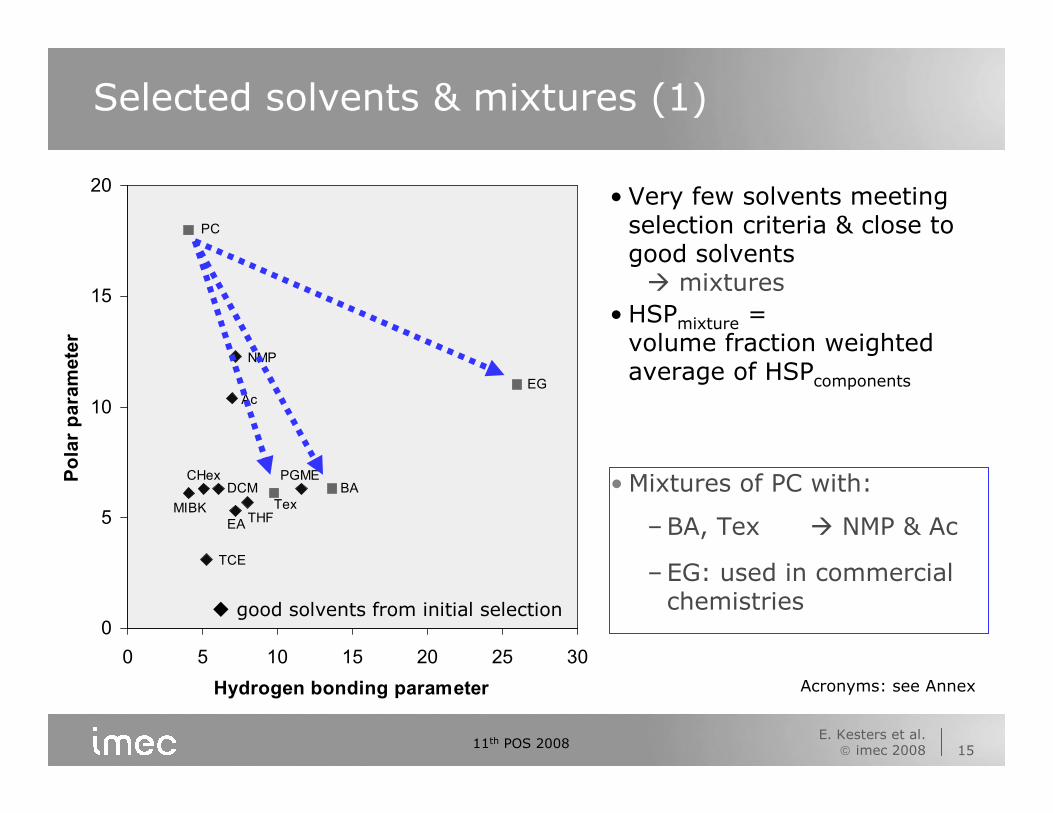
Selected solvents & mixtures (1)
• Mixtures of PC with:
–BA, Tex � NMP & Ac
–EG: used in commercial chemistries� good solvents from initial selection
Acronyms: see Annex
• Very few solvents meeting selection criteria & close to good solvents� mixtures
• HSPmixture = volume fraction weighted average of HSPcomponents
E. Kesters et al. imec 2008 16
11th POS 2008
0
5
10
15
20
0 5 10 15 20
Hydrogen bonding parameter
Polar parameter
NMP
Ac
PGMEDCM
MIBK
TCE
CHex
EATHF
THFA
DMSO
Cap
NP
? NEP
? HFE
? HFC
EHA
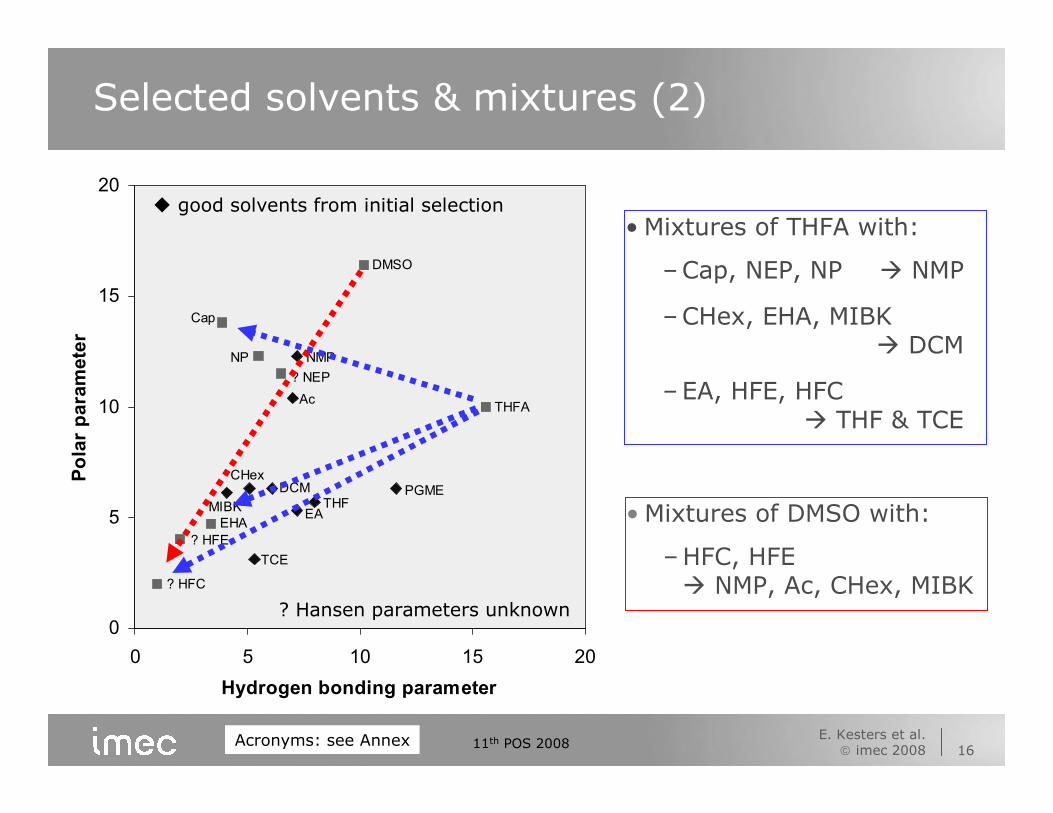
Selected solvents & mixtures (2)
• Mixtures of THFA with:
–Cap, NEP, NP � NMP
–CHex, EHA, MIBK� DCM
–EA, HFE, HFC � THF & TCE
• Mixtures of DMSO with:
–HFC, HFE � NMP, Ac, CHex, MIBK
� good solvents from initial selection
? Hansen parameters unknown
Acronyms: see Annex
E. Kesters et al. imec 2008 17
11th POS 2008
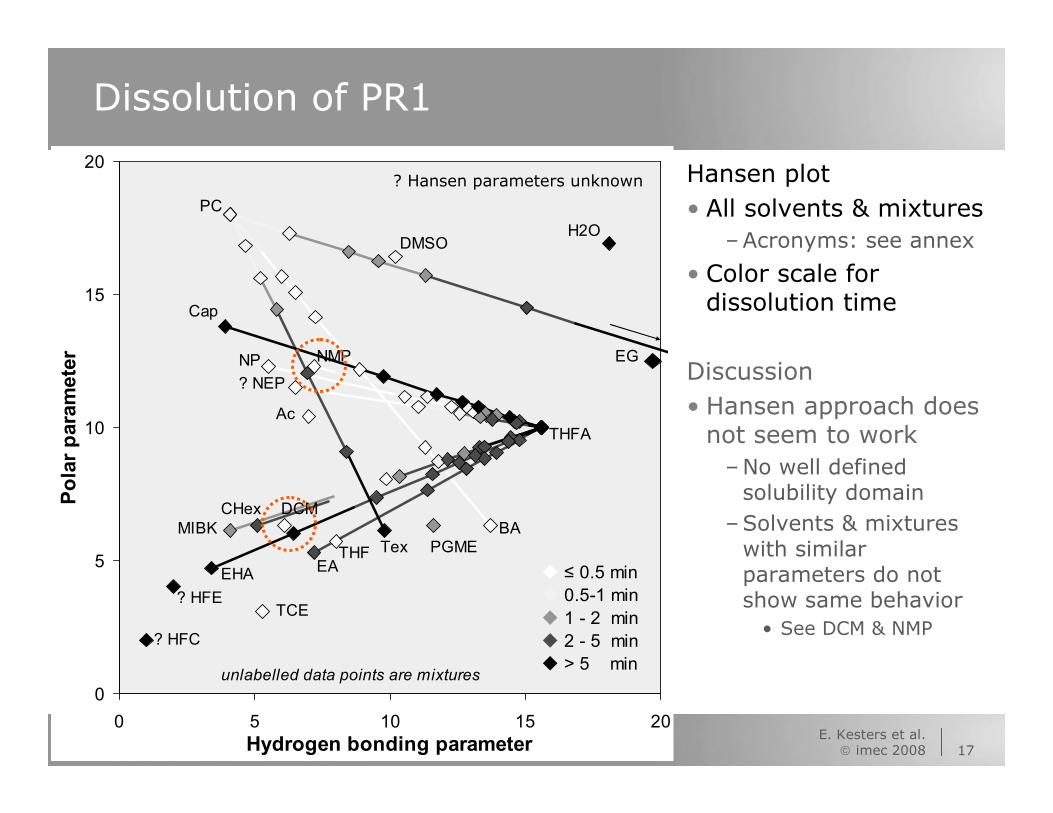
Dissolution of PR1
Hansen plot
• All solvents & mixtures
–Acronyms: see annex
• Color scale for dissolution time
Discussion
• Hansen approach does not seem to work
–No well defined solubility domain
–Solvents & mixtures with similar parameters do not show same behavior
• See DCM & NMP
0
5
10
15
20
0 5 10 15 20
Hydrogen bonding parameter
Polar parameter NMP
Ac
PGME
DCM
MIBK
TCE
CHex
EATHF
THFA
DMSO
Cap
NP
? NEP
? HFE
? HFC
EHA
PC
BATex
EG
H2O
� ≤ 0.5 min
� 0.5-1 min
� 1 - 2 min
� 2 - 5 min
� > 5 minunlabelled data points are mixtures
? Hansen parameters unknown
E. Kesters et al. imec 2008 18
11th POS 2008
Reasons for apparent failure
• Hansen parameters are thermodynamics
↔ Dissolution tests data gives kinetics– Discrepancy points to kinetic factors
– Effect of size of solvent molecules ? • See later
– Microstructure of PR• PR is a (blend of) copolymer(s)
• PR contains additives
• Hansen parameters are 3-D↔ 2-D analysis– See later
E. Kesters et al. imec 2008 19
11th POS 2008
0
5
10
15
20
0 5 10 15 20
Hydrogen bonding parameter
Polar parameter NMP
Ac
DCM
MIBK
EATHF
THFA
DMSO
Cap
NP
? NEP
? HFE
? HFC
EHA
PC
BATex
EG
H2O
unlabelled data points are mixtures
� ≤ 0.5 min
� 0.5-1 min
� 1 - 2 min
� 2 - 5 min
� > 5 min
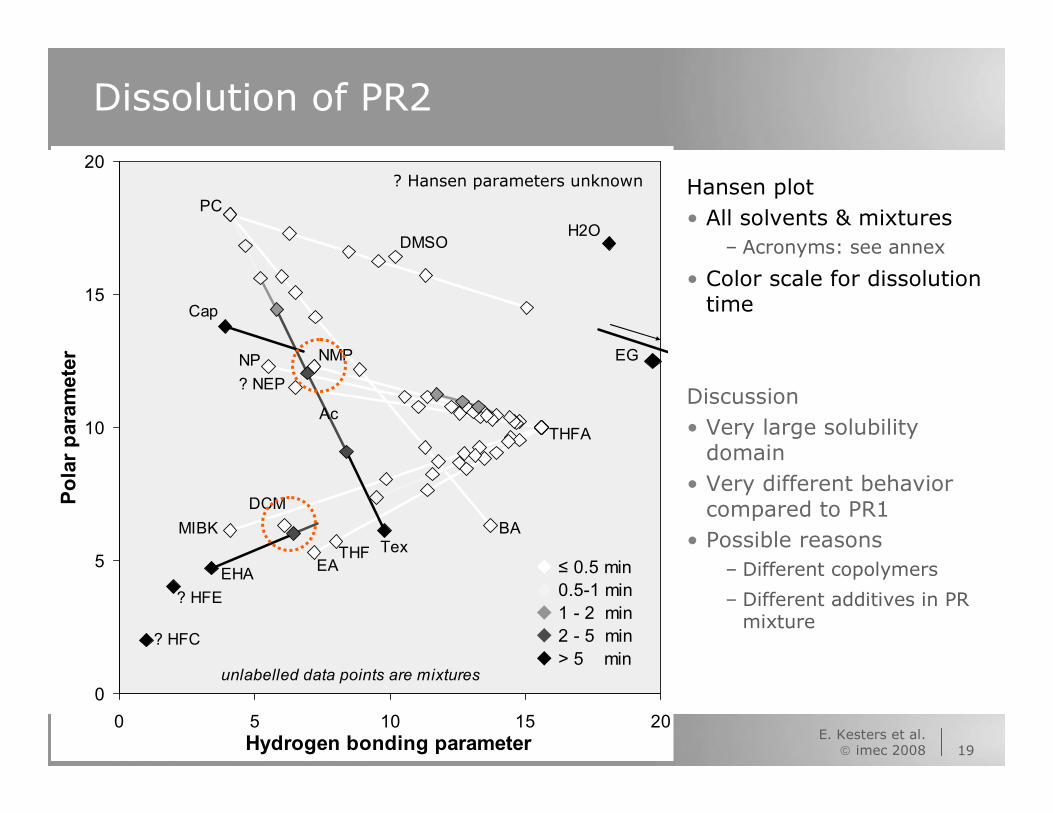
Dissolution of PR2
Hansen plot
• All solvents & mixtures
– Acronyms: see annex
• Color scale for dissolution time
Discussion
• Very large solubility domain
• Very different behavior compared to PR1
• Possible reasons
– Different copolymers
– Different additives in PR mixture
? Hansen parameters unknown

E. Kesters et al. imec 2008 20
11th POS 2008
Summary of solubility tests on pristine PR
• Best pure solvents
– Benzyl alcohol
– (1-nitropropane)1
– NEP
– (NMP)2
– DMSO
– Propylene carbonate1 FP = 33 °C
2 Reprotoxin cat.2
• Mixtures with HFC & HFE
– Not miscible with DMSO (down to 10 %)
– Not miscible with THFA (down to 10 %)
• Ranking of the solvent mixtures
1. Propylene carbonate/benzyl alcohol
2. THFA/1-nitropropane
3. THFA/NEP
4. THFA/NMP2
5. THFA/MIBK
6. THFA/Cyclohexanone
7. THFA/Ethyl Acetate
8. Propylene carbonate/ethylene glycol
9. Propylene carbonate/texanol
10.THFA/2-ethylhexyl acrylate
11.THFA/ε-caprolactam
E. Kesters et al. imec 2008 21
11th POS 2008
Outline
• Introduction
• Materials & methods
• Results & first discussion
• Analysis of the Hansen “spherical” approach to solvent selection
• Conclusions

E. Kesters et al. imec 2008 22
11th POS 2008
Outline
• Review of Method– Based on matching impact of intermolecular forces between solvent and soil
– Presentation format is spherical geometry
– An optimization routine & a two-dimensional plot
• Application to PR1 and PR2 Data Sets– Analysis of specific results
• Key Learnings About “Spherical” Approach– Maintain realistic optimization goals
– Recognize / accept “false” results
– Beware of two-dimensional plots
• Conclusions
E. Kesters et al. imec 2008 23
11th POS 2008
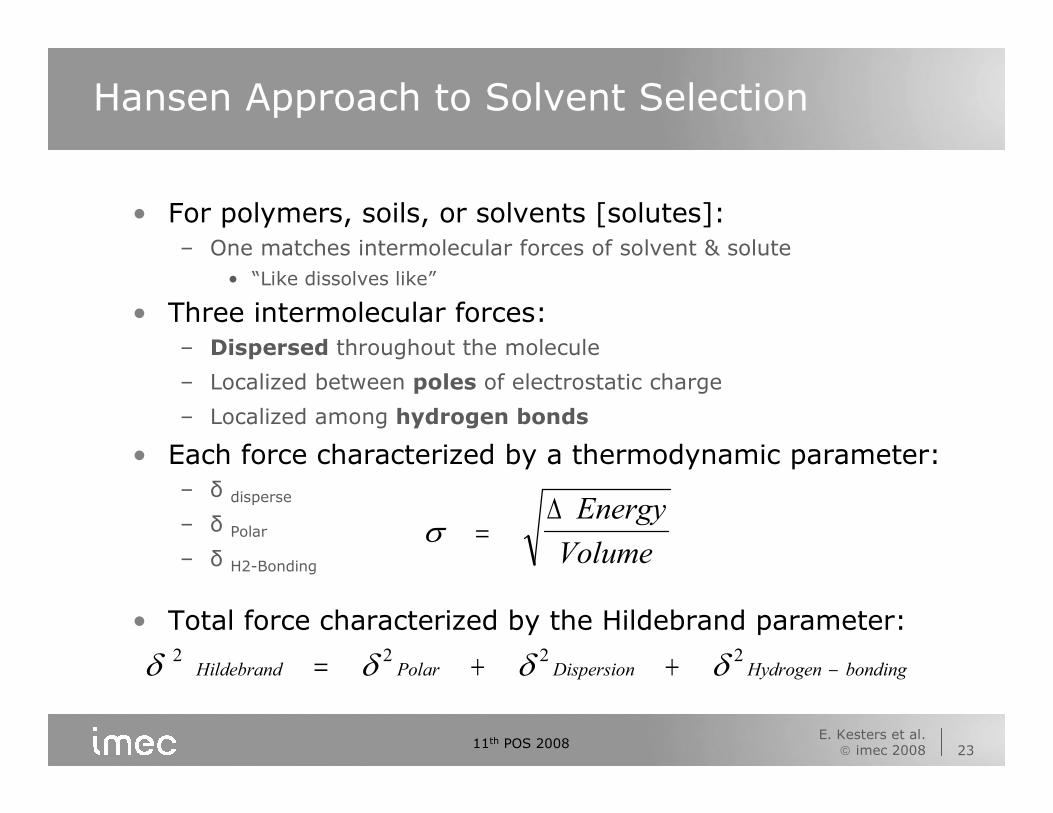
Hansen Approach to Solvent Selection
• For polymers, soils, or solvents [solutes]:
– One matches intermolecular forces of solvent & solute
• “Like dissolves like”
• Three intermolecular forces:
– Dispersed throughout the molecule
– Localized between poles of electrostatic charge
– Localized among hydrogen bonds
• Each force characterized by a thermodynamic parameter:
– δ disperse
– δ Polar
– δ H2-Bonding
• Total force characterized by the Hildebrand parameter:
σ =∆ Energy
Volume
δ δ δ δ2 2 2 2Hildebrand Polar Dispersion Hydrogen bonding= + + −

E. Kesters et al. imec 2008 24
11th POS 2008
A Geometric Vision by Hansen & Coworker
• Each solubility parameter is independent– Impacting in one of three independent coordinates
• A polymer / soil / solvent is located in a three-dimensional space at the values of its solubility parameters.
• The limit of action with another chemical is a radial dimension called RO.
• There will be differentiable outcomes– GOOD and BAD solvency are binary outcomes
– Experimental data are of solution time
– “Solubility Grade” = solution time <> value
E. Kesters et al. imec 2008 25
11th POS 2008
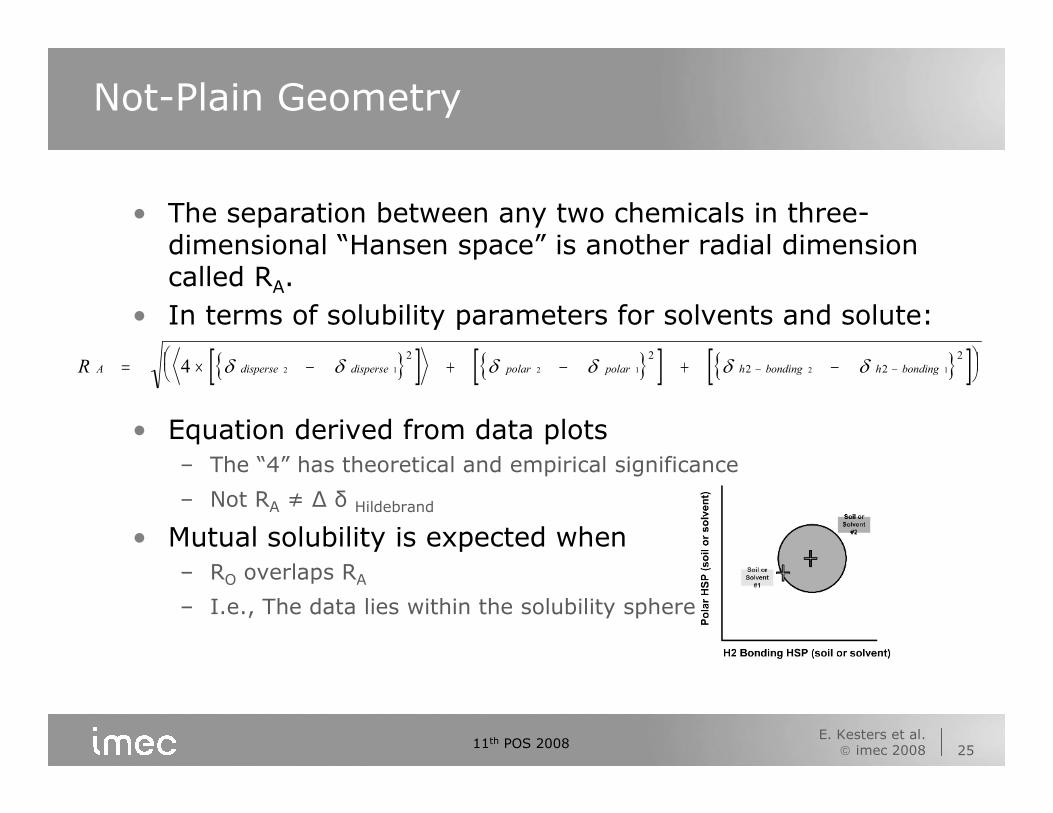
Not-Plain Geometry
• The separation between any two chemicals in three-dimensional “Hansen space” is another radial dimension called RA.
• In terms of solubility parameters for solvents and solute:
• Equation derived from data plots
– The “4” has theoretical and empirical significance
– Not RA ≠ ∆ δ Hildebrand
• Mutual solubility is expected when
– RO overlaps RA
– I.e., The data lies within the solubility sphere
{ }[ ] { }[ ] { }[ ]R A disperse disperse polar polar h bonding h bonding= × − + − + −
− −4 2 1 2 1 2 1
2 2
2 2
2
δ δ δ δ δ δ
E. Kesters et al. imec 2008 26
11th POS 2008
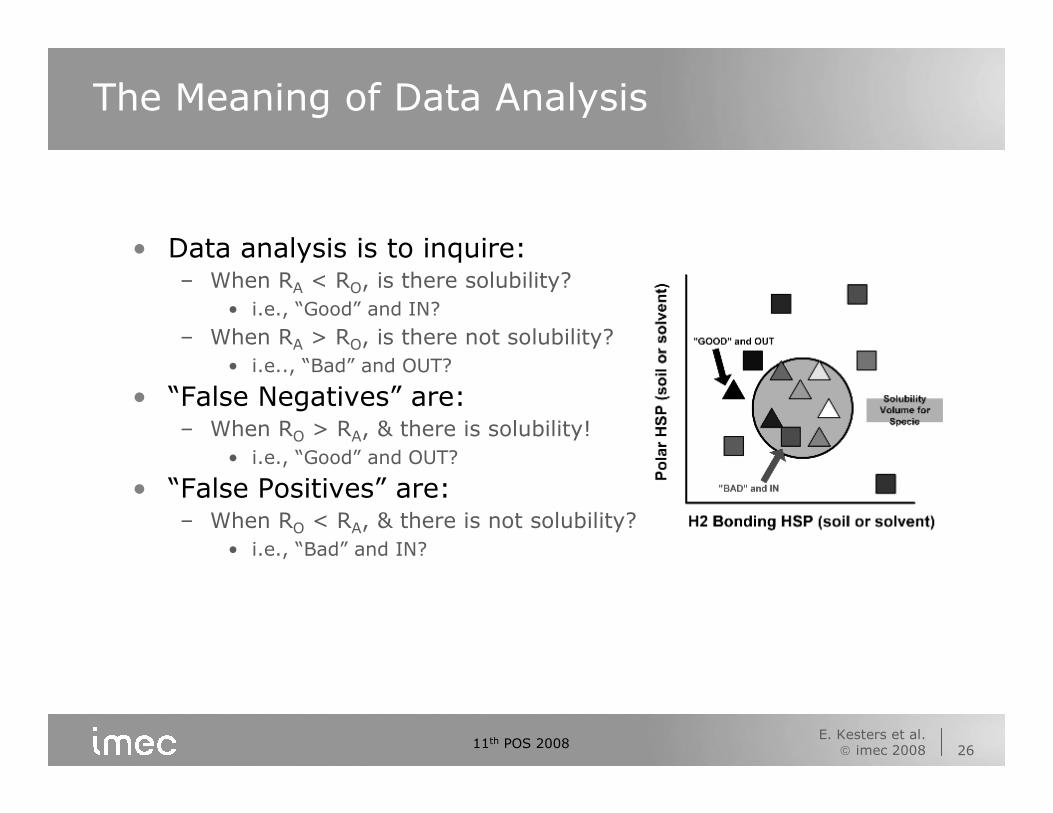
The Meaning of Data Analysis
• Data analysis is to inquire:– When RA < RO, is there solubility?
• i.e., “Good” and IN?
– When RA > RO, is there not solubility?
• i.e.., “Bad” and OUT?
• “False Negatives” are:– When RO > RA, & there is solubility!
• i.e., “Good” and OUT?
• “False Positives” are:– When RO < RA, & there is not solubility?
• i.e., “Bad” and IN?

E. Kesters et al. imec 2008 27
11th POS 2008
Data Processing
• Wanted are the parameters which characterize the material being solubilized
– Will allow selection of new solvents/mixtures
• Optimization identifies the solubility parameters which place all the data where it should be placed:
– So all are “Good” and IN; or “Bad” and OUT.
• The parameters are known for each solvent:
– δ disperse
– δ Polar
– δ H2-Bonding
– RA
{ }δ δany i iX= ×∑X Volume Fractioni =
E. Kesters et al. imec 2008 28
11th POS 2008
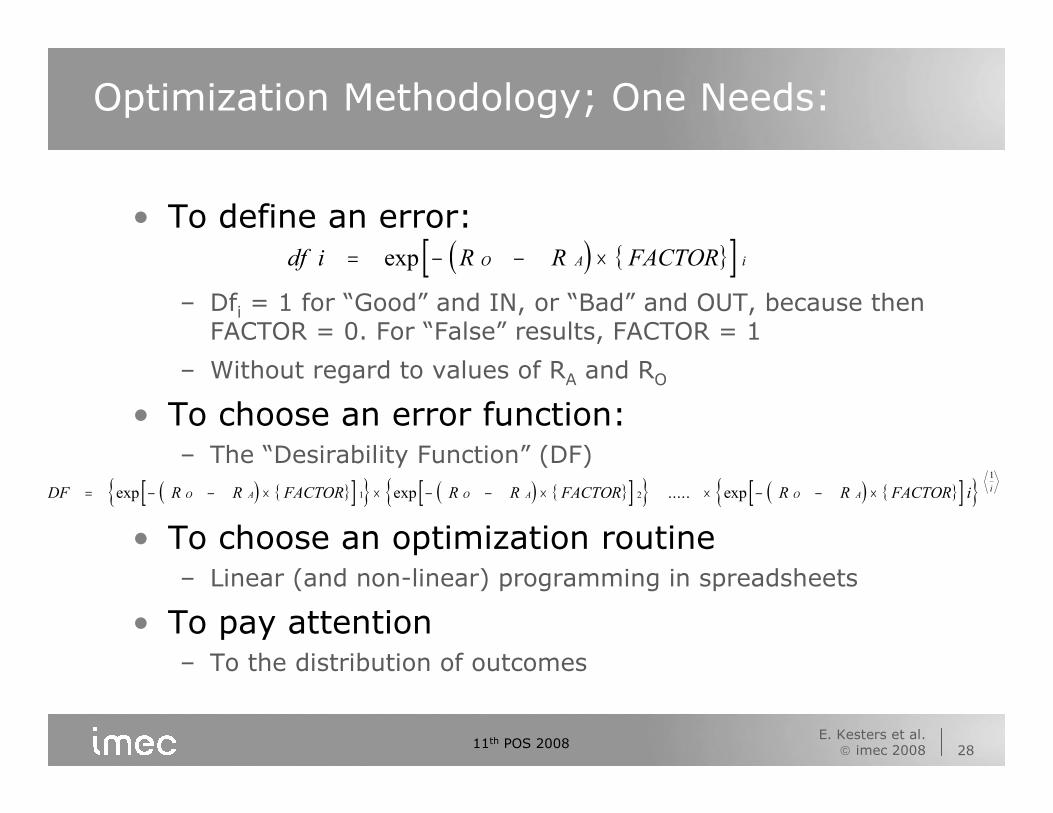
Optimization Methodology; One Needs:
• To define an error:
– Dfi = 1 for “Good” and IN, or “Bad” and OUT, because then FACTOR = 0. For “False” results, FACTOR = 1
– Without regard to values of RA and RO
• To choose an error function:– The “Desirability Function” (DF)
• To choose an optimization routine– Linear (and non-linear) programming in spreadsheets
• To pay attention– To the distribution of outcomes
( ) { }[ ]df i R R FACTORO A i= − − ×exp
( ) { }[ ]{ } ( ) { }[ ]{ } ( ) { }[ ]{ }DF R R FACTOR R R FACTOR R R FACTOR iO A O A O Ai= − − × × − − × × − − ×exp exp ..... exp1 2
1

E. Kesters et al. imec 2008 29
11th POS 2008
Distribution of Outcomes – PR1
0.730113124780.005.6525.5219.18<5
0.720714144390.0011.1921.9413.52<2
0.83849928340.0011.7619.7610.67<1
1.000008009.589.5222.4923.69>5
0.85405620490.0010.5618.929.35< 0.5
Optimized MPa^(1/2)
DFGood & OUT
Bad & IN
Good & IN
Bad & Out
ð H2 Bonding
ð Polar
ð Dispersion
RASolution Time, Min
HSP Optimization with PR1 Photoresist
• The goal optimum (DF = 1) includes all data, i.e.– No optimization being done
• A significant amount of data is properly considered @ < 0.5 min– 69 of 80 data points
• Targets were methylene chloride and n-methyl pyrrolidone
E. Kesters et al. imec 2008 30
11th POS 2008
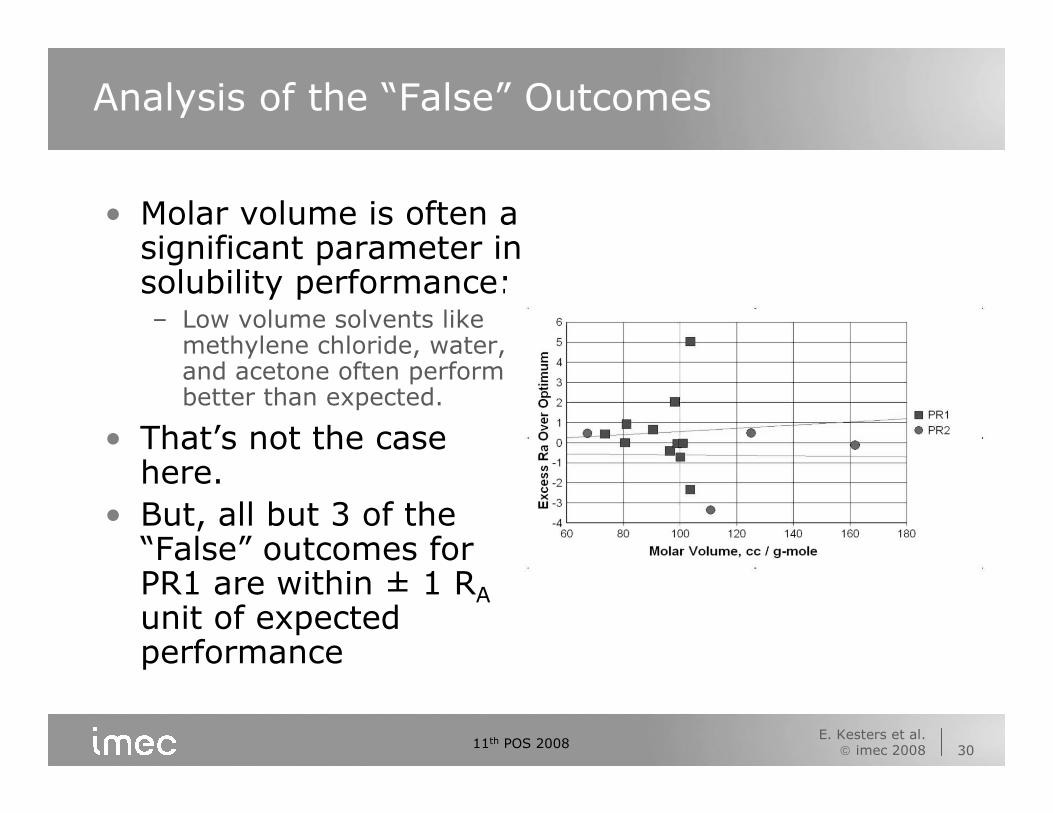
Analysis of the “False” Outcomes
• Molar volume is often a significant parameter in solubility performance:– Low volume solvents like methylene chloride, water, and acetone often perform better than expected.
• That’s not the case here.
• But, all but 3 of the “False” outcomes for PR1 are within ± 1 RA
unit of expected performance
E. Kesters et al. imec 2008 31
11th POS 2008
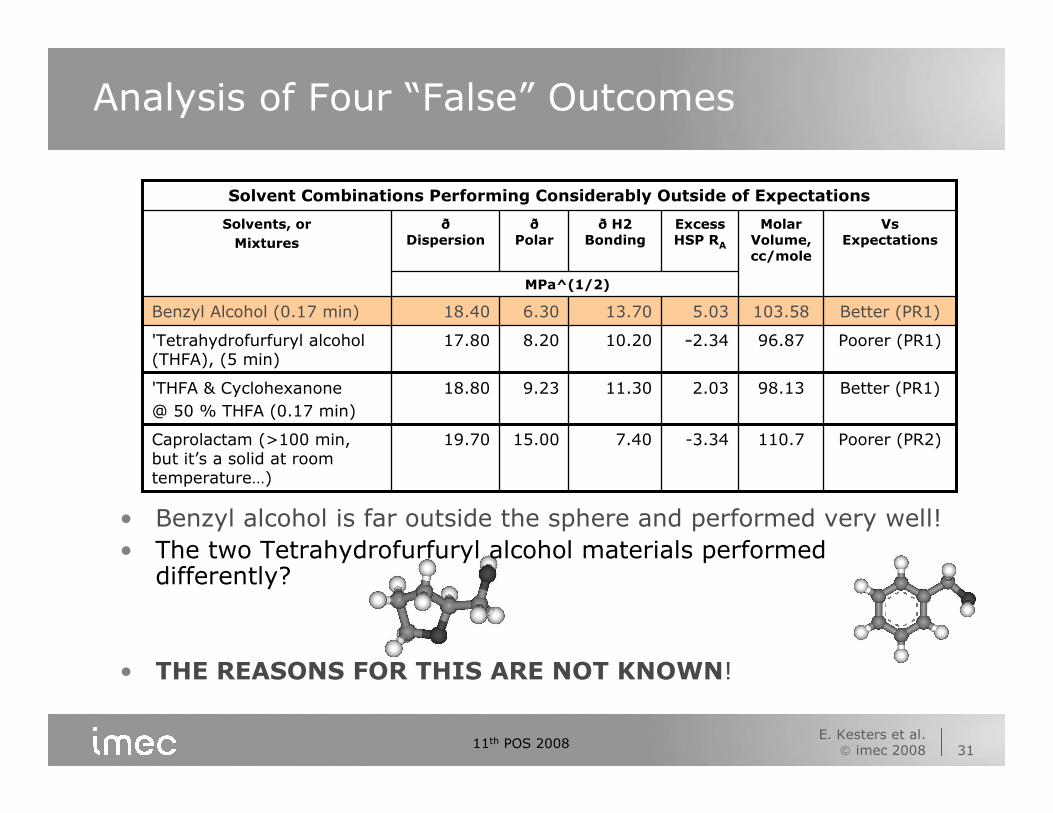
Analysis of Four “False” Outcomes
Better (PR1)98.132.0311.309.2318.80'THFA & Cyclohexanone
@ 50 % THFA (0.17 min)
Poorer (PR1)96.87-2.3410.208.2017.80'Tetrahydrofurfuryl alcohol (THFA), (5 min)
Poorer (PR2)110.7-3.347.4015.0019.70Caprolactam (>100 min, but it’s a solid at room temperature…)
Better (PR1)103.585.0313.706.3018.40Benzyl Alcohol (0.17 min)
MPa^(1/2)
Vs Expectations
Molar Volume, cc/mole
Excess HSP RA
ð H2 Bonding
ð Polar
ð Dispersion
Solvents, or
Mixtures
Solvent Combinations Performing Considerably Outside of Expectations
• Benzyl alcohol is far outside the sphere and performed very well!
• The two Tetrahydrofurfuryl alcohol materials performed differently?
• THE REASONS FOR THIS ARE NOT KNOWN!
E. Kesters et al. imec 2008 32
11th POS 2008
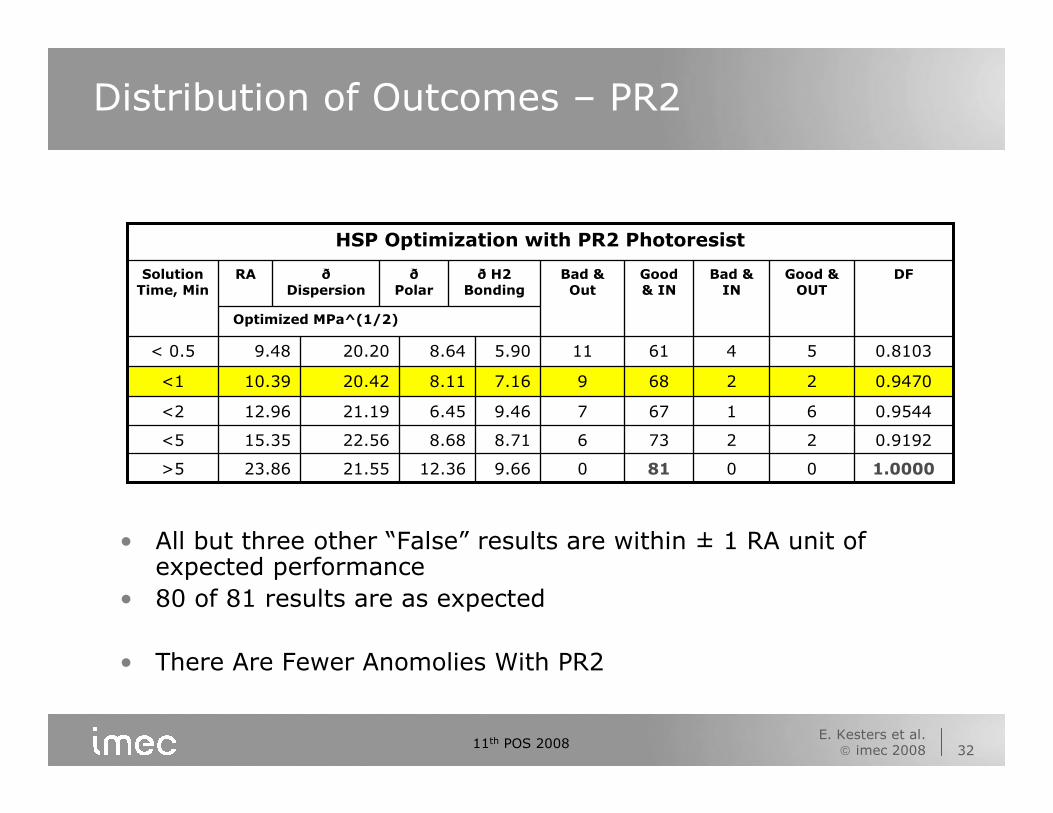
Distribution of Outcomes – PR2
0.9192227368.718.6822.5615.35<5
0.9544616779.466.4521.1912.96<2
0.9470226897.168.1120.4210.39<1
1.0000008109.6612.3621.5523.86>5
0.81035461115.908.6420.209.48< 0.5
Optimized MPa^(1/2)
DFGood & OUT
Bad & IN
Good & IN
Bad & Out
ð H2 Bonding
ð Polar
ð Dispersion
RASolution Time, Min
HSP Optimization with PR2 Photoresist
• All but three other “False” results are within ± 1 RA unit of expected performance
• 80 of 81 results are as expected
• There Are Fewer Anomolies With PR2

E. Kesters et al. imec 2008 33
11th POS 2008
Solvents Selected for Low Molar Volume
E. Kesters et al. imec 2008 34
11th POS 2008
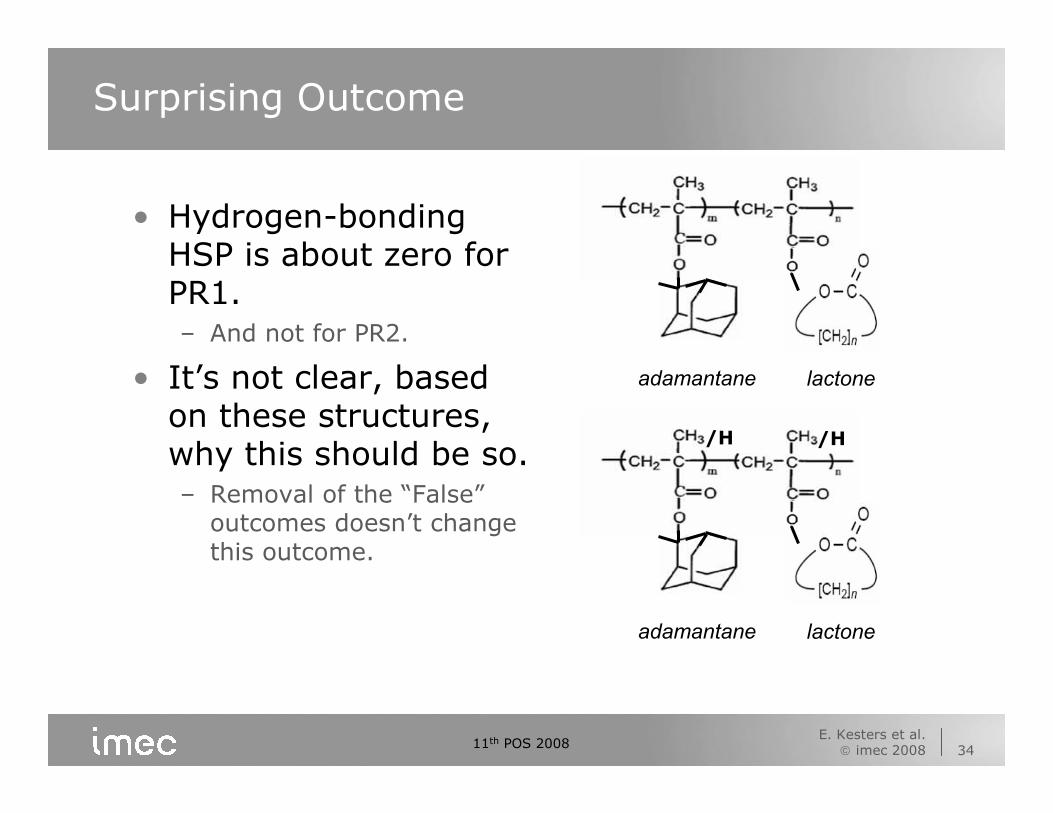
Surprising Outcome
• Hydrogen-bonding HSP is about zero for PR1.– And not for PR2.
• It’s not clear, based on these structures, why this should be so.– Removal of the “False”outcomes doesn’t change this outcome.
adamantane lactone
adamantane lactone
/H /H
E. Kesters et al. imec 2008 35
11th POS 2008
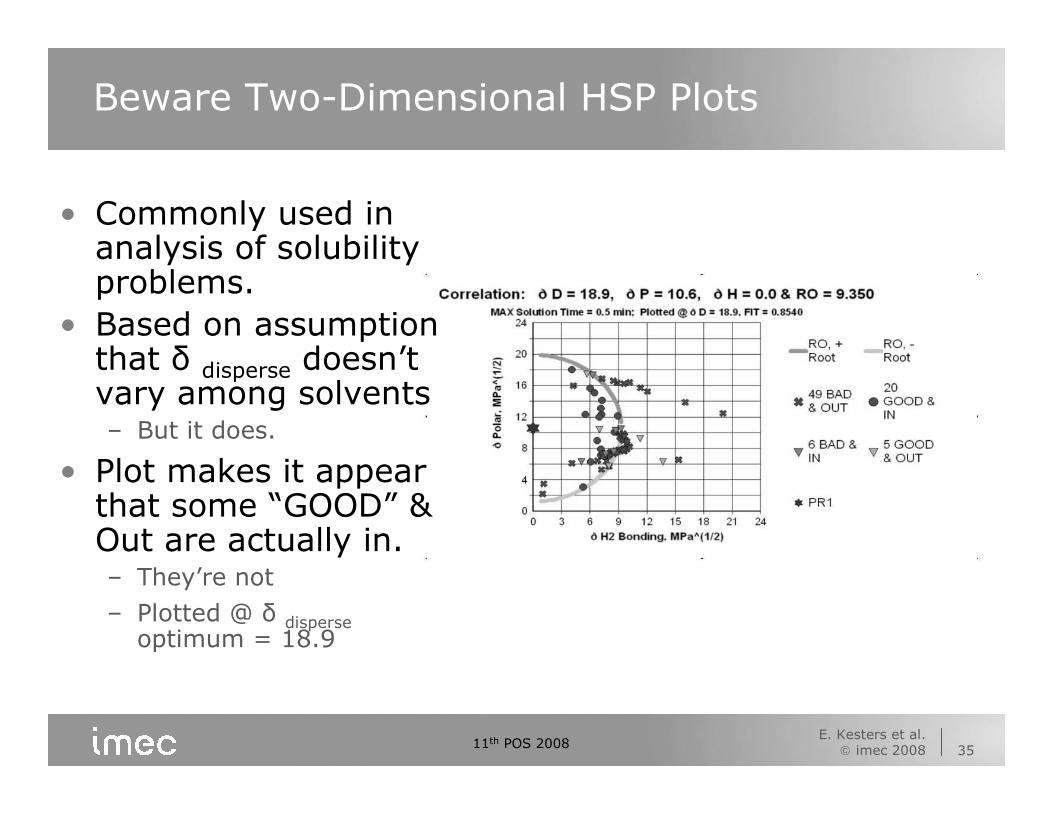
Beware Two-Dimensional HSP Plots
• Commonly used in analysis of solubility problems.
• Based on assumption that δ disperse doesn’t vary among solvents– But it does.
• Plot makes it appear that some “GOOD” & Out are actually in.– They’re not
– Plotted @ δ disperseoptimum = 18.9
E. Kesters et al. imec 2008 36
11th POS 2008
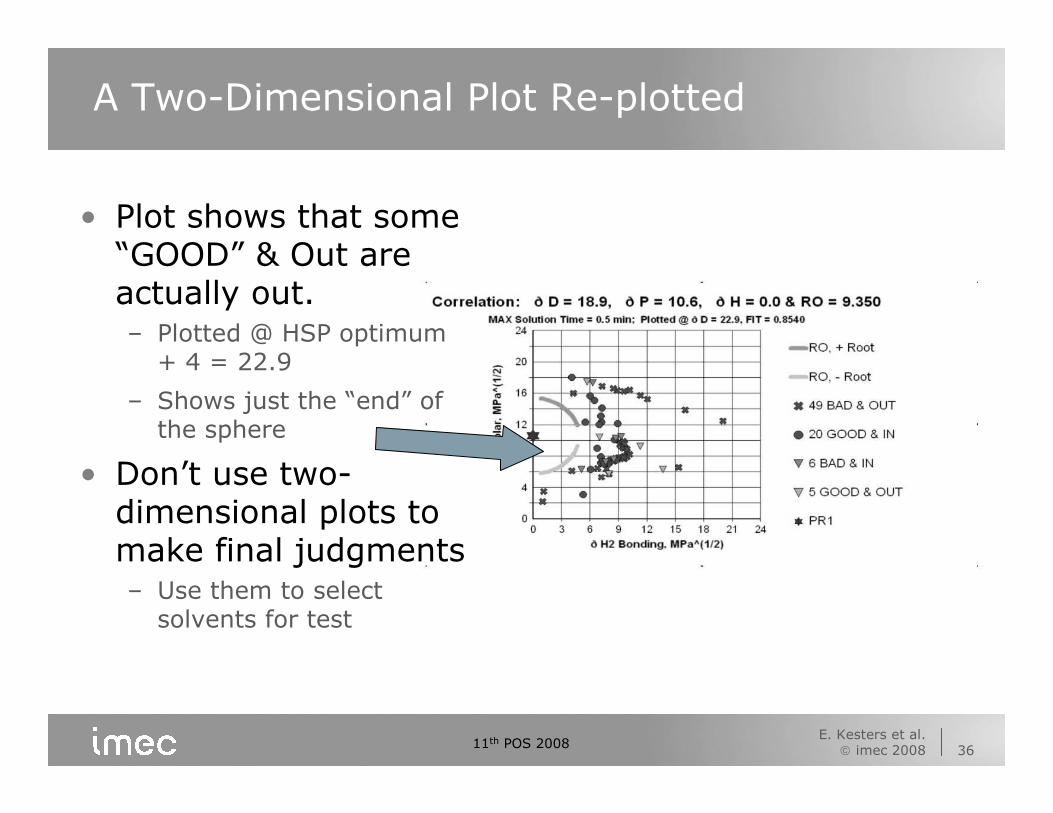
A Two-Dimensional Plot Re-plotted
• Plot shows that some “GOOD” & Out are actually out.– Plotted @ HSP optimum + 4 = 22.9
– Shows just the “end” of the sphere
• Don’t use two-dimensional plots to make final judgments– Use them to select solvents for test
E. Kesters et al. imec 2008 37
11th POS 2008
Outline
• Introduction
• Materials & methods
• Results & first discussion
• Analysis of the Hansen “spherical” approach to solvent selection
• Conclusions
E. Kesters et al. imec 2008 38
11th POS 2008
Conclusions
• Several ESH solvents & mixtures identified that can dissolve the PRs
• Selection is dependent on PR– Kinetics vs. thermodynamics
– PR is a (blend of) different copolymer(s)
– PR is a complex mixture (with different additives)
E. Kesters et al. imec 2008 39
11th POS 2008
Conclusions
• Hansen “spherical” approach shows measured solubility data set “thermodynamically”consistent.– 18 for PR1 (< 0.5 min solution time)
– 62 for PR2 (< 0.5 min solution time)
• The HSP and RA values are known for the PRs– For additional evaluations
• Care must be taken with the “spherical”approach.– It can produce unexplained outliers
– DF =1 is not the optimization target
• Properly-located assignments Vs Solubility Grades are
– Don’t make judgments from 2-D plots

E. Kesters et al. imec 2008 40
11th POS 2008
E. Kesters et al. imec 2008 41
11th POS 2008
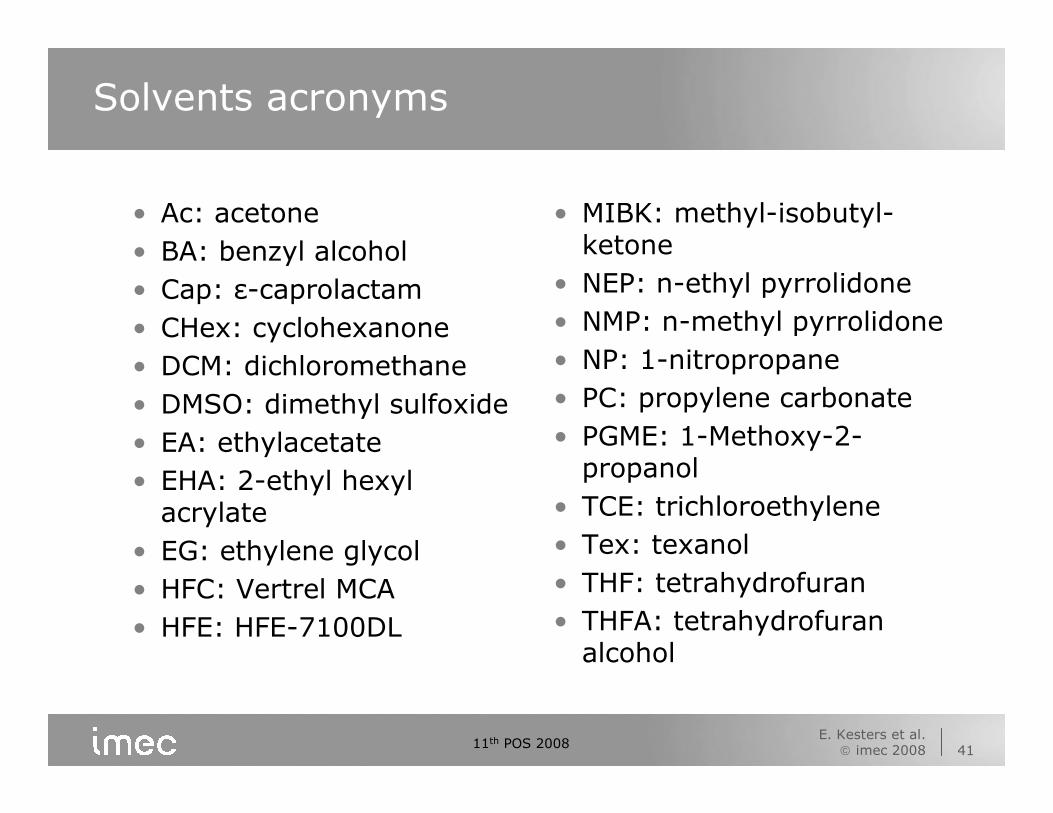
Solvents acronyms
• Ac: acetone
• BA: benzyl alcohol
• Cap: ε-caprolactam
• CHex: cyclohexanone
• DCM: dichloromethane
• DMSO: dimethyl sulfoxide
• EA: ethylacetate
• EHA: 2-ethyl hexylacrylate
• EG: ethylene glycol
• HFC: Vertrel MCA
• HFE: HFE-7100DL
• MIBK: methyl-isobutyl-ketone
• NEP: n-ethyl pyrrolidone
• NMP: n-methyl pyrrolidone
• NP: 1-nitropropane
• PC: propylene carbonate
• PGME: 1-Methoxy-2-propanol
• TCE: trichloroethylene
• Tex: texanol
• THF: tetrahydrofuran
• THFA: tetrahydrofuranalcohol


