87
87
Saturation And Value Modulation (SVM): A New Method For Integrating Color And Grayscale Imagery
ByDavidW.Viljoen1andJeffR.Harris2
GeologicalSurveyofCanada615BoothSt.
Ottawa,ON,K1A0E9Telephone:(613)995-1207
Fax:(613)995-9273e-mail:[email protected];[email protected]
ABSTRACT
Algorithmsforintegratingcolorimagerywithgrayscaleimageryhavelongbeenanimportantfeatureofmanyremotesensing(RS)imageanalysisandgeographicinformationsystems(G�S).TraditionalmethodsfordataintegrationincludeRed-Green-Blue(RGB)/Hue-Satura-tion-Value(HSV)transformationandRGBmodulation.However, these techniques are either inflexible or present acompromisebetweenthequalityofthecolorandthecontributionoftheshading.Furthermore,thesetechniquescanalsoresultinseriouscolordistortions.Layertranspar-encyisanotherpopulartechniqueforintegratingdatathatisavailableinmostRSandG�Ssoftwarepackages.How-ever,optimalintegrationofcolorandgrayscaleimageryisdifficult to achieve using this method.
We briefly review the shortcomings of these tradition-alimageintegrationmethodsandintroduceanewmethod(Saturation-Value-Modulation[SVM])forrasterimageintegrationdevelopedbyDavidViljoenattheGeologicalSurvey of Canada. SVM is flexible and does not compro-misethecolororgrayscalecomponentsoftheresultingintegratedimage.Thegeneralconceptsbehindthisalgo-rithm as well as the five parameters used to control the in-tegrationprocessarediscussed.VariousexamplesofhowSVMcanbeusedtointegratevariousgeosciencedataarealsopresented.Finally,weprovideabriefoverviewoftheESR�ArcG�SimplementationofSVM,thoughwedonotincludeadetailedpresentationoftheactualVisualBasiccodeorthealgorithm.
TheArcG�Smapdocument(MXD)thatcontainstheVBA(VisualBasicforApplications)codeisavailablefordownloadforthosewhowishtouseSVM.
INTRODUCTION
Therearetwoprimaryreasonsforintegratingacolorimage with a grayscale image. The first is to provide vi-sualenhancementofasingledatasetbycombiningdiffer-
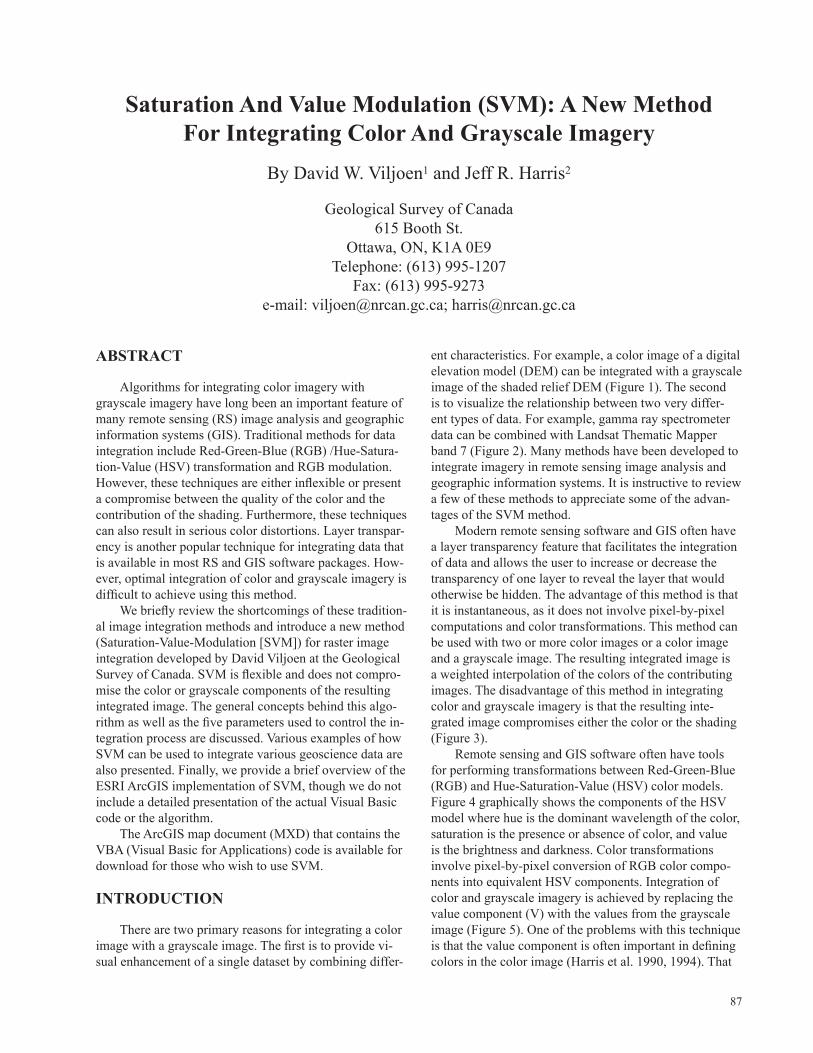
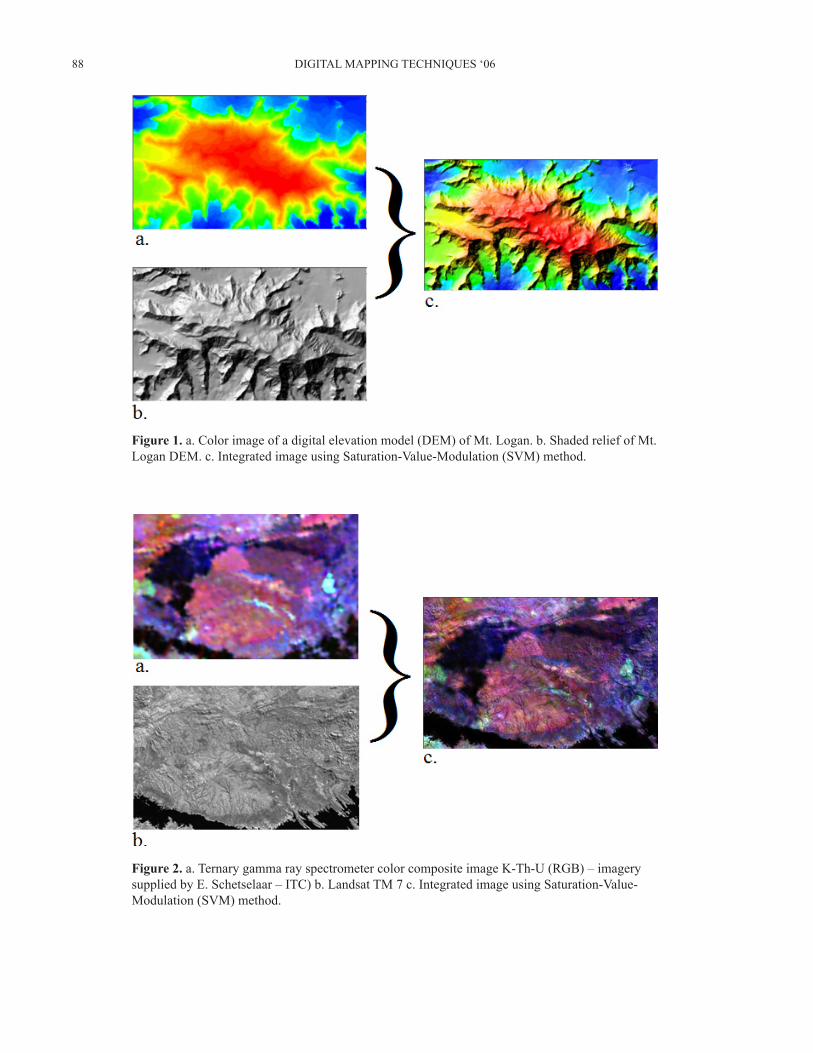
entcharacteristics.Forexample,acolorimageofadigitalelevationmodel(DEM)canbeintegratedwithagrayscaleimageoftheshadedreliefDEM(Figure1).Thesecondistovisualizetherelationshipbetweentwoverydiffer-enttypesofdata.Forexample,gammarayspectrometerdatacanbecombinedwithLandsatThematicMapperband7(Figure2).Manymethodshavebeendevelopedtointegrateimageryinremotesensingimageanalysisandgeographicinformationsystems.�tisinstructivetoreviewafewofthesemethodstoappreciatesomeoftheadvan-tagesoftheSVMmethod.
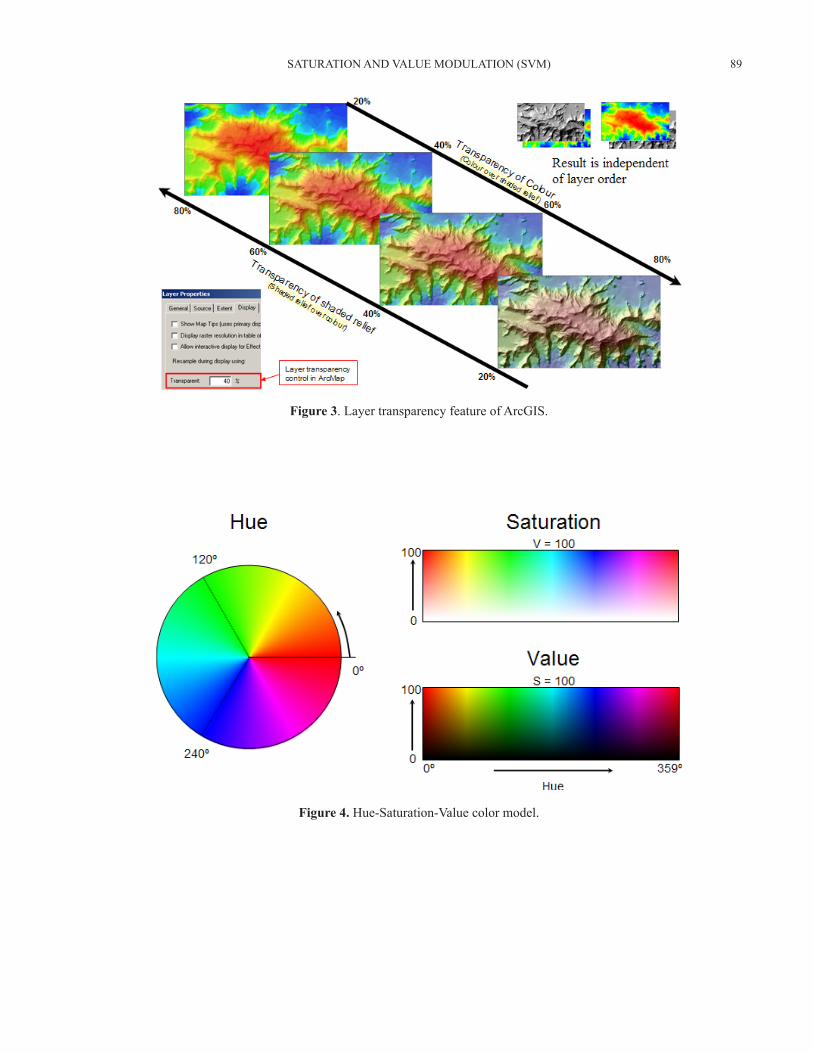
ModernremotesensingsoftwareandG�Softenhavealayertransparencyfeaturethatfacilitatestheintegrationofdataandallowstheusertoincreaseordecreasethetransparencyofonelayertorevealthelayerthatwouldotherwisebehidden.Theadvantageofthismethodisthatitisinstantaneous,asitdoesnotinvolvepixel-by-pixelcomputationsandcolortransformations.Thismethodcanbeusedwithtwoormorecolorimagesoracolorimageandagrayscaleimage.Theresultingintegratedimageisaweightedinterpolationofthecolorsofthecontributingimages.Thedisadvantageofthismethodinintegratingcolorandgrayscaleimageryisthattheresultinginte-gratedimagecompromiseseitherthecolorortheshading(Figure3).
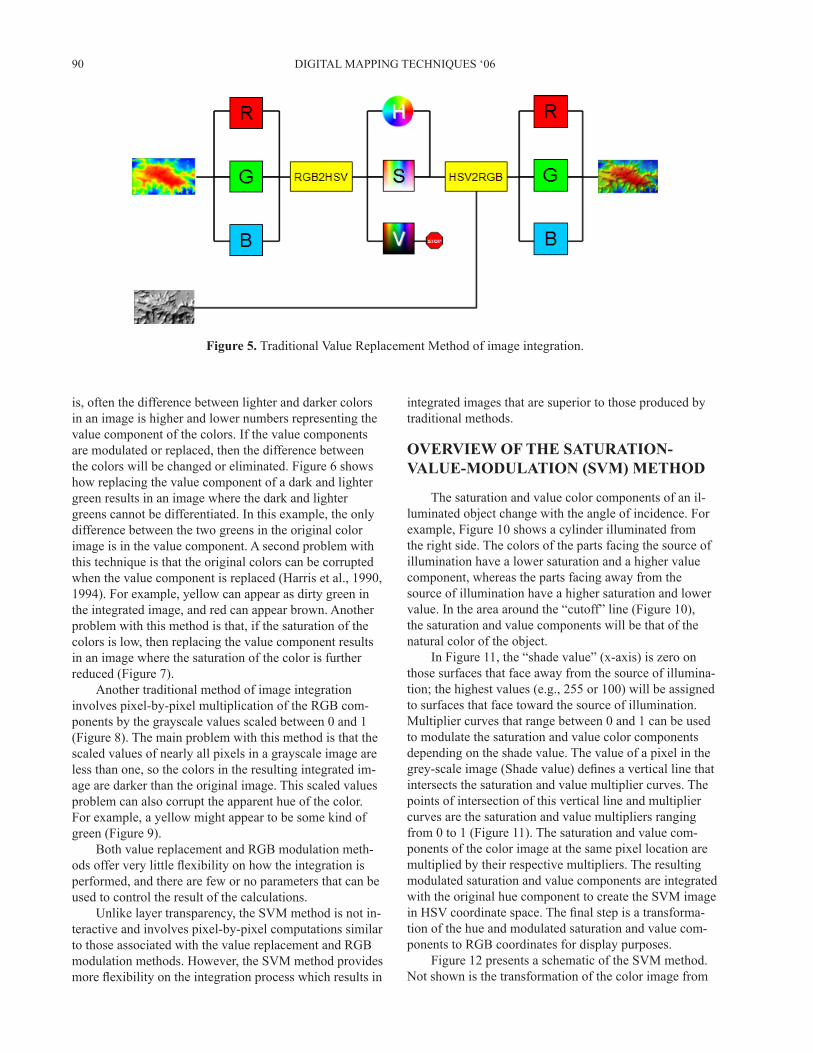
RemotesensingandG�SsoftwareoftenhavetoolsforperformingtransformationsbetweenRed-Green-Blue(RGB)andHue-Saturation-Value(HSV)colormodels.Figure4graphicallyshowsthecomponentsoftheHSVmodelwherehueisthedominantwavelengthofthecolor,saturationisthepresenceorabsenceofcolor,andvalueisthebrightnessanddarkness.Colortransformationsinvolvepixel-by-pixelconversionofRGBcolorcompo-nentsintoequivalentHSVcomponents.�ntegrationofcolorandgrayscaleimageryisachievedbyreplacingthevaluecomponent(V)withthevaluesfromthegrayscaleimage(Figure5).Oneoftheproblemswiththistechniqueis that the value component is often important in defining colorsinthecolorimage(Harrisetal.1990,1994).That
88 D�G�TALMAPP�NGTECHN�QUES‘06
Figure 1.a.Colorimageofadigitalelevationmodel(DEM)ofMt.Logan.b.ShadedreliefofMt.LoganDEM.c.�ntegratedimageusingSaturation-Value-Modulation(SVM)method.
Figure 2.a.TernarygammarayspectrometercolorcompositeimageK-Th-U(RGB)–imagerysuppliedbyE.Schetselaar–�TC)b.LandsatTM7c.�ntegratedimageusingSaturation-Value-Modulation(SVM)method.
89SATURAT�ONANDVALUEMODULAT�ON(SVM)
Figure 3.LayertransparencyfeatureofArcG�S.
Figure 4.Hue-Saturation-Valuecolormodel.
90 D�G�TALMAPP�NGTECHN�QUES‘06
Figure 5.TraditionalValueReplacementMethodofimageintegration.
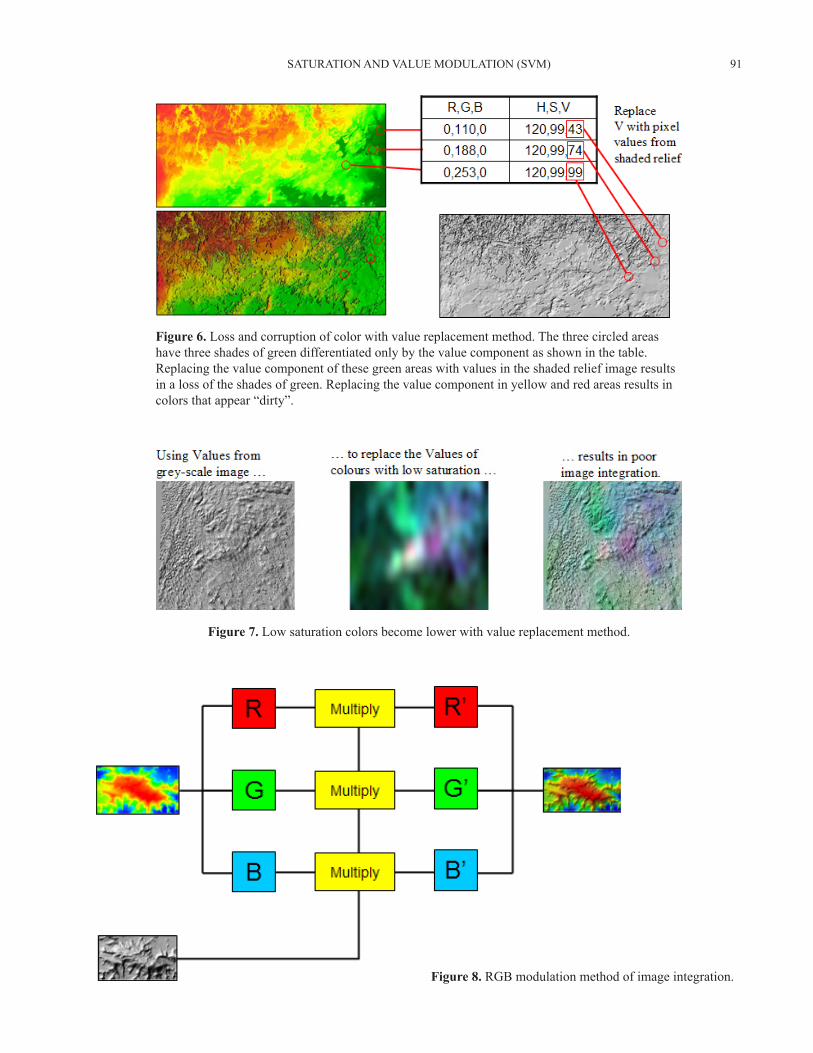
is,oftenthedifferencebetweenlighteranddarkercolorsinanimageishigherandlowernumbersrepresentingthevaluecomponentofthecolors.�fthevaluecomponentsaremodulatedorreplaced,thenthedifferencebetweenthecolorswillbechangedoreliminated.Figure6showshowreplacingthevaluecomponentofadarkandlightergreenresultsinanimagewherethedarkandlightergreenscannotbedifferentiated.�nthisexample,theonlydifferencebetweenthetwogreensintheoriginalcolorimageisinthevaluecomponent.Asecondproblemwiththistechniqueisthattheoriginalcolorscanbecorruptedwhenthevaluecomponentisreplaced(Harrisetal.,1990,1994).Forexample,yellowcanappearasdirtygreenintheintegratedimage,andredcanappearbrown.Anotherproblemwiththismethodisthat,ifthesaturationofthecolorsislow,thenreplacingthevaluecomponentresultsinanimagewherethesaturationofthecolorisfurtherreduced(Figure7).
Anothertraditionalmethodofimageintegrationinvolvespixel-by-pixelmultiplicationoftheRGBcom-ponentsbythegrayscalevaluesscaledbetween0and1(Figure8).Themainproblemwiththismethodisthatthescaledvaluesofnearlyallpixelsinagrayscaleimagearelessthanone,sothecolorsintheresultingintegratedim-agearedarkerthantheoriginalimage.Thisscaledvaluesproblemcanalsocorrupttheapparenthueofthecolor.Forexample,ayellowmightappeartobesomekindofgreen(Figure9).
BothvaluereplacementandRGBmodulationmeth-ods offer very little flexibility on how the integration is performed,andtherearefewornoparametersthatcanbeusedtocontroltheresultofthecalculations.
Unlikelayertransparency,theSVMmethodisnotin-teractiveandinvolvespixel-by-pixelcomputationssimilartothoseassociatedwiththevaluereplacementandRGBmodulationmethods.However,theSVMmethodprovidesmore flexibility on the integration process which results in
integratedimagesthataresuperiortothoseproducedbytraditionalmethods.
OVERVIEW OF THE SATURATION- VALUE-MODULATION (SVM) METHOD
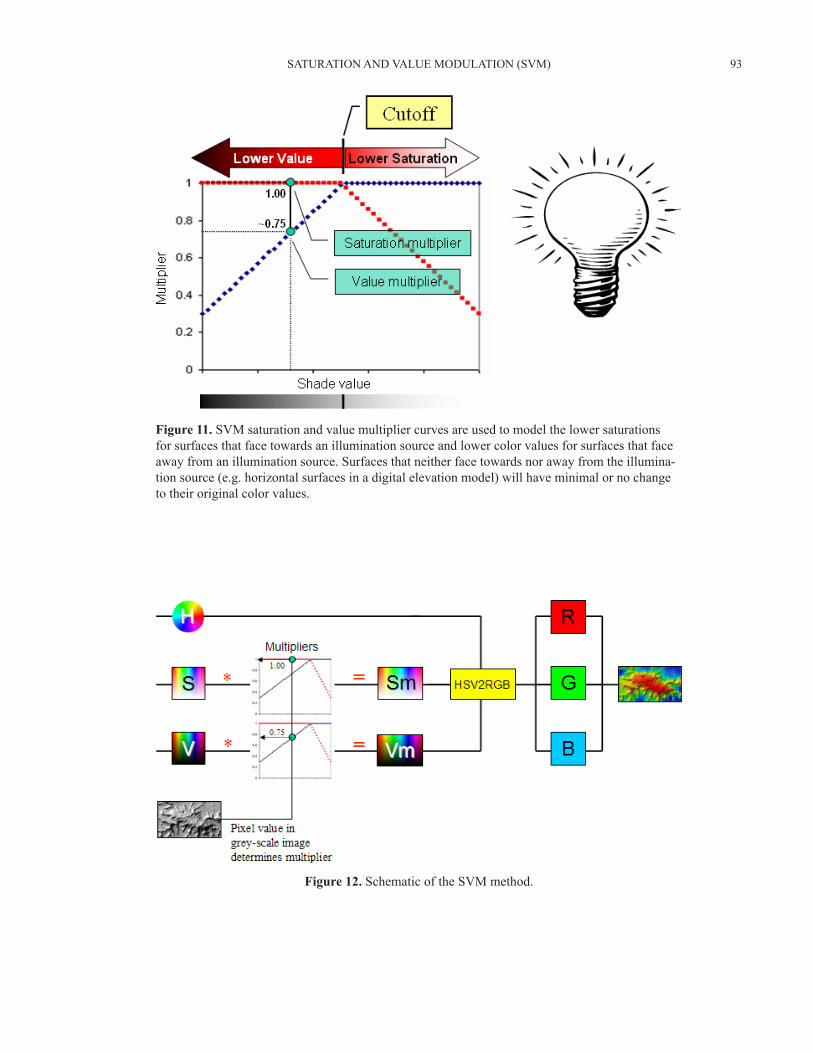
Thesaturationandvaluecolorcomponentsofanil-luminatedobjectchangewiththeangleofincidence.Forexample,Figure10showsacylinderilluminatedfromtherightside.Thecolorsofthepartsfacingthesourceofilluminationhavealowersaturationandahighervaluecomponent,whereasthepartsfacingawayfromthesourceofilluminationhaveahighersaturationandlowervalue.�ntheareaaroundthe“cutoff”line(Figure10),thesaturationandvaluecomponentswillbethatofthenaturalcoloroftheobject.
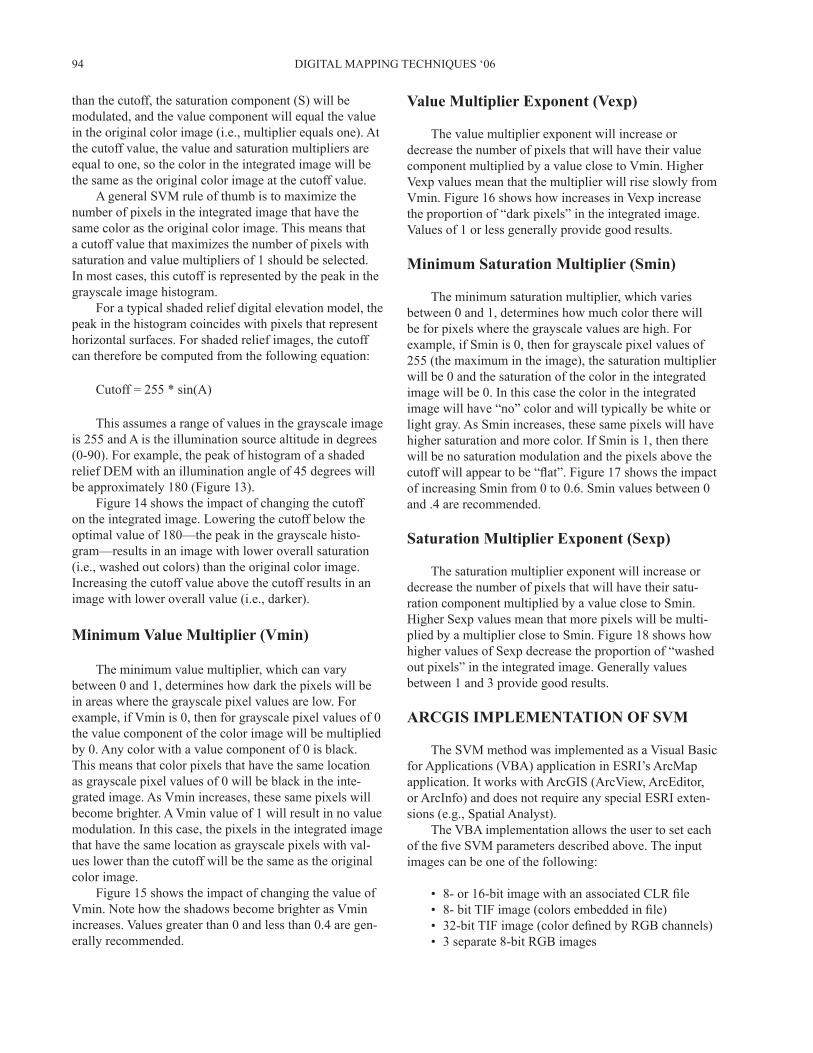
�nFigure11,the“shadevalue”(x-axis)iszeroonthosesurfacesthatfaceawayfromthesourceofillumina-tion;thehighestvalues(e.g.,255or100)willbeassignedtosurfacesthatfacetowardthesourceofillumination.Multipliercurvesthatrangebetween0and1canbeusedtomodulatethesaturationandvaluecolorcomponentsdependingontheshadevalue.Thevalueofapixelinthegrey-scale image (Shade value) defines a vertical line that intersectsthesaturationandvaluemultipliercurves.Thepointsofintersectionofthisverticallineandmultipliercurvesarethesaturationandvaluemultipliersrangingfrom0to1(Figure11).Thesaturationandvaluecom-ponentsofthecolorimageatthesamepixellocationaremultipliedbytheirrespectivemultipliers.TheresultingmodulatedsaturationandvaluecomponentsareintegratedwiththeoriginalhuecomponenttocreatetheSVMimagein HSV coordinate space. The final step is a transforma-tionofthehueandmodulatedsaturationandvaluecom-ponentstoRGBcoordinatesfordisplaypurposes.
Figure12presentsaschematicoftheSVMmethod.Notshownisthetransformationofthecolorimagefrom
91SATURAT�ONANDVALUEMODULAT�ON(SVM)
Figure 6.Lossandcorruptionofcolorwithvaluereplacementmethod.Thethreecircledareashavethreeshadesofgreendifferentiatedonlybythevaluecomponentasshowninthetable.Replacingthevaluecomponentofthesegreenareaswithvaluesintheshadedreliefimageresultsinalossoftheshadesofgreen.Replacingthevaluecomponentinyellowandredareasresultsincolorsthatappear“dirty”.
Figure 7.Lowsaturationcolorsbecomelowerwithvaluereplacementmethod.
Figure 8.RGBmodulationmethodofimageintegration.
92 D�G�TALMAPP�NGTECHN�QUES‘06
Figure 9.a.ColorDEMimageofnorthernManitoba.b.ShadedreliefofnorthernManitobaDEM.c.�ntegratedimageusingRGBmodulationmethod.Theboxhighlightsanareawherelightgreen,yellow,andlightredpixelshavebeentransformedtodarkercolorssinceallpixelshavebeenmultipliedbyavaluefromtheshadedreliefimageoflessthan1.�nfact,virtuallyallpixelswillbemultipliedbymultiplierslessthan1whichcreatesadarkeroverallintegratedimageproduct.
Figure 10.ArainbowcoloredcylinderillustratestheSaturation-Value-Modulation(SVM)Concept.Forsur-facesfacingtheilluminationsource,thecolorshavefullvaluebutlowersaturation.Forsurfacesfacingaway,thecolorshavefullsaturationbutlowervalue.Forsurfacesatthe“cutoff”,thecolorhasfullsaturationandvalue.
RGBtoHSVcomponents.Theschematicshowshowthesaturation(S)andvalue(V)componentsaremodulatedbymultipliersthataredeterminedbythepixelvalueinthegrayscaleimage.Themodulatedsaturation(Sm)andvalue(Vm)areusedwiththeoriginalhuecomponentandtransformed to an RGB composite image file that can be displayedinremotesensingsoftwareoraG�S.Themulti-plier curves and the parameters that define their shape are keyelementsoftheSVMmethod.
SVM Parameters
There are five SVM parameters necessary to define theshapeofthesaturationandvaluemultipliercurves.Together,theyprovidetheabilitytocontrolvariouschar-acteristicsoftheresultingintegratedimage.
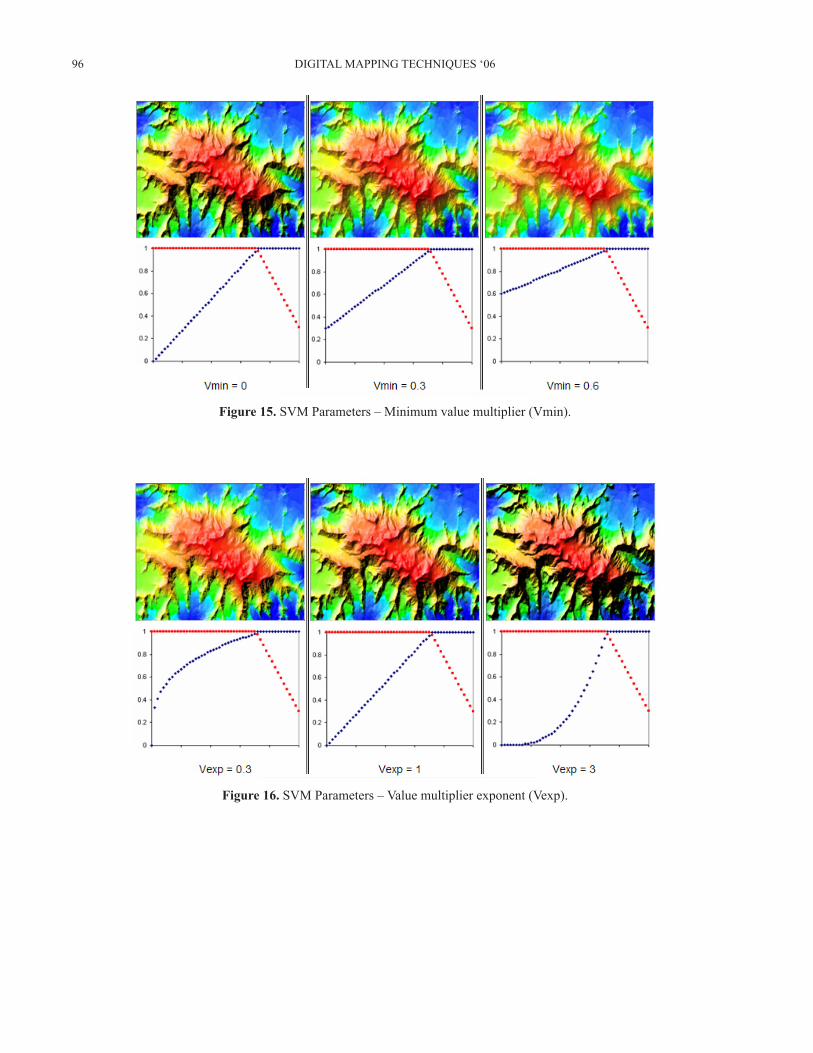
Grayscale Value Cutoff (CutOff)
�ncaseswherethepixelvaluesinagrayscaleimagearelowerthanthe“grayscalevaluecutoff”(seeFigure11),thevaluecomponent(V)ofthecolorimagewillbemodulated,andthesaturationcomponentwillbeequaltothesaturationintheoriginalcolorimage(i.e.saturationmultiplierequalsone).Forgrayscalepixelvaluesgreater
93SATURAT�ONANDVALUEMODULAT�ON(SVM)
Figure 11.SVMsaturationandvaluemultipliercurvesareusedtomodelthelowersaturationsforsurfacesthatfacetowardsanilluminationsourceandlowercolorvaluesforsurfacesthatfaceawayfromanilluminationsource.Surfacesthatneitherfacetowardsnorawayfromtheillumina-tionsource(e.g.horizontalsurfacesinadigitalelevationmodel)willhaveminimalornochangetotheiroriginalcolorvalues.
Figure 12.SchematicoftheSVMmethod.
94 D�G�TALMAPP�NGTECHN�QUES‘06
thanthecutoff,thesaturationcomponent(S)willbemodulated,andthevaluecomponentwillequalthevalueintheoriginalcolorimage(i.e.,multiplierequalsone).Atthecutoffvalue,thevalueandsaturationmultipliersareequaltoone,sothecolorintheintegratedimagewillbethesameastheoriginalcolorimageatthecutoffvalue.
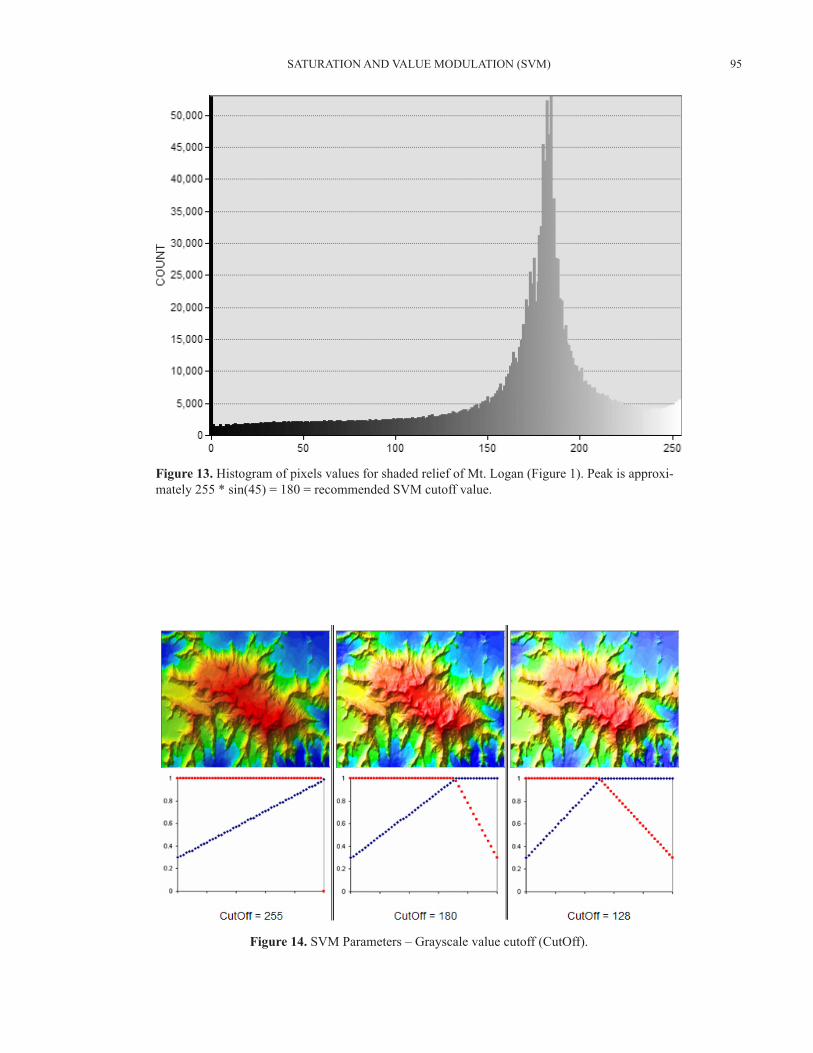
AgeneralSVMruleofthumbistomaximizethenumberofpixelsintheintegratedimagethathavethesamecolorastheoriginalcolorimage.Thismeansthatacutoffvaluethatmaximizesthenumberofpixelswithsaturationandvaluemultipliersof1shouldbeselected.�nmostcases,thiscutoffisrepresentedbythepeakinthegrayscaleimagehistogram.
Foratypicalshadedreliefdigitalelevationmodel,thepeakinthehistogramcoincideswithpixelsthatrepresenthorizontalsurfaces.Forshadedreliefimages,thecutoffcanthereforebecomputedfromthefollowingequation:
Cutoff=255*sin(A)
Thisassumesarangeofvaluesinthegrayscaleimageis255andAistheilluminationsourcealtitudeindegrees(0-90).Forexample,thepeakofhistogramofashadedreliefDEMwithanilluminationangleof45degreeswillbeapproximately180(Figure13).
Figure14showstheimpactofchangingthecutoffontheintegratedimage.Loweringthecutoffbelowtheoptimalvalueof180––thepeakinthegrayscalehisto-gram––resultsinanimagewithloweroverallsaturation(i.e.,washedoutcolors)thantheoriginalcolorimage.�ncreasingthecutoffvalueabovethecutoffresultsinanimagewithloweroverallvalue(i.e.,darker).
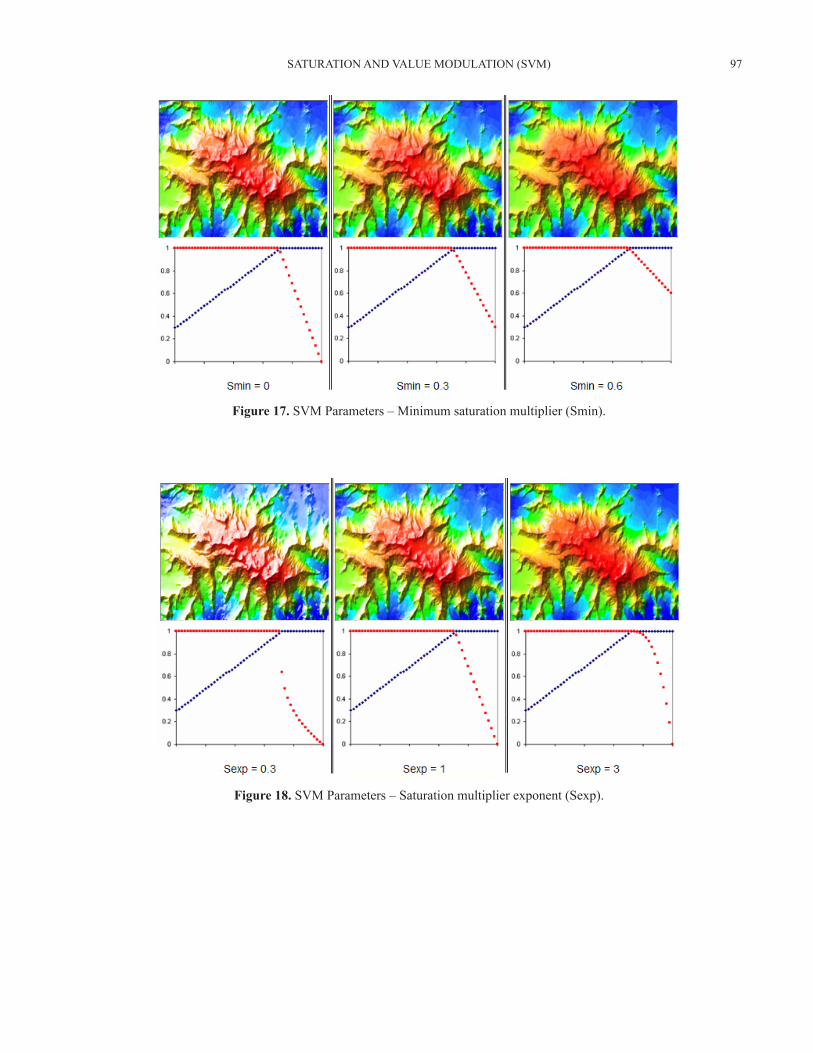
Minimum Value Multiplier (Vmin)
Theminimumvaluemultiplier,whichcanvarybetween0and1,determineshowdarkthepixelswillbeinareaswherethegrayscalepixelvaluesarelow.Forexample,ifVminis0,thenforgrayscalepixelvaluesof0thevaluecomponentofthecolorimagewillbemultipliedby0.Anycolorwithavaluecomponentof0isblack.Thismeansthatcolorpixelsthathavethesamelocationasgrayscalepixelvaluesof0willbeblackintheinte-gratedimage.AsVminincreases,thesesamepixelswillbecomebrighter.AVminvalueof1willresultinnovaluemodulation.�nthiscase,thepixelsintheintegratedimagethathavethesamelocationasgrayscalepixelswithval-ueslowerthanthecutoffwillbethesameastheoriginalcolorimage.
Figure15showstheimpactofchangingthevalueofVmin.NotehowtheshadowsbecomebrighterasVminincreases.Valuesgreaterthan0andlessthan0.4aregen-erallyrecommended.
Value Multiplier Exponent (Vexp)
ThevaluemultiplierexponentwillincreaseordecreasethenumberofpixelsthatwillhavetheirvaluecomponentmultipliedbyavalueclosetoVmin.HigherVexpvaluesmeanthatthemultiplierwillriseslowlyfromVmin.Figure16showshowincreasesinVexpincreasetheproportionof“darkpixels”intheintegratedimage.Valuesof1orlessgenerallyprovidegoodresults.
Minimum Saturation Multiplier (Smin)
Theminimumsaturationmultiplier,whichvariesbetween0and1,determineshowmuchcolortherewillbeforpixelswherethegrayscalevaluesarehigh.Forexample,ifSminis0,thenforgrayscalepixelvaluesof255(themaximumintheimage),thesaturationmultiplierwillbe0andthesaturationofthecolorintheintegratedimagewillbe0.�nthiscasethecolorintheintegratedimagewillhave“no”colorandwilltypicallybewhiteorlightgray.AsSminincreases,thesesamepixelswillhavehighersaturationandmorecolor.�fSminis1,thentherewillbenosaturationmodulationandthepixelsabovethecutoff will appear to be “flat”. Figure 17 shows the impact ofincreasingSminfrom0to0.6.Sminvaluesbetween0and.4arerecommended.
Saturation Multiplier Exponent (Sexp)
Thesaturationmultiplierexponentwillincreaseordecreasethenumberofpixelsthatwillhavetheirsatu-rationcomponentmultipliedbyavalueclosetoSmin.HigherSexpvaluesmeanthatmorepixelswillbemulti-pliedbyamultiplierclosetoSmin.Figure18showshowhighervaluesofSexpdecreasetheproportionof“washedoutpixels”intheintegratedimage.Generallyvaluesbetween1and3providegoodresults.
ARCGIS IMPLEMENTATION OF SVM
TheSVMmethodwasimplementedasaVisualBasicforApplications(VBA)applicationinESR�’sArcMapapplication.�tworkswithArcG�S(ArcView,ArcEditor,orArc�nfo)anddoesnotrequireanyspecialESR�exten-sions(e.g.,SpatialAnalyst).
TheVBAimplementationallowstheusertoseteachof the five SVM parameters described above. The input imagescanbeoneofthefollowing:
• 8- or 16-bit image with an associated CLR file• 8- bit TIF image (colors embedded in file)• 32-bit TIF image (color defined by RGB channels)• 3separate8-bitRGBimages
95SATURAT�ONANDVALUEMODULAT�ON(SVM)
Figure 13.HistogramofpixelsvaluesforshadedreliefofMt.Logan(Figure1).Peakisapproxi-mately255*sin(45)=180=recommendedSVMcutoffvalue.
Figure 14.SVMParameters–Grayscalevaluecutoff(CutOff).
96 D�G�TALMAPP�NGTECHN�QUES‘06
Figure 15.SVMParameters–Minimumvaluemultiplier(Vmin).
Figure 16.SVMParameters–Valuemultiplierexponent(Vexp).
97SATURAT�ONANDVALUEMODULAT�ON(SVM)
Figure 17.SVMParameters–Minimumsaturationmultiplier(Smin).
Figure 18.SVMParameters–Saturationmultiplierexponent(Sexp).
98 D�G�TALMAPP�NGTECHN�QUES‘06
The CLR file contains space delimited values for pixelvalueandRGBcomponents.Anexamplerecordfrom a CLR file might be:
1824464120
Thismeansthatpixelvaluesof18inthecolorimagehaveRGBcoordinatesof244,64,and120respectively.
TheoutputfromSVMisa3-bandRGBBand�nter-leavedbyLine(B�L)imagewhichiseasilyimportedoruseddirectlybyremotesensingsoftware.�tcanalsobeeasilyexportedtoT�ForESR�GridformatinArcG�S.
TheArcMapdocument(MXD)thatcontainstheVBAcodecanbedownloadedfromtheSVMFTPsitealongwithsampledata(Viljoen,2006).
APPLICATION OF SVM IN GEOSCIENCE
TheSVMmethodhasbroadapplicationtogeo-sciencestudiesthatrequireintegrationofacolorandgrayscaleimage.Manygeologicalmappingapplications,forexample,requireinterpretationofvarioustypesofremotelysensedandgeophysicaldata.TheintegrationofthesedatatypesoftenprovidesimagesthatofferauniqueperspectiveoftheEarth’ssurface,whichen-ablestheinterpretationofmanygeologicalfeaturesthat,withoutintegration,wouldhavebeenimpossibletomake.Furthermore,therelationshipsoftenevidentintheresultingintegratedimageryofferauniqueinterpretation
tool.ThefollowingthreeexampleshighlightthevalueofintegratingdifferentgeosciencedataanddemonstratetheadvantagesoftheSVMmethodovertraditionalintegra-tionmethods.
Integrating Geological Map Units with Shaded Relief Aeromagnetics
Themagneticcharacteristicsofrocksat,andbelow,the Earth’s surface often reflect mappable variations in lithologies.Themagneticcharacteristicsofrocksaremea-suredwithaeromagneticsensors,andthesemeasurementsareoftenprocessedintocolorfulimagesthatrepresenttotal field, vertical gradient, and other derivative products. �ntegrationofcoloredgeologicalunitswithshadedreliefversions of total field aeromagnetics can provide an image thatisextremelyusefulforgeologicalmapping.
GeologicalunitsareusuallyrepresentedbyvectorpolygonsinaG�Sand,giventhatSVMisentirelyaras-ter-basedmethod,thesevectorpolygonsmustberaster-izedandhavethesameprojection,pixelresolution,andmap extent as the total field shaded relief image. Detailed step-by-stepinstructionsonhowtousetheArcG�Sver-sionofSVMforthiskindofintegrationareavailablefordownload(Grantandothers,2006).
Figure19showstheresultofusingSVMtointe-graterasterizedgeologicalunitswithshadedrelieftotalfield aeromagnetics. As can be seen, rock units, after SVMintegration,arecharacterizedbydifferentmag-neticsignaturesontheintegratedimage.Thisimage
Figure 19.Comparingimageintegrationmethods–a.Rasterizedgeologicalmapunits.b.Shadedreliefaeromagneticimageforthesameareaasthegeologymap.c.�ntegratedimageusingthevaluereplacementimageintegrationmethod.d.�ntegratedimageusingtheSVMmethod.e.�nte-gratedimageusingRGBmodulationmethod.
99SATURAT�ONANDVALUEMODULAT�ON(SVM)
cangreatlyassistmappingendeavours,astherockunitscan be modified based on variations in their magnetic signature.Withrespecttotheintegrationmethods,notehowtheintegratedimageproducedbytheSVMmethodretainstheoriginalcolorsofthegeologymapcomparedtotheothertwotraditionalmethods.Thesmallsquareshighlightareaswherecolorcorruptionandlossareevidentintheintegratedimageproducedbytheothermethods.
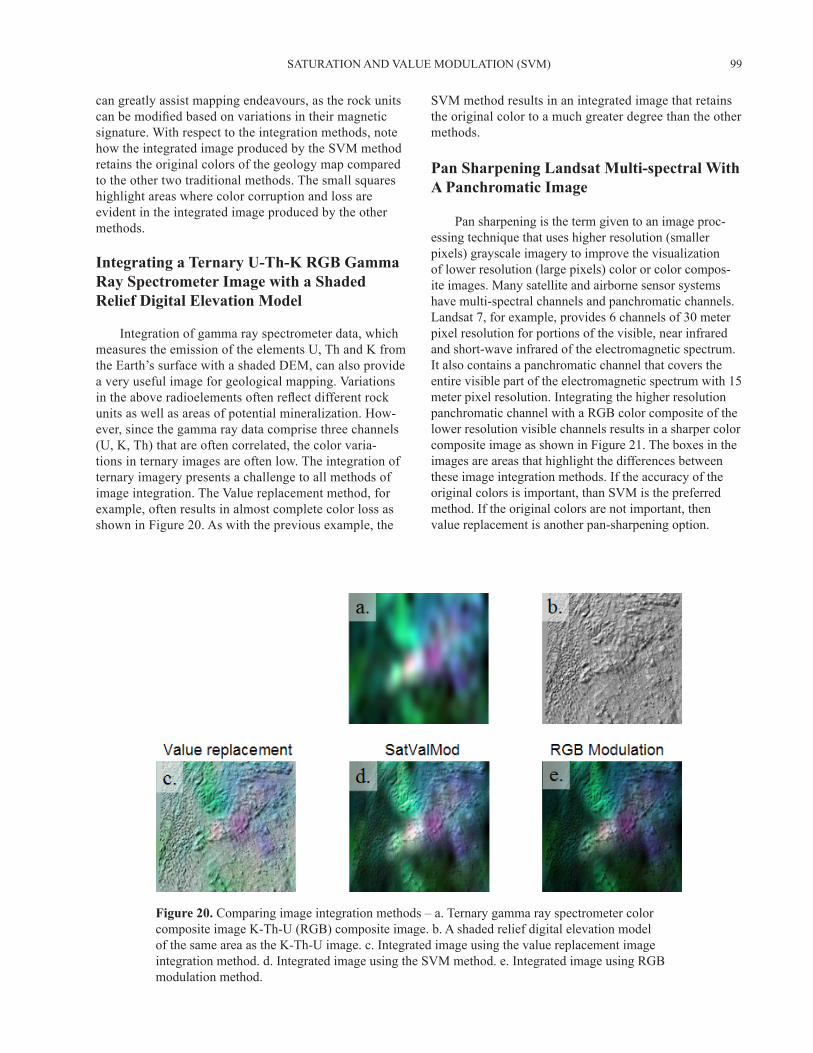
Integrating a Ternary U-Th-K RGB Gamma Ray Spectrometer Image with a Shaded Relief Digital Elevation Model
�ntegrationofgammarayspectrometerdata,whichmeasurestheemissionoftheelementsU,ThandKfromtheEarth’ssurfacewithashadedDEM,canalsoprovideaveryusefulimageforgeologicalmapping.Variationsin the above radioelements often reflect different rock unitsaswellasareasofpotentialmineralization.How-ever,sincethegammaraydatacomprisethreechannels(U,K,Th)thatareoftencorrelated,thecolorvaria-tionsinternaryimagesareoftenlow.Theintegrationofternaryimagerypresentsachallengetoallmethodsofimageintegration.TheValuereplacementmethod,forexample,oftenresultsinalmostcompletecolorlossasshowninFigure20.Aswiththepreviousexample,the
SVMmethodresultsinanintegratedimagethatretainstheoriginalcolortoamuchgreaterdegreethantheothermethods.
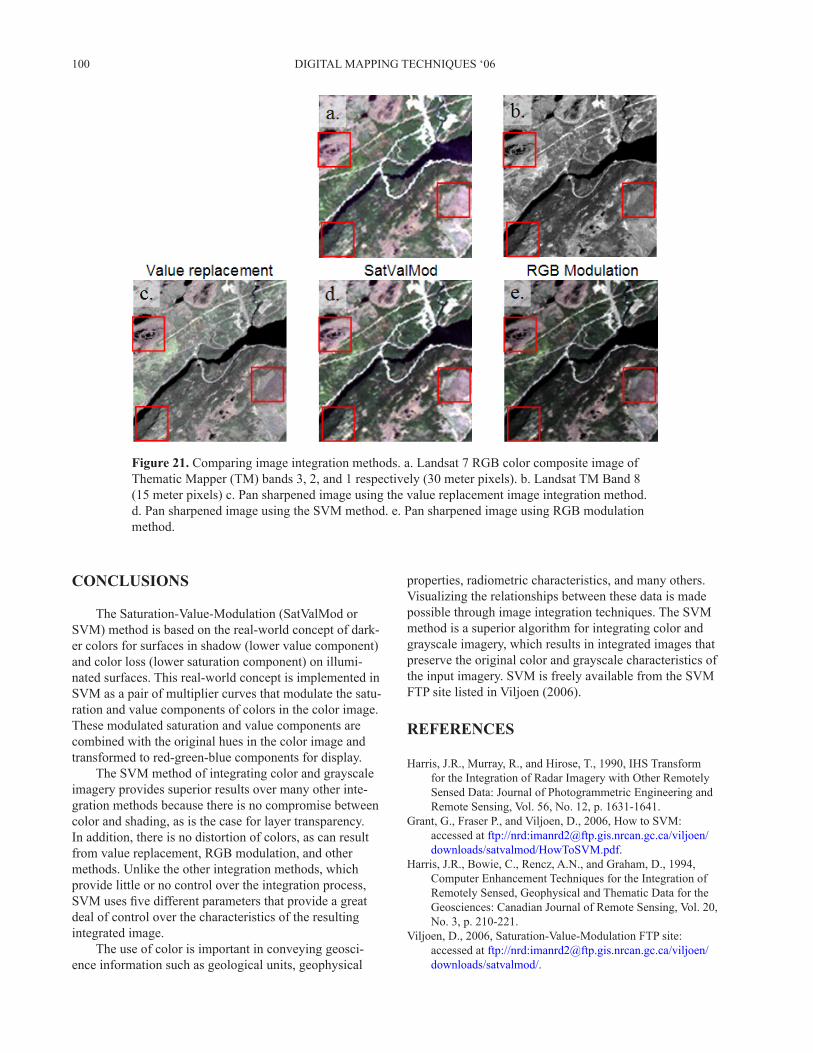
Pan Sharpening Landsat Multi-spectral With A Panchromatic Image
Pansharpeningisthetermgiventoanimageproc-essingtechniquethatuseshigherresolution(smallerpixels)grayscaleimagerytoimprovethevisualizationoflowerresolution(largepixels)colororcolorcompos-iteimages.Manysatelliteandairbornesensorsystemshavemulti-spectralchannelsandpanchromaticchannels.Landsat7,forexample,provides6channelsof30meterpixelresolutionforportionsofthevisible,nearinfraredandshort-waveinfraredoftheelectromagneticspectrum.�talsocontainsapanchromaticchannelthatcoverstheentirevisiblepartoftheelectromagneticspectrumwith15meterpixelresolution.�ntegratingthehigherresolutionpanchromaticchannelwithaRGBcolorcompositeofthelowerresolutionvisiblechannelsresultsinasharpercolorcompositeimageasshowninFigure21.Theboxesintheimagesareareasthathighlightthedifferencesbetweentheseimageintegrationmethods.�ftheaccuracyoftheoriginalcolorsisimportant,thanSVMisthepreferredmethod.�ftheoriginalcolorsarenotimportant,thenvaluereplacementisanotherpan-sharpeningoption.
Figure 20.Comparingimageintegrationmethods–a.TernarygammarayspectrometercolorcompositeimageK-Th-U(RGB)compositeimage.b.AshadedreliefdigitalelevationmodelofthesameareaastheK-Th-Uimage.c.�ntegratedimageusingthevaluereplacementimageintegrationmethod.d.�ntegratedimageusingtheSVMmethod.e.�ntegratedimageusingRGBmodulationmethod.
100 D�G�TALMAPP�NGTECHN�QUES‘06
CONCLUSIONS
TheSaturation-Value-Modulation(SatValModorSVM)methodisbasedonthereal-worldconceptofdark-ercolorsforsurfacesinshadow(lowervaluecomponent)andcolorloss(lowersaturationcomponent)onillumi-natedsurfaces.Thisreal-worldconceptisimplementedinSVMasapairofmultipliercurvesthatmodulatethesatu-rationandvaluecomponentsofcolorsinthecolorimage.Thesemodulatedsaturationandvaluecomponentsarecombinedwiththeoriginalhuesinthecolorimageandtransformedtored-green-bluecomponentsfordisplay.
TheSVMmethodofintegratingcolorandgrayscaleimageryprovidessuperiorresultsovermanyotherinte-grationmethodsbecausethereisnocompromisebetweencolorandshading,asisthecaseforlayertransparency.�naddition,thereisnodistortionofcolors,ascanresultfromvaluereplacement,RGBmodulation,andothermethods.Unliketheotherintegrationmethods,whichprovidelittleornocontrolovertheintegrationprocess,SVM uses five different parameters that provide a great dealofcontroloverthecharacteristicsoftheresultingintegratedimage.
Theuseofcolorisimportantinconveyinggeosci-enceinformationsuchasgeologicalunits,geophysical
properties,radiometriccharacteristics,andmanyothers.Visualizingtherelationshipsbetweenthesedataismadepossiblethroughimageintegrationtechniques.TheSVMmethodisasuperioralgorithmforintegratingcolorandgrayscaleimagery,whichresultsinintegratedimagesthatpreservetheoriginalcolorandgrayscalecharacteristicsoftheinputimagery.SVMisfreelyavailablefromtheSVMFTPsitelistedinViljoen(2006).
REFERENCES
Harris,J.R.,Murray,R.,andHirose,T.,1990,�HSTransformforthe�ntegrationofRadar�magerywithOtherRemotelySensedData:JournalofPhotogrammetricEngineeringandRemoteSensing,Vol.56,No.12,p.1631-1641.
Grant,G.,FraserP.,andViljoen,D.,2006,HowtoSVM:accessedatftp://nrd:[email protected]/viljoen/downloads/satvalmod/HowToSVM.pdf.
Harris,J.R.,Bowie,C.,Rencz,A.N.,andGraham,D.,1994,ComputerEnhancementTechniquesforthe�ntegrationofRemotelySensed,GeophysicalandThematicDatafortheGeosciences:CanadianJournalofRemoteSensing,Vol.20,No.3,p.210-221.
Viljoen,D.,2006,Saturation-Value-ModulationFTPsite:accessedatftp://nrd:[email protected]/viljoen/downloads/satvalmod/.
Figure 21.Comparingimageintegrationmethods.a.Landsat7RGBcolorcompositeimageofThematicMapper(TM)bands3,2,and1respectively(30meterpixels).b.LandsatTMBand8(15meterpixels)c.Pansharpenedimageusingthevaluereplacementimageintegrationmethod.d.PansharpenedimageusingtheSVMmethod.e.PansharpenedimageusingRGBmodulationmethod.


