
SASA POLYESTER SAN. A.Ş. 2012 ANNUAL REPORT- 1
SASA POLYESTER SANAYİ A.Ş.
BOARD ACTIVITY REPORT
01.01.201231.12.2012

SASA POLYESTER SAN. A.Ş. 2012 ANNUAL REPORT- 3
T O W A R D S T O H A L F C E N T U R Y…

6. General Informations
10. Board of Directors
14. Milestones
16. The message of the chairman
18. About SASA
32. Financials
41. General Assembly
42. Declaration of compliance with corporate management principles
46. Auditor's Reports
CONTENTS

SASA POLYESTER SAN. A.Ş. 2012 ANNUAL REPORT- 7
Company’s Tittle: SASA Polyester Sanayi A.Ş.
Trade Register Number: 5722
Address: Yolgeçen Mah. Turhan Cemal Beriker Bulvarı No:559 P.K. 01355 Seyhan / Adana / TURKEY
Tel: +90 (322) 441 00 53 – PBX
Fax: +90 (322) 441 01 14
E-mail: [email protected]
Web: www.sasa.com.tr
Members of Board
Mehmet Göçmen Chairman of the Executive Board (non-executive member)
Serra Sabancı Vice Chairman of the Executive Board (non-executive member)
Mehmet Nurettin Pekarun Member of Board (non-executive member)
Mahmut Volkan Kara Member of Board (non-executive member)
Hüsnü Ertuğrul Ergöz Member of Board (independent member)
Mehmet Kahya Member of Board (independent member)
Corporate Management Committee
Mehmet Kâhya President
Mahmut Volkan Kara Member
Audit Committee
Hüsnü Ertuğrul Ergöz President
Mehmet Kâhya Member
Suervisiory Board
Volkan Balatlıoğlu
Şerafettin Karakış
İlker Yıldırım
GENERAL INFORMATIONGeneral Informations Board of Directors Milestones The Message Of The Chairman About SASA Financials General Assembly

SASA POLYESTER SAN. A.Ş. 2012 ANNUAL REPORT- 9
OVERVIEW OF THE PARTNERSHIP
Our Company’s main production lines, and Sectors that use these products are as follows:
Fibre
SASA Fibre Segment serves 3 different sectors with its products :
Textiles: Polyester staple fibre and tops products are spun into 100% polyester and/or blended (cotton, viscose, acrylic, wool, nylon) yarns ,and then con-verted to fabric by weaving or knitting.
Technical Textiles: With a range of various fibre bind-ing methods (mechanical, spunlace and chemical), these fibres are used as the raw material for hygienic (wet wipes, diapers) and automotive (ceilings and floor coverings) end-uses, artificial leather underlays, filters, cleaning cloths, accessories, geotextile cover-ings (stabilizers for asphalt) ,etc.
Comfort and Filling Fibres: Fibres, after they are card-ed and converted into fibre balls, are used as filling material for the manufacturing of pillows, toy fillings, duvets, jackets, furniture and shoulder pads.
SASA , operating in the industry of polyester fibres, filaments and polymers constitutes a major share in Turkey’s production capacity in this field with its polymerization capacity of 350,000 kilotonnes / year. Our Company provides tailored solutions for all sectors in the polyester market with especially the Research and Development activities for specialty polymers and chemicals business , and by monitoring market trends closely.
Filament
SASA Filament Segment produces POY and textured yarns for the textile (knitted and woven fabrics), carpet and automotive end-uses.
SASA is the leading producer of polyester fibres in Turkey, Europe and the Middle East.
Specialty Polymers and Chemicals
SASA Specialty Polymers and Chemicals Seg-ment operates with the vision of dedicating development to eco-friendly products ,and supplying them to customers. The segment serves the following sectors:
Textile Industry: Standard and high viscosity polyethyleneterephthalate and polybutyl-ene terephthalate polymer products are first converted into filaments and fibres, and then to woven or knitted fabricsnd non-woven products.
Manufacturing industries: High viscosity poly-ethylene terephthalate and polybutylene terephthalate polymer products are used in industrial applications in which high durabil-ity is essential.
Film and Packaging Industry: Specialty poly-ethylene terephthalate polymer products are used in the manufacturing of film and packaging materials that are food contact or not. Antimony free film grade polyester polymers – an important property for food contact materials- are also included in the product portfolio. PBAT production for the biodegradable packaging industry started in 2012.
Engineering Polymers: Polybutylene tere-phthalate and thermoplastic elastomers are used in the production of automotive parts, electricalelectronic components, durable goods and other plastic parts with the plastic injection method.
Plasticizers: SASA Plus 88, a phthalate-free product, is used as a plasticizer in PVC pro-duction. As chemicals that include phthalate are known hazardous to human health ,and are classified as hazardous materials, the sig-nificance of SASA Plus 88 is increasing gradu-ally in the industry
SASA sells its Specialty Polymers and Chemi-cals mainly to Europe but also delivers to Tur-key, the Middle East, North America and Asia.
General Informations Board of Directors Milestones The Message Of The Chairman About SASA Financials General Assembly

SASA POLYESTER SAN. A.Ş. 2012 ANNUAL REPORT- 11
MEMBERS OF BOARD
Mehmet GÖÇMENChairman of the Board
Tenure: 25.04.2012 – 25.04.2015
Mehmet Göçmen was born in 1957. Mr. Göçmen earned a degree in Industrial Engineering and Operations Re-search from Syracuse University (USA) following his edu-cation at Galatasaray High School and the Middle Eastern Technical University. Mr. Göçmen started his career in 1983 at Çelik Halat, going on to serve as General Manager of Lafarge Ekmel Concrete and then, from 1996-2002, as Vice President of Lafarge Turkey in charge of Business Development, Strategy and Marketing. Mr. Göçmen was appointed as Executive Vice President of Sabanci Hold-ing's Human Resources after serving as General Manager of Akçansa from 2003 to 2008. On 20 July 2009 he was made President of the Cement SBU at Haci Omer Sabanci Holding AS, until 2010 holding these two offices simulta-neously. Mehmet Göçmen left his position as Executive Vice President of Sabancı Human Resources in 2010 while remaing President of the Cement Strategic Business Unit.
Serra SABANCIDeputy Chairwoman of the Board
Tenure: 25.04.2012 – 25.04.2015
Serra Sabancı was born in Adana in 1975. She complet-ed her university studies at Portsmouth University and at the Economics Department of Istanbul's Bilgi University, where she was the valedictorian of her class. Serra start-ed her career at Temsa, following which she attended training courses at London's Institute of Directors study-ing Mergers, Acquisitions and Board Membership. Serra Sabancı, a trustee on the board of the Sabancı Founda-tion, currently sits on the board of Sabancı Holding and several of its subsidiaries.
Mahmut Volkan KARAMember of the Board
Tenure: 25.04.2012 – 25.04.2015
Born in Istanbul in 1973, Mahmut Volkan Kara graduated from Robert College and Istanbul Technical University Machine Engineering department. Kara completed his post graduate studies, obtaining an MBA degree from the North Carolina University Kenan-Flagler Business School in USA. He worked at Dell Computers in Austin, Texas, A.T. Kearney in Chicago Illinois and SAB Miller in Milwaukee Wisconsin respectively in the USA. Kara currently works as Corporate Strategy and Planning Director in Sabancı Holding Strategy and Business Development Group Pre-sidency.
Mehmet Nurettin PEKARUNMember of the Board
Tenure: 25.04.2012 – 25.04.2015
Mehmet Nurettin Pekarun has degree in Industrial Engi-neering from Bosporus University and an MBA in Finance and Strategy. In 1993 Mr Pekarun started his career at General Electric (GE) in the USA, was the Finance Manager of GE Healthcare Responsible for Europe, Turkey, Greece and Eastern Europe from 1996 – 1999, General Manager for Turkey at GE Lighting, and then the Business Develop-ment Unit's General Manager at EMEA GE Healthcare be-fore taking becoming Medical Accessories General Man-ager at EMEA GE Healthcare. He was appointed CEO of Kordsa Global in 2006 and President of the Tyre, Support Materials and Automotive Group at Sabancı Holding on 20 September 2010. Following a restructuring, Mehmet Pekarun is now President of the Industrials Group.
Mehmet KAHYAIndependent Member
Tenure: 25.04.2012 – 25.04.2015
Mehmet Kahya received his BS degrees, Cum Laude, in both Chemical Engineering and Economics frpm Yale University in 1973 and his MBA, with honors, majoring in Finance, Marketing and Operations Research from Kellogg Graduate Scool of Man-agement in 1975.
He started his career as Management Services Manager at Sasa of the Sabancı Group (1975-80) and later was Founder and Man-aging Director of MKM International (Holland, 1980-84) and of Sibernetik Sistemler (1984-86). Mehmet rejoined Sabancı Group in 1986 as Automotive Group Vice President and was President of Temsa (1986-90) and Vice President of Toyotasa (1990-94) while serving as Member of the Management and Planning Council of Sabancı Holding and as Member of the Boards of Temsa, Toyotasa, Susa and Sapeksa.
Mehmet was Managing Director and Vice-Chairman of the Board of CarnaudMetalbox-Turkey (1994-98), President of Uzel Makina and Member of the Executive Committee of Uzel Hold-ing (1998-01), General Manager of DYO and Group Vice Presi-dent (2001-02), Member of the Executive Committee of Sarten Ambalaj (2002-03), Vice Chairman of the Board of Gierlings Vel-por (Portugal, 2002-05), President of Assan Aluminyum (2004-06) and currently is the Founder and Managing Partner of Kronus, working with private equity funds for turn-around investments.
Dr. Hüsnü Ertuğrul ERGÖZIndependent Member
Tenure: 25.04.2012 – 25.04.2015
Hüsnü Ertuğrul Ergöz received his Chemistry bachelors degree at Robert College in 1963, masters degree at METU in 1964 and PhD at Florida State University in 1970. Ergöz served in academic life between years 1972 and 1976 in METU.
Ergöz started his professional life in Kordsa as Technical Etude and Project Specialist, afterwards he received va-rious duties in Sabancı Holding and group companies such as Brisa. Retired from Sabancı Holding position of General Secretary in 2003. After retirement he served as executive board member is at Pressan Ltd till 2009. Ergöz is making private studies on 'Institutionalization in Family Enterprises'
General Informations Board of Directors Milestones The Message Of The Chairman About SASA Financials General Assembly

SASA POLYESTER SAN. A.Ş. 2012 ANNUAL REPORT- 13
The members of the Board
The members of the Board of Directors who served during the reporting periodCezmi Kurtuluş: was a board member from 23.9.2011 to 07.03.2012
Neriman Ülsever: was a board member from 23.9.2011 to 25.04.2012
Gökhan Eyigün: was a board member from 23.9.2011 to 25.04.2012
Supervisory Board Tenure
Volkan Balatlıoğlu 25.04.2012 – 25.04.2015
Şerafettin Karakış 25.04.2012 – 25.04.2015
İlker Yıldırım 25.04.2012 – 25.04.2015
Members of the Board of Directors and the Supervisory Board possess the authorities defined and designated in the Turkish Commercial Code, the Articles of Association and as specified in other relevant laws and regulations.
Audit Committee
President : Hüsnü Ertuğrul Ergöz
Member : Mehmet Kâhya
The members of the Audit Committee who served during the reporting period
Cezmi Kurtuluş : was a Audit Committee member from 04.10.2011 to 07.03.2012
Neriman Ülsever : was a Audit Committee member from 07.03.2012 to 25.04.2012
Corporate Management Committee
President : Mehmet Kâhya
Member : Mahmut Volkan Kara
Since there is no committee for nomination, early risk determination and compensation committee in the present configura-tion of the Executive Board, works of the mentioned committees are executed by the Corporate Management Committee.
Top ManagementName Title
Toker Özcan General Manager
İbrahim Celal Çelebi Operations Director
Mustafa Özturan Human Resources and Corporate Development Director
Zarif Yağız Supply Chain Director
Ahmet Necip Özen Site Engineering Manager
Alper Söğüt Specialty Polymer and Chemicals Operations Manager
Ferat Göç Cost Accounting Manager
Güven Kaya Continuous Improvement and Technology Manager
Hamit Günaşan Planning and Materials Management Manager
İrfan Başkır Specialty Polymers and Chemicals Sales Manager
Mehmet Pehlivan General Accounting Manager
Murat Fikret Erdoğan Fibers Polymer Operaitons Manager
Mustafa Durukan Raw Material Purchasing Manager
Mustafa Kemal Öz Fiber Operations Manager
General Informations Board of Directors Milestones The Message Of The Chairman About SASA Financials General Assembly

SASA MILESTONES
1966Establishment of the Legal Entity and Launch of the Assembly Work
1968Production using ICI’s Batch Technology (6 kilotonnes / year Polyester fiber)
1974Batch Filament Production
1976First DuPont CP-1 (14 kilotonnes / year fiber)
1977 DMT Production (60 kilotonnes/year)
1991DMT Capacity Increase (120 kilotonnes/year)
1998DMT Capacity Increase (280 kilotonnes/year)
2000Title change - The Beginning of SASA DuPontSA
2004 Title change – The beginning of Advansa SASA Polyester Sanayi A. Ş.
2006 The Sale of PET Resin Facilities to LA SEDA (Artenius)
2011 •PTA Based CP 7
Fiber Facility
•Title change – The Beginning of SASA
•Batch Polymer – 4 Facility
SASA POLYESTER SAN. A.Ş. 2012 ANNUAL REPORT- 15
General Informations Board of Directors Milestones The Message Of The Chairman About SASA Financials General Assembly

SASA POLYESTER SAN. A.Ş. 2012 ANNUAL REPORT- 17
MESSAGE FROM THE CHAIRMAN
2012 was a year which global capital market witnessed big fluctuations. Debt crisis of Europe, increasing raw material prices and decelerating re-quest constituted the most important agenda topics of polyester industry. Nonetheless, Sasa continued its in-vestments to reinforce its leadership position in the polyester industry as it had planned.
Petroleum-derived main raw material prices of Sasa followed a fluctuating course in 2012; and in second half of year, entered uptrend in conse-quence of particularly strong supply and demand constraints in the Far East. In the first half of 2013 it is pro-posed that raw material prices keep increasing; as for second half of the year it is expected that a more bal-anced structure is going to be formed in raw material market when especial-ly new plants in Asia become a part of an activity.
From the second half of 2012 when rivalry increased in all dimensions and took effect, activity ratio has been tried to be used at maximum produc-tivity in order not to be affected nega-tively by marketshare developments.
Capacity increase parallel to the mar-ket was completed with the invest-ments made at the beginning of 2012 and the sources were led to particu-larly profitability-based projects.
In addition to present Europe and Tur-key markets, customer enhancement works were achieved with present products within the scope of these works. Sasa has been reached the position of a trusted and consulted company in the market upon raising product and brand recognition in es-pecially business line of SPC in Euro-pean market.
Our group endorsement increased 13 % for Fibre and 10 % for SPC in 2012 as compared to the previous year.
Innovative works of Sasa within the scope of product portfolio optimiza-tion works are being maintained with similar intensity and efficiency of past years. New research-development has been initiated as a part of our product range development strategy which is going to comply with new tendencies developing within sus-tainable business model.
Sasa which pursues environment and human effect as its most important value at every work it does enhanced its treatment of wastewater in parallel to increasing productions.
Sasa which internalizes 6 sigma meth-odology as its business transacting way within business perfection works obtained total 1,75 Million TL yield with 9 projects in 2012.
Sasa becoming an organization which forms a center of attraction for qualified manpower with high work engagement and change support ca-pability/courage by its character es-teeming human has determined cre-ating an organizational climate which raises its employees’ performances and supports their development as its primary objective.
I hereby present thanks to especially our founders, all our previous and present employees, suppliers and customers who have contributed ef-forts on Sasa’s becoming one of the biggest and most successful indus-trial enterprise of Turkey on behalf of our Executive Board.
Our group endorsement
increased 13 % for Fibre and 10 % for SPC in 2012 as
compared to the previous year.
Mehmet GöçmenChairman of the Board
General Informations Board of Directors Milestones The Message Of The Chairman About SASA Financials General Assembly

SASA POLYESTER SAN. A.Ş. 2012 ANNUAL REPORT- 19
EMPLOYEE INFORMATION
Our number of employees, as of 31st December 2012, had dec-reased to 1.200 which shows an reduction of 31 persons when compared with 2011. In 2012, 138 new persons were employed and 169 persons’ employment contracts were ceased. The distri-bution of our personnel, based on the numbers at the main site and the other exterior sites are as follows :
Main Site 1.072 People
Industrial Zone Textile Plant 115 People
İskenderun Tank Area and Loading 10 People
İstanbul Office 3 People
TOTAL 1.200 People
Collective Labor Agreement Process
Validity of 17th Period Collective Labor Agreement which was contracted between our Company and Petroleum-Work Union and included establishments operating in chemistry business line terminated as of 31.12.2012 and negotiations of 18th Period Collective Labor Agreement began between our Company and Petroleum-Work Union representing our union member per-sonnel on 04 February 2013.
Negotiations of Collective Labor Agreement which shall be done at management level at establishments operating in busi-ness line of texture with Textile Labor Union shall begin at 14.00 on 04th March 2013.
General Informations Board of Directors Milestones The Message Of The Chairman About SASA Financials General Assembly

SASA POLYESTER SAN. A.Ş. 2012 ANNUAL REPORT- 21
VISION & MISSION & VALUES
To invest in manpower and production for a profitable and sustainable growth.
VISION
MISSION
To position the company in current business and new opportunities so as to create the highest value.
Our values•To be a “role model” in environmental, health and safety issues
•To be innovative
•To be client-oriented
•To be competitive
•To be responsible and respected
•To be result-oriented
•To be knowledge intensive
•To be dynamic
•To be reliable
•To get power from market conditions
•To get strength from market conditions Our priority is the safety and health of our personnel, the environment (the region where our facilities are located and the surroundings), our customers and neighbors. Being a respected corporate citizen is of paramount importance to us.
General Informations Board of Directors Milestones The Message Of The Chairman About SASA Financials General Assembly

SASA POLYESTER SAN. A.Ş. 2012 ANNUAL REPORT- 23
In accordance with the vision and strategies of our changing and developing company, as Hu-man Resources, our main goal is to make SASA to reach effective an organizational structure re-quired for a sustainable competitive advantage, consist of employees with high caliber, loyal to the organization and directed towards aims of the company with proud of working in SASA, providing continuous working peace.
SASA, for realizing its strategies and goals; be-lieves that long term togetherness with its open-minded and continuously developing employees, company culture, knowledge ac-cumulation and protecting core values of the Company are the basic elements for reaching success and makes investments in people in this respect.
With a view towards providing sustainable suc-cess in its strategy and goals and having an organization that creates a competitive advan-tage, SASA strives:
• Organization has been structuring in accord-ance with continuously review the human resources systems and processes and the re-quirements,
• Qualified labor force that will carry the com-pany into the future has been employing and in this respect the cultural diversity is being supported,
• To improve the competencies, knowledge and abilities of employees related with their
positions, for realizing their potentials, person-al and occupational development activities has been organizing,
• To support institutional and personal devel-opment; an effective performance manage-ment has run where employees and directors can monitor their performances regularly and assume their own development responsibili-ties in an open communication environment.
• Within the scope of “Organizational Succes-sion Planning”, critical positions are backed up with high potential and competent employ-ees.
• Necessary platforms for information shar-ing on relevant subjects regarding company issues and employees are created for em-ployees and their representatives to explain themselves clearly within a participative man-agement approach.
• Sabancı Work Ethics, including rules ensur-ing fair and equitable (no discrimination on gender, religion, language, etc.) work environ-ment, are applied to all employees.
• In a working environment where secure, healthy, Sabancı Bussiness Ethics Values kept alive, participatory and open-minded and employees can showcase their potentials, for envolving approaches and applications that improve institutional commitment, a com-mon company culture has created.
Our development and improvement of our employees is our most important task.
HUMAN RESOURCES POLICIESGeneral Informations Board of Directors Milestones The Message Of The Chairman About SASA Financials General Assembly

SASA POLYESTER SAN. A.Ş. 2012 ANNUAL REPORT- 25
RECRUITMENT
In our company, the Sabancı Holding Job Family Mo-del and a grade structure that defines job size and wage structure are implemented for white collar emp-loyees. The recruitment process is executed in line with the role descriptions and responsibility areas defined within the frame of the Job Family Model, according to Recruitment and Dismissal Regulation.
We execute our recruitment processes in line with our company’s strategies, goals and principles of equal op-portunity for equal jobs, with the purpose of securing the best candidates who are qualified for an open po-sition and believe in the values of Sabancı Holding and our company; are open to development and change; are highly self-confident, well educated; and have the competencies to make a difference in their work.
PERFORMANCE EVALUATION MANAGEMENT
All white collar employees evaluate their work and competency goals which are updated with a mid-term evaluation during the year, interviewing face to face with their superiors that they had set together at the beginning of year with all performance criteria clearly defined .[The previous is confusing. Could it read: “All white collar employees meet with their superiors at the beginning of the year to set competency goals. These personnel then evaluate their work and compe-tency goals through a mid-year evaluation.”
The evaluation results based on the realization level
(efficiency) of work and competency objectives are considered an important criterion in defining personal development / training areas, promoti-onal opportunities, career back-up, raises and ad-justment of wages.
TRAINING and PERSONAL DEVELOPMENT PROGRAMS
As SASA Human Resources, creating organizatio-nal climate to ensure participation in projects and activities increasing individual awareness and per-formances, supporting creative developing of our employees, is among our priorities.
Orientation Program
Department visiting program that aims to make new-starter white collar employees learn all de-partments and meet with all employees
In-House Training Program
Job Safety, Health and Environment, Technical, ISO, Sabancı Code of Business Ethics, etc.
Personal Development Training Programs
Programs that are organized according to the per-sonal development areas of white collar employe-es and the jobs they perform
Occupational Development Trainings
Outsourced trainings that are organized as certifi-cation, seminar, course formats in line with impro-ving the knowledge and abilities of employees and providing occupational development
SASA Human Resources has planned SASA Deve-lopment Guide in 3 main headings for implemen-
tation in 2012, and completed all training sessions with effective participation.
Personal Development Program: Targeting all whi-te-collar employees, trainings under 11 different headings are completed that aims developing dif-ferent competencies.)
We Are Managing Programı: Aiming at develop-ment of leadership skills of Mid-level executives (managers, leaders and chiefs); “we are managing” program is organized in two parts, second part will continue in 2013.
We Are a Family Program: Aiming building aware-ness of communication within the family, Prof. Dr. Üstün Dökmen’s “High quality communication wit-hin the family” Seminars are completed at 6 session in 2012 with participation of nearly 1500 employe-es and one of their first degree relatives or spouses.
SOCIAL ACTIVITIES
SASAAKTİF is a committee which was established by voluntary participation of our employees for planning and implementing various social activiti-es inside and outside the company.
Activities;
Sports organizations ( SASA Sports Tournament including football, volleyball and badminton branches, table tennis/bowling and paint ball to-urnaments)
Happy hour and karaoke parties, spring fests,
SASA Kids Drawing Competition
Natural and cultural trips and similar organizations.
WE ARE TOGETHER, AT WORKAND BEYOND...
HUMAN RESOURCES POLICIESGeneral Informations Board of Directors Milestones The Message Of The Chairman About SASA Financials General Assembly

SASA POLYESTER SAN. A.Ş. 2012 ANNUAL REPORT- 27
REMUNERATION and FRINGE BENEFITS RESEARCH AND DEVELOPMENT ACTIVITIES
The remuneration system of labor union member emp-loyees is managed with collective agreements that are signed between labor unions and the employer with a management approach supporting unionism.
The remuneration system of white collar employees is created by considering the results of job valuation and market data.
Remuneration
Within the framework of the Sabancı Group Job Family Model, in tier system that determines work size and remuneration structres, 16 gross salaries, namely 12 monthly gross salaries and 4 gross salaries as bonus.
In addition, in alignment with the financial performan-ce of the Company, variable payment is done over a ratio determined according to individual performance (efficiency) to employees at certain grades.
Fringe Benefits
Private health insurance, individual retirement practice with contribution of employer and life insurance for white collar employees who work in positions in a spe-cific level and meal for all employees.
Payment amount which was made to the Members of Board and senior managers between 01.01.2012 and 31.12.2012 was 3.444.000 TL.
SASA‘s R&D activities were conducted primarily with innovative approach to de-velopments with company’s core compe-tencies where the strengths of the com-pany prevail.
Evaluating market and customer needs with precision, SASA has effectively put to use its state of the art technology com-bined with its extensive knowledge to create new business opportunities and sustaining them.
In year 2012, total R&D expenditures have amounted to 3,1 Million TL corresponding to 0,31 % of revenue.
In fully equipped R&D assets, the com-pany continues to develop products and processes for the fibers and polymers/chemicals businesses through team-work with its customers, thus enhancing SASA’s competitive advantage.
Project activities have been conducted according to main company strategies that can be summarized as below;
•Growing in polyester based polymers business ,and offering new specialties and polymer solutions to the market,
•Growing in fibers business and optimiz-ing product portfolio,
•Collaborating with different organiza-tions to develop new business oppor-tunities, and growing raw material –ori-ented.
As most of the internal resources aligned around short term projects for support-ing core business activities, resources have also been utilized for long term R&D projects to develop “human and environ-mentally friendly” products to respond to the growing global awareness corrobo-rated by new international and domestic directives.
In year 2012, total R&D expenditures have amounted to 3,1 Million TL corresponding to 0,31 % of revenue.
General Informations Board of Directors Milestones The Message Of The Chairman About SASA Financials General Assembly

SASA POLYESTER SAN. A.Ş. 2012 ANNUAL REPORT- 29
Specialty Polymers and Chemicals
Bio Degradable Polyester: SASA defines develop-ing and offering new products to distinctive and new markets as its continuous strategy. Thus, SASA has created an application opportunity for its products in packaging industry. The unique Bio-degradable polyester for packing industry has developed successfully and it is planned to commercialize in our customers.
Thermo Plastic Elastomers: SASA has started to produce thermoplastic elastomers in 2010. Thermo plastic elastomers generally have two parts one is flexible and the other part is tough. In 2012, 3 new types of thermo plastic elasto-mers were developed for film industry.
Dull Film: The growing global awareness for human health and environment has made the development of “eco- friendly” technologies ob-ligatory rather than needed. Within the scope of this rising expectation, SASA has developed a special polyester polymer for film industry to replace PVC film. R&D activities for this product were completed and the product is now com-mercial.
PET with High Stretch Properties: Modified PET with properties of more than 70% stretching capability for packing industry was developed. This product may replace PVC that is being used in film industry.
Fibers
R&D activities for polyester and high performance fibers embody both the use of the broad knowl-edge of polymer modification chemistry - one the core strengths of SASA- and the addition of new functions and values, thus enriching fibers product portfolio. Below are some of the projects concluded and commercialized in 2012 due to market demands:
UV Resistance Fiber: In the outdoor area, polyester fiber may lose its strength due to UV radiation coming from sun. New types of polyester fiber has developed that can be used in outdoor areas and can stand UV radiation.
Food Contact Fiber: Food contact type polyester fiber was developed and commercialized. This type of fibers may contact to food and the result-ing food is not harm full for humans.
Black and Semi dull Flame Retardant (FR) Fiber: Regarding fire safety, flame retardant fibers are preferred in cinemas and theaters. Flame retardant black and semi dull (ecru) fib-ers were developed and commercialized.
Colored TOPS: In order to use in wool fabrics, col-lared fiber were developed in different colors with high fastness value.
Cationic dyeable TOPS: In order to use in wool fabrics, collared fiber were developed in different colors with high fastness value.
Anti-Bacterial Flame Retardant (FR) Fiber: Anti-Bac-terial and flame retardant fiber production R&D works were completed. It is planned to commer-cialize in 2013
SASA has been awarded with an Honorable Men-tion in Synergy category in SABANCI Golden Col-lar Awards 2012 with KORDSA in: “PET Cord fabric production for automotive industry”.
Going forward, all R&D activities will be focused around the technological capabilities where we can maximize our technological innovation to create added value in new and emerging mar-kets.
SASA has been awarded with an Honorable Mention in Synergy category in SABANCI Golden Collar Awards 2012 with KORDSA in: “PET Cord fabric production for automotive industry
General Informations Board of Directors Milestones The Message Of The Chairman About SASA Financials General Assembly

SASA POLYESTER SAN. A.Ş. 2012 ANNUAL REPORT- 31
COMPANY ACTIVITIES AND IMPORTANT DEVELOPMENTS
INVESTMENTS
In 2012, approximately 5,6 Million TL has been spent for new project.
CAPACITY INCREASE OF WASTE WATER TREATMENT PLANT
Treatment capacity of waste water treatment plant has been increased to 5500 m³/day by new additions to the existing aerobic system. Construction of additional facilities in a 5600 m² area started in 2011; assembly and start-up processes were completed and com-missioned at the end of the year 2012.
The additional facility with a installed power of 410 kW has been integrated with the existing treatment plant. The current waste water treatment plant; including anaerobic and aerobic treat-ment units with a biogas-operated steam boiler; has been operating with 1 environmental engineer, 1 first line manager and 14 operators in 3 shifts. Plant produces treated effluent that
consistently surpasses regulatory stand-ards, which monitored daily by the in-ternal laboratory and twice a month by the accredited independent laboratory. Related projects are planned and been working on for the reuse of treated waste water in the coming period.
SAFETY, OCCUPATIONAL HEALTH & ENVIRONMENTAL (SHE) ACTIVITIES 2012
SHE Department activities carried out under the consideration of a belief that the health and safety of everybody in-volved in its operations and the protec-tion of the natural environment are very important and integral to the success of the business. Activities of year 2012 summarized as below.
TRAININGS & AWARENESS ACTIVITIES
As we believe that SHE training is an es-sential element of safe and environmen-tally friendly workplaces and manage-ment must teach, motivate and sustain employee SHE knowledge to eliminate injuries and environmental incidents, we continued SHE trainings in 2012. SHE Induction training obliged for begin-ners from all levels at the first working week before starting to work continued. Besides SHE training continued to be given every day for outsourced contrac-tors working for investment projects and daily contractor auditing performed in order to prevent accidents especially during the investment period. Hazard-ous Operations and PPE Usage, Safety Auditing, Incident Investigation and Reporting, Work Control Permit Certifi-cation, Ergonomics, Manuel Handling, Hearing Protection, Hot Work Inspector trainings, Fire & Fire Fighting, Hazardous Chemicals & Hazard Communication, Respiratory Protection, Risk Assessment, Water & Waste Management, Working with Display Devices, Process Safety and Risk Management trainings were conducted by in-house resources. Work-place safety and occupational health promotions and leaflets prepared for employee awareness twice monthly. Emergency preparedness is vital for
chemical industry and 41 fire and rescue drills held by operations and site fire de-partment co-operation.
INCIDENT & INJURY INVESTIGATIONS
Incidents & injuries are the opportuni-ties for improving the weaknesses in our SHE system. Therefore, they are being investigated effectively. We didn’t expe-rience any significant fires, process in-cidents or environmental incidents; but 12 injuries, 2 of them LWC (Lost Workday Case), were occurred in 2012 and by in-vestigating the root causes, actions were taken and lessons learned from these injuries communicated with all employ-ees for preventing the re-occurrence by working with the line managements
By reporting and sharing the off the job injuries of the Sasa employees which results with lost work days, the number of such cases decreased from 41 in year 2005 to 7 in year 2012.
By extensive reporting of process in-cidents, high potential incidents and learning events, all Sasa employees pointed out that it is essential to inves-tigate all unsafe practices and incidents with potential for injury as well as all in-juries.
SHE AUDITING
All Adana site operations audited in compliance with site SHE Audit Plan which was prepared by SHE department same as in previous years. According to this plan, departments were audited twice monthly by two different groups. Besides this general SHE audits, plants were also audited by committees ac-cording to different procedures by using checklists. Plant internal audits were also carried out by their own teams. Auditing and consulting services were applied to Iskenderun and IZ sites of our company. Loss prevention audit is conducted by third party (XLGAPS) in co-operation with Sabancı Holding in IZ and Adana sites.
PROJECTS
For protecting and improving the em-ployee safety, IHS (integrated health services) and OH (occupational health) committee worked together and pro-vided improvements about different topics. Bacteriological analysis of po-table water was conducted. Besides, ADME (Emergency Response Team) members, working in plants, were taken refreshment trainings. In the scope of the agreement with Artenius and Ener-jisa, SHE services continued to provide to these companies according to SLAs.
LEGISLATIVE WORKS AND OTHERS
Meetings of the Employee Safety and Health Committees formed for three dif-ferent registered plants were conducted and actions from these meetings were carried out in 2012.
Periodic health surveillances (check ups, audiograms, lung function tests etc.) and medical care of Sasa employees held by IHS. Periodic preventive main-tenance and controls of legally required equipments (pressurized vessels, lifting devices, fire fighting equipments, safety valves, confined space toxic gas moni-toring etc) completed.
As an environmentally responsible com-pany, by implementing our policy with the help of appropriate management systems which together with safety, oc-cupational health and environmental targets, continuous improvement pro-grams carried out; and capacity increase of waste water treatment project com-pleted in 2012.
DONATION INFORMATION
Our company has donated 38.185 TL in 2012.
In 2012, approximately 5,6 Million TL has been spent for new project.
General Informations Board of Directors Milestones The Message Of The Chairman About SASA Financials General Assembly

SASA POLYESTER SAN. A.Ş. 2012 ANNUAL REPORT- 33
FINANCIALS
Dividend Distribution Policy
Dividend distribution policy of our Company is to distri-bute dividends in cash at the rate of 30 % of distributable share to the shareholders.
This policy is reviewed in accordance with national and global economic conditions, projects in hand and funds state by Executive Board every year.
Our Company submitted aforementioned dividend dist-ribution policy for shareholders’ information at Ordinary General Meeting of 2005 and for public information with the material disclosure made within 2006.
Dividend distribution is executed within the shortest time following General Meeting within the periods prescribed at legislation.
There is no privilege to participate in company profit.
128
0.24
0.59
1.12
1.281.19
242
272257
52
2008
2008
2009
2009
2010
2010
2011
2011
2012
20120
0.2
0.4
0.6
0.8
1
1.2
1.4
Market Value (TL Million)
SASA BIST share performance (End of year -TL)
%51 %49
Free Float
H.Ö Sabancı Holding A.Ş.
Partnership structure as of 31 December 2012
General Informations Board of Directors Milestones The Message Of The Chairman About SASA Financials General Assembly

SASA POLYESTER SAN. A.Ş. 2012 ANNUAL REPORT- 35
OPERATING PROFIT AND NET PROFIT (TL THOUSAND)
Years Operating profit/(loss) Net profit/(loss)
2008 (27.069) (50.698)
2009 (16.971) (35.150)
2010 45.023 30.521
2011 51.251 42.110
2012 (8.006) (30.809)
NET SALES (TL MILLION)
Years Amount
2008 354
2009 361
2010 641
2011 905
2012 1.000
BASIC FINANCIAL INDICATORS (TL MILLION )
2012 2011 2010 2009 2008
Net Sales 1.000 905 641 361 354
Gross Profit 48 119 80 16 (10)
Operating Profit/Loss (8) 51 45 (17) (27)
EBITDA 13 72 64 2 (8)
Net Profit/Loss (31) 42 31 (35) (51)
EBITDA Margin(%) 1 8 10 1 (2)
Net Profit Margin(%) (3) 5 5 (10) (14)
Capacity Information
The DMT facility which is a petrochemical plant manufactures DMT by using paraxylene and methanol as raw materials. DMT is sent to polymerization facilities in liquid form to be pro-cessed with the raw material- Monoethylenegycol (MEG) and there finally converted to liquid polymers. The Company has a DMT capacity of 280.000 tonnes/year ,and a polymer capacity of 350,000 tonnes/year including PTA-based production.
The fibre, filament and polyester chips plants convert the poly-mers that they receive into tow, staple fibre, POY, filament and polyester chips. Tow is then converted in the tops facilities to raw-white and dyed tops.
Some of the POY production is processed into flat and tex-turized filaments ,and the remainder is sold as POY itself. The Company’s production capacities are: 160.000 tonnes/year fibre, 6,000 tonnes/year tops, 23,000 tonnes/year POY, 28.000 tonnes/year filament and 177.000 tonnes/ year polyester chips, 6.000 tonnes/year SSP chips.
The utilization ratio of the polymerization capacity for 2012 was 79% (2011: 85%).
Sales volumes (Tonnes)
2012 2011 2010 2009 2008
Dmt 9.880 17.731 18.636 4.037 16.564
Polyester Chips 106.933 92.457 94.358 55.882 40.333
Polyester Fibre 143.272 117.367 114.984 75.563 72.518
Polyester Filament 8.970 8.108 6.501 5.757 5.994
Poy 5.572 6.152 5.436 2.301 6.140
Tops 1.616 1.683 1.958 1.396 1.812
Total 276.230 243.498 241.873 144.936 143.361
Sales Revenues (TL Thousand)
2012 2011 2010 2009 2008
Dmt 24.572 44.202 30.747 5.633 26.760
Polyester Chips 388.694 331.839 245.532 123.577 90.277
Polyester Fibre 500.846 443.130 311.784 184.701 174.156
Polyester Filament 45.985 43.171 30.769 27.703 28.912
Poy 18.804 21.364 13.767 7.619 18.274
Tops 8.696 9.346 8.192 6.179 7.880
Other 12.381 11.530 317 6.026 8.132
Total 999.978 904.582 641.108 361.438 354.391
PRODUCTION and SALES OPERATIONS
Production volumes (Tonnes)
2012 2011 2010 2009 2008
Dmt 223.991 244.103 239.245 142.705 161.972
Polyester Chips 117.374 98.494 100.034 65.604 54.287
Polyester Fibre 147.421 118.952 110.408 75.566 68.596
Polyester Filament 9.166 7.441 6.362 5.404 5.769
Poy 14.618 13.284 10.532 6.603 8.691
Tops 1.727 1.729 1.761 1.132 1.950
Tow 1.451 2.328 1.515 1.643 1.783
General Informations Board of Directors Milestones The Message Of The Chairman About SASA Financials General Assembly

202
115
170184
82
2008 2009 2010 2011 2012
Total exports ( FOB USD Million)
%83 %17
Distribution of fibre-tops-filament-poy sales volumes in 2012
Domestic market
Domestic market
Foreign market
Foreign market % 45Distribution of SPC Sales volumes in 2012
%55
Distribution of 2012 sales income by currency%61
%36
%3
USD
EUR
TL
SASA POLYESTER SAN. A.Ş. 2012 ANNUAL REPORT- 37
*Special Polymers and Chemicals (SPC)-Polyester Cips,Dmt.
General Informations Board of Directors Milestones The Message Of The Chairman About SASA Financials General Assembly

Financial ratios 2012 2011
Liquidity ratios
Current ratio 1,03 1,25
Liquidity ratio (acid test ratio) 0,52 0,65
Cash ratio 0,10 0,13
Operational ratios
Receivable turnover (days) 60 55
Product and semi-finished product inventory turnover (days) 28 34
Asset turnover 1,46 1,46
Financial structure ratios
Total liabilities/equity 1,81 1,25
Total liabilities/total assets 0,64 0,56
Short-term payables/total assets 0,62 0,51
Long-term payables/total assets 0,03 0,05
Equity/total assets 0,36 0,44
Interest coverage ratio : EBIT/Interest expenses (1,63) 6,48
Profitabilitiy Ratios
Total Asset Profitabilitiy : Net Period Profit/Total Assets (0,05) 0,07
Equity Profitabilitiy : Net Period Profit /Equity (0,13) 0,16
Gross Profit Margin : Gross Profit /Net Sales 0,05 0,13
Net Profit Margin : Net Profit / Net Sales (0,03) 0,05
CORPORATE RISK MANAGEMENT
Our Company has decided to realize its Corporate Risk Management by founding Sasa Risk Management Function Group under Risk Committee established pursu-ant to Sasa Corporate Risk Management Regulations by believing its experiences from the past, knowledge and energy and based on ISO 31000 / Risk Management – Principles and Guidelines Standards and to place it as a company culture.
Aim;
Its aim is to define, evaluate and report the risks encountered within the structure of Company or anticipated potentially and ensure that Corporate Risk Management systems are constituted, performed effec-tively with the aim of strategizing properly and implementation of Corporate Risk Management activities are assured.
By this means it is intended to get the fol-lowing benefits:
• To raise risk awareness throughout the Company, minimize surprises by con-ducting proactive administration rather than a reactive administration in line with determined risk appetite of Com-pany,
• To decrease losses and costs which may be encountered depending upon risks,
• To ensure income stabilization and sus-tainable growth,
• To enhance reputation and reliability of Company within social responsibility ac-tivities,
• To assure durability of compliance with legal arrangements,
• To develop Corporate Risk Management culture in order to Company’s entity and/or operations continuous progres-sion.
Scope;
The scope is that definitions, content, functioning, relevant organization and responsibilities in the matter of Corporate Risk Management within the structure of Sasa Polyester Industry Inc. are to be de-fined and determined.
In Corporate Risk Management activities, particularly ‘Sabancı Holding Corporate Risk Management Standard’ and ‘Monitor-ing and Reporting Guide of Critical Risk Indicators’ are accepted as a basis and applied as to cover financial, operational, strategic and environmental risk element belonging to all processes in all functions which are in service throughout Com-pany.
RISK MANAGEMENT POLICY
In order to provide all its stakeholders with maximum value as a globalised integrated polyester and chemicals producer, Sasa Polyester Industry Inc. has internalized an understanding which ensures;
• To protect value of their entity, create and implement a Risk Management Sys-tem which is based on the operational safety and sustainability principles and complies with strategic objectives,
• To be foreseen, managed, monitored potential risks in all process and func-tions, to be formed necessary activity plans beforehand and be improved con-tinuously,
• To determine the responsibilities related to Risk Management in order to resolve risks or decrease them to an acceptable and applicable level by taking into ac-count all risk levels in activities,
• To convey system objectives to employ-ees, to make them understood clearly and therefore to ensure communication channels to be kept open,
• To ensure the policies and system to be reviewed periodically by the Senior Management and its continuation,
• To obtain all kinds of source need re-quired by determined risk management,
• To comply with the applicable law, by-law and regulations, fulfill its responsi-bilities towards environment, customer, supplier and employees which it inter-acts with.
RISKS
SASA POLYESTER SAN. A.Ş. 2012 ANNUAL REPORT- 39
General Informations Board of Directors Milestones The Message Of The Chairman About SASA Financials General Assembly

SASA POLYESTER SAN. A.Ş. 2012 ANNUAL REPORT- 41
ARTICLES OF INCORPORATION AMENDMENTS and REASONS GENERAL ASSEMBLY INFORMATION
Article 6 and 12 of Company’s Articles of Incorporation were amended and Article 38 was included by Executive Board of our Company with the aim of complying with Corporate Management Principles in accordance with annunciation numbered 56 and Series IV concerning determinati-on and implementation of Corporate Ma-nagement Principles of Capital Market Bo-ard and the Articles of Incorporation has been amended upon General Assembly approval by getting the necessary per-missions from Capital Market Board Direc-torate and Ministry of Customs and Trade.
At the meeting of our Executive Board on the date of 21 February 2013, it was una-nimously resolved Articles 1, 3, 5, 6, 7, 8, 12, 13, 14, 15, 16, 17, 19, 20, 21, 22, 23, 24, 25, 26, 27, 28, 29, 30, 31 to be amended and Article of Share and Lay Out Conso-lidation to be removed and necessary permissions to be received from Capital Market Board Directorate and Ministry of Customs and Trade for our Articles of In-corporation complies with Turkish Com-mercial Code and Capital Market Code.
SASA POLYESTER SANAYİ A.Ş.
Ordinary General Meeting Agenda which shall be held at 11:00 on Tuesday, 26th March 2013
1. Opening and constituting Meeting Chairmanship,
2. Authorization of Meeting Chairmanship in the matter of signing Minutes of General Meeting,
3. Reading and negotiation of Executive Board Activity Report and Inspectorate Report and Independent Audit report of 2012,
4. Informing General Assembly about grants and aids done within 2012,
5. Informing General Assembly on transactions made with related parties within 2012,
6. Informing General Assembly on assurance, pledge, mortgage given in favor of third parties and incomes or benefits obtained within 2012,
7. Informing General Assembly on the operations specified in Principles 1, 3, 7 of Capital Market Board Corporate Management Principles within 2012,
8. Reading, negotiation and approval of Asset and Equities and Profit/Loss Accounts of 2012,
9. Release of Members of Board due to activities of 2012,
10. Release of Inspectorate Members,
11. Approval of reappointed Members of Board with the intention of compliance with Article 25 of Law numbered 6013 by General Assembly yearly,
12. Determination of donation borders which Company shall make in 2013,
13. Resolution of Articles 1, 3, 5, 6, 7, 8, 12, 13, 14, 15, 16, 17, 19, 20, 21, 22, 23, 24, 25, 26, 27, 28, 29, 30, 31 of Articles of Incorporation issued by Executive Board amendment and Provisional Article of Share and Lay Out Consolidation removal on the purpose of compliance with Turkish Commercial Code and Capital Market Code in a way that they are certified by Capital Market Board and T.R. Ministry of Customs and Trade,
14. Audits selection,
15. Approval of General Assembly Internal Directive which has been issued by Executive Board and determines working principles and manners of Company’s General Assemblies,
16. Permitting Chairman and Members of Board in order that they can execute transactions written in Articles 395 and 396 of Turkish Commercial Code.
General Informations Board of Directors Milestones The Message Of The Chairman About SASA Financials General Assembly

SASA POLYESTER SAN. A.Ş. 2012 ANNUAL REPORT- 43
DECLARATION OF COMPLIANCE WITH CORPORATE MANAGEMENT PRINCIPLES
1. Declaration of Compliance with Corporate Management Principles
Sasa Polyester Industry Inc. (hereinafter referred to as Company) complies with compulsory principles within the scope of “Annun-ciation Concerning Determination and Implementation of Corpo-rate Management Principles” of CMB which has been entered into force upon being published at Official Gazette numbered 28158 on 30th December 2011 and applies these principles.
Within the context of Annunciation, preliminary preparations have been initiated for works of conformity to the principles which are not compulsory to implement in terms of Company as of the same date.
SECTION I – SHAREHOLDERS
2. Shareholder Relations Unit
Shareholder relations unit was formed within General Accounting Department of our Company. This unit consists of two people and General Accounting Manager, Mehmet Pehlivan ([email protected]) is at the head of the unit. The other personnel at this unit is General Accounting Officer Ali Bülent Yılmazel ([email protected]). It can be contacted to those concerned through phone number (322) 441 00 53 and fax (322) 441 01 14.
Main duties of the unit are;
• to answer information requests of shareholders,
• to ensure General Meeting to be carried out correctly,
• to issue documents devoted to shareholders for General Meeting,
• to ensure voting results to be recorded and reports regarding these results to be delivered to the shareholders,
• to protect and monitor all kinds of issues concerning public dis-closure.
Shareholder relations unit is responsible for conducting relations with shareholders within the frame of Corporate Management Principles. Within these duties, all questions and also e-mails sent by shareholders were replied in 2012.
Pursuant to CMB regulations, 13 material disclosures were made at Public Disclosure Platform by Company in 2012. These disclosures were done in time and sanctions were not imposed by CMB or İstanbul Stock Exchange.
3. Exercising of Shareholders’ Right to Information Act
Shareholders’ requests coming through phone, e-mail and at face to face meetings were replied by Shareholder Unit in 2012. For that purpose, information which concern shareholders were an-nounced in obligatory notification processes on web page.
At the Articles of Incorporation, private audit appointment was not
issued as a right. A request on that matter was not received from shareholders in 2012.
4. General Meetings
One Ordinary General Meeting was held on 25th April 2012 and participation of shareholders who represent 51, 22 % rates of shares was ensured.
General Meeting notice was done through all kinds of communica-tion means, including electronic communication, which ensure to contact as many shareholders as possible minimum three weeks before the meeting date. Company does not have privileged share. There is one single vote right for each share and there is not any privilege on any share.
Activity Report including also audited 2011 numbers was submit-ted to the review of shareholders at least 15 days before General Assembly at Company Head Office. Shareholders did not exercise their right to ask questions during General Assembly and any other recommendation apart from agenda topics was not presented.
Important resolutions in Turkish Commercial Code are submitted to the approval of shareholders at General Assembly. All important resolutions which shall be included in amended laws when legis-lative harmonization of Corporate Management Principles is pro-vided shall be submitted to the approval of shareholders.
5. Voting Rights and Minority Rights
There is not any privileged voting right at Articles of Incorporation. With the thought that entitling cumulative vote right at present partnership percentages and partnership structure may ruin har-monized management structure of Company, any regulation has not been executed at Articles of Incorporation.
6. Dividend Rights
Dividend distribution policy of our Company is to distribute divi-dends in cash at the rate of 30 % of distributable share to the share-holders.
This policy is reviewed in accordance with national and global eco-nomic conditions, projects in hand and funds state by Executive Board every year.
Our Company submitted aforementioned dividend distribution policy for shareholders’ information at Ordinary General Meeting of 2005 and for public information with the material disclosure made within 2006.
Dividend distribution is executed within the shortest time follow-ing General Meeting within the periods prescribed at legislation.
7. Transfer of Shares
Any provision which restricts transfer of shares is not involved in
Articles of Incorporation.
SECTION II – PUBLIC DISCLOSURE
AND TRANSPARENCY
8. Information Policy
We have an information policy which has been prepared in con-formity with CMB Corporate Management Principles and it is pub-lished on the web site of our Company (www.sasa.com.tr). Informa-tion Policy has been issued pursuant to Corporate Management Principles and approved by the Executive Board. Information and documents designated by legislation, material disclosures and ex-ternal audited financial statements of 6th and 12th months and non-external audited financial statements of 3rd and 9th months which were issued in accordance with International Financial Re-porting Standards (IFRS) are sent to Public Disclosure Platform (PDP) as to be announced to public within the period specified by CMB. These processes are conducted by Shareholder Relations Unit.
The persons who can obtain insider information are Members of Board, Auditors, General Manager, Directors, Managers, Independ-ent Auditing Firm and all other department managers.
9. Company’s Web Site and Its Content
The Company has a corporate web site and it is www.sasa.com.tr. Information specified at Corporate Management Principles 2.2.1 is included at the web site.
Significant topics which can be followed at the web site are sum-marized as follows:
• Detailed information regarding corporate identity
• Vision and main strategies
• Information about Members of Board and Senior Management
• Company organization and partnership structure
• Articles of Incorporation
• Trade registry information
• Financial information
• Material Disclosure
• Statements on the date, agenda and agenda topics of General Meeting
• Minutes and List of Participants of General Meeting
• Power of Attorney sample
• Corporate Management implementations and compliance re-port
• Information policy
• Wages Policy for Members of Board and Senior Managers
• The news in the press about the Company
10. Activity Report
Activity Report is prepared pursuant to CMB Annunciation with Series XI. and number 29 and CMB Corporate Management Princi-ples. It is approved by Executive Board and declared to the public with financial statements. Afterwards, it is published at our web site (www.sasa.com.tr).
SECTION III – STAKEHOLDERS
11. Informing Stakeholders
Information which do not have the characteristics of business se-cret are transparently shared with the stakeholders by means of declaration to the public pursuant to the information policy.
Company employees are informed on their area of expertise and general issues in which they are interested through meetings, seminars, trainings and information delivered via e-mail. There is a portal for the employees and it is ensured that they can reach all kinds of information and documents by means of this portal.
Company stakeholders have adopted ethical principles and founded an ethical committee in order to protect their rights. Stakeholders can contact to the ethical committee through the e-mail addresses [email protected] and [email protected] and phone number (322) 441 01 92. If required, Audit Committee and/or Cor-porate Management Principles Committee are informed.
12. Codetermination of the Stakeholders
Codetermination of the employees is carried out through periodi-cal meetings held in Company and annual objective determina-tion and performance evaluation meetings. In addition, employees give feedback to the administration and their colleagues and the results are discussed at management meetings and action plans are organized for necessary amendments. With these approaches, it is ensured that employees show required participation and con-tributions for management effectiveness of the Company.
13. Human Resources Policy
Our main objective, as being Human Resources, is to restore Sasa to an efficient organization structure which always ensures labor peace and consists of employees being bound to organization, having high calibre, leading to the aims of the Company and be-ing proud to work at Sasa whom Sasa needs in getting sustainable competitive advantage.
Sasa believes that long-term association with its employees who open to change and are continuously in development, culture of the Company, knowledge and protection of Company’s main val-ues are the primary elements of achieving success in accomplish-ing its strategies and objectives and in this direction invests in hu-man.
In line with having a sustainable success in its strategy and objec-tives and in order to ensure that it has an organization which cre-ates competitive edge;

SASA POLYESTER SAN. A.Ş. 2012 ANNUAL REPORT- 45
• Organization is structured in accordance with necessity by review of human resources systems and processes,
• Skilled labor which shall carry the Company into future is brought in organization and accordingly cultural diversity is supported,
• Personal and professional development activities are organized so as to ensure that employees realize their potentials and con-tinuous improvement of their competence, knowledge and skills concerning their position,
• An active performance management in which they monitor regularly the performance of administrators and employees in an open communication environment and take the responsibilities is implemented in the manner that they support intuitional and personal development objectives,
• It is ensured that organization is backed up by skilled personnel with high potential as a part of the organizational success plan of critical positions,
• Platforms in which regular information sharing is done on issues concerning Company and employees and employees can clearly express their and their representatives ideas with a participative management approach are formed for employees,
• Sabancı Business Ethic Values which consist of rules related to providing equal (gender, religion, language, etc. discriminations are not done) and fair work environment are applied to all em-ployees,
• A common Company culture is created by realizing imple-mentations and approaches which shall increase employees’ institutional commitment in at stake, reliable and healthy work environment in which employees can show their potentials. A representative has not been appointed as to conduct relations with Company employees. Any complaint was not received on discrimination from the employees within or before 01.01.2012-31.12.2012.
14. Codes of Conduct and Social Responsibility
Business ethical codes of the Company has been constituted and put into practice. Informing the employees on these codes is car-ried out by publishing the codes on inner communication portal of the Company, distributing manuals to all employees and real-izing information trainings. Furthermore, employees update their knowledge on business ethical codes via an e-learning program and renew their commitment to these codes by filling “Business Ethics Conformity Declaration” every year.
As it is included at the Activity Report of the Company but not de-clared to the public, our Company maintains human health and environment-conscious Labor Safety, Employee’s Health and Envi-ronment Policies and applies explicitly the ethics codes of Com-pany. Moreover, Company donates 4 % of its pretax profit to Hacı Ömer Sabancı Foundation or Sabancı University provided that it is deducted from the tax base and first dividend which shall be dis-tributed to the shareholders in accordance with the Articles of In-corporation is not injured every year.
SECTION IV – EXECUTIVE BOARD
15. Structure and Formation of the Executive Board
Company is administered and represented by an Executive Board which is elected by General Assembly pursuant to Turkish Com-mercial Code and provisions of Capital Market Legislation and con-sists of minimum six members. Majority of the Members of Board comprise of the members who are not responsible for enforce-ment defined at Corporate Management Principles. Two Members of Board are independent members and members of Board are elected in line with Corporate Management Principles by General Assembly. Duty term of Members of Board is maximum three years. The member whose duty term is ended can be re-qualified. In the event that a membership becomes vacant by any reason, Executive Board elects a new member for the vacant position and submits it for approval of General Assembly at its first meeting. This member completes the remaining term of its predecessor.
Executive and non-executive and independent member distinc-tion of Company’s Members of Board is as follows:
Mehmet Göçmen Chairman of the Executive Board (non-executive member)
Serra Sabancı Vice Chairman of the Executive Board (non-executive member)
Mehmet Nurettin Pekarun Member of Board (non-executive member)
Mahmut Volkan Kara Member of Board (non-executive member)
Hüsnü Ertuğrul ErgözMember of Board (independent member)
Mehmet KahyaMember of Board (independent member)
Members of Board have been entitled to the right to take action pursuant to the Articles 395 and 396 of Turkish Commercial Code by resolution of General Assembly.
16. Activity Principals of Executive Board
Executive Board of Company held 38 meetings by means of receiv-ing written consent in parallel to the provisions of Turkish Commer-cial Code and Articles of Incorporation in 2012. Provisions regarding meetings of Executive Board are included at Articles of Incorpora-tion and accordingly dates and agenda of meetings of Executive Board are determined by chairman or his agent and it is gathered upon invitation of chairman or his agent. Determined agenda and agenda topics are conveyed to the Members of Board beforehand in order that they can execute required operations.
At the meetings held in 2012, any different thought against resolu-tions which were taken by Members of Board was not expressed.
Actual participation of the members who had not an excuse was ensured at the meetings of Executive Board. As Members of Board did not have any questions on those matters, it was not appended to record. Members of Board were not entitled to the weighted vot-ing right and/or veto right concerning aforesaid resolutions.
Management right and power of attorney of the Executive Board are defined at Articles of Incorporation.
Members of Board did not carry out operations with the Company in 2012 and undertake any enterprise which could compete with the same activity issues.
17. The Number, Structure and Independence of Commit-tees Formed at the Executive Board
We have Corporate Management Committee and an Audit Com-mittee subjected to the Executive Board.
Corporate Management Committee
President : Mehmet Kahya (Independent Member)Member : Mahmut Volkan Kara
Corporate Management Committee President is selected among the independent members in compliance with Corporate Manage-ment Principles. The Corporate Management Committee meet-ings are held at least four times a year at a place determined by the president. The Committee arranges meetings at least once a year to revise Risk Management Systems. At the beginning of each year, meeting schedule of the year is prepared and announced to all the members by the Committee President. The others who are approved by the president can participate in the meetings.
Since there is no committee for nomination, early risk determina-tion and compensation committee in the present configuration of the Executive Board, works of the mentioned committees are executed by the Corporate Management Committee.
Audit Committee
President : Hüsnü Ertuğrul Ergöz (Independent Member) Member : Mehmet Kahya (Independent Member)
Audit Committee President is selected among the independent members in compliance with Corporate Management Principles. Audit Committee arranges meetings four times a year. At the meet-ings, the works done by internal control officers, the presentation of the Executive Board, performance of Independent Audit Firm and financial statements are revised and violation and examination of business ethics and rules of behaviors are made agenda topics.
No conflict of interest occurred among committees during the year of 2012.
Our company has two Independent Members of Board. Our Inde-pendent Members of Board, Mehmet Kahya and Hüsnü Ertuğrul Ersöz, are in both committees established by Executive Board.
18. Risk Management and Internal Control Mechanism
Executive Board of the Company has created various mechanisms to provide risk management and internal control. In the scope of Sabancı Holding “Corporate Risk Management Standards”, a risk committee of the company has been created and this committee arranges meetings regularly. At the meetings, the critical risks Com-pany experienced, management of these risks and measurements to be taken are periodically discussed.
In addition, Internal Audit Unit created within the Company is au-thorized and responsible for control of the Company.
19. Strategic Aims of the Company
Vision: To situate in a way to create the highest value in present and further works.
Mission: To make investments for facilities and workers for profit-able and continuous development.
Our values:
• A “representative sample” on the matters of environment, health and security
• Innovative
• Client oriented
• Competitive
• Responsible and esteemed
• Result- based
• Sophisticated
• Dynamic
• Confidential
• Take strength from market conditions
Our first priority is health and security of our personnel, environ-ment (environment and region of our company), our customers and neighboring companies. One of our main aims is to become an esteemed company.
Strategic aims created by the managers are subjected to approval of the Executive Board of the Company. In addition, the Executive Board revises its level to accomplish its aims, activities and previ-ous performance regularly each month via monthly reports. Fur-thermore, current year’s budget and actual comparison results are submitted to the Executive Board
20. Financial Rights
Forms and conditions of all the rights, benefits and payment for the Members of Board are totally mentioned in balance sheets. In extraordinary General Meeting in 2011, it was decided that 3.000 TL salary would be paid to the Members of Board during their duty period (for 3 years).
During the year of 2012, Company did not provide loan, credit, extent credits and did not provide good conditions for this and did not get them use credit through third party and did not give a guaranty to any directors and board of management members.
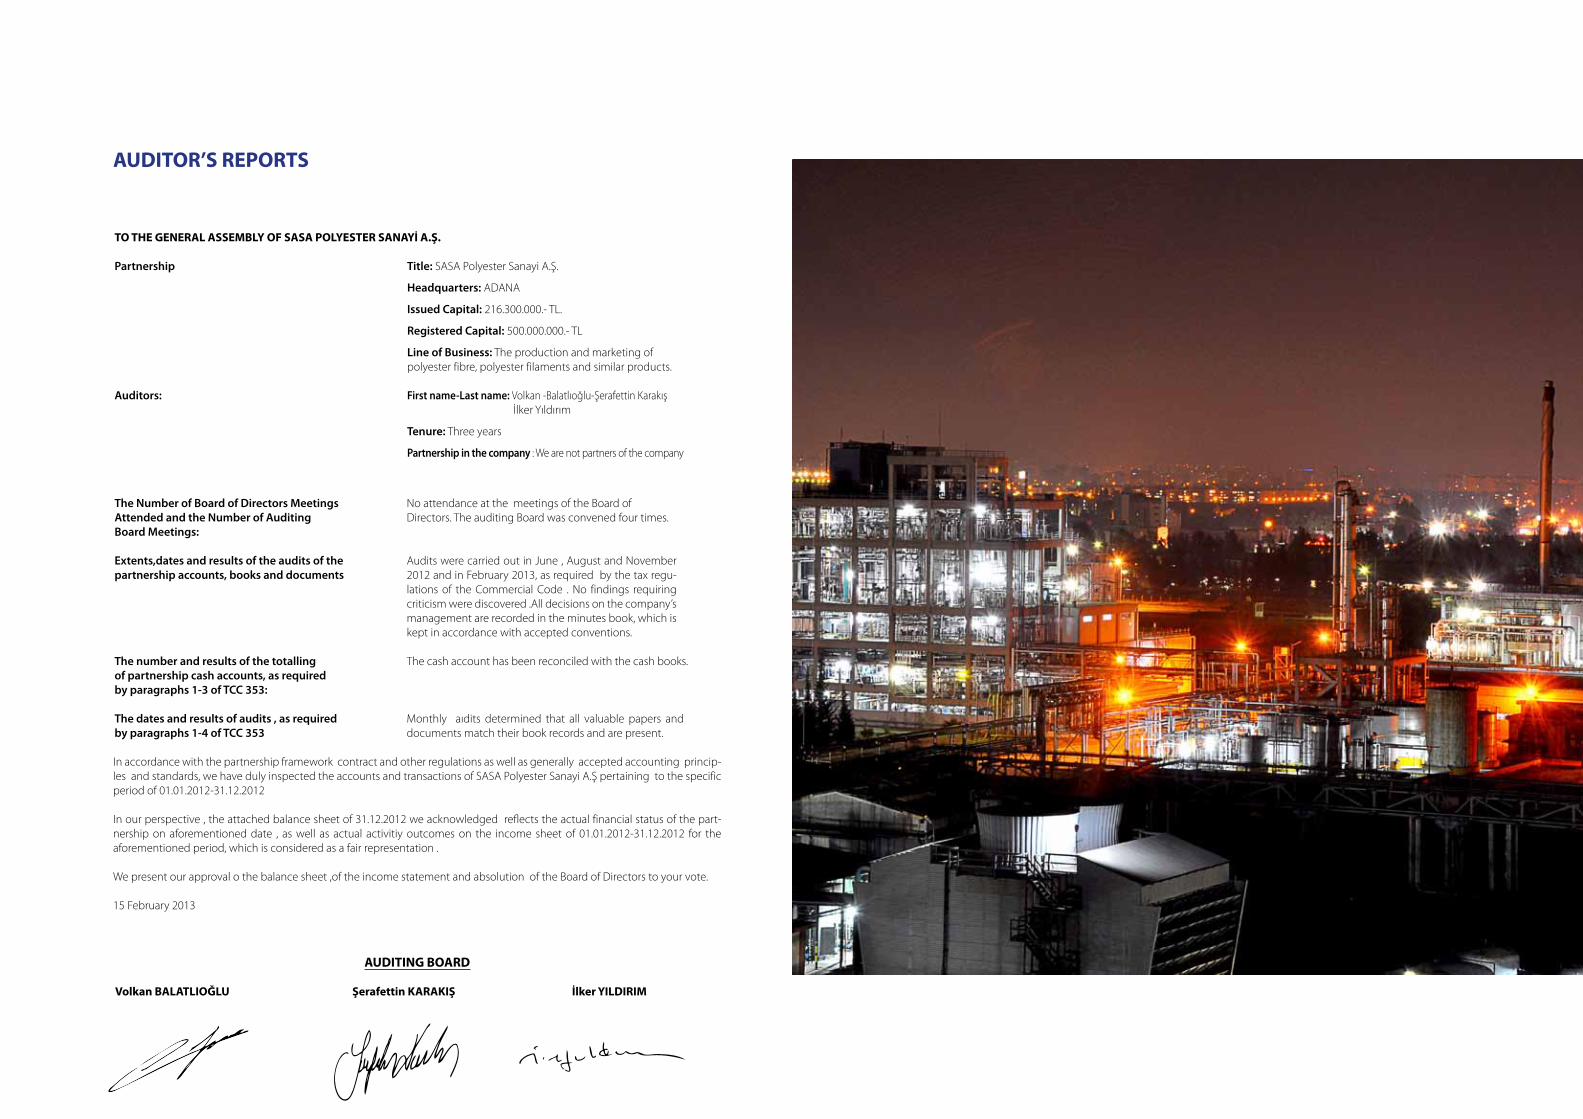
AUDITOR’S REPORTS
TO THE GENERAL ASSEMBLY OF SASA POLYESTER SANAYİ A.Ş.
Partnership Title: SASA Polyester Sanayi A.Ş.
Headquarters: ADANA
Issued Capital: 216.300.000.- TL.
Registered Capital: 500.000.000.- TL
Line of Business: The production and marketing of polyester fibre, polyester filaments and similar products.
Auditors: First name-Last name: Volkan -Balatlıoğlu-Şerafettin Karakış İlker Yıldırım
Tenure: Three years
Partnership in the company : We are not partners of the company
The Number of Board of Directors Meetings Attended and the Number of Auditing Board Meetings:
No attendance at the meetings of the Board of Directors. The auditing Board was convened four times.
Extents,dates and results of the audits of the partnership accounts, books and documents
Audits were carried out in June , August and November 2012 and in February 2013, as required by the tax regu-lations of the Commercial Code . No findings requiring criticism were discovered .All decisions on the company’s management are recorded in the minutes book, which is kept in accordance with accepted conventions.
The number and results of the totalling of partnership cash accounts, as required by paragraphs 1-3 of TCC 353:
The cash account has been reconciled with the cash books.
The dates and results of audits , as required by paragraphs 1-4 of TCC 353
Monthly aıdits determined that all valuable papers and documents match their book records and are present.
In accordance with the partnership framework contract and other regulations as well as generally accepted accounting princip-les and standards, we have duly inspected the accounts and transactions of SASA Polyester Sanayi A.Ş pertaining to the specific period of 01.01.2012-31.12.2012
In our perspective , the attached balance sheet of 31.12.2012 we acknowledged reflects the actual financial status of the part-nership on aforementioned date , as well as actual activitiy outcomes on the income sheet of 01.01.2012-31.12.2012 for the aforementioned period, which is considered as a fair representation .
We present our approval o the balance sheet ,of the income statement and absolution of the Board of Directors to your vote.
15 February 2013
AUDITING BOARD
Volkan BALATLIOĞLU Şerafettin KARAKIŞ İlker YILDIRIM

SASA POLYESTER SANAYİ A.Ş.
FINANCIAL STATEMENTS FOR THE YEAR ENDED 31 DECEMBER
2012 AND INDEPENDENT AUDITOR’S REPORT
31.12.2012

SASA POLYESTER SAN. A.Ş. 2012 ANNUAL REPORT- 3
INDEPENDENT AUDITOR’S REPORTTo the Shareholders of Sasa Polyester Sanayi A.Ş.
We have audited the accompanying financial statements of Sasa Polyester Sanayi A.Ş. (hereafter referred to as “the Com-pany”) which comprise the balance sheet as at 31 December 2012, statement of comprehensive income, statement of changes in equity, statement of cash flow for the year then ended and a summary of significant accounting policies and other explanatory information.
Management’s responsibility for the financial statements
Management is responsible for the preparation and fair presentation of these financial statements in accordance with Financial Reporting Standards published by Capital Market Board. This responsibility includes designing, implementing and maintaining internal control relevant to the preparation and fair presentation of financial statements that are free from material misstatement, whether due to fraud or error; selecting and applying appropriate accounting policies; and making accounting estimates that are reasonable in the circumstances.
Auditor’s responsibility
Our responsibility is to express an opinion on these financial statements based on our audit. We conducted our audit in accordance with generally accepted auditing standards issued by Capital Market Board. Those standards require that we comply with ethical requirements and plan and perform the audit to obtain reasonable assurance whether the financial statements are free from material misstatement.
An audit involves performing procedures to obtain audit evidence about the amounts and disclosures in the financial statements. The procedures selected depend on the auditor’s judgment, including the assessment of the risks of materi-al misstatement of the financial statements, whether due to fraud or error. In making those risk assessments, the auditor considers internal control relevant to the entity’s preparation and fair presentation of the financial statements in order to design audit procedures that are appropriate in the circumstances, but not for the purpose of expressing an opinion on the effectiveness of the entity’s internal control. An audit also includes evaluating the appropriateness of accounting policies used and the reasonableness of accounting estimates made by management, as well as evaluating the overall presentation of the financial statements.
We believe that the audit evidence we have obtained is sufficient and appropriate to provide a basis for our audit opin-ion.
Opinion
In our opinion, the financial statements present fairly, in all material respects, the financial position of Sasa Polyester Sanayi A.Ş. as of 31 December 2012, and its financial performance and cash flows for the year then ended in accordance with financial reporting standards published by Capital Market Board.
Istanbul, 1 March 2013
DRT BAĞIMSIZ DENETİM VE SERBEST MUHASEBECİ MALİ MÜŞAVİRLİK A.Ş.
Member of DELOITTE TOUCHE TOHMATSU LIMITED
Ömer Tanrıöver
Partner
DRT Bağımsız Denetim ve Muhasebeci Mali Müşavirlik A.Ş.
Sun Plaza Bilim Sok. No: 5 Maslak - Şişli 34398 İstanbul / Türkiye

SASA POLYESTER SAN. A.Ş. 2012 ANNUAL REPORT- 5
SASA POLYESTER SANAYİ A.Ş.STATEMENT OF FINANCIAL POSITION AS AT 31 DECEMBER 2012(Amounts expressed in thousands of Turkish Lira (“TL”) unless otherwise steted.)
SASA POLYESTER SANAYİ A.Ş.STATEMENT OF COMPREHENSIVE INCOME FOR THE YEAR ENDED 31 DECEMBER 2012(Amounts expressed in thousands of Turkish Lira (“TL”) unless otherwise steted.)
The accompanying notes form an integral part of these financial statements. The accompanying notes form an integral part of these financial statements.
Current Period(Audited)
Prior Period(Audited)
Notes 31 December 2012 31 December 2011
ASSETSCurrent Assets 433.049 386.130 Cash and Cash Equivalents 3 3.785 1.573 Trade Receivables 6 203.305 175.761 - Other Trade Receivables 203.299 174.886 - Trade Receivables from Related Parties 6 875 Other Receivables 7 12.146 20.937 - Other Receivables 11.798 20.707 - Other Receivables from Related Parties 348 230 Inventory 8 213.813 187.763 Other Current Assets 15 519 96 Non-Current Assets 250.103 234.052 Equity Participation 4 440 440 Trade Receivables 6 106 268 Other Receivables 7 36 - Investment Properties 9 1.419 1.609 Property, Plant and Equipment 10 172.644 184.300 Intangible Assets 11 4.138 3.531 Other Non Current Assets 15 71.320 43.904 TOPLAM VARLIKLAR 683.671 620.182
LIABILITIESCurrent Liabilities 421.646 316.643 Financial Liabilities 5 281.605 125.060 Trade Payables 6 118.739 172.647 - Other Trade Payables 106.482 165.387 - Trade Payables to Related Parties 12.257 7.260 Other Payables 7 16.632 13.489 - Other Payables 16.610 13.450 - Other Payables to Related Parties 22 39 Provisions 12 2.114 2.057 Provision for Employment Benefits 14 2.556 3.390 Non Current Liaibilities 18.351 29.056 Financial Liabilities 5 - 4.363 Other Payables 7 2.569 10.276 Retirement Pay Provision 14 15.767 14.233 Deferred Tax Liabilities 22 15 184 EQUITY 243.674 274.483 Share Capital 16 216.300 216.300 Share Capital Inflation Adjustments 16 196.213 196.213 Kardan Ayrılan Kısıtlanmış Yedekler 16 5.356 5.356 Retained Earnings 16 (143.386) (185.496)Net (Loss) / Profit for the Period (30.809) 42.110 TOTAL LIABILITIES AND EQUITY 683.671 620.182 Contingent assets and liabilities 12. 13
Notes
Current Period(Audited)
1 January - 31 December 2012
Prior Period(Audited)
1 January - 31 December 2011
OPERATING REVENUE
Sales Revenue (net) 17 999.978 904.582
Cost of Sales (-) 17 (952.176) (785.116)
GROSS PROFIT 47.802 119.466
Marketing, Sales and Distribution Expenses (-) 18 (36.211) (31.482)
Administrative Expenses (-) 18 (17.683) (13.933)
Research and Development Expenses (-) 18 (3.450) (2.230)
Other Operating Income 19 26.351 21.264
Other Operating Expenses (-) 19 (24.815) (41.834)
OPERATING PROFIT (8.006) 51.251
Financial Income 20 22.740 47.268
Financial Expenses (-) 21 (45.712) (57.521)
OPERATING (LOSS) / PROFITBEFORE TAX (30.978) 40.998
Tax Benefit 169 1.112
- Current Tax (Expense) / Income - -
- Deferred Tax Benefit 22 169 1.112
PROFIT FOR THE YEAR (30.809) 42.110
OTHER COMPREHENSIVE INCOME (AFTER TAX)
- -
TOTAL COMPREHENSIVE INCOME (30.809) 42.110
(Loss) / Earning Per Share - thousands of ordinary shares (TL)
23 (1,42) 1,95

SASA POLYESTER SAN. A.Ş. 2012 ANNUAL REPORT- 7
SASA POLYESTER SANAYİ A.Ş.STATEMENT OF CHANGES IN EQUITY FOR THE YEAR ENDED 31 DECEMBER 2012(Amounts expressed in thousands of Turkish Lira (“TL”) unless otherwise steted.)
NotesPaid in Capital
Inflation Adjustment to
Shareholders Equity
Restricted Reservesr
Accumulated Deficit and
Net Profit for the Period Total
Balance at 1 January 2011 16 216.300 196.213 5.356 (185.496) 232.373
Total comprehensive income - - - 42.110 42.110
Balance at 31 December 2011 16 216.300 196.213 5.356 (143.386) 274.483
Balance at 1 January 2012 16 216.300 196.213 5.356 (143.386) 274.483
Total comprehensive loss (-) - - - (30.809) (30.809)
Balance at 31 December 2012 16 216.300 196.213 5.356 (174.195) 243.674
SASA POLYESTER SANAYİ A.Ş.STATEMENTS OF CASH FLOWS FOR THE YEAR ENDED 31 DECEMBER 2012(Amounts expressed in thousands of Turkish Lira (“TL”) unless otherwise steted.)
Notes
Current Period(Audited)
“1 January - 31 December 2012”
Prior Period(Audited)
“1 January - 31 December 2011”
(Loss) / Profit before taxation (30.978) 40.998
Cash flows from operating activities:
Depreciation and amortization expense 9, 10, 11 21.316 20.255 Interest expense 21 18.714 11.201 Gain on sale of fixed assets 19 (36) (84)Change in provision for employee benefits 14 5.903 5.098 Change in provisions 12 57 523 Interest income from bank deposits 20 (4) (1.474)Rediscount interest income (net) 635 (13)Allowance for doubtful receivables 6 601 704 Tax expense 7,19 - 21.135 Provision for impairment inventories-net 8, 17 (1.545) 520 Operating cash flows providedbefore changes in working capital: 14.663 98.863 Changes in operating assets and liabilities:Changes in trade receivable 6 (28.189) (82.460)Changes in due from related parties 6, 7 751 11.645 Changes in inventories 8 (24.505) (75.882)Changes in other receivables 7 8.873 (18.495)Changes in other current assets 15 (423) (2)Changes in other non-current assets 15 (27.416) (2.358)Changes in trade payables 6 (60.203) 78.000 Changes in due to related parties 24 4.980 (1.066)Changes in other long term liabilities 7 (398) 531 Changes in other short term liabilities 7 3.160 (2.212)Net cash generated by operating activities:Employment termination benefits paid (108.707) 6.564 Interest received 14 (5.203) (2.297)Interest paid 20 4 1.474 Tax payable paid 5 (17.309) (13.046)Ödenen vergi borçları 7 (7.309) (4.873)
Net cash provided by operating activities (138.524) (12.178)
Investing activities:Purchase of property, plant and equipment 10, 11 (11.168) (29.858)and intangible assetsProceeds from sale of property, plant 9, 10, 19 1.128 96
Net cash used in investing activities (10.040) (29.762)
Financing activities:Bank loans received 5 595.126 90.525 Repayment of borrowings 5 (443.447) (89.226)Repayment of financial leasings 5 (903) (751)
Net cash generated by financing acitivities 150.776 548
Net decrease in cash and cash equivalents 2.212 (41.392)Cash and cash equivalents at the beginning of the period 1.573 42.965
Cash and cash equivalents at the end of the period - 3.785 1.573
The accompanying notes form an integral part of these financial statements. The accompanying notes form an integral part of these financial statements.

SASA POLYESTER SAN. A.Ş. 2012 ANNUAL REPORT- 9
NOTE 1 - ORGANISATION AND NATURE OF OPERATIONS
Sasa Polyester Sanayi A.Ş. (*) (the “Company”) was incorporated on 8 November 1966 in Adana. The Company is mainly engaged in the production and marketing of polyester fibre, yarns and related products and pet chips. The Company is a subsidiary of Hacı Ömer Sabancı Holding A.Ş. (“Sabancı Holding”) (**). In this context, the Company’s ultimate parent company is Sabancı Holding. Shares of the Company are quoted on the Istanbul Stock Exchange.
The address of the registered office is as follows:
Yolgeçen Mahallesi Turhan Cemal Beriker Bulvarı No: 559 01355 Seyhan / Adana.
As of 31 December 2012, number of employees of the company is 1.200 (31 December 2011: 1.217).
(*) At the extraordinary general assembly meeting on September 23, 2011, the firm modified the second article, defined as “Brand”, of its Articles of Association and replaced the brand name “Advansa Sasa Polyester Sanayi A.Ş.” with “Sasa Polyester Sanayi A.Ş.”
(**) Once The Company was a subsidiary of Advansa B.V, which is domiciled in the Netherlands and a subsidiary of Hacı Ömer Sabancı Holding A.Ş. (“Sabancı Holding”). However, on May 26, 2011, Sabancı Holding purchased 11.031.300.118 Advansa Sasa Polyester Sanayi A.Ş shares (51%) which had been held by Advansa BV with par value of 110.313.001, 18 TL and paid 102.000.000 Euro.
NOTE 2 - BASIS OF PRESENTATION OF FINANCIAL STATEMENTS
2.1 Basis of preparation
Basis of Preparation of Financial Statements and Significant Accounting Policies
The Company maintains its books of account and prepares its statutory financial statements in accordance with ac-counting principles in the Turkish Commercial Code (“TCC”) and tax legislation.
The Capital Markets Board of Turkey (“CMB”) regulated the principles and procedures of preparation, presentation and announcement of financial statements prepared by the entities with the Communiqué No: XI-29, “Principles of Financial Reporting in Capital Markets” (“the Communiqué”). This Communiqué is effective for the annual periods starting from 1 January 2008 and supersedes the Communiqué No: XI-25 “The Financial Reporting Standards in the Capital Markets”. According to the Communiqué, entities shall prepare their financial statements in accordance with International Finan-cial Reporting Standards (“IAS/IFRS”) endorsed by the European Union. Until the differences of the IAS/IFRS as endorsed by the European Union from the ones issued by the International Accounting Standards Board (“IASB”) are announced by Turkish Accounting Standards Board (“TASB”), IAS/IFRS issued by the IASB shall be applied. Accordingly, Turkish Ac-counting Standards/ Turkish Financial Reporting Standards (“TAS/TFRS”) issued by the TASB which are in line with the aforementioned standards shall be considered.
As the differences of the IAS/IFRS endorsed by the European Union from the ones issued by the IASB has not been an-nounced by TASB as of date of preparation of these financial statements, have been prepared within the framework of Communiqué XI, No: 29 and related promulgations to this Communiqué as issued by the CMB in accordance with the accounting and reporting principles accepted by the CMB (“CMB Financial Reporting Standards”) which is based on IAS/IFRS. The financial statements and the related notes to them are presented in accordance with the formats required and communicated on April 17, 2008 and on February 9, 2009 by the CMB.
NOTE 2 - BASIS OF PRESENTATION OF FINANCIAL STATEMENTS (cont’d)
2.1 Basis for presentation (cont’d)
Per decree no 660 published on the Official Gazette dated 2 November 2011 and became effective, additional article no: 1 of the 2499 numbered Law on establishment of TASB has been abrogated and establishment of Public Oversight, Accounting and Auditing Standards Association (“Board”) has been decided by the Council of Ministers. In accordance with this additional temporary article no 1 of the decree, current regulations will prevail until related standards and regulations will be issued by the Board become effective. Therefore this situation, as of the reporting date, has no effect on the “Principles in Preparation of the Financial Statements” explained in this footnote.
Financial statements have been prepared based on the historical cost bases.
Financial statements are approved for declaration by Board of Directors on 1 March 2013 and signed by General Man-ager Toker Özcan and Cost Accounting, Budgeting and Reporting Manager Ferat Göç on behalf of the Board of Direc-tors. The financial statements of the Company are subject to the approval of shareholders in the General Assembly and the shareholders possess the right to ask for amendment of these financial statements at the General Assembly after issuance.
Reporting Currency
The financial statements of the company have been presented with the currency followed fort he basic economic activi-ties of the company (functional currency ). The financial conditions and economic activitiy results for each company, the financial statements have been presented in TL, which is the valid currency of the company.
2.2 Comparative information and the revising of the prior year financial statements
For the purpose of following the financial conditions and performance trends the financial statements are presented with comparison to the prior year. When needed, the prior year financial statements can be reclassified for consistency with the current year’s one and material differences can be revealed.
As of 31 December 2011, deferred VAT receivables stated in the other receivables amount to thousand TL 7.263 and stated in the other non-current receivables amount to thousand TL 24.923 classified to other non-current assets amount to thousand TL 32.186 in the accompanying financial statements and there is no effect on profit /(loss) as of 31 Decem-ber 2011. As of 31 December 2012, in the accompanyingfinancial statements the net effect of the miscellaneous sales income stated in the other operating income amount to thousand TL 4.697 has been separated into miscellaneous sales income and miscellaneous sales expense. Miscellaneous sales income amount to thousand TL 19.455 classified to ther operating income and miscellaneous sales expenses amount to thousand TL 14.758 classified to other operating expenses and there is no effect on profit /(loss) as of 31 December 2011. Cheques amounted to thousand TL 38.863, included to cash and cash equivalent classified to trade receivables as of 31 December 2011.
2.3 Offsetting
Financial assets and liabilities are offset and the net amount reported in the balance sheet when there is a legally en-forceable right to set off the recognized amounts and there is an intention to settle on a net basis, or realize the asset and settle the liability simultaneously.
2.4 Changes in Accounting Policies
Changes in accounting policies are applied retrospectively and the financial tables for prior years are restated.
SASA POLYESTER SANAYİ A.Ş.NOTES TO THE FINANCIAL STATEMENTS FOR THE YEAR ENDED 31 DECEMBER 2012(Amounts expressed in thousands of Turkish Lira (“TL”) unless otherwise steted.)
SASA POLYESTER SANAYİ A.Ş.NOTES TO THE FINANCIAL STATEMENTS FOR THE YEAR ENDED 31 DECEMBER 2012(Amounts expressed in thousands of Turkish Lira (“TL”) unless otherwise steted.)

SASA POLYESTER SAN. A.Ş. 2012 ANNUAL REPORT- 11
NOTE 2 - BASIS OF PRESENTATION OF FINANCIAL STATEMENTS (cont’d)
2.5 Changes in Accounting Estimates and Errors
The effect of a change in an accounting estimate is recognized prospectively in the year of the change, if the change affects that year only; or the year of the change and future years, if the change affects both. There has not been any significant change in the accounting estimates of the Company in the current year.
Changes in accounting policies are applied retrospectively and the financial statements for prior years are restated.
2.6 New and Revised International Financial Reporting Standards
The following new and revised Standards and Interpretations have been adopted in the current period and have af-fected the amounts reported and disclosures in these financial statements. Details of other standards and interpreta-tions adopted in these financial statements but that have had no impact on the financial statements are set out in the following paragraphs of this section.
2.6.1. Amendments to IFRSs affecting amounts reported in the financial statements
None.
2.6.2. New and Revised IFRSs applied with no material effect on the financial statements
The following new and revised IFRSs have been adopted in financial statements. The application of these new and re-vised IFRSs has not had any material impact on the amounts reported for the current and prior years but may affect the accounting for future transactions or arrangements.
Amendments to IAS 12 Deferred Taxes – Recovery of Underlying Assets
The amendment is effective for annual periods beginning on or after 1 January 2012. IAS 12 requires an entity to meas-ure the deferred tax relating to an asset depending on whether the entity expects to recover the carrying amount of the asset through use or sale. It can be difficult and subjective to assess whether recovery will be through use or through sale when the asset is measured using the fair value model in IAS 40 Investment Property. The amendment provides a practical solution to the problem by introducing a presumption that recovery of the carrying amount will, normally be, through sale. The Group does not have investment property. The amendment did not have any effect on the consoli-dated financial statements.
Amendments to IFRS 7 Disclosures - Transfers of Financial Assets
The amendments to IFRS 7 increase the disclosure requirements for transactions involving transfers of financial assets. These amendments are intended to provide greater transparency around risk exposures when a financial asset is trans-ferred but the transferor retains some level of continuing exposure in the asset. The amendments also require disclosures where transfers of financial assets are not evenly distributed throughout the period.
These amendments to IFRS 7 did not have a significant effect on the Group’s disclosures. However, if the Group enters into other types of transfers of financial assets in the future, disclosures regarding those transfers may be affected.
NOTE 2 - BASIS OF PRESENTATION OF FINANCIAL STATEMENTS (cont’d)
2.6. New and Revised International Financial Reporting Standards (cont’d
2.6.3. New and revised IFRSs in issue but not yet effective
The Company has not applied the following new and revised IFRSs that have been issued but are not yet effective:
Amendments to IAS 1 Presentation of Items of Other Comprehensive Income
Amendments to IAS 1 Clarification of the Requirements for Comparative Information
IFRS 9 Financial Instruments
IFRS 10 Consolidated Financial Statements
IFRS 11 Joint Arrangements3
IFRS 12 Disclosure of Interests in Other Entities
IFRS 13 Fair Value Measurement
Amendments to IFRS 7 Disclosures – Offsetting Financial Assets and Financial Liabilities
Amendments to IFRS 9 and IFRS 7 Mandatory Effective Date of IFRS 9 and Transition Disclosures
Amendments to IFRS 10, IFRS 11 Consolidated Financial Statements, Joint Arrangements and
and IFRS 12 Disclosures of Interests in Other Entities: Transition Guide
IAS 19 (as revised in 2011) Employee Benefits
IAS 27 (as revised in 2011) Separate Financial Statements
IAS 28 (as revised in 2011) Investments in Associates and Joint Ventures
Amendments to IAS 32 Offsetting Financial Assets and Financial Liabilities
Amendments to IFRSs Annual Improvements to IFRSs 2009-2011 Cycle except for the amendment to IAS 1
IFRIC 20 Stripping Costs in the Production Phase of a Surface Mine
Amendments to IAS 1 Presentation of Items of Other Comprehensive Income
The amendments to IAS 1 Presentation of Items of Other Comprehensive Income is effective for the annual periods beginning on or after 1 July 2012. The amendments introduce new terminology for the statement of comprehensive income and income statement. Under the amendments to IAS 1, the ‘statement of comprehensive income’ is renamed the ‘statement of profit or loss and other comprehensive income’ and the ‘income statement’ is renamed the ‘statement of profit or loss’. The amendments to IAS 1 retain the option to present profit or loss and other comprehensive income in either a single statement or in two separate but consecutive statements. However, the amendments to IAS 1 require items of other comprehensive income to be grouped into two categories in the other comprehensive income section: (a) items that will not be reclassified subsequently to profit or loss and (b) items that may be reclassified subsequently to profit or loss when specific conditions are met. Income tax on items of other comprehensive income is required to be allocated on the same basis - the amendments do not change the option to present items of other comprehensive in-come either before tax or net of tax. The amendments can be applied retrospectively. Other than the above mentioned presentation changes, the application of the amendments to IAS 1 does not result in any impact on profit or loss, other comprehensive income and total comprehensive income.
SASA POLYESTER SANAYİ A.Ş.NOTES TO THE FINANCIAL STATEMENTS FOR THE YEAR ENDED 31 DECEMBER 2012(Amounts expressed in thousands of Turkish Lira (“TL”) unless otherwise steted.)
SASA POLYESTER SANAYİ A.Ş.NOTES TO THE FINANCIAL STATEMENTS FOR THE YEAR ENDED 31 DECEMBER 2012(Amounts expressed in thousands of Turkish Lira (“TL”) unless otherwise steted.)

SASA POLYESTER SAN. A.Ş. 2012 ANNUAL REPORT- 13
NOTE 2 - BASIS OF PRESENTATION OF FINANCIAL STATEMENTS (cont’d)
2.6. New and Revised International Financial Reporting Standards (cont’d)
2.6.3. New and revised IFRSs in issue but not yet effective (cont’d)
Amendments to IAS 1 Presentation of Financial Statements
(as part of the Annual Improvements to IFRSs 2009-2011 Cycle issued in May 2012)
The amendments to IAS 1 as part of the Annual Improvements to IFRSs 2009-2011 Cycle are effective for the annual periods beginning on or after 1 January 2013.
IAS 1 requires an entity that changes accounting policies retrospectively, or makes a retrospective restatement or reclas-sification to present a statement of financial position as at the beginning of the preceding period (third statement of financial position). The amendments to IAS 1 clarify that an entity is required to present a third statement of financial position only when the retrospective application, restatement or reclassification has a material effect on the information in the third statement of financial position and that related notes are not required to accompany the third statement of financial position.
IFRS 9 Financial Instruments
IFRS 9, issued in November 2009, introduces new requirements for the classification and measurement of financial as-sets. IFRS 9 was amended in October 2010 to include requirements for the classification and measurement of financial liabilities and for derecognition.
Key requirements of IFRS 9:
•AllrecognizedfinancialassetsthatarewithinthescopeofIAS39FinancialInstruments:RecognitionandMeas-urement to be subsequently measured at amortized cost or fair value. Specifically, debt investments that are held within a business model whose objective is to collect the contractual cash flows, and that have contractual cash flows that are solely payments of principal and interest on the principal outstanding are generally measured at amortized cost at the end of subsequent accounting periods. In addition, under IFRS 9, entities may make an irrevocable election to present subsequent changes in the fair value of an equity investment (that is not held for trading) in other comprehensive in-come, with only dividend income generally recognized in profit or loss.
•Withregardtothemeasurementoffinancialliabilitiesdesignatedasatfairvaluethroughprofitorloss,IFRS9requires that the amount of change in the fair value of the financial liability that is attributable to changes in the credit risk of that liability, is presented in other comprehensive income, unless the recognition of the effects of changes in the liability’s credit risk in other comprehensive income would create or enlarge an accounting mismatch in profit or loss. Changes in fair value attributable to a financial liability’s credit risk are not subsequently reclassified to profit or loss. Previ-ously, under IAS 39, the entire amount of the change in the fair value of the financial liability designated as at fair value through profit or loss was presented in profit or loss.
NOTE 2 - BASIS OF PRESENTATION OF FINANCIAL STATEMENTS (cont’d)
2.6. New and Revised International Financial Reporting Standards (cont’d)
2.6.3. New and revised IFRSs in issue but not yet effective (cont’d)
IFRS 9 Financial Instruments (cont’d)
The Company management anticipates that the application of IFRS 9 in the future may have significant impact on amounts reported in respect of the Group’s financial assets and financial liabilities. However, it is not practicable to pro-vide a reasonable estimate of that effect until a detailed review has been completed.
New and revised Standards on consolidation, joint arrangements, associates and disclosures
In May 2011, a package of five Standards on consolidation, joint arrangements, associates and disclosures was issued, including IFRS 10, IFRS 11, IFRS 12, IAS 27 (as revised in 2011) and IAS 28 (as revised in 2011).
Key requirements of these five Standards are described below.
IFRS 10 replaces the parts of IAS 27 Consolidated and Separate Financial Statements that deal with consolidated financial statements. SIC-12 Consolidation - Special Purpose Entities will be withdrawn upon the effective date of IFRS 10. Under IFRS 10, there is only one basis for consolidation, that is control. In addition, IFRS 10 includes a new definition of control that contains three elements: (a) power over an investee, (b) exposure, or rights, to variable returns from its involvement with the investee, and (c) the ability to use its power over the investee to affect the amount of the investor’s return. Ex-tensive guidance has been added in IFRS 10 to deal with complex scenarios.
IFRS 11 replaces IAS 31 Interests in Joint Ventures. IFRS 11 deals with how a joint arrangement of which two or more par-ties have joint control should be classified. SIC-13 Jointly Controlled Entities - Non-monetary Contributions by Venturers will be withdrawn upon the effective date of IFRS 11. Under IFRS 11, joint arrangements are classified as joint operations or joint ventures, depending on the rights and obligations of the parties to the arrangements. In contrast, under IAS 31, there are three types of joint arrangements: jointly controlled entities, jointly controlled assets and jointly controlled operations. In addition, joint ventures under IFRS 11 are required to be accounted for using the equity method of ac-counting, whereas jointly controlled entities under IAS 31 can be accounted for using the equity method of accounting or proportional consolidation.
IFRS 12 is a disclosure standard and is applicable to entities that have interests in subsidiaries, joint arrangements, as-sociates and/or unconsolidated structured entities. In general, the disclosure requirements in IFRS 12 are more extensive than those in the current standards.
In June 2012, the amendments to IFRS 10, IFRS 11 and IFRS 12 were issued to clarify certain transitional guidance on the application of these IFRSs for the first time.
SASA POLYESTER SANAYİ A.Ş.NOTES TO THE FINANCIAL STATEMENTS FOR THE YEAR ENDED 31 DECEMBER 2012(Amounts expressed in thousands of Turkish Lira (“TL”) unless otherwise steted.)
SASA POLYESTER SANAYİ A.Ş.NOTES TO THE FINANCIAL STATEMENTS FOR THE YEAR ENDED 31 DECEMBER 2012(Amounts expressed in thousands of Turkish Lira (“TL”) unless otherwise steted.)

SASA POLYESTER SAN. A.Ş. 2012 ANNUAL REPORT- 15
DİPNOT 2 - BASIS OF PRESENTATION OF FINANCIAL STATEMENTS (cont’d)
2.6. New and Revised International Financial Reporting Standards (cont’d)
2.6.3. New and revised IFRSs in issue but not yet effective (cont’d)
New and revised Standards on consolidation, joint arrangements, associates and disclosures (cont’d)
These five standards together with the amendments regarding the transition guidance are effective for annual periods beginning on or after 1 January 2013, with earlier application permitted provided all of these standards are applied at the same time. The Group management anticipates that the application of these five standards may have a significant impact on amounts reported in the consolidated financial statements.
IFRS 13 Fair Value Measurement
IFRS 13 establishes a single source of guidance for fair value measurements and disclosures about fair value measure-ments. The Standard defines fair value, establishes a framework for measuring fair value, and requires disclosures about fair value measurements. The scope of IFRS 13 is broad; it applies to both financial instrument items and non-financial instrument items for which other IFRSs require or permit fair value measurements and disclosures about fair value meas-urements, except in specified circumstances. In general, the disclosure requirements in IFRS 13 are more extensive than those required in the current standards. For example, quantitative and qualitative disclosures based on the three-level fair value hierarchy currently required for financial instruments only under IFRS 7 Financial Instruments: Disclosures will be extended by IFRS 13 to cover all assets and liabilities within its scope.
IFRS 13 is effective for annual periods beginning on or after 1 January 2013, with earlier application permitted.
The Group management anticipates that IFRS 13 will be adopted in the Group’s consolidated financial statements for the annual period beginning 1 January 2013 and that the application of the new Standard may affect the amounts reported in the financial statements and result in more extensive disclosures in the financial statements.
Amendments to IFRS 7 and IAS 32 Offsetting Financial Assets and Financial Liabilities and the related dis-closures
The amendments to IAS 32 clarify existing application issues relating to the offset of financial assets and financial liabili-ties requirements. Specifically, the amendments clarify the meaning of ‘currently has a legally enforceable right of set-off’ and ‘simultaneous realization and settlement’.
The amendments to IFRS 7 require entities to disclose information about rights of offset and related arrangements (such as collateral posting requirements) for financial instruments under an enforceable master netting agreement or similar arrangement.
The amendments to IFRS 7 are effective for annual periods beginning on or after 1 January 2013 and interim periods within those annual periods. The disclosures should be provided retrospectively for all comparative periods. However, the amendments to IAS 32 are not effective until annual periods beginning on or after 1 January 2014, with retrospective application required.
NOT 2 - BASIS OF PRESENTATION OF FINANCIAL STATEMENTS (cont’d)
2.6. New and Revised International Financial Reporting Standards (cont’d)
2.6.3. New and revised IFRSs in issue but not yet effective (cont’d)
Amendments to IFRS 7 and IAS 32 Offsetting Financial Assets and Financial Liabilities and the related disclosures(cont’d)
The Group management anticipates that the application of these amendments to IAS 32 and IFRS 7 may result in more disclosures being made with regard to offsetting financial assets and financial liabilities in the future.
IAS 19 Employee Benefits
The amendments to IAS 19 change the accounting for defined benefit plans and termination benefits. The most sig-nificant change relates to the accounting for changes in defined benefit obligations and plan assets. The amendments require the recognition of changes in defined benefit obligations and in fair value of plan assets when they occur, and hence eliminate the ‘corridor approach’ permitted under the previous version of IAS 19 and accelerate the recognition of past service costs. The amendments require all actuarial gains and losses to be recognized immediately through other comprehensive income in order for the net pension asset or liability recognized in the consolidated statement of financial position to reflect the full value of the plan deficit or surplus. Furthermore, the interest cost and expected return on plan assets used in the previous version of IAS 19 are replaced with a ‘net-interest’ amount, which is calculated by applying the discount rate to the net defined benefit liability or asset. The amendments to IAS 19 require retrospective application.
Annual Improvements to IFRSs 2009 - 2011 Cycle issued in May 2012
The Annual Improvements to IFRSs 2009 - 2011 Cycle include a number of amendments to various IFRSs. The amend-ments are effective for annual periods beginning on or after 1 January 2013. Amendments to IFRSs include:
•AmendmentstoIAS16Property,PlantandEquipment;and
•AmendmentstoIAS32FinancialInstruments:Presentation.
Amendments to IAS 16
The amendments to IAS 16 clarify that spare parts, stand-by equipment and servicing equipment should be classified as property, plant and equipment when they meet the definition of property, plant and equipment in IAS 16 and as inven-tory otherwise. The Group management does not anticipate that the amendments to IAS 16 will have a significant effect on the Group’s consolidated financial statements.
Amendments to IAS 32
The amendments to IAS 32 clarify that income tax relating to distributions to holders of an equity instrument and to transaction costs of an equity transaction should be accounted for in accordance with IAS 12 Income Taxes. The Group management does not anticipate that the amendments to IAS 32 will have a significant effect on the Group’s consoli-dated financial statements.
SASA POLYESTER SANAYİ A.Ş.NOTES TO THE FINANCIAL STATEMENTS FOR THE YEAR ENDED 31 DECEMBER 2012(Amounts expressed in thousands of Turkish Lira (“TL”) unless otherwise steted.)
SASA POLYESTER SANAYİ A.Ş.NOTES TO THE FINANCIAL STATEMENTS FOR THE YEAR ENDED 31 DECEMBER 2012(Amounts expressed in thousands of Turkish Lira (“TL”) unless otherwise steted.)

SASA POLYESTER SAN. A.Ş. 2012 ANNUAL REPORT- 17
DİPNOT 2 - BASIS OF PRESENTATION OF FINANCIAL STATEMENTS (cont’d)
2.6. New and Revised International Financial Reporting Standards (cont’d)
2.6.3. New and revised IFRSs in issue but not yet effective (cont’d)
Annual Improvements to IFRSs 2009 - 2011 Cycle issued in May 2012 (cont’d)
IFRIC 20 Stripping Costs in the Production Phase of a Surface Mine
IFRIC 20 Stripping Costs in the Production Phase of a Surface Mine applies to waste removal costs that are incurred in surface mining activity during the production phase of the mine (production stripping costs). Under the Interpretation, the costs from this waste removal activity (stripping) which provide improved access to ore is recognized as a non-current asset (stripping activity asset) when certain criteria are met, whereas the costs of normal on-going operational stripping activities are accounted for in accordance with IAS 2 Inventories. The stripping activity asset is accounted for as an addition to, or as an enhancement of, an existing asset and classified as tangible or intangible according to the nature of the existing asset of which it forms part.
IFRIC 20 is effective for annual periods beginning on or after 1 January 2013. Specific transitional provisions are provided to entities that apply IFRIC 20 for the first time. However, IFRIC 20 must be applied to production stripping costs incurred on or after the beginning of the earliest period presented. The Group management anticipates that IFRIC 20 will have no effect to the Group’s financial statements as the Group does not engage in such activities.
2.7 Significant Accounting Estimations and Decisions
Preparation of financial statements necessitates the usage of estimates and assumptions that can affect the amounts of reported assets and liabilities as at balance sheet date, the explanation for the contingent assets and liabilities and the income and expenses reported during the accounting period. Although these estimates and assumptions are based on Company management’s best estimates related with the current conditions and transactions, actual results may differ than these estimates.
Net Realizable Value of Inventory
Inventories are stated at the lower of cost and net realizable value. Management has determined that the cost of in-ventories is higher than the realizable value as of the reporting date. The impairment calculation requires management to estimate the future cash flows expected to arise from the sale of inventories and the estimated selling price less all estimated costs of completion and costs necessary to make the sale. Based on the estimate made by the management as of 31 December 2012 the cost of inventories was reduced by TL 2.033 (31 December 2011: TL 3.578) and the expense was recorded to cost of sales.
NOTE 2 - BASIS OF PRESENTATION OF FINANCIAL STATEMENTS (cont’d)
2.7 Significant Accounting Estimations and Decisions (cont’d)
Determination of Recoverable Amount of Tangible Assets
As discussed in Note 10, the Company took into consideration the internal and external sources of information as de-scribed in IAS 36 “Impairment of Assets” as impairment indicators and performed a study based on discounted future cash flow models for the determination of the recoverable amount of the Company’s tangible assets as at 31 December 2012. The future projections included in the subject study is heavily dependent on the demand of customers in the market. Moreover, the Company management foresees that weight of production and sale of the products with higher gross profit margin will increase in future periods. This study which is based on discounted future cash flows reflects the Company management’s future estimations and assumptions.
Deferred tax
The Company recognizes deferred tax assets and liabilities based upon temporary differences arising between the finan-cial statements as reported for IFRS purposes and financial statements prepared in accordance with the tax legislation. Currently, there are deferred tax assets resulting from operating loss carry-forwards and deductible temporary differ-ences, all of which could increase taxable income in the future. Based on available evidence, both positive and negative, it is determined whether it is probable that all or a portion of the deferred tax assets will be realized. The main factors which are considered include future earnings potential; cumulative losses in recent years; history of loss carry-forwards and other tax assets expiring; the carry-forward period associated with the deferred tax assets; future reversals of exist-ing taxable temporary differences; tax-planning strategies that would, if necessary, be implemented, and the nature of the income that can be used to realize the deferred tax asset. If based on the weight of all available evidence, it is the Company’s belief that taxable profit will not be available sufficient to utilize some portion of these deferred tax assets, then some portion of or all of the deferred tax assets are not recognized. The Company has not recognized some of its deferred tax assets because it is not probable that taxable profit will be available sufficient to recognize deferred tax as-sets in this entity. If future results of operations exceed the Company’s current expectations, the existing unrecognized deferred tax assets may be recognized, resulting in future tax benefits.
Employment benefits
Retirement benefit obligations’ present value is determined through using certain assumptions under actuarial basis. These assumptions are also used in determining severance compensation’s net expense and include the discount ratio. Any change in such assumptions affects the value of the registered retirement benefit obligation. The retirement benefit obligation recognized in the balance sheet represents the present value of the defined benefit obligation as adjusted for unrecognized actuarial gains and losses. All actuarial gains and losses are accounted in the income statement.
At the end of each year, the Company determines the appropriate discount ratio. This ratio is used to calculate for the fulfillment of obligations for severance compensation’s present value of estimated future cash outflows (Note 14).
SASA POLYESTER SANAYİ A.Ş.NOTES TO THE FINANCIAL STATEMENTS FOR THE YEAR ENDED 31 DECEMBER 2012(Amounts expressed in thousands of Turkish Lira (“TL”) unless otherwise steted.)
SASA POLYESTER SANAYİ A.Ş.NOTES TO THE FINANCIAL STATEMENTS FOR THE YEAR ENDED 31 DECEMBER 2012(Amounts expressed in thousands of Turkish Lira (“TL”) unless otherwise steted.)

SASA POLYESTER SAN. A.Ş. 2012 ANNUAL REPORT- 19
NOTE 2 - BASIS OF PRESENTATION OF FINANCIAL STATEMENTS (cont’d)
2.8 Significant Accounting Estimations and Decisions
significant accounting policies which have been used in the preparation of financial reports are summarized as follows: Revenue
Revenue is recognized on accrual basis at the fair value of the amount obtained or to be obtained based on the assump-tions that delivery is realized, the income can be reliably determined and the inflow of the economic benefits related with the transaction to the Company is probable. Net sales are calculated after the sales returns and sales discounts are deducted.
Sale of goods
Revenue from sale of goods is recognized when all the following conditions are met:
The amount of revenue can be measured reliably,
It is probable that the economic benefits associated with the transaction will flow to the entity and,
The costs incurred or to be incurred in respect of the transaction can be measured reliably.
Other Revenues are recognized in accordance with following;
Dividend and interest revenue
Dividend income from investments is recognized when the shareholder’s right to receive payment has been established (provided that it is probable that the economic benefits will flow to the Company and the amount of income can be measured reliably).
Interest income from a financial asset is recognized when it is probable that the economic benefits will flow to the Company and the amount of income can be measured reliably. Interest income is accrued on a time basis, by reference to the principal outstanding and at the effective interest rate applicable, which is the rate that exactly discounts esti-mated future cash receipts through the expected life of the financial asset to that asset’s net carrying amount on initial recognition.
Rental income
Rental income from investment properties is recognized on a straight-line basis over the term of the relevant lease.
NOTE 2 - BASIS OF PRESENTATION OF FINANCIAL STATEMENTS (cont’d)
2.8 Significant Accounting Estimations and Decisions (cont’d)
Inventories
Inventories are stated at the lower of cost and net realizable value. Costs, including an appropriate portion of fixed and variable overhead expenses, are assigned to inventories held by the method most appropriate to the particular class of inventory, with the majority being valued on weighted average basis. Net realizable value represents the estimated selling price less all estimated costs of completion and costs necessary to make a sale. When the net realizable value of inventory is less than cost, the inventory is written down to the net realizable value and the expense is included in state-ment of income/(loss) in the period the write-down or loss occurred. When the circumstances that previously caused inventories to be written down below cost no longer exist or when there is clear evidence of an increase in net realizable value because of changed economic circumstances, the amount of the write-down is reversed. The reversal amount is limited to the amount of the original write-down.
Related Parties
For the purpose of the accompanying financial statements, shareholders of the Sasa Polyester Sanayi A.Ş., the real and legal person shareholders and subsidiaries, affiliates, one of the partners Sabancı Holding (Note 24) directly or indirectly capital and managerial relationships with other than the Entity’s subsidiaries of the located in institutions, the person who is directly or indirectly responsible of planning of the Entity’s activities, implementation and supervision of compe-tent, the Company’s or its parent company’s board member, administrative staff such as general managers, their close family members and those people’s, either directly or indirectly, companies that operates under their control are consid-ered and referred to as related companies.
Property, Plant and Equipment and Related Depreciation
Property, plant and equipment are carried at cost less accumulated depreciation and impairment loss if exists. Deprecia-tion is provided over adjusted costs on a straight-line basis over the economic useful lives. The depreciation periods for property, plant and equipment, which approximate the economic useful lives of such assets, are as follows:
Years
Land and land improvements 15 - 25
Buildings 18 - 25
Machinery, plant and equipment 15 - 25
Motor vehicles 5
Furniture and fixtures 5 - 10
When the carrying amount of an asset is greater than its estimated recoverable amount, it is written down immediately to its recoverable amount. The recoverable amount is the higher of net selling price or value in use. Net selling price is the amount obtainable from the sale of an asset or cash-generating unit in an arm’s length transaction between knowl-edgeable, willing parties, less the costs of disposal. Value in use is the present value of the future cash flows expected to be derived from an asset or cash generating unit plus the residual value.
Gains or losses on disposals of property, plant and equipment are included in the related income and expense accounts, as appropriate.
SASA POLYESTER SANAYİ A.Ş.NOTES TO THE FINANCIAL STATEMENTS FOR THE YEAR ENDED 31 DECEMBER 2012(Amounts expressed in thousands of Turkish Lira (“TL”) unless otherwise steted.)
SASA POLYESTER SANAYİ A.Ş.NOTES TO THE FINANCIAL STATEMENTS FOR THE YEAR ENDED 31 DECEMBER 2012(Amounts expressed in thousands of Turkish Lira (“TL”) unless otherwise steted.)

SASA POLYESTER SAN. A.Ş. 2012 ANNUAL REPORT- 21
NOTE 2 - BASIS OF PRESENTATION OF FINANCIAL STATEMENTS (cont’d)
2.8 Significant Accounting Estimations and Decisions (cont’d)
Leasing
Leasing – the Company as Lessee
Leases are classified as finance leases whenever the terms of the lease transfer substantially all the risks and rewards of ownership to the lessee. All other leases are classified as operating leases.
Assets held under finance leases are recognized as assets of the Company at their fair value at the inception of the lease or, if lower, at the present value of minimum lease payments. The corresponding liability to the lesser is included in the balance sheet as a finance lease obligation. Lease payments are apportioned between finance charges and reduction of the lease obligation so as to achieve a constant rate of interest on the remaining balance of the liability. Finance charges are charged to profit to loss, unless they are directly attributable to qualifying assets in which case they are capitalized in accordance with the Company’s general policy on borrowing costs.
Rentals payable under operating leases are charged to profit or loss on a straight-line basis over the term of the relevant lease. Benefits received and receivable as an incentive to enter into an operating lease are also spread on a straight-line basis over the lease term.
Assets Held for Sale
According to the company management, tangible assets which are held for sale, which the sale accounting has been completed within 1 year from the balance sheet date and which there is no active intention of holding the asset are valued with minimum of the book value and the fair value. The recovery of the book value doesn`t depend on the usage of the relevant tangible asset but the sale of the tangible asset. For the tangible assets classified under current assets held for sale, the depreciation provision is stopped as of the date of the classification date.
Intangible Assets
Intangible assets comprise of acquired intellectual property and computer software. They are recorded at acquisition cost and amortized on a straight-line basis over their estimated useful lives for a period not exceeding 5 years from the date of acquisition. Where an indication of impairment exists, the carrying amounts of any intangible assets including goodwill are assessed and written down immediately to their recoverable amount.
Research and Development Costs
Research costs are expensed as incurred, costs incurred on development projects (relating to the design and testing of new or improved products) are recognized as intangible assets when it is probable that the project will be a success considering its commercial and technological feasibility and only if the cost can be measured reliably. Other develop-ment expenditures are recognized as an expense as incurred. Development costs previously recognized as an expense are not recognized as an asset in subsequent periods.
NOTE 2 - BASIS OF PRESENTATION OF FINANCIAL STATEMENTS (cont’d)
2.8 Significant Accounting Estimations and Decisions (cont’d)
Financial Instruments
Financial assets
All financial assets are recognized and derecognized on a trade date where the purchase or sale of a financial asset is under a contract whose terms require delivery of the financial asset within the timeframe established by the market concerned, and are initially measured at fair value, plus transaction costs except for those financial assets classified as at fair value through profit or loss, which are initially measured at fair value.
Financial assets are classified into the following specified categories: financial assets as ‘at fair value through profit or loss’ (FVTPL), ‘held-to-maturity investments’, ‘available-for-sale’ (AFS) financial assets and ‘loans and receivables’. The clas-sification depends on the nature and purpose of the financial assets and is determined at the time of initial recognition.
Effective interest method
The effective interest method is a method of calculating the amortized cost of a financial asset and of allocating interest income over the relevant period. The effective interest rate is the rate that exactly discounts estimated future cash re-ceipts through the expected life of the financial asset, or, where appropriate, a shorter period to the net carrying amount on initial recognition.
Income is recognized on an effective interest basis for debt instruments other than those financial assets designated as at FVTPL.
Available for sale financial assets
Investments intended to be held for an indefinite period of time, which may be sold in response to needs for liquidity or changes in interest rates, are classified as available-for-sale; these are included in non-current assets unless management has the express intention of holding the investment for less than 12 months from the balance sheet date or unless they will need to be sold to raise operating capital, in which case they are included in current assets. Management determines the appropriate classification of its investments at the time of the purchase and re-evaluates such designations on a regular basis.
All financial assets are initially recognized at cost, being the fair value of the consideration given and including acquisi-tion charges associates with the investment. After initial recognition, financial assets that are classified as available-for-sale are measured at fair value unless fair value cannot be reliably measured.
Other investments in which the Company has an interest below 20%, or over which the Company does not exercise a significant influence, or which are immaterial, are classified as available-for-sale. Available-for-sale investments that do not have quoted market prices in active markets and whose fair values cannot be measured reliably are carried at cost less any provision for diminution in value. Available-for-sale investments that have quoted market prices in active mar-kets and whose fair values can be measured reliably are carried at fair value.
In accordance with the revised IAS 39 “Financial Instruments”, unrealized gains and losses arising from the changes in the fair value of securities classified as available-for-sale are deferred in the equity until the financial asset is sold, collected or otherwise disposed of. When available-for-sale securities are sold, collected or otherwise disposed of, related deferred gains and losses in equity are released to the income statement.
SASA POLYESTER SANAYİ A.Ş.NOTES TO THE FINANCIAL STATEMENTS FOR THE YEAR ENDED 31 DECEMBER 2012(Amounts expressed in thousands of Turkish Lira (“TL”) unless otherwise steted.)
SASA POLYESTER SANAYİ A.Ş.NOTES TO THE FINANCIAL STATEMENTS FOR THE YEAR ENDED 31 DECEMBER 2012(Amounts expressed in thousands of Turkish Lira (“TL”) unless otherwise steted.)

SASA POLYESTER SAN. A.Ş. 2012 ANNUAL REPORT- 23
NOTE 2 - BASIS OF PRESENTATION OF FINANCIAL STATEMENTS (cont’d)
2.8 Significant Accounting Estimations and Decisions (cont’d)
Financial Instruments (cont’d)
Receivables
Trade receivables, and other receivables that have fixed or determinable payments that are not quoted in an active market are classified as ‘receivables’. Receivables are measured at amortized cost using the effective interest method less any impairment.
Borrowings
Borrowings are recognized initially at the proceeds received, net of transaction costs incurred. Borrowings are subse-quently stated at amortized cost using the effective yield method. Any difference between proceeds, net of transaction costs, and the redemption value is recognized in the income statement as financial expense over the period of the borrowings. International Accounting Standard No 23 “Borrowing Costs” was revised on 29 March 2007 by the IASB. The revised IAS 23 is effective from 1 January 2009, yet voluntary early transition to the application right is reserved. The Com-pany opted for early adoption and changed its accounting policy, choosing the policy envisaged in IAS 23 related to borrowing costs at 1 January 2007. Borrowing costs that are directly attributable to the acquisition, construction or pro-duction of a qualifying asset are capitalized as part of the cost of that asset in the period in which the asset is prepared for its intended use or sale. All other borrowing costs are charged to the income statement when they are incurred (Note 5).
Impairment of financial assets
Financial assets are reviewed for indicators of impairment at each balance sheet date. Financial assets are impaired where there is objective evidence that, as a result of one or more events that occurred after the initial recognition of the financial asset, the estimated future cash flows of the investment have been impacted. For financial assets carried at amortized cost, the amount of the impairment is the difference between the asset’s carrying amount and the present value of estimated future cash flows, discounted at the original effective interest rate.
The carrying amount of the financial asset is reduced by the impairment loss directly for all financial assets with the exception of trade receivables where the carrying amount is reduced through the use of an allowance account. When a trade receivable is uncollectible, it is written off against the allowance account. Subsequent recoveries of amounts previ-ously written off are credited against the allowance account. Changes in the carrying amount of the allowance account are recognized in profit or loss.
With the exception of AFS equity instruments, if, in a subsequent period, the amount of the impairment loss decreases and the decrease can be related objectively to an event occurring after the impairment was recognized, the previously recognized impairment loss is reversed through profit or loss to the extent that the carrying amount of the investment at the date the impairment is reversed does not exceed what the amortized cost would have been had the impairment not been recognized.
NOTE 2 - BASIS OF PRESENTATION OF FINANCIAL STATEMENTS (cont’d)
2.8. Significant Accounting Estimations and Decisions (cont’d)
Financial Instruments (cont’d)
Cash and cash equivalents
Cash and cash equivalents comprise cash on hand and demand deposits and other short-term highly liquid investments which their maturities are three months or less from date of acquisition and readily convertible to a known amount of cash and are subject to an insignificant risk of changes in value.
Monetary assets
The fair values of balances denominated in foreign currencies, which are translated at year-end exchange rates, are con-sidered to approximate carrying value. The fair values of cash and due from banks are considered to approximate their respective carrying values due to their short-term nature. The carrying values of trade receivables are estimated to be their fair values due to the elimination of the credit finance income.
Financial liabilities
Financial liabilities and equity instruments issued by the Company are classified according to the substance of the con-tractual arrangements entered into and the definitions of a financial liability and an equity instrument. An equity instru-ment is any contract that evidences a residual interest in the assets of the Company after deducting all of its liabilities. The accounting policies adopted for specific financial liabilities and equity instruments are set out below.
Financial liabilities are classified as either financial liabilities at FVTPL or other financial liabilities.
Financial liabilities at FVTPL
Financial liabilities are classified as at FVTPL where the financial liability is either held for trading or it is designated as at FVTPL. Financial liabilities at FVTPL are stated at fair value, with any resultant gain or loss recognized in profit or loss. The net gain or loss recognized in profit or loss incorporates any interest paid on the financial liability.
Monetary liabilities
Fair value of bank loans and other monetary liabilities approximates to their carrying amount since they are short term liabilities. Fair value of items denominated in foreign currencies and translated at the rates prevailing at the balance sheet date approximates to their carrying amount.
SASA POLYESTER SANAYİ A.Ş.NOTES TO THE FINANCIAL STATEMENTS FOR THE YEAR ENDED 31 DECEMBER 2012(Amounts expressed in thousands of Turkish Lira (“TL”) unless otherwise steted.)
SASA POLYESTER SANAYİ A.Ş.NOTES TO THE FINANCIAL STATEMENTS FOR THE YEAR ENDED 31 DECEMBER 2012(Amounts expressed in thousands of Turkish Lira (“TL”) unless otherwise steted.)

SASA POLYESTER SAN. A.Ş. 2012 ANNUAL REPORT- 25
NOTE 2 - BASIS OF PRESENTATION OF FINANCIAL STATEMENTS (cont’d)
2.8. Significant Accounting Estimations and Decisions (cont’d)
Foreign Currency Transactions and Translation
The Company’s financial statements are presented in the currency of primary economic environment (its functional cur-rency) in which it operates. The Company’s financial condition and operating results, the Company’s functional currency and presentation currency for financial statements are expressed in TL.
During the preparation of financial statements, transactions on foreign currency (currencies other than TL) are recorded on the base of currencies on transaction date. Monetary assets and liabilities denominated in foreign currencies on balance sheet translated into Turkish Lira using exchange rates prevailing on the balance sheet date. None-monetary items carried at fair value that is being monitored are denominated in foreign currency, are retranslated into TL at the rates prevailing on the date fair value determined. None-monetary items measured in terms of historical cost in a foreign currency are not retranslated.
Exchange differences, except as specified below, are recognized in profit or loss in the period in which:
•Foreignexchangegain/lossesrelatedtoassetsunderconstructionforfutureproductiveuse,andincludedasan adjustment to interest costs and added on cost of those assets,
•Hedgingtransactionforeigncurrencyrisks(hedgingaccountingpoliciesaredescribedbelow),
•Foreignexchangedifferencesformingpartoftheforeignoperationnetinvestment,accountedunderreserves,associated with profit or loss on sale of the net investment, arising from international activity debt and receivables with-out intention or possibility of any payment
The Company’s assets and liabilities of foreign operations are expressed in TRY using exchange rates prevailing on the balance sheet in the financial statements. Income and expense items, unless exchange rates fluctuates significantly at the dates of the transactions in the period (in case of major fluctuations, exchange rates at the transaction date is used) , are translated using average exchange rates during the period. Exchange differences are recognized in other compre-hensive income and accumulated equity in a separate component.
Earnings per Share
Earnings per share disclosed in the accompanying statement of income are determined by dividing net income by the weighted average number of shares in existence during the period concerned. In Turkey, companies can increase their share capital by making a pro-rata distribution of shares (“bonus shares”) to existing shareholders from retained earnings. For the purpose of earnings per share computations, the weighted average number of shares outstanding during the year has been adjusted in respect of bonus shares issued without a corresponding change in resources, by giving them a retroactive effect for the period in which they were issued and each previous year.
NOTE 2 - BASIS OF PRESENTATION OF FINANCIAL STATEMENTS (cont’d)
2.8. Significant Accounting Estimations and Decisions (cont’d)
Provisions, Contingent Assets and Liabilities
Provisions are recognized when the Company has a present legal or constructive obligation as a result of past events and it is probable that an outflow of resources will be required to settle the obligation and a reliable estimate of the amount can be made.
A possible obligation or asset that arises from past events and whose existence will be confirmed only by the occurrence or non-occurrence of one or more uncertain future events not wholly within the control of the Company have not been recognized in the accompanying financial statements and treated as contingent liabilities and contingent assets.
Government Grants
Government incentives are not reflected in the financial statements; without the business fulfillment of the necessary conditions for obtaining that incentive which will and a reasonable assurance that they shall be obtained.
Government grants, intended to meet the costs of these incentives are reflected as an expense in profit or loss in a systematic manner throughout the periods. The government grants as a financing tool, rather than being accounted as a net off item profit or loss, should be associated with the statement of financial position (balance sheet) as unearned income, should be reflected in a systematic manner in profit or loss during the economic life of the related assets.
Government incentives given in order to meet expenses or losses previously realized and to provide emergency finan-cial support without any cost in the future are recognized in profit or loss when it becomes livable.
Loans obtained from the state lower than market interest rate, is considered to be government grants. Benefit from lower interest rates is calculated as the difference between the initial carrying amount and the gains of the loan during the period.
The Company benefits from research and development (“R&D”) grants within the scope of the Communiqué No: 98/10 of The Scientific and Technological Research Council of Turkey (“TÜBİTAK”) and Money Credit and Coordination Board related to R&D grants for its research and development projects given that such projects satisfy specific criteria with respect to the evaluation of TÜBİTAK Technology Monitoring and Evaluation Board.
The government grants are recognized when there is reasonable assurance that the Company will comply with the con-ditions attached to them and that the grants will be received. The portion of government grants associated to previously capitalize intangible assets is deducted from the cost of the intangible asset, whereas the other government grants are recognized as income in the period which they are incurred.
SASA POLYESTER SANAYİ A.Ş.NOTES TO THE FINANCIAL STATEMENTS FOR THE YEAR ENDED 31 DECEMBER 2012(Amounts expressed in thousands of Turkish Lira (“TL”) unless otherwise steted.)
SASA POLYESTER SANAYİ A.Ş.NOTES TO THE FINANCIAL STATEMENTS FOR THE YEAR ENDED 31 DECEMBER 2012(Amounts expressed in thousands of Turkish Lira (“TL”) unless otherwise steted.)

SASA POLYESTER SAN. A.Ş. 2012 ANNUAL REPORT- 27
NOTE 2 - BASIS OF PRESENTATION OF FINANCIAL STATEMENTS (cont’d)
2.8. Significant Accounting Estimations and Decisions (cont’d)
Investment Property
Land and buildings that are held to earn rentals or for capital appreciation or both rather than for use in the production or supply of goods or services or for administrative purposes or sale in the ordinary course of business are classified as investment property and carried at cost less accumulated depreciation (except land) under the cost method. The cost of a self-constructed investment property is determined as its cost at the date when the construction or development is complete. On that date the subject asset qualifies as an investment property and thus transferred to investment proper-ties class. The useful life estimation for the buildings within investment properties is between 18-25 years.
Provision for Employment Termination Benefits
Provision for severance
Under the Turkish law and union agreements, lump sum payments are made to employees in retiring or involuntarily leaving the Company. Such payments are considered as being part of defined retirement benefit plan as per Interna-tional Accounting Standard No: 19 (revised) “Employee Benefits” (“IAS 19”).
The retirement benefit liability recognized in the balance sheet represents the present value of the defined benefit obligation as adjusted for unrecognized actuarial gains and losses. All actuarial gains and losses are reflected in the statement of income.
Taxation and Deferred Taxes
Tax expense consists of total current tax and deferred tax benefit / (expense).
Current tax
The tax currently payable is based on taxable profit for the year. Taxable profit differs from profit as reported in the income statement because it excludes items of income or expense that are taxable or deductible in other years and it further excludes items that are never taxable or deductible. The Company’s liability for current tax is calculated using tax rates that have been enacted or substantively enacted by the balance sheet date.
Deferred Taxes
Deferred tax is recognized on differences between the carrying amounts of assets and liabilities in the financial state-ments and the corresponding tax bases which is used in the computation of taxable profit, and is accounted for using the balance sheet liability method. Deferred tax liabilities are generally recognized for all taxable temporary differences and deferred tax assets are recognized for all deductible temporary differences to the extent that it is probable that tax-able profits will be available against which those deductible temporary differences can be utilized. Such deferred tax assets and liabilities are not recognized if the temporary difference arises from goodwill or from the initial recognition (other than in a business combination) of other assets and liabilities in a transaction that affects neither the taxable profit nor the accounting profit.
NOTE 2 - BASIS OF PRESENTATION OF FINANCIAL STATEMENTS (cont’d)
2.8. Summary of Significant Accounting Estimations and Decisions (cont’d)
Taxation and deferred taxes (cont’d)
Deferred Taxes (cont’d)
Deferred tax liabilities are recognized for taxable temporary differences associated with investments in subsidiaries and associates, and interests in joint ventures, except where the Company is able to control the reversal of the temporary difference and it is probable that the temporary difference will not reverse in the foreseeable future. Deferred tax assets arising from deductible temporary differences associated with such investments and interests are only recognized to the extent that it is probable that there will be sufficient taxable profits against which to utilize the benefits of the temporary differences and they are expected to reverse in the foreseeable future.
The carrying amount of deferred tax assets is reviewed at each balance sheet date and reduced to the extent that it is no longer probable that sufficient taxable profits will be available to allow all or part of the asset to be recovered.
Deferred tax assets and liabilities are measured at the tax rates that are expected to apply in the period in which the li-ability is settled or the asset realized, based on tax rates (and tax laws) that have been enacted or substantively enacted by the balance sheet date. The measurement of deferred tax liabilities and assets reflects the tax consequences that would follow from the manner in which the Company expects, at the reporting date, to recover or settle the carrying amount of its assets and liabilities.
Deferred tax assets and liabilities are offset when there is a legally enforceable right to set off current tax assets against current tax liabilities and when they relate to income taxes levied by the same taxation authority and the Company intends to settle its current tax assets and liabilities on a net basis.
Current and deferred tax for the year
The current tax or the deferred tax for the current year is accounted as expense or income under the income table.
Share Capital and Dividends
Ordinary shares are classified as equity. Dividends on ordinary shares are recognized in equity by deducting from re-tained earnings in the year in which they are declared.
Restricted Reserves
Restricted reserves are allocated from profit of previous year due to obligation arising from law or the Company’s articles or objects excluding profit distribution (etc. tax advantage for gain on sale of subsidiaries). These reserves are carried at their statutory amounts.
SASA POLYESTER SANAYİ A.Ş.NOTES TO THE FINANCIAL STATEMENTS FOR THE YEAR ENDED 31 DECEMBER 2012(Amounts expressed in thousands of Turkish Lira (“TL”) unless otherwise steted.)
SASA POLYESTER SANAYİ A.Ş.NOTES TO THE FINANCIAL STATEMENTS FOR THE YEAR ENDED 31 DECEMBER 2012(Amounts expressed in thousands of Turkish Lira (“TL”) unless otherwise steted.)

SASA POLYESTER SAN. A.Ş. 2012 ANNUAL REPORT- 29
NOTE 3 - CASH AND CASH EQUIVALENTS
31 December 2012 31 December 2011
Cash in hand 3 2
Banks -demand deposits 3.782 1.571
3.785 1.573
SASA POLYESTER SANAYİ A.Ş.NOTES TO THE FINANCIAL STATEMENTS FOR THE YEAR ENDED 31 DECEMBER 2012(Amounts expressed in thousands of Turkish Lira (“TL”) unless otherwise steted.)
SASA POLYESTER SANAYİ A.Ş.NOTES TO THE FINANCIAL STATEMENTS FOR THE YEAR ENDED 31 DECEMBER 2012(Amounts expressed in thousands of Turkish Lira (“TL”) unless otherwise steted.)
NOTE 4 - FİNANCIAL ASSETS
Available for sale financial assets
31 December 2012 31 December 2011
TL Amount % TL Amount %
"Bimsa Uluslararası İş, Bilgi ve Yön.Sist.A.Ş. (“Bimsa”)"
1.484 10,00 1.484 10,00
1.484 1.484
Diminishment in value of Bimsa (1.044) (1.044)
440 440
The affiliate amounts for Bimsa are calculated from the acquisition costs and the affiliate rates are calculated from the nominal amounts.
The Company has sold all shares of Bimsa to Sabanci Holding in 11 January 2013.
NOTE 5 - BORROWINGS
Short term borrowings
31 December 2012 31 December 2011
Türkiye İhracat Kredi Bankası A.Ş. 98.721 -
Türkiye İş Bankası A.Ş. 94.624 4.203
Türkiye Garanti Bankası A.Ş. 44.034 21.199
Garantibank International N.V. 34.116 -
Yapı ve Kredi Bankası A.Ş. 10.000 -
Türkiye Vakıflar Bankası T.A.O. 1 58.021
Türkiye Halk Bankası A.Ş. - 10.590
Akbank T.A.Ş. - 30.148
281.496 124.161
Short-term finance lease payables 109 899
Short term borrowings 281.605 125.060
Long term borrowings
31 December 2012 31 December 2011
Akbank T.A.Ş. - 4.250
- 4.250
Long-term finance lease payable - 113
Long term borrowings - 4.363

SASA POLYESTER SAN. A.Ş. 2012 ANNUAL REPORT- 31
NOTE 5- BORROWINGS (cond’t)
Foreign currency denominated bank borrowings and corresponding interest expense accruals as at 31December 2012 and 31 December 2011 are as follows:
Principal 31 December 2012 31 December 2011
Original Currency
Weighted Average Effective Interest
RatesOriginal Amount TL
Weighted Average Effective
Interest RatesOriginal Amount TL
TL 10,47 - 149.221 12,04 - 64.214
ABD Doları 1,51 63.000.000 112.304 4,28 32.250.000 60.917
Euro 1,55 6.500.000 15.286 - - -
276.811 125.131
Accrued interest
TL - 4.682 - 1.940
Euro 110 - - -
ABD Doları 1.472 3 709.317 1.340
281.496 128.411
Financial lease payables
The Company’s lease payables due to financial leasing agreements signed with Group Company Ak Finansal Kiralama A.Ş. (Note 24) are as follows:
31 December 2012 31 December 2011
Up to 1 year 109 899
1 -5 years - 113
109 1.012
The Company’s all financial lease payables typify Euro with maturity period does not exceed five years. Bank borro-wings and financial lease payables with maturities of less than one year are classified under “Short Term Liabilities”, financial lease payables with maturates of more than one year are classified under “Long Term Liabilities”.
As of balance sheet date, net book value of financial lease payables is TL 86 (31 December 2011: TL 764).
Relating to financial leasing interest rate is fixed for the entire financial leasing period at contract date. Contract avera-ge effective annual interest rate is 7, 14% (31 December 2011: 7, 14%).
NOTE 6 – TRADE RECEIVABLES AND TRADE PAYABLES
Trade Receivables
31 December 2012 31 December 2011
Trade receivables 147.230 131.375
Cheques received (*) 59.768 47.272
Due from related parties (Note 24) 6 875
Unearned credit finance income (666) (1.329)
Provision for doubtful receivables (3.033) (2.432)
203.305 175.761
(*)Cheques received constitute the cheques obtained from customers and kept in portfolio as a result of trade activities and consist of TL 39.637 with maturities of more than three months (31 December 2011: TL 38.863).
Non-current receivables
Trade Receivables 31 December 2012 31 December 2011
Trade Receivables 106 268
106 268
As of December 31, 2012 trade receivables are discounted by 0,80% for TL, 0,17% for USD, 0,14% for EUR.(As of December 31,2011 1,00% for TL, 0,36% for USD, 0,44% for EUR).
As of December 31, 2012 and 2011, past due but not provisioned trade receivables as follows:
Overdue Period 31 December 2012 31 December 2011
0 - 1 month 10.729 11.536
1 - 3 months 510 1.192
Over 3 months 173 1.439
Total 11.412 14.167
As of 31 December 2012 and 31 December 2011, due to existence of receivable insurance, bank guarantee, mortgage and other guarantees (i.e. cheques), the Company has not recorded any provision relation to trade receivables that were past due but not impaired.
SASA POLYESTER SANAYİ A.Ş.NOTES TO THE FINANCIAL STATEMENTS FOR THE YEAR ENDED 31 DECEMBER 2012(Amounts expressed in thousands of Turkish Lira (“TL”) unless otherwise steted.)
SASA POLYESTER SANAYİ A.Ş.NOTES TO THE FINANCIAL STATEMENTS FOR THE YEAR ENDED 31 DECEMBER 2012(Amounts expressed in thousands of Turkish Lira (“TL”) unless otherwise steted.)

SASA POLYESTER SAN. A.Ş. 2012 ANNUAL REPORT- 33
NOTE 6 – TRADE RECEIVABLES AND TRADE PAYABLES (cont’d)
The movements of the provision for doubtful receivables during the period are as follows:
Overdue Period 31 December 2012 31 December 2011
Over 6 months 3.033 2.432
Total 3.033 2.432
The movements of the provision for doubtful receivables during the period are as follows:
1 January 2012- 31 December 2012
1 January 2011- 31 December 2011
Balance at 1 January (2.432) (1.728)
Provision released (601) (704)
Balance at 31 December (3.033) (2.432)
Trade Payables 31 December 2012 31 December 2011
Trade payables 106.605 166.808
Due to related parties (Note: 24) 12.257 7.260
Less: unincurred credit finance expense(-) (123) (1.421)
118.739 172.647
As of December 31, 2012 trade payables are discounted by 0,80% for TL, 0,17% for USD, 0,14% for EUR.(As of December 31,2011 1,00% for TL, 0,36% for USD, 0,44% for EUR).
Average credit terms for trade receivables and trade payables are 59 days and 65 days, respectively (31 December 2011: 46 days and 82 days respectively).
NOTE 7 – OTHER RECEIVABLES AND PAYABLES
Other Receivables
31 December 2012 31 December 2011
Value Added Tax (“VAT”) 6.850 -
Miscellaneous receivables 1.883 429
Deferred special consumption tax 860 1.646
VAT return claimed on export deliveries 348 230
Due from related parties (Note 24) - 15.431
VAT return claimed subject to VAT rate reduction 2.205 3.201
12.146 20.937
Other non-current receivables
31 December 2012 31 December 2011
Other 36 -
36 -
Other payables
31 December 2012 31 December 2011
Installment tax payable (*) 7.309 7.309
Advances received from customers 2.691 750
Social security and taxes payable 2.510 2.592
Cancellation of PCT 1.611 429
Due to personnel 685 754
Cancellation of VAT 654 1.215
Due to related party (Note 24) 22 39
Other 1.150 401
16.632 13.489
SASA POLYESTER SANAYİ A.Ş.NOTES TO THE FINANCIAL STATEMENTS FOR THE YEAR ENDED 31 DECEMBER 2012(Amounts expressed in thousands of Turkish Lira (“TL”) unless otherwise steted.)
SASA POLYESTER SANAYİ A.Ş.NOTES TO THE FINANCIAL STATEMENTS FOR THE YEAR ENDED 31 DECEMBER 2012(Amounts expressed in thousands of Turkish Lira (“TL”) unless otherwise steted.)

SASA POLYESTER SAN. A.Ş. 2012 ANNUAL REPORT- 35
NOTE 7 – OTHER RECEIVABLES AND PAYABLES (cont’d)
Other Non-Current Liabilities 31 December 2012 31 December 2011
Installments of tax debts connected (*) 2.436 9.745
Other non-current liabilities 133 531
2.569 10.276
(*) In order to eliminate tax risks, Company discontinued lawsuits opened for the abolition of tax bills as a result of the tax inspection conducted by the Ministry of Finance, in order to benefit from the provisions of Law no 6111 “Restructu-ring of Certain Receivables and Amendment of Social Insurance and General Health Insurance Law and Other Certain Laws and Decrees”. on April 7, 2011 and has applied the tax office.
The total amount payable as a result of the inspection made by the tax office, TL 32 417 for the tax imposed in 2007; 12.715 TL for 44.823 TL of penalty, as a result of the tax investigation in 2010 TL 12.497 and for TL 18.746 penalty im-posed TL 9.212, calculated as a total of TL 21.927. Company will pay 18 equal installments beginning from June 2011 within 36 months and has already paid TL 12.182 of TL 21.927 as of the reporting date.
TL 792 of TL 21.927 related to the Value Added Tax will be subject to discount. The remaining TL 21.135 was accounted for as expense in the financial statements (Note 19).
NOTE 8 - INVENTORIES
31 December 2012 31 December 2011
Raw materials and supplies (*) 73.330 87.364
Intermediate goods 94.531 71.239
Finished goods 36.858 23.073
Semi-finished goods 2.916 3.288
By-products 4.976 2.573
Other 3.235 3.804
Less:impairment in value of inventories (**) (2.033) (3.578)
213.813 187.763
Movement of provision for impairment of inventories
31 December 2012 31 December 2011
Balance at 1 January (3.578) (3.058)
Charge for the period - (520)
Provisions used 1.545 -
Balance at 31 December (2.033) (3.578)
(*) Impairment has been allocated to finished goods, intermediate goods and other inventories.
NOTE 8 – INVENTORIES (cond’t)
The Company has decreased TL 1.545 for its provision for impairment of inventories TL 3.578 and therefore realized allowance for impairment in current year for TL 2.033. As of 31 December 2012, total inventory accounted with net realizable value is TL 133.422 (31 December 2011: TL 97.890)
For the year ended at 31 December 2012, the aggregate amount of inventories expensed and included in cost of goods sold is TL 761.825 (31 December 2011: TL 626.929).
NOTE 9 - INVESTMENT PROPERTY
The movement schedules of investment properties for the year ended 31 December 2012 and 2011 are as follows:
1 January 2012 Addition Other Transfers Disposal 31 December 2012
Cost:
Land 5 - - - 5
Buildings 3.780 - - - 3.780
3.785 - - - 3.785
Accumulated depreciation
Building 2.176 190 - - 2.366
Net Book Value 1.609 1.419
The Company has leased properties with the net book value of TL 1.419 (31 December 2011: TL 1.609) in the period between 1 January-31 December 2012 to the third parties through lease agreements. The Company has generated rent income of TL 362 (2011: TL 341) throughout the period resulting from these lease agreements (Note 19). The fair value of factory building was carried out according to the discounted cash flow and has been calculated TL 4.180.
1 January 2011 Addition Other Transfers Disposal 31 December 2011
Cost:
Land 5 - - - 5
Buildings 3.780 - - - 3.780
3.785 - - - 3.785
Accumulated depreciation
Building 1.986 190 - - 2.176
Net Book Value 1.799 1.609
The total depreciation for the year ended 31 December 2012 and 2011 is presented in the income accounts in Note 10.
SASA POLYESTER SANAYİ A.Ş.NOTES TO THE FINANCIAL STATEMENTS FOR THE YEAR ENDED 31 DECEMBER 2012(Amounts expressed in thousands of Turkish Lira (“TL”) unless otherwise steted.)
SASA POLYESTER SANAYİ A.Ş.NOTES TO THE FINANCIAL STATEMENTS FOR THE YEAR ENDED 31 DECEMBER 2012(Amounts expressed in thousands of Turkish Lira (“TL”) unless otherwise steted.)

SASA POLYESTER SAN. A.Ş. 2012 ANNUAL REPORT- 37
NOTE 10 – PROPERTY, PLANT AND EQUIPMENT
The movement schedules of property, plant and equipment and related accumulated depreciation for the years ended 31 December 2012 and 2011 are as follows;
1 January 2012 Additions
Transfers from
construction in progress Disposals 31 December 2012
Cost:
Land 13.236 2.151 164 - 15.551
Land Improvements 8.225 - (1) - 8.224
Buildings 65.672 - 375 - 66.047
Machinery and equipment 391.307 1.635 7.345 (54) 400.233
Motor vehicles 1.960 2 3 (60) 1.905
Furniture and fixtures 6.488 409 24 (1.228) 5.693
Construction in progres 10.567 6.409 (8.602) (1.074) 7.300
497.455 10.606 (692) (2.416) 504.953
Accumulated depreciation:
Land İmprovements 5.296 472 11 - 5.779
Buildings 34.827 3.276 218 - 38.321
Machinery and equipment 266.016 15.594 535 (40) 282.105
Motor vehicles 1.927 4 3 (60) 1.874
Furniture and fixtures 5.089 361 4 (1.224) 4.230
313.155 19.707 771 (1.324) 332.309
Net Book Value 184.300 172.644
As of balance sheet date, net book value of financial lease assets is TL 86.
The Company management took into consideration the internal and external sources of information as described in IAS 36 “Impairment of Assets” as impairment indicators and performed an impairment study. The Company made a study to measure the recoverable amount of its tangible assets as at 31 December 2012 using discounted cash flows model with a discount rate of 8,43%. The subject study prepared by the Company management is dependent on the appreciation of new products in the chemicals segment that the Company is capable of producing and has the capacity of producing with its existing machinery and equipment. Additionally, the Company management foresees the increase of the share of specialty products with higher gross profit margins in the textile segment in the future period. The study prepared by discounted cash flow method reflects the forecast and assumptions of Company ma-nagement. Based on the results of this study no impairment loss on the Company’s tangible assets is noted.
NOTE 10 – PROPERTY, PLANT AND EQUIPMENT (cont’d)
1 January 2011 Additions
Transfers from
construction in progress Disposals
31 December 2011
Cost:
Land 13.236 - - - 13.236
Land Improvements 8.225 - - - 8.225
Buildings 62.959 - 2.713 - 65.672
Machinery and equipment 369.593 1.605 20.116 (7) 391.307
Motor vehicles 2.178 5 w - (223) 1.960
Furniture and fixtures 5.984 461 55 (12) 6.488
Construction in progres 6.246 27.581 (23.260) - 10.567
468.421 29.652 (376) (242) 497.455
Accumulated depreciation:
Land İmprovements 4.824 472 - - 5.296
Buildings 31.649 3.178 - - 34.827
Machinery and equipment 251.283 14.738 - (5) 266.016
Motor vehicles 2.135 5 - (213) 1.927
Furniture and fixtures 4.768 333 - (12) 5.089
294.659 18.726 - (230) 313.155
Net Book Value 173.762 184.300
As of 31 December 2011, net book value of financial lease assets is TL 764.
Total depreciation and amortization charges for the 12 month period ended at 31 December 2012 and 2011 and the related income statement accounts are as follows:
SASA POLYESTER SANAYİ A.Ş.NOTES TO THE FINANCIAL STATEMENTS FOR THE YEAR ENDED 31 DECEMBER 2012(Amounts expressed in thousands of Turkish Lira (“TL”) unless otherwise steted.)
SASA POLYESTER SANAYİ A.Ş.NOTES TO THE FINANCIAL STATEMENTS FOR THE YEAR ENDED 31 DECEMBER 2012(Amounts expressed in thousands of Turkish Lira (“TL”) unless otherwise steted.)
1 January - 31 December 2012 1 January -31 December 2011
Cost of production (Note 17) 17,995 17,054
Research expenses (Note 18) 2,025 1,979
General administrative expenses (Note 18) 739 663
Selling, marketing and distribution expenses (Note 18) 557 559
21.316 20.255

SASA POLYESTER SAN. A.Ş. 2012 ANNUAL REPORT- 39
NOTE 11 - INTANGIBLE ASSETS
The movement schedules of intangible assets and related accumulated depreciation for the year ended 31 December 2012 and 2011 are as follows:
1 January 2012 Additions
Transfers from construction
in progress Disposal31 December
2012
Cost
Rights 4.812 562 - - 5.374
Development costs 6.137 - 1.464 - 7.601
10.949 562 1.464 - 12.975
Accumulated amortisation
Rights 4.474 166 - - 4.640
Development costs 2.944 1.253 - - 4.197
7.418 1.419 - - 8.837
Net book value 3.531 4.138
1 January 2011 Additions
Transfers from construction
in progress Disposal31 December
2011
Cost
Rights 4.606 206 - - 4.812
Development costs 5.761 - 376 - 6.137
10.367 206 376 - 10.949
Accumulated amortisation
Rights 4.362 112 - - 4.474
Development costs 1.717 1.227 - - 2.944
6.079 1.339 - - 7.418
Net book value 4.288 3.531
The total amortization for the year ended 31 December 2012 and 2011 is presented in the income accounts in Note 10.
NOTE 12 – PROVISIONS, CONTINGENT ASSETS AND LIABILITIES
31 December 2012 31 December 2011
Provision for restructuring and demand of other receivables (*) 1.076 384
Provision for commissions 1.038 931
Provision for export expenses (**) - 734
Other - 8
2.114 2.057
(*)Provision for restructuring and demand of other receivables are consist of reinstatements lawsuits which were filed by ex-workers against to the Company due to changes of business organizations and possible expenses of other receivables lawsuits. Such lawsuits are pending as of balance sheet date.
(**) Provision for export expenses contains of insurance provision for receivables from foreign sales.
The movement schedules of provision for restructuring expenses for the periods ended 31 December 2012 and 2011 are as follows:
Provision for export expenses
1 January - 31 December 2012
1 January - 31 December 2011
Balance at 1 January 931 496
Charge for the period 11.966 11.116
Provision released (11.859) (10.681)
Balance at 31 December 1.038 931
Provision for restructuring expenses and other receivables
1 January - 31 December 2012
1 January - 31 December 2011
Balance at 1 January 384 601
Charge for the period 869 28
Provision released (177) (245)
Balance at 31 December 1.076 384
SASA POLYESTER SANAYİ A.Ş.NOTES TO THE FINANCIAL STATEMENTS FOR THE YEAR ENDED 31 DECEMBER 2012(Amounts expressed in thousands of Turkish Lira (“TL”) unless otherwise steted.)
SASA POLYESTER SANAYİ A.Ş.NOTES TO THE FINANCIAL STATEMENTS FOR THE YEAR ENDED 31 DECEMBER 2012(Amounts expressed in thousands of Turkish Lira (“TL”) unless otherwise steted.)

SASA POLYESTER SAN. A.Ş. 2012 ANNUAL REPORT- 41
NOTE 14 – EMPLOYEE BENEFITS
Short Term Employee Benefits
31 December 2012 31 December 2011
Unused vacation allowance 1.693 2.067
Premiums for senior management 700 1.100
Provision for employee expenses 163 223
2.556 3.390
Long Term Employee Benefits
31 December 2012 31 December 2011
Provision for employment termination benefits 15.767 14.233
15.767 14.233
Unused Vacation Allowance
Company provides annual pay vacation to each employee who has completed one year of service.
Movements of unused vacation allowances as follows:
1 January 2012- 31 December 2012
1 January 2011- 31 December 2011
Balances of 1 January 2.067 1.885
Charge for the period (Note 19) 79 287
Allowance released (453) (105)
Balance at 31 December 1.693 2.067
Movements of premiums for senior management is as follows:
1 January 2012- 31 December 2012
1 January 2011- 31 December 2011
Balances of 1 January 1.100 -
Charge for the period 700 1.100
Allowance released (1.100) -
Balance at 31 December 700 1.100
Movements in the provision for employee expense are as follows:
1 January 2012- 31 December 2012
1 January 2011- 31 December 2011
Balances of 1 January 223 192
Charge for the period 1.385 2.305
Allowances released (1.445) (2.274)
Balance at 31 December 163 223
31 December 2012 31 December 2011
Notes of guarantees taken 17.292 19.032
Letters of guarantees taken 1.939 2.035
Mortgages taken 234 234
Total 19.465 21.301
31 December 2012 31 December 2011
TL Equivalent TL Euro
TL Equivalent TL Avro
A. CPMs given in the name of its own legal personality 55.488 50.785 2.000.000 42.982 38.094 2.000.000
B. CMP’s given on be half of the fully consolidated companies
- - - - - -
C.CPM’s given on behalf of third parties for ordinary course of the business
- - - - - -
D. Total amount of other CPM’s given
Total amount of CPM’s given on behalf of the majority shareholder
- - - - - -
- Total amount of CPM’s given on behalf of other group companies which are not in scope of B and C
- - - - - -
- C Total amount of CPM’s given on behalf of third parties which are not in scope of C
- - - - - -
Total CPM amount 55.488 50.785 2.000.000 42.982 38.094 2.000.000
As of 31 December 2012 the percentage of the other CPM`s given by the Company to the total equity is 0% (31 December 2011: 0%).
Mortgages and guarantees taken at 31 December 2012 and 31 December 2011 are as follows:
NOTE 13 - COMMITMENTS
Commitments and contingencies, which are not included in the liabilities at 31 December 2012 and 2011, are as follows:
Commitments based on export incentive certificates
31 December 2012 31 December 2011
The total amount of export commitment of documents stored in the document
804.004 667.125
The amounts mentioned include commitments based on export incentive certificates which are presently fulfilled but the closing transactions are not concluded yet
222.254 165.366
Total amount of open export incentives 581.750 445.092
Open export incentives 197.234 94.893
Collaterals,pledges and mortgages’CPM’ given by the Company
SASA POLYESTER SANAYİ A.Ş.NOTES TO THE FINANCIAL STATEMENTS FOR THE YEAR ENDED 31 DECEMBER 2012(Amounts expressed in thousands of Turkish Lira (“TL”) unless otherwise steted.)
SASA POLYESTER SANAYİ A.Ş.NOTES TO THE FINANCIAL STATEMENTS FOR THE YEAR ENDED 31 DECEMBER 2012(Amounts expressed in thousands of Turkish Lira (“TL”) unless otherwise steted.)

SASA POLYESTER SAN. A.Ş. 2012 ANNUAL REPORT- 43
NOTE 14 - EMPLOYEE BENEFITS (cont’d)
Provision for employment termination benefits
There are no agreements for pension commitments other than the legal requirement as explained below.
Under Turkish Labor Law, the Company is required to pay termination benefits to each employee who has completed one year of service and whose employment is terminated without due cause excluding 25/2 article of labor law, is called up for military service or dies. As of 8 September 1999 related labor law was changed and retirement require-ments made gradual. The amount payable consist of one gross wage for each year of service limited to maximum termination indemnity for non-union employees and 47 days gross wage for each year of service limited to maximum termination indemnity for union employees. Same payment is done for days remaining from 1 year.
The liability is not funded, as there is no funding requirement.
The reserve has been calculated by estimating the present value of the future probable obligation of the Company arising from the retirement of the employees.
The Communiqué requires actuarial valuation methods to be developed to estimate the enterprise’s obligation under defined benefit plans. Accordingly following actuarial assumptions were used in the calculation of the total liability.
31 December 2012 31 December 2011
Discount rate (%) 3,73 4,66
Retention rate to estimate the probability of retirement(%) 98 98
Discount rate is derived upon the difference of long-term interest’s rates in TL and the expected inflation rate.
The principal assumption is that maximum liability for each year of service will increase in line with inflation. Thus, the discount rate applied represents the expected real rate after adjusting for the anticipated effects of future inflation. The maximum amount of TL 3, 13 (1 January 2011: TL 2, 81), which is expected to be effective from 1 January 2013, has been taken into consideration in calculating the provision for employment termination benefits of the Company
Movements in the reserve for employment termination benefits are as follows:
1 January 2012- 31 December 2012
1 January 2011- 31 December 2011
Balances of 1 January 14.233 12.745
Charge for the period 5.344 3.785
Payments during the period (5.203) (2.297)
Actuarial loss / (gain) 1.393 -
Balance at 31 December 15.767 14.233
31 December 2012 31 December 2011
Share Capital 216.300 216.300
Inflation adjustment to share capital 196.213 196.213
Restricted reserves 5.356 5.356
Accumulated loss (143.386) (185.496)
Net (loss) / profit for the period (30.809) 42.110
Shareholders'equity 243.674 274.483
NOTE 15 – OTHER ASSETS AND LIABILITIES
Other Current Asset 31 December 2012 31 December 2011
Other prepaid expenses 519 96
519 96
Other Non-Current Asset 31 December 2012 31 December 2011
Deferred VAT 58.910 32.186
Spare parts 12.210 11.120
Prepaid expenses 200 598
71.320 43.904
NOTE 16 – SHAREHOLDERS’ EQUITY
Sasa Polyester Sanayi A.Ş fully paid and issued capital each YKR 1 nominal value of 21.630.000.000 shares (31 December 2011: 21.630.000.000). The shareholders and shareholding structure of the Company at 31 December 2012 and 31 December 2011 are as follows:
31 December 2012 31 December 2011
TL Share% Share% TL
H.Ö. Sabancı Holding A.Ş. 110.313 51 110.313 51
Public Offered 105.987 49 105.987 49
216.300 100 216.300 100
Inflation adjustment to share capital (*) 196.213 196.213
412.513 412.513
(*)Adjustment to share capital represents the restatement effect of cash contributions to share capital at year-end equivalent purc-hasing power after netting of prior year losses.
Shareholders’ equity items of company as at 31 December 2012 and 31 December 2011 prepared in accordance with the Communiqué No: XI-29 are as follows:
SASA POLYESTER SANAYİ A.Ş.NOTES TO THE FINANCIAL STATEMENTS FOR THE YEAR ENDED 31 DECEMBER 2012(Amounts expressed in thousands of Turkish Lira (“TL”) unless otherwise steted.)
SASA POLYESTER SANAYİ A.Ş.NOTES TO THE FINANCIAL STATEMENTS FOR THE YEAR ENDED 31 DECEMBER 2012(Amounts expressed in thousands of Turkish Lira (“TL”) unless otherwise steted.)
SASA POLYESTER SAN. A.Ş. 2012 ANNUAL REPORT- 45
NOTE 16 – SHAREHOLDERS’ EQUITY (cont’d)
The legal reserves consist of first and second reserves, appropriated in accordance with the Turkish Commercial Code (“TCC”). The TCC stipulates that the first legal reserve is appropriated out of statutory profits at the rate of 5% per annum until the total reserve reaches 20% of the Company’s paid-in share capital. The second legal reserve is appropriated at the rate of 10% per annum of all cash distributions in excess of 5% of the paid-in share capital. Under the TCC, the legal reserves can only be used to offset loss and are not available for any other usage unless the loss exceeds 50% of paid-in share capital.
In accordance with the CMB’s requirements which were effective until 1 January 2008, the amount generated from first-time application of inflation adjustments on financial statements, and followed under the “accumulated loss” item was taken into consideration as a reduction in the calculation of profit distribution based on the inflation adjusted financial statements within the scope of the CMB’s regulation issued on profit distribution. The related amount that was followed under the “accumulated loss” item could also be offset against the profit for the period (if any) and undistributed retained earnings and the remaining loss amount could be offset against capital reserves arising from the restatement of extraor-dinary reserves, legal reserves and equity items, respectively.
In addition, in accordance with the CMB’s requirements which were effective until 1 January 2008, at the first-time ap-plication of inflation adjustments on financial statements, equity items, namely “Capital issue premiums”, “Legal reserves”, “Statutory reserves”, “Special reserves” and “Extraordinary reserves” were carried at nominal value in the balance sheet and restatement differences of such items were presented in equity under the “Shareholders’ equity inflation restatement differences” line item in aggregate. “Shareholders’ equity inflation restatement differences” related to all equity items could only be subject to the capital increase by bonus issue or loss deduction, while the carrying value of extraordinary reserves could be subject to the capital increase by bonus issue; cash profit distribution or loss offsetting.
In accordance with the Communiqué No: XI-29 and related announcements of CMB, effective from 1 January 2008, “Share capital”, “Restricted Reserves” and “Share Premiums” shall be carried at their statutory amounts. The valuation dif-ferences as part of IAS/IFRS shall be disclosed as follows:
-if the difference is arising due to the inflation adjustment of “Paid-in Capital” and not yet been transferred to capital should be classified under the “Inflation Adjustment to Share Capital”;
- if the difference is due to the inflation adjustment of “Restricted Reserves” and “Share Premium” and the amount has not been utilized in dividend distribution or capital increase yet, it shall be classified under “Retained Earnings”.
There is no other usage other than the addition of capital adjustment differences to the capital.
NOTE 16 – SHAREHOLDERS’ EQUITY (cont’d)
Profit Distribution:
In accordance with the Capital Markets Board’s (the “Board”) Decree issued on 27 January 2010, in relation to the pro-fit distribution of earnings derived from the operations in 2009, minimum profit distribution is not required for listed companies, and accordingly, profit distribution should be made based on the requirements set out in the Board’s Communiqué Serial:IV, No: 27 “Principles of Dividend Advance Distribution of Companies That Are Subject To The Capital Markets Board Regulations”, terms of articles of corporations and profit distribution policies publicly disclosed by the companies.
Furthermore, based on the afore-mentioned decree, companies that are required to prepare consolidated financial statements should calculate their net distributable profits, to the extent that they can be recovered from equity in their statutory records, by considering the net profit for the period in the consolidated financial statements which are prepa-red and disclosed in accordance with the Communiqué Serial: XI, No: 29.
NOTE 17 – SALES AND COST OF SALES
Sales Revenues
1 January- 31 December 2012 1 January- 31 December 2011
Domestic sales 649.452 560.665
Foreign sales 342.637 335.985
Other sales 12.499 11.543
Sales returns (2.910) (1.272)
Sales discounts (1.644) (1.660)
Other discounts (56) (679)
Sales Revenues(net) 999.978 904.582
SASA POLYESTER SANAYİ A.Ş.NOTES TO THE FINANCIAL STATEMENTS FOR THE YEAR ENDED 31 DECEMBER 2012(Amounts expressed in thousands of Turkish Lira (“TL”) unless otherwise steted.)
SASA POLYESTER SANAYİ A.Ş.NOTES TO THE FINANCIAL STATEMENTS FOR THE YEAR ENDED 31 DECEMBER 2012(Amounts expressed in thousands of Turkish Lira (“TL”) unless otherwise steted.)

SASA POLYESTER SAN. A.Ş. 2012 ANNUAL REPORT- 47
NOTE 17 – SALES AND COST OF SALES (cont’d)
Cost of Sales
1 January - 31 December 2012 1 January- 31 December 2011
Dirct first raw material and supplies expenses 782.461 656.269
Energy expenses 94.218 73.250
Labour expenses 50.135 42.333
Other variable expenses 15.251 12.972
Amortization 14.288 13.341
Spare parts and maintenance expenses 6.539 6.114
Insurance expense 969 766
Usage of semi-finished goods 524 (1.515)
Other fixed expenses 198 181
Production cost for the year 964.583 803.711
Cost of waste goods sold 15.145 13.549
Cost adjustment to unrealised sales 884 (10.832)
Other idle time expenses 5.046 5.517
Idle time type amortisation 3.707 3.713
Provision for impairment inventories -net (1.545) 520
Stock count differences (578) (1.360)
Usage of finished and semi-finished goods (35.066) (29.702)
Cost of goods sold during the year 952.176 785.116
NOTE 18 – OPEATING EXPENSES
Selling, Marketing and Distribution Expenses
1 January-31 December 2012 1 January-31 December 2011
Export expenses 26.028 21.752
Personnel expenses 5.064 3.450
Insurance expenses 1.764 1.801
Taxes and duties 1.023 1.214
Energy expenses 685 624
Amortization (Note 10) 557 559
Rent expenses 41 1.333
Other 1.049 749
36.211 31.482
General Administrative Expenses
1 January- 31 December 2012 1 January-31 December 2011
Personnel expenses 9.813 8.425
Seniority notice indemnity 2.828 722
Consultancy expenses 1.485 1.277
Amortization (Note 10) 739 663
Insurance expences 485 372
Supplies, repair and maintenance expenses 392 602
Energy expences 257 219
Auxiliary service expenses 213 133
Other 1.471 1.520
17.683 13.933
Research and Development Expenses
1 January- 31 December 2012 1 January-31 December 2011
Amortization (Note 10) 2.025 1.979
Unsuccessful project expenses 1.074 -
Labour and personnel expenses 183 83
Other 168 168
3.450 2.230
SASA POLYESTER SANAYİ A.Ş.NOTES TO THE FINANCIAL STATEMENTS FOR THE YEAR ENDED 31 DECEMBER 2012(Amounts expressed in thousands of Turkish Lira (“TL”) unless otherwise steted.)
SASA POLYESTER SANAYİ A.Ş.NOTES TO THE FINANCIAL STATEMENTS FOR THE YEAR ENDED 31 DECEMBER 2012(Amounts expressed in thousands of Turkish Lira (“TL”) unless otherwise steted.)
SASA POLYESTER SAN. A.Ş. 2012 ANNUAL REPORT- 49
NOTE 19 - OTHER OPERATING INCOME/EXPENSES
Other operating income
1 January- 31 December 2012
1 January- 31 December 2011
Miscellaneous sales income 23.788 19.455
Provision of closed requests for restructuring and other receivables 1.403 941
Rent income 362 341
Insurance compensation income 147 37
Fixed asset sales income 48 84
Other 603 406
26.351 21.264
Ohter operating expenses
1 January - 31 December 2012
1 January- 31 December 2011
Miscellaneous sales expense 20.300 14.758
Taxes and duties paid 996 1.360
Provision for restructuring expenses 1.076 28
Premiums for senior management (Note 14) 700 1.100
Allowance for doubtful receivables (Dipnot 6) 601 704
Provision for unused vacation (Note 14) 79 287
Provision for legal cases (Note 7) - 21.135
Fixed asset sales loss 12 -
Other 1.051 2.462
24.815 41.834
NOTE 20 - FINANCIAL INCOME
1 January- 31 December 2012
1 January- 31 December 2011
Foreign exchange income 21.592 45.794
Interest income 1.148 1.474
22.740 47.268
NOTE 21 - FINANCIAL EXPENSES
1 January- 31 December 2012
1 January- 31 December 2011
Foreign exchange losses 26.998 46.320
Interest expense 18.714 11.201
45.712 57.521
NOTE 22 - TAX ASSETS AND LIABILITIES
Deferred income taxes
The Company recognizes deferred income tax assets and liabilities based upon temporary differences arising between their financial statements as reported under CMB Accounting Standards and their statutory tax financial statements. These differences usually result in the recognition of revenue and expenses in different reporting periods for Interna-tional Financial Reporting Standards and tax purposes.
The composition of cumulative temporary differences and the related deferred income tax assets and liabilities in re-spect of items for which deferred income tax has been provided at 31 December 2012 and 31 December 2011 using the enacted tax rates are as follows:
Cummulative temporary difference
Deffered income tax asset/ (liabilities)
31 December 2012
31 December 2011
31 December 2012
31 December 2011
Accumulated financial loss (83.529) (52.272) 16.706 10.454
Restatement and depreciation/
amortization difference 27.329 28.648 (5.466) (5.730)
Retirement pay provision (15.767) (14.233) 3.153 2.847
Net difference between the tax base and carrying value of inventories
(3.939) (7.268) 788 1.454
Adjustment for unrealized sales (1.364) (992) 273 198
Provision for accumulated unpaid vacation provision
(1.693) (2.067) 339 413
Net difference between the tax base and the carrying value of assets held for investment
(101) 19 20 (4)
Adjustment for not accrued financial expenses
123 1.421 (25) (284)
Adjustment for not accrued financial income (666) (1.329) 133 266
Other (3.850) (3.280) 770 656
Deferred income tax assets 22.182 16.288
Deferred income tax liabilities (5.491) (6.018)
Provision for deferred tax asset recognised from carry forward (*) (16.706) (10.454)
Deferred income tax liabilities,net (15) (184)
(*)The portable financial losses’ reduction from taxable income of the part that cannot exceed the prescribed time period evaluated through the accountings precautionary principle according to the Entity’s possibility of creating high degree of financial harm to through using high amount of financial losses and creating deferred tax income. No deferred tax asset has been recognized from carry forward tax losses due to the unpredictedability of future profit streams. However, deferred tax has recognized for the items that are subject to tax base such as severance benefits and inventories without being subject to a certain time comparison.
SASA POLYESTER SANAYİ A.Ş.NOTES TO THE FINANCIAL STATEMENTS FOR THE YEAR ENDED 31 DECEMBER 2012(Amounts expressed in thousands of Turkish Lira (“TL”) unless otherwise steted.)
SASA POLYESTER SANAYİ A.Ş.NOTES TO THE FINANCIAL STATEMENTS FOR THE YEAR ENDED 31 DECEMBER 2012(Amounts expressed in thousands of Turkish Lira (“TL”) unless otherwise steted.)
SASA POLYESTER SAN. A.Ş. 2012 ANNUAL REPORT- 51
NOTE 22 - TAX ASSETS AND LIABILITIES (cont’d)
Deferred income tax asset
31 December 2012 31 December 2011
Deferred income tax asset to be recovered after more than a year 3.492 3.260
Deferred income tax asset to be recovered within one year 1.984 2.574
5.476 5.834
Deferred tax liabilities
31 December 2012 31 December 2011
Deferred income tax asset to be recovered after more than a year 5.466 5.734
Deferred income tax asset to be recovered within one year 25 284
5.491 6.018
Movements in deferred taxes can be analyzed as follows:
1 Ocak - 31 December 2012
1 Ocak - 31 December 2011
Balance at 1 Januar (184) (1.296)
Change for the year 169 1112
Balance at 31 December (15) (184)
Total charge for the period can be reconciled to the accounting profit as follows:
31 December 2012 31 December 2011
(Loss) / Profit before tax from operations (30.978) 40.998
Expected taxation(20%) 6.196 (8.200)
Tax effects of:
- Revenue that is exempt from taxation 311 315
- Expenses that are not deductible in determining taxable profit (81) (4.062)
- Effect of prior period income tax offset form prior period loses - 12.913
- Unused tax losses not accounted as deferred tax asse (6.252) -
- Other adjustment (5) 146
Income tax recognized in profit/(loss) 169 1.112
NOTE 22 - TAX ASSETS AND LIABILITIES (cont’d)
Deferred tax assets are recognized for tax losses carried forward to the extent that the realization of the related tax benefits through future taxable profits is probable. The Company did not recognize deferred tax assets of TL 83.529 (31 December 2011: TL 52.272) in respect of losses, which are summarized as follows
Corporate Income Tax Law has been changed with the law numbered 5520 which was published at 13 June 2006. Most of the rules of the new Corporate Income Tax Law are applicable from 1 January 2006 According to this; corporate tax rate applicable for the year 2012 is 20% (2011: 20%).
Corporate tax rate is applied to the taxable profit which is calculated by adding non-taxable expenses and deducting some exemptions taken place in tax laws (exemptions for participation revenues, exemptions for investment incentives) and discounts (R&D discount) from accounting profit of the Company. No additional taxes are paid unless profit is dis-tributed (except 19, 8% withholding tax paid over used investment incentives according to the GVK temporary article).
The Constitutional Court abolished the provisions of Temporary Article 69 of the Income Tax Law regarding the time limi-tation to the investment allowance in its meeting held on 15 October 2009, and published the minutes of the relevant meeting on its website in October 2009. The decision of the Constitutional Court on the cancellation of the time limita-tion for investment allowance for the years 2006, 2007 and 2008 came into force with its promulgation in the Official Gazette, dated 8 January 2010, and thereby the time limitation regarding investment allowance was removed, however it has also been stated that balance regarding the calculation of the tax bases could not exceed 25% percent of the rel-evant income and the remaining balance after the investment allowance should be subject to 20% of corporate tax. The Company has unutilized carried forward investment allowance amounting to TL 74.430, in which TL 12.729 coming from balance subject to 19,8% withholding tax and the remaining 61.701 subject to no tax (31 December 2011: TL 72.033).
Corporate Tax Law No, 5520 article 10, explains research and development allowance. Research and development allow-ance rate has revised as 100% from the previous %40 by the revision that made on Law No: 5746 article 5. The Law came into force with effective from 1 April 2008.
In accordance with mentioned revision, 100% of research and development expenditures facilities related to technology and information research as of 2008 balance sheet date are deducted from income before tax. Expected research and development allowance of the Company as of 31 December is TL 671.
Dividends paid to non-resident corporations, which have a place of business in Turkey, or resident corporations are not subject to withholding tax. Otherwise, dividends paid are subject to withholding tax at the rate of 15%. An increase in capital via issuing bonus shares is not considered as a profit distribution and thus does not incur withholding tax.
2013 12.860
2014 39.412
2017 31.257
83.529
SASA POLYESTER SANAYİ A.Ş.NOTES TO THE FINANCIAL STATEMENTS FOR THE YEAR ENDED 31 DECEMBER 2012(Amounts expressed in thousands of Turkish Lira (“TL”) unless otherwise steted.)
SASA POLYESTER SANAYİ A.Ş.NOTES TO THE FINANCIAL STATEMENTS FOR THE YEAR ENDED 31 DECEMBER 2012(Amounts expressed in thousands of Turkish Lira (“TL”) unless otherwise steted.)

SASA POLYESTER SAN. A.Ş. 2012 ANNUAL REPORT- 53
1 January- 31 December 2012 1 January- 31 December 2011
Current period tax charge - -
Deferred tax income / (expense) (169) (1.112)
Total tax benefit (169) (1.112)
NOTE 22 - TAX ASSETS AND LIABILITIES (cont’d)
Corporations are required to pay advance corporation tax quarterly at the rate of 20% on their corporate income. Ad-vance tax is payable by the 17th (including the tax statements of March 2007 that Income Tax Law numbered 5615 is effective from 4 April 2007 and the law about the change in some laws) of the second month following each calendar quarter end. Advance tax paid by corporations is credited against the annual corporation tax liability. The balance of the advance tax paid may be refunded or used to set off against other liabilities to the government.
A 75% portion of the gains derived from the sale of preferential rights, usufruct shares and founding shares from invest-ment equity and real property which has remained in assets for more than two full years are exempt from corporate tax. To be entitled to the exemption, the relevant gain is required to be held in a fund account in the liabilities and it must not be withdrawn from the entity for a period of 5 years. The sales consideration has to be collected up until the end of the second calendar year following the year the sale was realized.
Under the Turkish taxation system, tax losses can be carried forward to offset against future taxable income for up to 5 years. Tax losses cannot be carried back to offset profits from previous periods. The aggregate amount of the Company’s carry forward tax losses at 31 December 2012 is TL 83.529 (31 December 2011: TL 52.272).
In Turkey, there is no procedure for a final and definitive agreement on tax assessments. Companies file their tax returns within the 25th of the fourth month following the close of the financial year to tax office which they relate. However, tax returns are open for five years from the beginning of the year that follows the date of filing during which time the tax authorities have the right to audit tax returns, and the related accounting records on which they are based, and may issue re-assessments based on their findings.
Total taxes payable for the years ended 31 December 2012 and 2011 have been reconciled to the current year tax charge as follows:
NOTE 23 – EARNINGS PER SHARE
1 January- 31 December 2012 1 January-31 December 2011
Net (loss)/gain attributable to shareholders (30.809) 42.110
Number of ordinary shares 21.630.000.000 21.630.000.000
Earnings per share in full TL
thousands of ordinary shares (1,42) 1,95
NOTE 24 - RELATED PARTY DISCLOSURES
a) Due from related parties:
31 December 2012
31 December 2011
Group Companies 354 1.105
- Aksigorta A.Ş. (“Aksigorta”) 333 214
- Enerjisa Enerji Üretim A.Ş. (“Enerjisa”) 15 14
- Yünsa Yünlü Sanayi ve Ticaret A.Ş. ("Yünsa") 6 -
- Kordsa Global Endüstriyel İplik ve
Kord Bezi San. Tic. A.Ş. (“Kordsa”) - 875
- Temsa Global Sanayi ve Ticaret A.Ş (“Temsa”) - 2
Total 354 1.105
Receivables from related party adds up to TL 6 (31 December 2011: TL 875) it consists of trade receivable, TL 348 (31 December 2011: TL 230) and other receivables. Related party receivables are without guarantees. No interest is calculated for receivables
SASA POLYESTER SANAYİ A.Ş.NOTES TO THE FINANCIAL STATEMENTS FOR THE YEAR ENDED 31 DECEMBER 2012(Amounts expressed in thousands of Turkish Lira (“TL”) unless otherwise steted.)
SASA POLYESTER SANAYİ A.Ş.NOTES TO THE FINANCIAL STATEMENTS FOR THE YEAR ENDED 31 DECEMBER 2012(Amounts expressed in thousands of Turkish Lira (“TL”) unless otherwise steted.)

SASA POLYESTER SAN. A.Ş. 2012 ANNUAL REPORT- 55
NOTE 24 - RELATED PARTY DISCLOSURES (cont’d)
b) Due to related parties:
31 December 2012
31 December 2012
1) Shareholders 22 39
- Sabancı Holding 22 39
2) Participation 99 144
- Bimsa 99 144
3) Group Companies 12.158 7.116
- Enerjisa 11.318 6.565
- Aksigorta 494 205
- Olmuksa 322 337
- Sabancı Üniversitesi 21 -
- Ak Finansal Kiralama A.Ş. 3 5
- Yünsa - 4
Total 12.279 7.299
As of the report date, 12.257 TL of payables to related parties is trade payables, 22 TL is other payables. (31 December 2011: 7.260 TL trade payables, 39 TL other payables). As of 31 December 2012 average maturity of trade receivables and trade payables to related party, respectively, 55 days and 20 days (31 December 2011: 70 days and 60 days).
c) Bank Deposits:
31 Aralık 2012 31 Aralık 2011
Akbank 1.513 949
d) Lease Payables:
Ak Finansal Kiralama A.Ş. 31 Aralık 2012 31 Aralık 2011
Short term lease payables 109 899
Long term lease payables - 113
Toplam 109 1.012
NOTE 24 - RELATED PARTY DISCLOSURES (cont’d)
e) Loans:
31 December 2012
31 December 2011
Akbank - 34.398
f) Sales to related parties:
1 Ocak - 31 December 2012
Good Service
Shareholders 66 161
- Yünsa 36 -
- Enerjisa - 151
- Temsa - 7
- Kordsa 30 3
Total 66 161
1 Ocak - 31 December 2011
Good Service
1) Shareholders - 64
- Sabancı Holding (*) - 57
- Advansa B.V. (**) - 7
2) Group Companies 6.639 169
- Advansa Marketing Company (**) 4.148 -
- Advansa GMBH (**) 1.668 -
- Yünsa 32 -
- Kordsa 786 11
- Dönkasan 5 -
- Enerjisa - 137
- Temsa - 21
Total 6.639 233
(*) Since the Company was a center in Netherlands and subsidiary of Sabanci Holding subsidiary Advansa BV, Sabanci Holding purchased 11.031.300.118 shares of Advansa Sasa Polyester Sanayi AS (%51) in the nominal value of TL 110 313 001 on 26 May 2011 at a price of 102 million Euro within Advansa BV portfolio.
(*) Sabancı Holding, sold all its share in Holland based Advansa BV to Germany based BBMMR Holding Gmbh in 14th June 2011. Depending on this sale; Advansa BV and its subsidiaries Advansa Marketing Company and Advansa Gmbh cease to be a related party for the Company.
SASA POLYESTER SANAYİ A.Ş.NOTES TO THE FINANCIAL STATEMENTS FOR THE YEAR ENDED 31 DECEMBER 2012(Amounts expressed in thousands of Turkish Lira (“TL”) unless otherwise steted.)
SASA POLYESTER SANAYİ A.Ş.NOTES TO THE FINANCIAL STATEMENTS FOR THE YEAR ENDED 31 DECEMBER 2012(Amounts expressed in thousands of Turkish Lira (“TL”) unless otherwise steted.)

SASA POLYESTER SAN. A.Ş. 2012 ANNUAL REPORT- 57
NOTE 24 - RELATED PARTY DISCLOSURES (cont’d)
g) Purchases from related parties:
1 January - 31 December 2012
Good Service Fixed Assets Rents
1) Shareholders - 80 - 158 - Sabancı Holding (*) - 80 - 158
2) Participation - 663 472 - - Bimsa - 663 472 -
3) Group Companies 1.418 86.970 - -
- Olmuksa 1.418 - - - - Enerjisa - 77.551 - - - Aksigorta - 8.995 - - - Avivasa - 339 - - - Sabancı Üniversitesi - 49 - - - Ak Finansal Kiralama - 24 - - -Akyatırım Menkul Değerler A.Ş. - 12 - -
Total 1.418 87.713 472 158
The Company buys electric and steam from Enerjisa.
1 January - 31 December 2011
Good Service Fixed Assets Rents
1) Shareholders - 116 - 139 - Sabancı Holding (*) - 116 - 139
2) Participation - 520 178 - - Bimsa - 520 178 -
3) Group Companies 1.226 74.324 - -
- Olmuksa 1.220 - - - - Yünsa 4 - - - - Temsa 2 - - - - Enerjisa - 64.958 - - - Aksigorta - 8.099 - - - Advansa Marketing Company (**) - 882 - - - Avivasa - 329 - - - Akyatırım Menkul Değerler A.Ş. - 12 - - - Ak Finansal Kiralama - 31 - - - Çimsa - 8 - - - Sabancı Üniversitesi - 5 - -
Total 1.226 74.960 178 139
NOTE 24 - RELATED PARTY DISCLOSURES (cond’t)
(*) Since the Company was a center in Netherlands and subsidiary of Sabanci Holding subsidiary Advansa BV, Sabanci Holding purchased 11.031.300.118 shares of Advansa Sasa Polyester Sanayi AS (%51) in the nominal value of TL 110 313 001 on 26 May 2011 at a price of 102 million Euro within Advansa BV portfolio.
(*) Sabancı Holding, sold all its share in Holland based Advansa BV to Germany based BBMMR Holding Gmbh in 14th June 2011. Depending on this sale; Advansa BV and its subsidiaries Advansa Marketing Company and Advansa Gmbh cease to be a related party for the Company.
h) Financial income
1 January- 31 December 2012 1 Ocak- 31 December 2011
Akbank 4 433
i) Financial expense:
1 January- 31 December 2012 1 Ocak- 31 December 2011
Akbank 1.804 1.451
j) Remuneration of directors and key management personnel As of 31 December and 2012 remuneration of directors and key management personnel amounts are as follows:
1 January-31 December 2012 1 January-31 December 2011
Short term employee benefits 2.998 3.040
Employment termination benefits 446 -
Total 3.444 3.040
SASA POLYESTER SANAYİ A.Ş.NOTES TO THE FINANCIAL STATEMENTS FOR THE YEAR ENDED 31 DECEMBER 2012(Amounts expressed in thousands of Turkish Lira (“TL”) unless otherwise steted.)
SASA POLYESTER SANAYİ A.Ş.NOTES TO THE FINANCIAL STATEMENTS FOR THE YEAR ENDED 31 DECEMBER 2012(Amounts expressed in thousands of Turkish Lira (“TL”) unless otherwise steted.)

SASA POLYESTER SAN. A.Ş. 2012 ANNUAL REPORT- 59
NOTE 25 - FINANCIAL RISK MANAGEMENT
Financial Risk Management Financial risk factors
The Company’s activities expose it to a variety of financial risks, including the effects of changes in debt and equity market prices, foreign currency exchange rates and interest rates. The Company’s overall risk management programme focuses on the unpredictability of financial markets and seeks to minimize potential adverse effects on the financial performance of the Company.
The Company’s risk management is implemented by the Company’s Treasury Department according to approved poli-cies by Board of Directors. Treasury Department detects and evaluates financial risks and relieve of a risk through close relations with other departments of the Company.
Market risk Foreign exchange risk
The Company is subject to foreign exchange risk due to foreign currency denominated liabilities and assets’ translation to Turkish Lira. Foreign exchange risk is traced and minimized through the analysis of foreign currency position.
Foreign Currency Position Table Assets and liabilities denominated in foreign currencies at 31 December 2012 and 2011 are as follows:
31 December 2012
TL USD EURO GBP
Trade receivables(Including other receivables) 193.214 88.603.732 14.997.395 -
Monetary financial assets
(Including cash and banks) 2.622 1.146.051 241.646 3.782
Other 1.126 138.365 362.481 9.324
Current Asset 196.962 89.888.148 15.601.522 13.106
Total Asset 196.962 89.888.148 15.601.522 13.106
Trade payables(Including other payables) (96.054) (30.459.613) (17.752.928) (2.591)
Financial liablilties (127.704) (63.000.000) (6.548.723) -
Other (1.823) (333.141) (521.287) (836)
Short term liabilities (225.581) (93.792.754) (24.822.938) (3.427)
Financial liabilities - - - -
Long term liabilities - - - -
Total liabilities (225.581) (93.792.754) (24.822.938) (3.427)
Net foreign currency position (28.619) (3.904.606) (9.221.416) 9.679
Export 347.637 26.283.505 128.994.980 -
Import 527.953 122.264.690 134.137.757 -
NOTE 25 - FINANCIAL RISK MANAGEMENT(cont’d)
Foreign Currency Position Table (cont’d) 31 December 2011
TL USD EURO GBP
Trade receivables(Including other receivables) 160.163 67.824.630 13.114.705 -
Monetary financial assets
(Including cash and banks) 1.247 317.061 260.051 4.255
Other 404 5.335 150.386 8.914
Current Asset 161.814 68.147.026 13.525.142 13.169
Total Asset 161.814 68.147.026 13.525.142 13.169
Trade payables(Including other payables) (149.345) (11.171.946) (52.449.191) (22.857)
Financial liablilties (58.924) (30.719.317) (367.708) -
Other (734) - (300.268) -
Short term liabilities (209.003) (41.891.263) (53.117.167) (22.857)
Financial liabilities (4.363) (2.250.000) (46.311) -
Long term liabilities (4.363) (2.250.000) (46.311) -
Total liabilities (213.366) (44.141.263) (53.163.478) (22.857)
Net foreign currency position (51.552) 24.005.763 (39.638.336) (9.688)
Export 335.985 22.390.070 130.215.390 -
Import 478.817 66.249.485 156.126.009 -
Foreign Currency Sensitivity Analysis
Profit / (Loss)
As of 31 December 2012;Appreciation of
Foreign CurrencyDepreciation of
Foreign Currency
10% change in US Dollar/TL Parity :
US Dollar net asset (696) 696
US Dollar net hedged amount - -
US Dollar net effect (696) 696
10%change in EURO/TL Parity:
EURO net asset (2.169) 2.169
EURO net hedged amount - -
Euro net effect (2.169) 2.169
10%change in GBP/TL Parity:
GBP net asset 3 (3)
GBP net hedged amount - -
GBP net effect 3 (3)
Total (2.862) 2.862
SASA POLYESTER SANAYİ A.Ş.NOTES TO THE FINANCIAL STATEMENTS FOR THE YEAR ENDED 31 DECEMBER 2012(Amounts expressed in thousands of Turkish Lira (“TL”) unless otherwise steted.)
SASA POLYESTER SANAYİ A.Ş.NOTES TO THE FINANCIAL STATEMENTS FOR THE YEAR ENDED 31 DECEMBER 2012(Amounts expressed in thousands of Turkish Lira (“TL”) unless otherwise steted.)

SASA POLYESTER SAN. A.Ş. 2012 ANNUAL REPORT- 61
NOTE 25 - FINANCIAL RISK MANAGEMENT(cont’d)
Profit / (Loss)
As of 31 December 2011;Appreciation of
Foreign CurrencyDepreciation of
Foreign Currency
10% change in US Dollar/TL Parity :
US Dollar net asset 4.534 (4.534)
US Dollar net hedged amount - -
US Dollar net effect 4.534 (4.534)
10%change in EURO/TL Parity:
EURO net asset (9.687) 9.687
EURO net hedged amount - -
Euro net effect (9.687) 9.687
10%change in GBP/TL Parity:
GBP net asset (3) 3
GBP net hedged amount - -
GBP net effect (3) 3
Total (5.156) 5.156
At 31 December 2012, had the TL weakened / strengthened by 10% against the US Dollar ceteris paribus, net loss for the period would have been higher / lower by TL 696 (31 December 2011: TL 4.534), mainly as a result of foreign exchange losses / gains arising from the translation of US Dollar assets and liabilities.
At 31 December 2012, had the TL weakened / strengthened by 10% against the Euro ceteris paribus, net loss for the period would have been higher / lower by TL 2.169 (31 December 2011: TL 9.687), mainly as a result of foreign exchan-ge losses / gains arising from the translation of Euro assets and liabilities.
Interest rate risk
The Company is exposed to interest rate risk through the impact of rate changes on interest bearing liabilities and assets. The company manages its not used cash on hand by time deposits. Income, other than not used cash on hand, and cash flows from operations are considerably free from market interest rate changes. The interest risk of the company arises from fixed rate short term borrowings.
To keep this exposure at a minimum level, the Company tries to borrow at the most suitable rates.
NOTE 25 - FINANCIAL RISK MANAGEMENT(cont’d)
Interest Rate Position Table
31 December 2012 31 December 2011
Fixed interest rate financial instruments
Principle 276.920 126.143
Interest 4.685 3.280
Total fixed financial liabilities 281.605 129.423
At 31 December 2012, if interest rates on TL denominated borrowings had been 10% higher / lower ceteris paribus, net gain for the period would have been TL 149 (31 December 2011: TL 64) higher / lower, mainly as a result of higher / lower interest expense on floating rate borrowings.
At 31 December 2012, if interest rates on US Dollar denominated borrowings had been 10% higher/lower ceteris paribus, net loss for the period would have been TL 112 higher / lower, mainly as a result of higher / lower interest expense on floating rate borrowings (31 December 2011 : 61).
At 31 December 2012, if interest rates on EUR denominated borrowings had been 10% higher/lower ceteris paribus, net loss for the period would have been TL 15 higher / lower, mainly as a result of higher / lower interest expense on floating rate borrowings (31 December 2011 : None).
Credit risk
Credit risk consists of cash and cash equivalents, deposits at banks, customers subject to credit risk due to uncollected receivables.
Receivables
The Company implements Credit Control procedure approved by the Board of Directors in order to manage credit risk due to receivables from customers. According to the procedure, the Company determine a risk limit for every single customer (except related parties) by taking into consideration receivable insurance, bank guarantee, mortgage and other guarantees and sales are conducted without exceeding customer risk limits. In circumstances where these guarantees do not exist or it is required to exceed the guarantees, sales are conducted through determined internal limits which are specified in the procedure.
SASA POLYESTER SANAYİ A.Ş.NOTES TO THE FINANCIAL STATEMENTS FOR THE YEAR ENDED 31 DECEMBER 2012(Amounts expressed in thousands of Turkish Lira (“TL”) unless otherwise steted.)
SASA POLYESTER SANAYİ A.Ş.NOTES TO THE FINANCIAL STATEMENTS FOR THE YEAR ENDED 31 DECEMBER 2012(Amounts expressed in thousands of Turkish Lira (“TL”) unless otherwise steted.)

SASA POLYESTER SAN. A.Ş. 2012 ANNUAL REPORT- 63
NOTE 25 - FINANCIAL RISK MANAGEMENT(cont’d)
Credit Risk Exposure according to Financial Instruments Types
Receivables
Trade Receivables Other Receivables Time
31 December 2012 Related Party Other Related Party Other Deposit
-Maximum credit risk exposure as of
balance sheet date 6 203.405 348 11.834 3.782
-Guaranteed maximum risk by
commitment or etc.(*) - 163.741 - - -
-Net book value of non-overdue
or unimpaired financial asset 6 188.960 348 11.834 3.782
Net book value of financial assets
that would be overdue
or impaired unless restructed - - - - -
Net book value of overdue assets
that are not impaired - 11.412 - - -
-The part that is Guaranteed by
commitment or etc. 9.802 - - -
-Net book value of impaired assets
Net book value - 3.033 - - -
- Overdue(gross book value) - 3.033 - - -
- Impairment (3.033) - - -
(*) Guarantees include receivable insurance, bank collateral, mortgages, and customer checks.
NOTE 25 - FINANCIAL RISK MANAGEMENT(cont’d)
Credit Risk Exposure according to Financial Instruments Types
Receivables
Trade Receivables Other Receivables Time
31 Aralık 2011 Related Party Other Related Party Other Deposit
-Maximum credit risk exposure as of
balance sheet date 875 175.154 230 20.707 1.571
-Guaranteed maximum risk by
commitment or etc.(*) - 140.123 - 20.707 -
-Net book value of non-overdue
or unimpaired financial asset 875 158.555 230 20.707 1.571
Net book value of financial assets
that would be overdue
or impaired unless restructed - - - - -
Net book value of overdue assets
that are not impaired - 14.167 - - -
-The part that is Guaranteed by
commitment or etc. 8.572 - - -
-Net book value of impaired assets
Net book value - 2.432 - - -
- Overdue(gross book value) - 2.432 - - -
- Impairment - (2.432) - - -
SASA POLYESTER SANAYİ A.Ş.NOTES TO THE FINANCIAL STATEMENTS FOR THE YEAR ENDED 31 DECEMBER 2012(Amounts expressed in thousands of Turkish Lira (“TL”) unless otherwise steted.)
SASA POLYESTER SANAYİ A.Ş.NOTES TO THE FINANCIAL STATEMENTS FOR THE YEAR ENDED 31 DECEMBER 2012(Amounts expressed in thousands of Turkish Lira (“TL”) unless otherwise steted.)

SASA POLYESTER SAN. A.Ş. 2012 ANNUAL REPORT- 65
NOTE 25 - FINANCIAL RISK MANAGEMENT (cont’d)
As of 31 December 2012 and 31 December 2011 net book value of overdue assets that not impaired is as follows:
Trade Receivables 31 December 2012 31 December 2011
Overdue 1-30 days 10.729 11.536
Overdue1-3 months 510 1.192
Overdue 3-12 months 173 1.439
Total 11.412 14.167
Portion under the guarantee of collaterals,etc(*) 9.802 8.572
(*) Söz konusu teminatlar alacak sigortası, banka teminatı, ipotek ve müşteri çeklerinden oluşmaktadır.
Liquidity risk
Prudent liquidity risk management implies maintaining sufficient cash and marketable securities, the availability of funding through an adequate amount of committed credit facilities and the ability to close out market positions. Due to the dynamic nature of the underlying business the Company aims to maintain flexibility in funding by keeping committed credit lines available.
As of 31 December 2012;
Contractural maturities
Financial Liabilities Other than Derivatives
Book ValueTotal Cash Outflow
Due to Contracts 3 monhts 3-12 monhts 1-5 years
Bank borrowings 276.811 285.526 133.335 152.191 -
Financial leasing
liabilities 109 112 48 64 -
Trade payables 18.389 18.389 18.389 - -
Other payables 10.276 10.276 2.569 5.138 2.569
Expected maturities
Financial Liabilities Other than Derivatives
Book ValueTotal Cash Outflow
Due to Contracts 3 monhts 3-12 monhts 1-5 years
Bank borrowings - - - - -
Trade payables 100.350 100.473 68.045 32.428 -
Other payables 8.903 8.903 8.903 - -
As of 31 December 2011;
Contractural maturities
Financial Liabilities Other than Derivatives
Book ValueTotal Cash Outflow
Due to Contracts 3 monhts 3-12 monhts 1-5 years
Bank borrowings 125.131 133.278 4.220 124.808 4.250
Financial leasing
liabilities 1.012 1.056 299 640 117
Trade payables 14.755 14.755 14.755 - -
Other payables 17.983 17.983 2.569 5.138 10.276
Expected maturities
Financial Liabilities Other than Derivatives
Book ValueTotal Cash Outflow
Due to Contracts 3 monhts 3-12 monhts 1-5 years
Bank borrowings - - - - -
Trade payables 157.890 159.311 159.311 - -
Other payables 13.450 13.450 13.450 - -
Funding risk
The ability to fund the existing and prospective debt requirements is managed by maintaining the availability of ade-quately committed funding lines from high quality lenders.
Capital risk management
The Company’s objectives when managing capital are to safeguard the Company’s ability to continue as a going concern in order to provide returns for shareholders and benefits for other stakeholders and to maintain an optimal capital structure to reduce the cost of capital.
In order to maintain or adjust the capital structure, the Company may adjust the amount of dividends paid to share-holders, issue new shares or sell assets to reduce debt.
Consistent with others in the industry, the Company monitors capital on the basis of the net debt/ (shareholders’ equity + net debt) ratio. Net debt is calculated as total borrowings (including borrowings, trade and other payables as shown in the balance sheet) less cash and cash equivalents and deferred tax liability.
DİPNOT 25 - FİNANSAL ARAÇLARDAN KAYNAKLANAN RİSKLERİN NİTELİĞİ VE DÜZEYİ (devamı)
SASA POLYESTER SANAYİ A.Ş.NOTES TO THE FINANCIAL STATEMENTS FOR THE YEAR ENDED 31 DECEMBER 2012(Amounts expressed in thousands of Turkish Lira (“TL”) unless otherwise steted.)
SASA POLYESTER SANAYİ A.Ş.NOTES TO THE FINANCIAL STATEMENTS FOR THE YEAR ENDED 31 DECEMBER 2012(Amounts expressed in thousands of Turkish Lira (“TL”) unless otherwise steted.)

NOTE 25 - FINANCIAL RISK MANAGEMENT (cont’d)
As of 31 December 2012 and 2011 net debt/ (shareholders’ equity + net debt) ratio is as follows:
31 December 2012 31 December 2011
Total borrowings 439.997 345.699
Cash and cash equivalents (3.785) (1.573)
Deferred tax liabilities (15) (184)
Net debt 436.197 343.942
Shareholder's equity 243.674 274.483
Shareholder's equity+net debt 679.871 618.425
Net debt/ (Shareholders'equity+net debt) ratio 64% 56%
NOTE 26 - SUBSEQUENT EVENT
The Company has sold all shares of Bimsa to Sabanci Holding in 11 January 2013.
SASA POLYESTER SANAYİ A.Ş.NOTES TO THE FINANCIAL STATEMENTS FOR THE YEAR ENDED 31 DECEMBER 2012(Amounts expressed in thousands of Turkish Lira (“TL”) unless otherwise steted.)

Polyester Sanayi A.Ş.Yolgeçen Mah. Turhan Cemal Beriker Bul. No: 559 Pk: 01355 SEYHAN - ADANA / TÜRKİYE
Tel: +90 322 441 00 53 (pbx)
Fax: +90 322 441 01 14
www.sasa.com.tr
Organize Sanayi Tekstil İşletmesiAdana Hacı Sabancı Organize Sanayi Bölgesi OSB Yaşar Doğu Caddesi No: 1 Sarıçam -Adana / Türkiye
Tel: +90 (322) 394 41 82-83Fax: +90 (322) 394 41 83
İskenderun Tank Sahası ve Dolum Tesisleri TerminaliAkçay Mevkii Güzelçay Mahallesi 616 Sokak No: 6 P.K. 91 31200 İskenderun - Hatay / Türkiye
Tel: +90 (326) 626 21 14-15Fax: +90 (326) 626 21 13
İstanbul Büro Sabancı Center Kule: 2 Kat :18 P.K. 343304.Levent - İstanbul / Türkiye
Tel: +90 (212) 385 81 37Fax: +90 (212) 282 63 62


