
1
THIS REPORT CONTAINS ASSESSMENTS OF COMMODITY AND TRADE ISSUES MADE BY
USDA STAFF AND NOT NECESSARILY STATEMENTS OF OFFICIAL U.S. GOVERNMENT
POLICY
Date:
GAIN Report Number:
Approved By:
Prepared By:
Report Highlights:
FAS/Moscow forecasts Russia’s 2017 production of three major crops (sunflowerseed, soybeans, and rapeseed)
at 15.3 million metric tons (MMT), a 2 percent increase over last year. Sunflowerseed is forecast to increase 1.3
percent to 11.0 MMT and soybeans are forecast to increase 2 percent to 3.2 MMT respectively. The increase in
sunflowerseed is primarily due to an increase in yields, while the increase in soybean production is due to an
increase in area. Production of rapeseed is forecast to increase 10 percent to 1.1 MMT, due to an increased share
of high yielding winter rapeseed in the total rapeseed crop. Area sown to these three major crops is forecast to
remain almost the same, but sunflowerseed area will decrease slightly and soybean area will increase.
FAS/Moscow forecasts Russia’s imports of these three crops at approximately 2.2 MMT, including 2.1 MMT of
soybeans. Exports are forecast at 0.67 MMT, including 0.4 MMT of soybeans, 0.2 MMT of sunflowerseed, and
0.07 MMT of rapeseed. Russia’s total crush for the three major oilseed crops is forecast to increase from
estimated 15.39 MMT in MY 2016/17 to 15.8 MMT, including 10.4 MMT of sunflowerseed, 4.35 MMT of
soybeans and 1.05 MMT of rapeseed. Production of oilseed meal is forecast to increase from estimated 8.13
MMT in MY 2016/17 to 8.29 MMT in MY 2017/18. Production of vegetable oil is forecast to increase from
5.36 MMT in MY 2016/17 to 5.49 MMT in MY 2017/18.
FAS/Moscow Staff
Robin Gray
Annual 2017
Oilseeds and Products Annual
Russian Federation
RS1714
3/16/2017
Required Report - public distribution

2
General Information
NOTE: USDA unofficial data excludes Crimean production and exports. However, as of June
2014, Russian official statistics (ROSSTAT) began incorporating Crimean production and trade
data into their official estimates. Where possible, data reported by FAS Moscow is exclusive of
information attributable to Crimea.
Table of Contents OILSEEDS ...................................................................................................................................... 3
Production ................................................................................................................................... 3
Results of 2016 crop ............................................................................................................. 11 Consumption: ............................................................................................................................ 17 Trade: ........................................................................................................................................ 21
Stocks ........................................................................................................................................ 25 Policy ........................................................................................................................................ 26
Marketing .................................................................................................................................. 27 PSD Tables for Oilseeds ........................................................................................................... 30
MEALS ......................................................................................................................................... 32 Production ................................................................................................................................. 32 Feed Consumption .................................................................................................................... 33
Trade ......................................................................................................................................... 36 Stocks ........................................................................................................................................ 39
PSD Tables for Meal ................................................................................................................. 40
OILS .............................................................................................................................................. 41
Production ................................................................................................................................. 41 Consumption ............................................................................................................................. 42
Trade ......................................................................................................................................... 43 Stocks ........................................................................................................................................ 46 PSD Tables for Oils .................................................................................................................. 46

3
OILSEEDS Commodities:
- Sunflowerseed
- Soybean
- Rapeseed
- Peanuts
NOTE: From 2016, the Russian State Statistical Service (Rosstat) began publishing data on
production of oilseeds in clean weight. Before 2015, Rosstat did not calculate clean weight for
oilseeds. In 2017, all Rosstat data for oilseeds are in clean weight, and Rosstat also re-calculated
previous crops from bunker to clean weight for the last 7 years. Thus, all oilseed production data
in this report are in clean weight.
Production
FAS/Moscow forecasts Russia’s 2017 production for the three major Russian oilseed crops
(sunflowerseed, soybeans, and rapeseed) at 15.3 million metric tons (MMT), a two percent increase
from the crop last year. This forecast includes 11.0 MMT of sunflowerseed, a one percent increase from
last year, 3.2 MMT of soybeans, a 2 percent increase from last year, and 1.1 MMT of rapeseed, a 10
percent increase from last year. The forecast summary for MY 2017/18 is provided below in Table 1.
In the last five years Russia has also increased production of niche oilseed crops, such as oil flax,
Camelina, and safflower. In 2016, the total crop of these three oilseeds reached 1 MMT, and
FAS/Moscow forecasts the same volume of production for these three crops in 2017. Thus, Russia’s
total production of oilseeds in MY 2017/18 may reach 16.3 MMT.
Table 1. Consolidated PSD Forecast for Major Oilseeds for MY 2017/18, Thousand Metric Tons
(TMT), 1,000 HA Post MY 2017/18 Sunflowerseed Soybeans Rapeseed Peanuts TOTAL
Area Planted 7,400 2,300 1,000 0 10,700
Area Harvested 7,150 2,200 910 0 10,260
Beginning Stocks 353 131 33 5 522
Production 11,000 3,200 1,100 0 15,300
MY Imports 50 2,100 60 145 2,355
MY Imp. from U.S. 0 300 0 0 300
MY Imp. from EU 0 0 0 0 0
Total Supply 11,403 5,431 1,193 150 18,177
MY Exports 200 400 70 0 670
MY Exp. to EU 10 0 5 0 15
Crush 10,400 4,350 1,050 0 15,800
Food Use Dom. Cons. 220 0 0 145 365
Feed Waste Dom. Cons. 300 550 25 0 875
Total Dom. Cons. 10,920 4,900 1,075 145 17,040
Ending Stocks 283 131 48 5 467
Total Distribution 11,403 5,431 1,193 150 18,177
Note: The above table is composed of PSD forecast for each crop, despite differing marketing years.
The marketing year for sunflowerseed and soybeans is September – August. The marketing year for
rapeseed is July – June.
4
FAS/Moscow’s forecast for production is based on the assumption that weather in 2017 will be normal,
area sown to oilseeds will remain almost the same, and yields of the major oilseed crops will remain
low1. Oilseeds in Russia compete for fertile soil and climate-friendly regions with grains, sugar beets,
and other crops. Therefore, a significant increase in the area sown to oilseed crops is not possible. The
financial situation for most Russian farmers remains poor, and they cannot afford significant
investments in new expensive agro-technologies (i.e. Clearfield technology for sunflowerseed), which
would improve yields and made crop production less dependent on weather and pests. Almost all
oilseeds in Russia are sown in the spring. Area sown to winter oilseeds (winter rapeseed and false flax
(Camelina) is small and comprises approximately 2.5 percent of all area sown to oilseeds. In fall 2016,
farmers planted 301.0 thousand hectares (THA) to winter oilseeds (compared to 317.6 THA in fall
2015), of which area sown to winter rapeseed was 181.5 THA, or 20 percent of the total forecast
rapeseed planted area in MY 2017/18. The other 119.5 THA of winter oilseeds were sown to false flax
(Camelina)2
Sunflowerseed
Given normal weather conditions, FAS/Moscow forecast sunflowerseed production at 11.0 MMT. This
forecast is based on an assumption that the average yield for sunflowerseed (in clean weight) will be, in
accordance with the trend line, at approximately 1.54 MT/HA (compared with 1.51 MT/HA in 2016).
FAS/Moscow forecasts that sunflowerseed planted area will be 7.4 million hectares, and harvested area
will be 7.15 million hectares, almost the same as in 2016. In MY 2016/17, sunflowerseed was harvested
from 7.2 million hectares. The FAS/Moscow forecast assumes that, as happened in the previous years,
farmers will commit more area to sunflowerseed than the Ministry of Agriculture recommends and/or
plans.
1 In the United States the average yield of soybeans is 3.2 MT/HA, the average yield of canola (spring rapeseed) is 2.0
MT/HA, and the average yield of sunflowerseed is approximately 1.8 MT/HA. The average sunflowerseed yield in the EU-28
is 2.0 MT/HA. 2 Source: Ministry of Agriculture of the Russian Federation: http://www.mcx.ru/documents/document/show/37808.htm

5
Source: FAS/Moscow based on Rosstat data.
The Ministry of Agriculture and provincial authorities are trying to convince farmers to decrease area
planted to sunflowerseed, and the Ministry of Agriculture forecasts that in 2017 farmers will plant 7.17
million hectares to sunflowerseed, or 0.33 million hectares less than in 2016 (7.5 million hectares).
Sunflowerseed, more than any other crop, exhausts the soil. Moreover, if sunflowerseed is sown in
consecutive seasons, the risks are very high that the next crop will be damaged by pests that remain in
the soil. In particular the parasite weed sunflower broomrape – Orobanche cumanaache sps., also called
“zarazikha.” Zarazikha affects the root of the sunflowerseed plant and kills the plant. This parasite
weed has spread in Russia and may kill up to 100 percent of the crop in the field. Only farmers that can
afford investments in high-quality pest-resistant seeds, herbicides and other chemicals, and follow exact
agronomic practices are able to successfully plant sunflowerseed season after season and maintain good
yields. However, most farmers that sow sunflowerseed cannot afford such expenses. Despite the threat
of losing the crop, and recommendations of provincial and federal authorities, most farmers make their
planting decisions based on returns. If they can get profit even with low yields, they will continue
planting sunflowerseed despite all recommendations. So far, a stable demand for sunflowerseed in the
domestic market has kept the average returns from selling sunflowerseed higher than returns from
selling most other crops. As a result, farmers have planted more area to sunflowerseed than the federal
and provincial authorities recommended.
In 2016, the price of sunflowerseed remained stable, but at the beginning of 2017 sunflowerseed prices
began to decrease. This trend may decrease the incentive for farmers to sow sunflowerseed (see
paragraph Marketing of OILSEED section of this report.) However, the demand from crushers is high
due to new capacity put into operation. The demand from traders has also increased due a lower export
duty. Sunflowerseed still remains one of the most profitable crops for farmers. This factor favors
forecast stability for the 2017 sunflowerseed sown area projections, despite recommendations from the

6
Ministry of Agriculture and local authorities. However, at the time of this report, sunflowerseed sowing
has not yet started in Russia.
Soybeans
FAS/Moscow forecasts that Russian area sown to soybeans will continue grow and may reach 2.3
million hectares (slightly higher than the Ministry of Agriculture plans of 2.25 million hectares). This
will result in a total of 2.2 million hectares of harvested area. However, yield progress is not forecast.
Based on the trend line, the average yield of soybeans will be at best, 1.45 MT/HA. Given normal
weather conditions, FAS/Moscow forecasts the soybean crop in MY 2017/18 at 3.2 MMT, three percent
higher than in 2016.
Source: Source: FAS/Moscow based on Rosstat data.
The Russian Ministry of Agriculture forecasts that area sown to soybeans will increase by 79.0 THA
from last year, and will reach 2.26 million hectares. Since demand for domestic soybeans is increasing
in Russia, these forecasts seem feasible.
Rapeseed
FAS/Moscow forecasts that the MY 2017/18 rapeseed crop will recover to 1.1 MMT, a ten percent
increase y-o-y. This forecast is based on the assumption that the area sown to winter rapeseed will
increase slightly. Given normal weather conditions and the increase in winter rapeseed, total rapeseed
production will increase. Note, yields for winter rapeseed are 70-80 percent higher on average than
spring rapeseed yields.

7
Source
: Source: FAS/Moscow based on Rosstat data.
The Russian Ministry of Agriculture reports that the winter 2017 rapeseed crop was planted on 0.18
million hectares, and spring rapeseed will be planted on 0.87 million hectares.
Table 2. Russian Ministry of Agriculture’s Forecast for Planting of Oilseeds, THA.
Crops 2016
(spring data)
2017
(forecast) 2017 in % to 2016
2017 +/ -
to 2016
All oilseed crops sown area 12,170.7 11,744.8 96.5 -425.9
- Sunflowerseed 7,498.8 7,171.4 95.6 -327.3
- Soybeans 2,184.8 2,263.8 103.6 79.0
- Rapeseed 995.1 1,053.9 105.9 58.8
- Oil (crown) flax 709.2 662.3 93.4 -47.0
- Mustard 180.6 169.5 93.9 -11.1
- False flax (Camelina) 141.3 112.9 79.9 -28.4
- Other 460.9 311.0 67.5 -149.9
Source: Ministry of Agriculture
Inputs:
There are no significant changes in the supply of inputs for production of oilseeds in Russia.
Fertilizer and chemicals
The Ministry of Agriculture reports that as of February 2017, there were higher stocks of mineral
fertilizer than last year: 450,100 metric tons (MT) (in active ingredient), 149,900 MT more than last
8
year3. However, there are no data on the share of fertilizer that is used for spring sowing of oilseeds,
and since oilseeds are sown later than grains and many other crops, the fertilizer supply is not so
important for oilseed producers.
There are no official data on supply and use of chemicals in oilseed production, although herbicides and
pesticides are very important for oilseed crop protection. Crop producers’ incomes in 2016/17
decreased compared to 2015/16. Thus, they are likely to cut purchase of expensive inputs, including
chemicals.
Planting seeds
Supply and quality of planting seeds is a critical factor for oilseeds production in Russia. In 2015,
Russia adopted federal programs aimed at supporting the development of breeding and selection of
planting seeds for the improvement of production of some crops and substitution of imports of planting
seeds. According to the Russian Ministry of Agriculture, in 2016, Russian farmers (including so called
peasant farms) planted 34.65 TMT of planting seeds of sunflowerseed, 245.59 TMT of planting seeds of
soybeans, and 7.1 TMT of planting seeds of spring rapeseed (Table 3). The total cost of all these
planting seeds was over 25 million Rubles4 ($390,625).
Table 3. Ministry of Agriculture’s Estimate of Volume of Planted Seeds of Major Oilseeds in 2016
Crops Area,
THA
Planted
seeds,
TMT
Availability,
percent
Price of
1 MT,
thousand
Rub.
Value of sown
seeds, thousand
Rub. 2016 2015
Sunflowerseed 7,498.8 34.65 98.5 98.9 383.2 13,277.9
Soybeans 2,184.7 245.59 108.8 105.7 43.2 10,609.5
Rapeseed,
spring
893.3 7.1 83.5 86.7 172.9 1,227.6
Source: Ministry of Agriculture
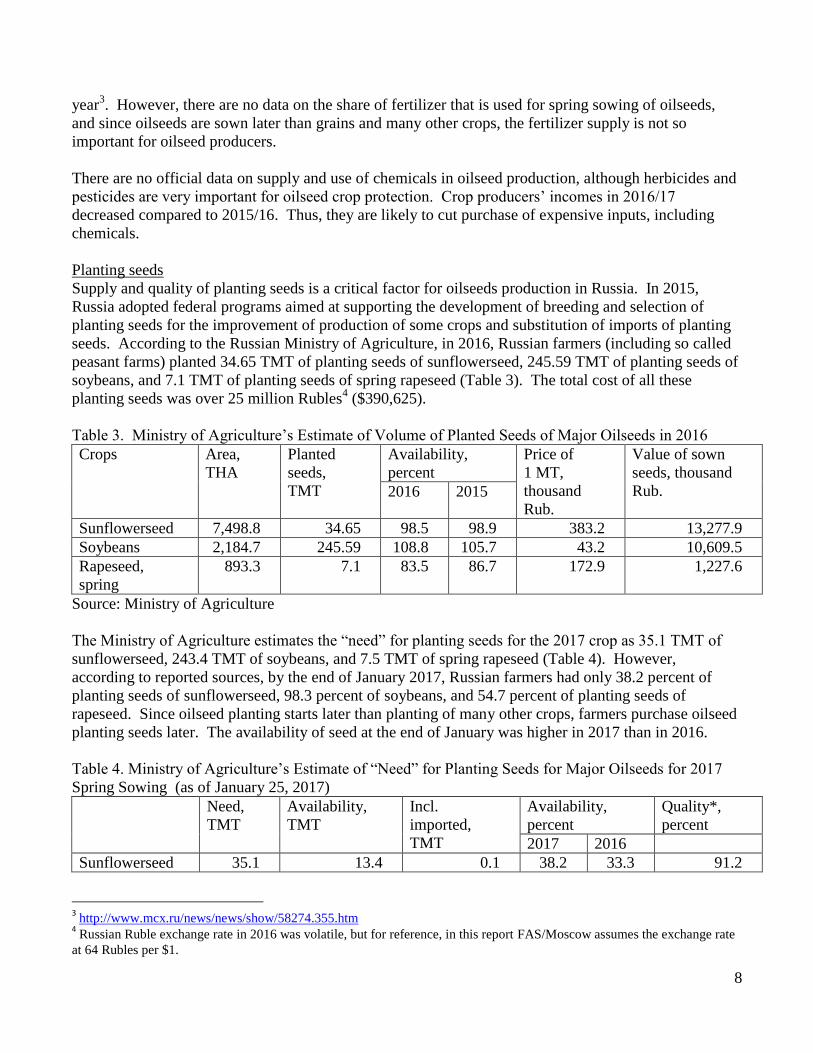
The Ministry of Agriculture estimates the “need” for planting seeds for the 2017 crop as 35.1 TMT of
sunflowerseed, 243.4 TMT of soybeans, and 7.5 TMT of spring rapeseed (Table 4). However,
according to reported sources, by the end of January 2017, Russian farmers had only 38.2 percent of
planting seeds of sunflowerseed, 98.3 percent of soybeans, and 54.7 percent of planting seeds of
rapeseed. Since oilseed planting starts later than planting of many other crops, farmers purchase oilseed
planting seeds later. The availability of seed at the end of January was higher in 2017 than in 2016.
Table 4. Ministry of Agriculture’s Estimate of “Need” for Planting Seeds for Major Oilseeds for 2017
Spring Sowing (as of January 25, 2017)
Need,
TMT
Availability,
TMT
Incl.
imported,
TMT
Availability,
percent
Quality*,
percent
2017 2016
Sunflowerseed 35.1 13.4 0.1 38.2 33.3 91.2
3 http://www.mcx.ru/news/news/show/58274.355.htm
4 Russian Ruble exchange rate in 2016 was volatile, but for reference, in this report FAS/Moscow assumes the exchange rate
at 64 Rubles per $1.

9
Soybeans 243.4 239.3 0.0 98.3 94.8 86.3
Rapeseed,
spring
7.5 4.1 0.0 54.7 59.0 39.6
*Quality means that seeds meet their specifications
Source: Ministry of Agriculture
Farmers usually purchase imported planting seeds in spring, before sowing, and the share of imported
planting seeds remain high. According to the Ministry of Agriculture, in 2016 the share of imported
seeds in 2016 varied from 21.6 percent for soybeans to 53.6 percent for sunflowerseed (Table 5).
Table 5. Origin of Planting Seeds of Oilseeds, 2016, TMT
Imported Domestic, registered Non-registered
Sunflowerseed 53.6 37.5 8.9
Soybeans 21.6 58.1 20.3
Rapeseed, spring 30.0 40.4 29.5
Rapeseed, winter 49.7 31.0 19.3
Source: Ministry of Agriculture
Only large agroholdings can afford imported, high-yield hybrids or varieties, and proper chemicals. The
majority of farmers use domestically registered and even non-registered seeds. Thus, the difference in
yields may vary for sunflowerseed from less than 1 MT per HA to more than 2 MT per HA.
Breeding and Selection of Domestic Planting Seeds5
Sunfloweseed
Sunflowerseed is the main oilseed crop in Russia, and provides for the major supply of vegetable oils.
The federal government supports substitution of imports of these planting seeds. The R&D Institute
Named after Pustovoitov in Krasnodar Kray, and the R&D Institute of Agriculture of the South-East (in
Saratov Oblast), as well as several private seed-selection companies are involved in selection of
domestic sunflowerseed varieties and hybrids. So far, almost 54 percent of planting seeds of
sunflowerseed in Russia are varieties and hybrids of foreign selection, and most of these seeds are
imported.
According to industry analysts, the price of foreign planting seeds may be three, even four times higher
than the price of domestic seeds. The State Seeds Register has four varieties and 48 sunflowerseed
hybrids, including 15 of Russian origin. Russian specialists consider that there are enough hybrids of
domestic selection that can replace imported sunflowerseed in two years. However, there is a shortage
of planting material for multiplication and commercial production. When domestic hybrids of
sunflowerseed are compared with imported, then under normal growing conditions, domestic seeds are
on par with imported. But the situation changes when the soil preparation and cultivation practices
improve, then imported hybrids produce much higher yields. According to specialists from the Institute
of Pustovoitov, given that half of the 7.5 million hectares sown to sunflowerseed in Russia have
unfavorable soil and cultivation practices, domestic varieties and hybrids may even be better than
foreign: “Foreign hybrids were created especially for high crop culture, for yields at 4-4.5 MT per HA.
5 Source: http://www.agroinvestor.ru/technologies/article/25823-ukhod-ot-semennoy-zavisimosti/ (in Russian)

10
Considering that in our country sunflowerseed are often sown in not the best regions, i.e., in Saratov
oblast, where the potential yields cannot be higher than 2-3 MT per HA, there is no big difference
between domestic and foreign hibrids.”
The Russian government is subsidizing the selection of planting seeds for sunflowerseed. The 2017
federal budget envisages 91.3 million Rubles (($1.4 million) in subsidies for compensation of 20 percent
of the cost of production of planting seeds for sunflowerseed. These subsidies are part of the so called
per hectare “decoupled support” program, and rates for subsidies are calculated per hectare: 33,000
Rubles ($516) for parent forms of sunflowerseed hybrids, 8,700 Rubles ($136) for the first generation of
hybrids, and 32,600 Rubles ($509) for original seeds of varieties of sunflowerseed, and 9,000 Rubles
($141) for elite seeds of varieties of sunflowerseed.6
Industry analysts consider the threat of the parasite plant called Orobanche Cumana as the major threat
for an increase in sunflowerseed production in Russia. This parasite weed affects the roots of
sunflowerseed and can destroy up to 100 percent of the crop. The main way to combat this plague is
either to use an eight to 10-years crop rotation schedule, (crops such as corn, millet, and sorghum do not
allow the seeds of the parasite to survive) or to use special practices called Clearfield based on special
hybrids, herbicides, and strict agronomic practices.
Soybeans
Russia increased development of soybean varieties. Russian breeders have oriented their research
towards resistance to weather and the climate peculiarities of the different Russian regions. This factor,
so called “regionalization” of planting seeds is praised even by foreign companies that sell imported
seeds. Additionally, Russian varieties are less expensive than imported. Thus, the price of soybean
planting seeds of Russian selection is about 40,000 Rubles ($625) per 1 MT, while the first reproduction
of imported soybean planting seeds is over 80,000 Rubles ($1,250) per 1 MT.
According to industry, Russian varieties comprise 83 percent of used soybean planting seeds. Soybean
seed breeding orients towards the following: a decrease of the vegetation period (early varieties),
stability of yields, improvements of biochemical and technological characteristics of soybeans,
resistance to dangerous pathogens, resistance to drought, frost, hail damage, waterlogging, soil salinity
and soil acidity. According to the Russian Soy Union, over 130 soybean varieties are registered in
Russia, including over 100 Russian varieties. There are several soy-breeding centers in Russia,
including in Amur Oblast (All-Russian R&D Institute of Soybeans), in Krasnodar Kray (Research
Institute named after Pustovoitov), and the Center “Soybean Complex”. The price for good Russian
varieties (first reproduction) is approximately 60,000 Rubles ($938) per 1 MT. This is almost two times
lower than the price of imported varieties. However, agronomists report that yields and protein content
of local varieties are lower than yields and protein content of registered imported varieties. Russian
varieties are “extensive,” and may even be damaged by intensive technologies (“super-nutrition may
lead to lodging”). There are two criteria for the measurement of protein content: raw protein and protein
calculated in over-dry matter (DM). The second characteristic determines the quality of soybeans and
determines the price. According to the General Director of the Russian Division of the Canadian
company “Semans Prograin” (the company sells and produces in Russia some Canadian varieties of
soybeans), in 2016 the soybean price differences for different protein levels varied significantly. The
price of soybeans with a protein DM of 27 percent was 19,000 Rubles ($297), while the price of
6 Source: Ministry of Agriculture

11
soybeans with a protein DM over 38 percent was 28,000 Rubles ($438). However, farmers that plant
soybeans for commercial purposes first consider the total expenses per hectare and the consistency of
the crop: foreign varieties may have higher yields (up to 1 MT per hectare), but harvest season for some
foreign varieties is mid-October or even end of October. Given the fall climate in European Russia, a
later harvest may result in the complete loss of crop, or at least, interfere in the harvesting of other crops.
Finance
There are no data on the financing of Russian agriculture by crops. The decoupled support of
agriculture is based on sown area, and this support is small. To some extent agricultural producers may
rely on interest rate subsidies. In 2017, the new mechanism for interest rate subsidies became available.
The government will subsidize the banks directly, and the banks will provide credits to farmers at the
five percent interest rate. Previously, farmers had to obtain loans at commercial interest rates and were
later reimbursed by the state. As of the end of January 2017, the Ministry of Agriculture signed
agreements on the new scheme of government interest rate subsidies with six banks: Rosselkhozbank,
Alfa-Bank, Promsvyazbank, Bank VTB, Sberbank, and Gazprombank, and was going to sign
agreements with UniKreditbank, Bank “Otkrytie”, RosBank, and Raiphizenbank.7 However, industry
analysts report of significant delays in financing with this scheme.
Results of 2016 crop
In 2016, Rosstat continued reporting oilseed crops in clean weight, and results of oilseed production in
2016, by crops, are provided in the table below:
Table 6. Results of 2016 Oilseed Crop
2009 2010 2011 2012 2013 2014 2015 2016
Planted Area, 1,000 hectares
Sunflowerseed 6,19
6
7,15
4
7,614 6,529 7,271 6,823 6,922 7,481
Soybeans 875 1,20
6
1,229 1,481 1,532 2,002 2,123 2,228
Rapeseed 688 856 893 1,191 1,326 1,174 1,014 978
- winter 178 218 175 105 239 261 138 96
- spring 511 638 718 1,085 1,087 913 876 881
Mustard 101 110 134 118 154 182 188 173
Oil flax (Crown
flax)
146 267 500 618 478 488 628 683
False flax
(Camelina)
182 268 207 142
Safflower 16 89 123 292 445
Other 15 24 76 135 30 17 20 21
Total 8,02
0
9,61
6
10,44
7
10,08
7
11,06
0
11,07
6
11,393.
1
12,151.
0
Production, 1,000 MT
Sunflowerseed 6,01 4,97 9,062 7,495 9,842 8,374 9,173 10,858
7 http://www.mcx.ru/news/news/show_print/58309.355.htm

12
5 9
Soybeans 873 1,13
3
1,641 1,683 1,517 2,362 2,707 3,135
Rapeseed 605 608 956 945 1,259 1,324 1,001 997
- winter 308 395 304 166 407 460 255 163
- spring 359 275 752 869 987 990 747 834
Mustard 24 36 88 42 55 99 64 68
Oil flax (Crown
flax)
94 173 464 361 320 379 502 634
False flax
(Camelina)
0 0 0 0 128 156 90 79
Safflower 8 45 87 154 286
Other 3 10 53 67 21 13 11 11
Total 8,18
6
7,45
7
13,11
5
11,31
3
14,15
1
13,70
7
13,702 16,067
Yields per harvested area, 1hectares
Sunflowerseed 1.15 0.96 1.34 1.30 1.55 1.40 1.42 1.51
Soybeans 1.11 1.09 1.48 1.31 1.36 1.36 1.30 1.48
Rapeseed 1.20 1.10 1.26 1.06 1.25 1.39 1.12 1.11
- winter 1.82 1.90 1.77 1.68 1.73 1.81 1.93 1.82
- spring 0.93 0.68 1.13 0.99 1.13 1.25 0.98 1.02
Mustard 0.47 0.48 0.80 0.54 0.50 0.67 0.49 0.55
Oil flax (Crown
flax)
0.88 0.86 1.04 0.69 0.78 0.93 0.85 0.97
False flax
(Camelina)
0.61 0.78 0.66 0.57 0.60
Safflower 0.62 0.64 0.76 0.64 0.67
Source: Rosstat, except Crimea. Original Rosstat data includes Crimea. In 2016, Crimea produced 191
TMT of oilseeds, including 152 TMT of sunflowerseed, 0.72 TMT of soybeans, 1.74 TMT of rapeseed
(primarily spring), 5.5 TMT of mustard seed, 30.4 TMT of oil flax and 0.1 TMT of other oilseeds
(safflower).
Area sown to all oilseeds (three major crops and other crops, such as Oil flax, Camelina and Safflower)
in Russia has grown steadily since 2000 from 5.5 million hectares in 2000 to 8.02 million hectares in
2009, and to 12.15 million hectares in 2016. This includes the area sown to sunflowerseed that
increased from 4.6 million hectares in 2000 to 6.20 million hectares in 2009 and to 7.48 million hectares
in 2016. However, the share of area sown with sunflowerseed, as a percentage of total area sown to
oilseeds, decreased. At the same time, the share of soybeans, rapeseed and other oilseed crops increased
(Chart 4). Nevertheless, sunflowerseed still dominates total oilseed production. However, because
sunflowerseed yields are heavily dependent on weather, production fluctuations are significant (Chart
5).

13
Source: Rosstat
Source: Rosstat.
Sunflowerseed
Sunflowerseed still remains among the most profitable crops in Russia. In MY 2016/17, the price of
sunflowerseed began to decrease despite high demand from crushers. However, industry analysts report
that relative to other crops, the margin of sunflowerseed produccers is higher than the margin of grain
producers. In 2016, production of sunflowerseed increased in all federal districts except the Central
Federal District. The increase in production was primarily due to favorable weather and slightly
improved yields.

14
Source: Rosstat
In 2016, the Volga Valley Federal District became the leader in production of sunflowerseed, with 3.6
MMT crop (30 percent or almost 0.84 MMT’s increase y-o-y). Production there increased primarily due
to increased sown area, while the average yield still remained low, approximately 1.1 MT per 1 HA
(only 5 percent higher than in 2015). The Southern Federal District followed in sunflowerseed
production of over 3.2 MMT (22 percent or 0.59 MMT increase y-o-y). Production in the Southern
Federal District increased primarily due to increased yields from the average 1.65 MT/HA in 2015 to
1.93 MT/HA in 2016, or by 17 percent. Yields increased practically in all sunflowerseed producing
oblasts of the Southern Federal District, but the variation in yields was significant: from 1.43 MT/HA in
Volgograd oblast to 2.53 MT/HA in Krasnodar Kray. Sunfloweseed production in the Central Federal
District, the last year leader, decreased from 2.82 MMT in 2015 to 2.68 MMT in 2016, primarily due to
decreased area sown to sunflowerseed, although average sunflowerseed yields remained among the
highest in Russia: 2.16 MT/HA in 2016 compared with 2.15 MT/HA in 2015. Bryansk and Belgorod
oblast were the leaders in the yields with 2.86 MT/HA and 2.64 MT/HA respectively.
Chart 7. Location of Sunflowerseed Production in Russia in 2015

15
Over 1.0 MMT (Dark Red)
- Rostov Oblast - 1.26 MMT (0.83 MMT in 2015)
- Saratov Oblast – 1.29 MMT (1.0 MMT in 2015)
- Krasnodar Kray – 1.07 MMT (1.02 MMT in 2015)
From 0.5 to 1.0 MMT (Red)
- Voronezh Oblast – 0.92 MMT (1.0 MMT in 2015)
- Volgograd Oblast – 0.81 MMT (0.73 MMT in 2015)
- Samara Oblast – 0.71 MMT (0.54 MMT in 2015)
- Orenburg Oblast – 0.66 MMT 9 0.53 MMT in 2015)
- Tambov Oblast – 0.57 MMT (0.74 MMT in 2015)
- Stavropol Kray – 0.54 MMT (0.39 MMT in 2015)
From 0.3 to 0.5 MMT (Light Red)
- Altay Kray – 0.50 MMT (0.36 MMT in 2015)
- Belgorod Oblast – 0.37 MMT (0.32 MMT in 2015)
- Penza Oblast – 0.34 MMT (0.26 MMT in 2015)
- Kursk Oblast – 0.31 MMT (0.27 MMT in 2015)
- Ulyanovsk Oblast – 0.26 MMT (0.17 MMT in 2015)
- Bashkortostan Republic – 0.22 MMT (0.24 MMT in 2015)
Source: FAS/Moscow based on Rosstat data for 2016 crop.
Soybeans
In 2016, soybean area increased by 100 THA to 2.2 million hectares, average soybean yield also
increased by almost 0.2 MT/HA, and reached 1.48 MT/HA. The 2016 Russian soybean crop reached an
historic high of 3.1 MMT (2.7 MMT in 2015), and the increase was due to increased crop in European
Russia due to an increased area and favorable-for yield weather. The Far East Federal District still
remains the leader in soybean production with 1.3 MMT crop (1.4 MMT in 2015), but its share
decreased from 52 percent in 2015 to 42 percent in 2016. The Central Federal District is the second

16
largest producer of soybeans with over 1.2 MMT crop (0.8 MMT in 2015). According to industry
analysts, the volume of soybean production in the Russian Far Eastern and its location distinguishes it
from the Russian European market. Given the location, soybeans produced in the Far East are either
exported to China or sold to crushers located in the Far East or Siberia. High soybean prices in the Far
East and the high cost of transporting soybeans from the Far East to Central European Russia make
soybeans from the Far East more expensive for processors than either soybeans from European Russia
or even imported soybeans. Export duties on soybeans were lifted on September 1, 2015. Soybean
exports to China have increased, and soybean production in the Far East remains profitable.
Source: Rosstat
Chart 9. Location of Soybean Production in Russia in 2016

17
Over 0.5 MMT (Dark Green)
- Amur Oblast – 0.92 (1.00 MMT in 2015)
From 0.2 to 0.5 MMT (Green)
- Belgorod Oblast – 0.48 MMT (0.32 MMT in 2015)
- Krasnodar Kray – 0.32 MMT (0.25 MMT in 2015)
- Kursk Oblast – 0.29 MMT (0.17 MMT in 2015)
- Primorskiy Kray – 0.28 MMT (0.26 MMT in 2015)
From 0.1 to 0.2 MMT (Light Green)
- Voronezh Oblast – 0.11 MMT (0.09 MMT in 2015)
Source: FAS/Moscow based on Rosstat data for 2016 crop.
Consumption:
Since the early 2000’s, Russian oilseeds consumption has steadily increased due to the growing demand
for protein feeds, such as meal, cake and, in the last 2-3 years, whole-fat feeds (semi-processed
soybeans). Although, vegetable oil still remains a major product of the Russian oilseeds industry.
FAS/Moscow forecasts that Russia’s domestic consumption of the three major oilseeds in MY 2017/18
will reach 16.90 MMT, a 2.5 percent increase compared with MY 2016/17 domestic consumption of
16.48 MMT. The domestic consumption total includes 10.92 MMT of sunflowerseed (2.4 percent
increase from last year), all due to increased crush from 10.10 MMT that FAS/Moscow estimated for
MY 2016/17 to 10.40 MMT. Food use domestic consumption will remain at the same level as last year:
0.22 MMT, but feed waste will decrease from 0.34 MMT to 0.3 MT due to increased crushers’ demand.
Consumption of soybeans will increase from 4.8 MMT in MY 2016/17 to 4.9 MMT in MY 2017/18, and
this will include crush of 4.35 MMT and direct feeds use of 0.55 MMT of beans (whole and semi-
crushed beans). Soybean crush and direct use are forecast to increase from last year by 50 TMT each.

18
Domestic consumption of rapeseed is forecast to increase from MY 2016/17 by 35 TMT to 1.08 in MY
2017/18.
Source: IKAR: http://soyanews.info/news/u_mezov_snova_defitsit_syrya.html and Rosstat
Estimates of total crushing capacity of Russia vary from 18 MMT to 21 MMT. According to the
Russian Union of Oils and Fats Producers and some industry analysts, Russia’s total capacity for
crushing oilseeds in 2016 was 18.0 MMT. Other analysts estimate Russia’s total crushing capacity at
20-21 MMT.8 The difference depends on the inclusion or exclusion of small crushing operations at
farms. Additionally, some analysts consider that due to the technological necessity to keep some
facilities inactive, Russia’s actual capacity to crush oilseeds is 18 MMT. However, even the minimum
estimate of 18 MMT exceeds Russia’s production of oilseeds by 12 percent.
There is no official information on the specification of oilseed crushing capacity. Most crushers work
with sunflowerseed, but many of the modern plants built in the last five years in European Russia can
switch between crushing sunflowerseed and rapeseed, and some have the ability to crush soybeans. The
Institute of Agricultural Marketing (IKAR) estimates the 2016/17 oilseeds crushing capacity in the
sunflowerseed producing regions at 18.76, that is 36 percent more than the sunflowerseed production in
these regions.
Some industry analysts separate crushing plants for sunflowerseed and rapeseed versus plants that can
crush soybeans. The actively working capacity of sunflowerseed and rapeseed plants (without small
crushers at farms) is estimated at 14.7 MMT, and the capacity of soybean crushing plants at 5.7 MMT.
The specialized soybean crushing plants are located in the North-West of Russia (Kaliningrad oblast),
8 http://www.agroinvestor.ru/analytics/news/25433-urozhay-maslichnykh-priblizilsya-k-16-mln-tonn/

19
and work primarily with imported soybeans, and in the Far East. In 2016/17 soybean crushing capacity
also increased in the Central FD (Belgorod Oblast).
In all of the sunflowerseed and rapeseed producing regions production has lagged behind the quickly
growing crushing capacity. According to IKAR, in MY 2016/17 crushing capacity in the South of
Russia (Southern and North Caucasus federal districts) approached 7 MMT, while the total production
of oilseeds in this region was 4 MMT, including 3.9 MMT of sunflowerseed. In the Center of European
Russia crushing capacity is also estimated at 7 MMT, and production of all oilseeds was 3.38 MMT,
including 2.7 MMT of sunflowerseed. In the Volga Valley FD crushing capacity was 4.2 MMT, and
production of oilseeds (all sunflowerseed) was 3.6 MMT. Even in Siberia and Ural crushing capacity
(616 TMT) exceeded production of sunflowerseed, which was 588 TMT.9
According to IKAR, 60 percent of crushing capacity in Russia is held by the top ten oilseeds crushing
holdings.10
The crushing capacity of these ten companies is estimated at approximately 12.9 MMT a
year.11
Companies included in this top ten list are:
- “Yug Rusi” – 2,700 TMT. The leader in terms of crushing capacity is the holding “Yug Rusi”
with nine plants in several different Russian provinces, mostly in the Central FD and in
Krasnodar Kray;
- “Sodrugestvo” – 2,688 TMT. “Sodruzhestvo,” is the largest processor of soybeans. In 2015/16,
three Sodruzhestvo plants processed 2.27 MMT of soybeans and 0.267 MMT of rapeseed. (One
facility crushed 0.62 MMT of soybeans a year, the second crushed 0.5 MMT of soybeans and
0.369 MMT of rapeseed a year, and the third crushed 1.67 MMT of soybeans a year. In
2015/2016 and in the first half of MY 2016/17, the plants worked at almost 100 percent capacity.
Sodruzhestvo’s oilseeds raw materials sourced domestically are seven percent for soybeans and
85 percent of rapeseed;
- “Efko” – 1,900 TMT capacity of all plants, of which 0.825 MMT are produced at plants that are
owned by Efko, including a sunflowerseed curshing facility in Belgorod (0.61 MMT a year) and
a sunflowerseed and rapeseed crushing facility in Taman (Krasnodar Kray) that can process
214,500 MT of sunflowerseed and rapeseed per year, mostly for export. Additionally, the Efko
company has developed a strategic business on processing with the “Alekseevskiy” soy complex,
the biggest soybean crusher in the Central FD with a capacity of 0.66 MMT per year;
- “Solnechnye Produkty” holding (in the group Bukyet) – 1,400 TMT a year. Solnechnye
Produkty’s crushing capacity is split between two enterprises in Saratov Oblast and one in
Krasnodar Kray;
- “Kazan Oils and Fats Combine” – 1,000 TMT capacity for crushing rapeseed and sunflowerseed.
Kazan Oils and Fats Comgine produces approximately 0.45 MMT vegetable oil and
approximately 380,000 of meal;
- “Sigma” holding company – 760 TMT. “Sigma” has two plants in Bashkortostan – one
modernized plans will process 345 TMT a year and another new plant will start working at full
capacity of 415 TMT in 2017;
- “Aston” – 750 TMT, located in Rostov oblast;
- “Nizhegorodskiy MEZ” – 600 TMT. Nizhegorodskiy MEZ’s crushing is split between two
plants, one in Orenburg Oblast and one in Volgograd Oblast;
9 Source: IKAR
10 http://www.efko.ru/press-centr/smi/10755/
11 http://www.efko.ru/press-centr/smi/10755/

20
- “Bunge, CIS”, in Voronezh Oblast – process 560 TMT of sunflowerseed per year; and
- “RusAgro Group” – 547 TMT. Rusagro has two oilseeds crushing enterprises: 410 TMT a year
of sunflowerseed in Samara Oblast and 137 TMT of soybeans a year in Primorskiy Kray
(Russian Far East)/
Some industry analysts consider that the rapid growth of crushing capacity in some provinces stimulated
production of oilseeds in Russia. Thus, according to some industry analysts, from 2015 through 2016
production of sunflowerseed increased in Belgorod Oblast from 157 TMT to 321 TMT, and production
of soybeans from 78 TMT to 320 TMT. This increase is primarily due to the development of two Yug
Rusi sunflowerseed crushing plants, one soybean complex and Efko’s sunflowerseed crushing plant.
In MY 2017/18, industry analysts forecast that two other plants (Cargill in Volgograd Oblast and plant
owned by the company Chernozemye” in Lipetsk Oblast) may increase Russia’s crushing capacity by
another 1 MT.
Industry analysts, consider that the margins are higher in those companies, which invest/contract
production of sunflowerseed, although this situation is not typical for oilseed crushing companies in
other countries.
Food Use Consumption:
Oilseed market analysts report that consumers’ interest in confectionary–type sunflowerseed and in
sunflowerseed with high oleic content is increasing. However, there are no data on production and
consumption of these products, and the share of confectionary type of sunflowerseed is less than one
percent of sunflowerseed production.
According to industry analysts, production of highly oleic sunflowerseed (with high content of Omega 3
acid) is also not significant, and area sown to this type of sunflowerseed is less than one percent of
sunflowerseed area. Crushers’ demand for this sunflowerseed is small because Russian consumers still
cannot afford to pay bonus prices for high oleic oil. Russian consumer interest in “healthy food”
increased in 2013-2014. However, in the last two years, along with the decline of average incomes of
Russian consumers, preferences have reverted to lower priced vegetable oil from “healthy” vegetable
oil.
Feed, Seed, Waste Consumption:
Livestock and poultry producers increased consumption of semi- and whole fat oilseeds in feeds.
However, there are no official data on such consumption.
Soybeans
According to Russian officials12
, Russia still does not produce enough soybeans to meet the demand of
the livestock and poultry industries, and up to 43% of soybeans are imported.13
Development of the
Russian poultry and livestock industries still depends, to a large extent, on imported protein ingredients,
vitamins, and additives. Soybean meal comprises a significant portion of protein feeds. According to
industry sources, in production of broilers, feeds comprise 70 percent of the cost of production.
12
Reports at the “Where the Margin Is” conference 13
http://kvedomosti.ru/news/rossiya-importiruet-43-soi.html

21
Soybean meal comprises approximately 20 percent of the volume of feeds for broilers, but in terms of
value, according to the Vice President of the International Program of Development of Poultry
Production,14
the value of soybean meal is equal to the value of the other 80 percent of feeds. Thus,
soybean meal accounts for approximately 35 percent of the cost of production of broilers.
Global production and supply of soybeans has been growing during the last five years, and despite the
strong and growing global demand, soybean prices in U.S. Dollars, have been stable. However, Ruble
volatility in 2014-2016 increased the cost of imported soybeans and soybean meal, which may result in
an increased cost of broiler production, which might not be balanced by the decreasing prices for the
grain component of feeds.
Trade:
Russian trade in oilseeds in MY 2017/18 will be influenced by several factors:
- Domestic production of oilseeds. Crushing capacity in Russia already exceeds oilseeds
production. Given that the high domestic demand for oilseeds is based on demand of large agro-
holding companies, crushers and feed consumers, domestic demand will prevail over other
factors that stimulate exports of raw oilseeds.
- Decreased export duties on sunflowerseed, rapeseed and zero export duty on soybeans could
stimulate exports of these oilseeds;
- Volatility of Russian Ruble. In MYs 2015/16 and the first half of MY 2016/17, Ruble volatility
was a very important factor that significantly influenced trade: a weak Ruble increases the
incentive to export seeds, while a stronger Ruble increases incentives to sell seeds domestically.
However, there is no direct correlation: the domestic demand for vegetable oil has almost
reached the ceiling (see Oils section), and crushers are trying to increase exports of vegetable oil.
A weak Ruble facilitates this goal. In the beginning of CY 2017, the Russian Ruble has
stabilized. There are economic symptoms that indicate that this stability may last through the
end of MY 2016/17, and possibly into MY 2017/18; and
- Increased domestic competition for oilseeds. In order to keep their margins high, domestic
crushers, wherever possible, try to decrease their purchase prices for sunflowerseed. In turn,
farmers try to increase their sales of sunflowerseed directly to exporters.
Thus, incentives for exports of sunflowerseed and rapeseed will not be high. However, given the
decreased export duties on sunflowerseed and rapeseed, exports may grow slightly. Exports of soybeans
from the Far East will continue to increase because of high demand from China. Moreover, crushing
capacity in the Russian Far East is still lower than production, and new facilities in Amur Oblast and in
Primorskiy Kray may not start working at full capacity in MY 2017/18.
FAS/Moscow forecasts Russia’s total exports of the three major oilseeds at 0.67 MMT, 20 percent up y-
o-y, and these exports will include 0.2 MMT of sunflowerseed and 0.4 MMT of soybeans. Russia will
also continue exports of niche crops, such as oil flax, Camelina and safflower, and exports of these crops
may add another 0.6-0.7 MMT to Russia’s oilseeds exports in MY 2017/18. Imports of oilseeds is
forecast to grow by 0.1 MMT to 2.36 MMT due to the forecast restoration of soybean imports from
estimated 2.0 MMT in MY 2016/17 to 2.1 MMT in MY 2017/18.
14
http://kvedomosti.ru/news/rossiya-importiruet-43-soi.html
22
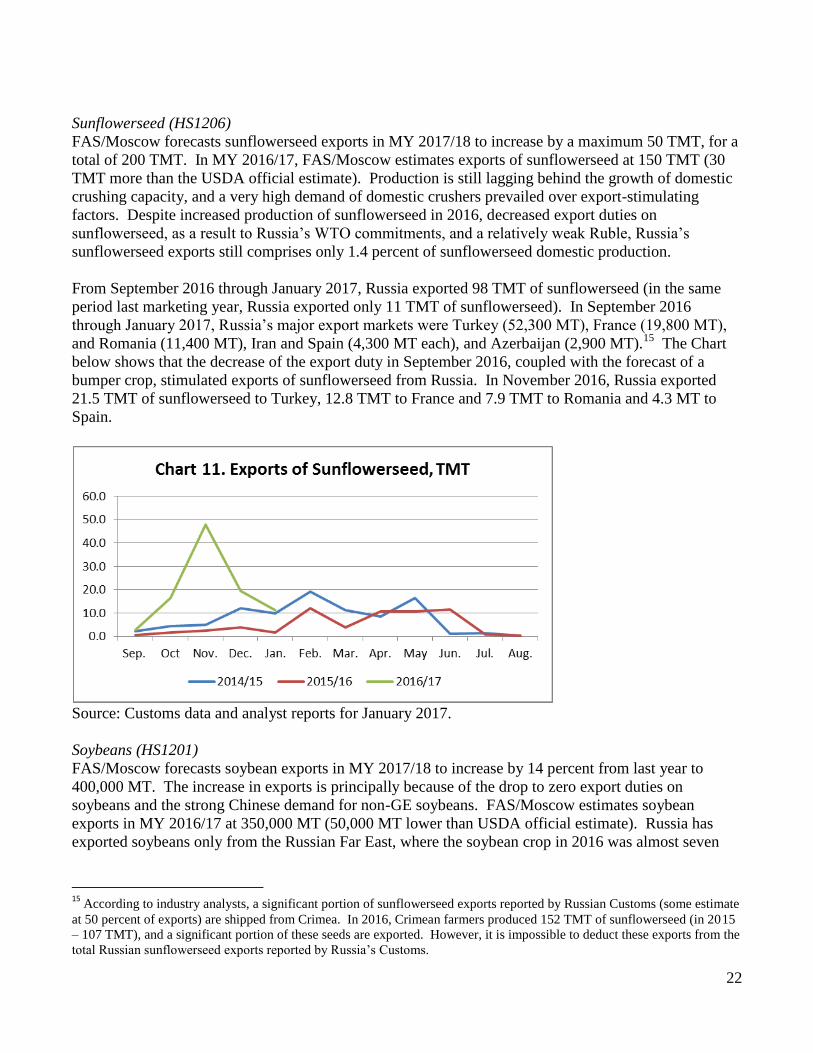
Sunflowerseed (HS1206)
FAS/Moscow forecasts sunflowerseed exports in MY 2017/18 to increase by a maximum 50 TMT, for a
total of 200 TMT. In MY 2016/17, FAS/Moscow estimates exports of sunflowerseed at 150 TMT (30
TMT more than the USDA official estimate). Production is still lagging behind the growth of domestic
crushing capacity, and a very high demand of domestic crushers prevailed over export-stimulating
factors. Despite increased production of sunflowerseed in 2016, decreased export duties on
sunflowerseed, as a result to Russia’s WTO commitments, and a relatively weak Ruble, Russia’s
sunflowerseed exports still comprises only 1.4 percent of sunflowerseed domestic production.
From September 2016 through January 2017, Russia exported 98 TMT of sunflowerseed (in the same
period last marketing year, Russia exported only 11 TMT of sunflowerseed). In September 2016
through January 2017, Russia’s major export markets were Turkey (52,300 MT), France (19,800 MT),
and Romania (11,400 MT), Iran and Spain (4,300 MT each), and Azerbaijan (2,900 MT).15
The Chart
below shows that the decrease of the export duty in September 2016, coupled with the forecast of a
bumper crop, stimulated exports of sunflowerseed from Russia. In November 2016, Russia exported
21.5 TMT of sunflowerseed to Turkey, 12.8 TMT to France and 7.9 TMT to Romania and 4.3 MT to
Spain.
Source: Customs data and analyst reports for January 2017.
Soybeans (HS1201)
FAS/Moscow forecasts soybean exports in MY 2017/18 to increase by 14 percent from last year to
400,000 MT. The increase in exports is principally because of the drop to zero export duties on
soybeans and the strong Chinese demand for non-GE soybeans. FAS/Moscow estimates soybean
exports in MY 2016/17 at 350,000 MT (50,000 MT lower than USDA official estimate). Russia has
exported soybeans only from the Russian Far East, where the soybean crop in 2016 was almost seven
15
According to industry analysts, a significant portion of sunflowerseed exports reported by Russian Customs (some estimate
at 50 percent of exports) are shipped from Crimea. In 2016, Crimean farmers produced 152 TMT of sunflowerseed (in 2015
– 107 TMT), and a significant portion of these seeds are exported. However, it is impossible to deduct these exports from the
total Russian sunflowerseed exports reported by Russia’s Customs.

23
percent lower y-o-y. Moreover, Russia has increased crush capacity in the Far East, and domestic
demand for soybeans there increased.
From September 2016 through January 2017, Russia exported 147,000 MT of soybeans compared with
208,100 MT in the same period y-o-y. In marketing year 2015/16, Russia exported 97 percent of
soybeans to China. In the first five months of MT 2016/17 Russia’s exports to China comprised only 84
percent (124,000 TMT), 10,000 MT were exported to the U.S., 8,900 MT were shipped to Iran, 2,100
MT were shipped to Azerbaijan, and 1,000 MT were shipped to South Korea. Small shipments to
several other countries account for the remaining 1,000 MT. Russia has not cultivated GE crops before
2016, and in mid-2016 cultivation of GE crops was officially banned. Thus, soybeans of Russian origin
are non-GE.
Domestic demand for soybeans remains strong due to stable demand from the poultry and swine
industries and a growth in domestic soybean crushing facilities. This demand is filled primarily by
soybeans that are produced in European Russia and by imported soybeans. Delivery of soybeans from
the Far East to European Russia, where Russian poultry and livestock industries are concentrated, is too
expensive. A good soybean crop in European Russia, stabilization (no increase) of development in the
Russian poultry and swine industries, trend in large livestock and poultry agro-holdings to increase
production of their own feeds, a big feed grains crop in 2016, coupled with the weak Ruble in the first
half of 2016/17 have created natural grounds for a slowdown in imports of soybeans in MY 2016/17.
SPS protective measures by the Russian authorities16
and strengthened control over imported GE crops,
specifically soybeans, also played an important role in curbing soybean imports to Russia in MY
2016/17. For these reasons, FAS/Moscow lowered its estimate of soybean imports in MY 2016/17 to
2.0 MMT compared with the official USDA estimate at 2.1 MMT, and forecast only a small increase in
imports to 2.1 MMT in MY 2017/18.
From September 2016 through January 2017, Russia imported 864.4 TMT17
of soybeans, including
435.4 TMT from Paraguay, 274.2 TMT from Brazil, 78.5 TMT from Croatia, 29.8 TMT from Canada,
and the other approximately 46.5 MMT were imported primarily from Argentina and Uruguay.18
Soybean imports from the U.S. have been banned since March 2016.
16
Russia Restricts Imports of US Corn and Soybeans_2-17-2016.pdf 17
Estimate of imports of soybeans is based on data from GTA in September – December 2016 and data from industry sources
for January 2017. 18
GTA and analysts’ statistical data on imports of soybeans from Argentina and Uruguay differ. Thus, GTA reports of
imports from Argentina, and does not report on imports from Uruguay, while analysts report on imports from Uruguay and
do not report on imports from Argentina.

24
Source: Customs data and analyst reports for January 2017.
Rapeseed (HS1205)
FAS/Moscow estimates exports of rapeseed in MY 2016/17 at 60 TMT. From July 2016 through
January 2017, Russia exported only 56.4 TMT of rapeseed. The main destinations were China (22.2
TMT) and Mongolia (8.4 TMT). Exports to Latvia, Germany, Lithuania and several other countries in
these months were less than 2 TMT each. At the same time Russia imported 53.2 TMT of rapeseed,
primarily from Kazakhstan. Russia also exported almost 140 TMT of rapeseed oil. Thus, the low
export duty did not appear to influence exports. Domestic crushing capacity continues to grow, and
exports of rapeseed oil are forecast to grow faster than exports of seed. FAS/Moscow forecasts exports
of rapeseed in MY 2017/18 at 70 TMT, due to increased production.
Linseed Crops for Oil (Crown Flax, Camelina) and Safflower (HS numbers 1204 and 1207)
Exports of linseed crops for oil were fanned in 2015/16 and 206/17 by the devaluation of the Ruble and
zero export duties on these niche crops. In 2016/17, traders continued developing foreign markets for
these crops, and exports of these crops in July 2016 through January 2017 reached 578 TMT (compared
with 420 TMT in the same period y-o-y). FAS/Moscow estimates exports of these crops in MY 2016/17
at over 850 TMT. Thus, exports of niche crops are much bigger than exports of both sunflowerseed and
rapeseed. Most of these niche crops are exported to Turkey, and to various EU countries, such as
Belgium, Latvia, and Poland. In MY 2016/17, Russia also started exporting these niche crops to China
and Vietnam.
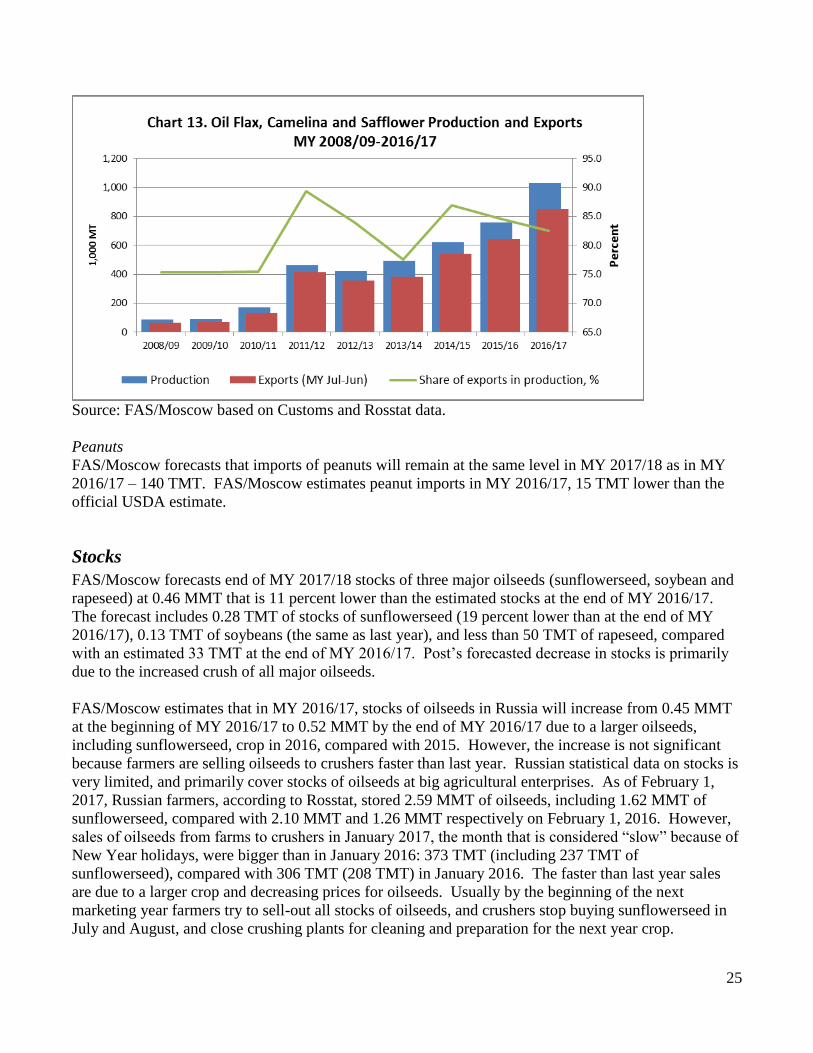
25
Source: FAS/Moscow based on Customs and Rosstat data.
Peanuts
FAS/Moscow forecasts that imports of peanuts will remain at the same level in MY 2017/18 as in MY
2016/17 – 140 TMT. FAS/Moscow estimates peanut imports in MY 2016/17, 15 TMT lower than the
official USDA estimate.
Stocks
FAS/Moscow forecasts end of MY 2017/18 stocks of three major oilseeds (sunflowerseed, soybean and
rapeseed) at 0.46 MMT that is 11 percent lower than the estimated stocks at the end of MY 2016/17.
The forecast includes 0.28 TMT of stocks of sunflowerseed (19 percent lower than at the end of MY
2016/17), 0.13 TMT of soybeans (the same as last year), and less than 50 TMT of rapeseed, compared
with an estimated 33 TMT at the end of MY 2016/17. Post’s forecasted decrease in stocks is primarily
due to the increased crush of all major oilseeds.
FAS/Moscow estimates that in MY 2016/17, stocks of oilseeds in Russia will increase from 0.45 MMT
at the beginning of MY 2016/17 to 0.52 MMT by the end of MY 2016/17 due to a larger oilseeds,
including sunflowerseed, crop in 2016, compared with 2015. However, the increase is not significant
because farmers are selling oilseeds to crushers faster than last year. Russian statistical data on stocks is
very limited, and primarily cover stocks of oilseeds at big agricultural enterprises. As of February 1,
2017, Russian farmers, according to Rosstat, stored 2.59 MMT of oilseeds, including 1.62 MMT of
sunflowerseed, compared with 2.10 MMT and 1.26 MMT respectively on February 1, 2016. However,
sales of oilseeds from farms to crushers in January 2017, the month that is considered “slow” because of
New Year holidays, were bigger than in January 2016: 373 TMT (including 237 TMT of
sunflowerseed), compared with 306 TMT (208 TMT) in January 2016. The faster than last year sales
are due to a larger crop and decreasing prices for oilseeds. Usually by the beginning of the next
marketing year farmers try to sell-out all stocks of oilseeds, and crushers stop buying sunflowerseed in
July and August, and close crushing plants for cleaning and preparation for the next year crop.

26
Policy
Russia’s WTO commitments (eliminating or decreasing export duties on oilseeds) have been gradually
implemented after the first year of Russia’s WTO membership (August 2012). The table below shows
the final export duties at the end of the transition period and export duties as of March 2017, the fourth
year of implementation of WTO commitments (Table 7). FAS/Moscow reported on the last changes to
export duties of sunflowerseed in a GAIN report.19
Table 7. Russia’s WTO Commitments:
HS
No
Name of
Product
Export
duty
before
WTO
accessi
on
Target
export
duty
Transition
al Period
Export
duty
from
Septemb
er 2013
through
August
2014
Export
duty
from
Septemb
er 2014
through
August
2015
Export
duty
beginnin
g
Septemb
er 2015
Export
duty
beginnin
g
Septemb
er 2016
120
1
Soybean 20
percent,
but not
less
than 35
Euro
per 1
MT
0 3 years 13.33
percent,
but not
less than
23.33
Euro per
1 MT
6.67
percent,
but not
less than
11.67
Euro per
1 MT
0 None
120
5
Rapeseed 20
percent,
but not
less
than 35
Euro
per 1
MT
6.5
percen
t, but
not
less
than
11.4
Euro
per 1
MT
3 years 15
percent,
but not
less than
27.13
Euro per
1 MT
11
percent,
but not
less than
19.26
Euro per
1 MT
6.5
percent,
but not
less than
11.4
Euro per
1 MT
6.5
percent,
but not
less than
11.4
Euro per
1 MT
120
6
Sunflowerse
ed
20
percent,
but not
less
than 30
Euro
per 1
MT
6.5
percen
t, but
not
less
than
9.75
Euro
per 1
MT
4 years 16.62
percent,
but not
less than
24.94
Euro per
1 MT
13.24
percent,
but not
less than
19.88
Euro per
1 MT
9.88
percent,
but not
less than
14.81
Euro per
1 MT
6.5
percent,
but not
less than
9.75
Euro per
1 MT
19
Russian Agricultural Policy and Situation Bi-Weekly Update_9-16-2016.pdf

27
120
7
50
Mustard
seed
10
percent,
but not
less
than 25
Euro
per 1
MT
0 1 year 0 None None None
Source: Russian Customs
Russia supports programs of selection and breeding of planting seeds of sunflowerseed and soybeans
(see section Planting Seeds, above). These subsidies are relatively small, and the results are not
expected in MY 2017/18.
Marketing
Prices of major oilseeds in MY 2016/17 are influenced by four factors: volume of production, crushers
demand, export demand and Ruble exchange rate. Sunflowerseed prices in Rubles have been declining
due to the bumper crop. By March 10, 2017 prices had declined nearly 30 percent (in Rubles) from July
2017 prices. Rapeseed prices were more stable, and were supported by lower than last year crop. By
March 10, 2017, rapeseed prices even increased by three percent from the beginning of July 2016.
Soybean prices peaked in August 2016 and then declined as sharply as they had peaked, to the level of
May 2016. Since that sharp decline, they have continued declining at a slow pace. By March 3, 2017,
the level of soybean prices in the domestic market was 16 percent lower than in July 2016. The peak in
soybean prices in August was caused by both uncertainty about the soybean crop in European Russia
and the VPSS’s measures that threatened to curb imports of soybeans. A good soybean crop in
European Russia, coupled with Russia’s bumper crop of feed quality grain, and continuation of imports
of soybeans, have stabilized and then decreased soybean prices. However, according to industry
analysts, domestic production of all oilseeds still remains profitable despite the decreased prices due to
the following factors:
- Increased Russian crushing capacity has increased domestic demand for raw materials;
- The step-by-step decrease in export duties on sunflowerseed, rapeseed and zero export duty on
soybeans (Table 7), along with the weak Ruble in MY 2015/16 created incentives for exports of
oilseeds from Russia.
In fall 2016, the Ruble exchange rate stabilized, and this lowered the incentive to export oilseeds. It also
contributed to a decline in the domestic prices for oilseeds. According to industry analysts, the margin
of oilseed producers decreased in MY 2016/17, but this margin is still higher than the margins seen in
grain production, and still favors oilseed producers. According to analysis of IKAR, the “net margin”
(in Rubles per hectare) from the production of sunflowerseed in the South of European Russia decreased
from approximately 42,000 Rubles ($656) per hectare in MY 2015/16 to approximately 32,000 Rubles
($500) per hectare in MY 2016/17. However, this margin was still higher than the margin from
production of wheat, barley and corn in the South. In Central European Russia the margin from
production of sunflowerseed also decreased y-o-y, but was higher than the margin from production of all
other crops, such as wheat, barley, corn, soybeans, and sugar beets. The net margin: from production of
soybeans in the South was almost the same as last year, approximately 19,000 Rubles ($267) per

28
hectare, and was the third lowest margin (only margins from production of barley and corn were lower).
In Central European Russia the margin from production of soybeans was over 31,000 Rubles, higher
than in 2015/16, and soybeans were the second most profitable crop after sunflowerseed in this region20
.
On the other hand, for processors, stable procurement prices along with the decreasing demand for
vegetable oils in the foreign markets, and decreasing prices for these products both in Rubles and in U.S.
Dollars, will decrease processors’ returns.
Source: ProZerno
20
Source: Presentation of IKAR at the Conference “Where the Margin Is” in February 2017:
http://www.ikar.ru/lenta/603.html

29
Source: ProZerno
Source: ProZerno

30
Source: ProZerno
PSD Tables for Oilseeds
Oilseed, Sunflowerseed 2015/2016 2016/2017 2017/2018 Market Begin Year Sep 2015 Sep 2016 Sep 2017
Russia USDA Official New Post USDA Official New Post USDA Official New Post
Area Planted 0 6921 0 7481 0 7400
Area Harvested 6454 6454 6962 7191 0 7150
Beginning Stocks 135 135 255 255 0 353
Production 9173 9173 10536 10858 0 11000
MY Imports 121 121 50 50 0 50
MY Imp. from U.S. 0 0 0 0 0 0
MY Imp. from EU 0 0 0 0 0 0
Total Supply 9429 9429 10841 11163 0 11403
MY Exports 104 104 120 150 0 200
MY Exp. to EU 10 10 10 10 0 10
Crush 8550 8550 9850 10100 0 10400
Food Use Dom. Cons. 220 220 220 220 0 220
Feed Waste Dom. Cons. 300 300 300 340 0 300
Total Dom. Cons. 9070 9070 10370 10660 0 10920
Ending Stocks 255 255 351 353 0 283
Total Distribution 9429 9429 10841 11163 0 11403
(1000 HA) ,(1000 MT)
Oilseed, Soybean 2015/2016 2016/2017 2017/2018 Market Begin Year Sep 2015 Sep 2016 Sep 2017
Russia USDA Official New Post USDA Official New Post USDA Official New Post
Area Planted 2000 2000 2200 2228 0 2300
Area Harvested 2082 2082 2094 2118 0 2200
Beginning Stocks 109 109 146 146 0 131

31
Production 2707 2707 3099 3135 0 3200
MY Imports 2336 2336 2100 2000 0 2100
MY Imp. from U.S. 486 350 300 0 0 300
MY Imp. from EU 0 0 0 0 0 0
Total Supply 5152 5152 5345 5281 0 5431
MY Exports 456 456 400 350 0 400
MY Exp. to EU 0 0 0 0 0 0
Crush 4050 4050 4300 4300 0 4350
Food Use Dom. Cons. 0 0 0 0 0 0
Feed Waste Dom. Cons. 500 500 500 500 0 550
Total Dom. Cons. 4550 4550 4800 4800 0 4900
Ending Stocks 146 146 145 131 0 131
Total Distribution 5152 5152 5345 5281 0 5431
(1000 HA) ,(1000 MT)
Oilseed, Rapeseed 2015/2016 2016/2017 2017/2018 Market Begin Year Jul 2015 Jul 2016 Jul 2017
Russia USDA Official New Post USDA Official New Post USDA Official New Post
Area Planted 925 925 950 978 0 1000
Area Harvested 897 897 915 898 0 910
Beginning Stocks 57 57 51 51 0 33
Production 1001 1001 997 997 0 1100
MY Imports 40 40 70 60 0 60
MY Imp. from U.S. 0 0 0 0 0 0
MY Imp. from EU 3 3 0 0 0 0
Total Supply 1098 1098 1118 1108 0 1193
MY Exports 32 32 50 60 0 70
MY Exp. to EU 5 5 5 5 0 5
Crush 990 990 990 990 0 1050
Food Use Dom. Cons. 0 0 0 0 0 0
Feed Waste Dom. Cons. 25 25 25 25 0 25
Total Dom. Cons. 1015 1015 1015 1015 0 1075
Ending Stocks 51 51 53 33 0 48
Total Distribution 1098 1098 1118 1108 0 1193
(1000 HA) ,(1000 MT)
Oilseed, Peanut 2015/2016 2016/2017 2017/2018 Market Begin Year Oct 2015 Oct 2016 Oct 2017
Russia USDA Official New Post USDA Official New Post USDA Official New Post
Area Planted 0 0 0 0 0 0
Area Harvested 0 0 0 0 0 0
Beginning Stocks 4 4 5 5 0 5
Production 0 0 0 0 0 0
MY Imports 156 156 160 140 0 145
MY Imp. from U.S. 2 2 2 2 0 0
MY Imp. from EU 0 0 0 0 0 0
Total Supply 160 160 165 145 0 150
MY Exports 0 0 0 0 0 0
MY Exp. to EU 0 0 0 0 0 0
Crush 0 0 0 0 0 0
Food Use Dom. Cons. 155 155 160 140 0 145
Feed Waste Dom. Cons. 0 0 0 0 0 0
Total Dom. Cons. 155 155 160 140 0 145
Ending Stocks 5 5 5 5 0 5
Total Distribution 160 160 165 145 0 150

32
(1000 HA) ,(1000 MT)
MEALS - Meal, Sunflowerseed
- Meal, Soybean
- Meal, Rapeseed
- Meal, fish
Production
FAS/Moscow forecasts total crush of the three major oilseed crops at 15.8 MMT in MY 2017/18, which
is a 2.7 percent increase from the estimated 15.39 MMT in MY 2016/17. The factors that will motivate
the further increase (although slow) in the crushing and production of meal are the following:
- Crushing capacity in Russia continues to increase (see Consumption paragraphs in the OILSEED
sector of the report);
- Domestic demand in protein feeds remains strong; and
- Problems with imports of soybean meal may continue in MY 2017/18.
FAS/Moscow’s forecast for MY 2017/18 includes crush of 10.4 MMT for sunflowerseed (10.1 MMT in
MY 2016/17), 4.35 MMT for soybeans (4.3 MMT in MY 2016/17), and 1.05 MMT for rapeseed (0.99
MMT in MY 2016/17). Russia’s total domestic production of the three major oilseed meals will
increase to 8.29 MMT in MY 2017/18 (estimate for MY 2016/17 is 8.13 MMT), including 4.27 MMT
of sunflowerseed meal (4.15 MMT in MY 2016/17), 3.4 MMT of soybean meal (3.39 MMT in MY
2016/17), and 0.62 MMT of rapeseed meal (0.59 MMT in MY 2016/17).
Table 8. Russia: Consolidated PSD Forecast for Major Meals for MY 2017/18, TMT
POST MY 2017/18 Sunflowerseed Soybean Rapeseed Fish Meal TOTAL
Crush 10,400 4,350 1,050 570 16,370
Extr. Rate, 999.9999 0.411 0.782 0.591 0.263
Beginning Stocks 294 65 10 4 373
Production 4,270 3,400 620 150 8,440
MY Imports 5 300 10 20 335
MY Imp. from U.S. 0 10 0 0 10
MY Imp. from EU 5 150 0 0 155
Total Supply 4,569 3,765 640 174 9,148
MY Exports 1,700 400 150 50 2,300
MY Exp. to EU 800 100 150 0 1,050
Industrial Dom. Cons. 0 0 0 0 0
Food Use Dom. Cons. 0 0 0 0 0
Feed Waste Dom. Cons. 2,600 3,300 480 120 6,500
Total Dom. Cons. 2,600 3,300 480 120 6,500
Ending Stocks 269 65 10 4 348

33
Total Distribution 4,569 3,765 640 174 9,148
Note: The above table is composed of PSD forecast for each meal despite differing marketing years.
Russia produces and trades fish meal as well, although Russia’s production of fish meal is small.
FAS/Moscow estimates domestic production of fish meal in MY 2016/17 at 145,000 MT, imports at
20,000 MT, and exports at 55,000 MT. These estimates are the same as USDA’s estimates. Fish meal
production, imports and exports have been stagnating over the last several years. There are almost no
reliable statists on production of fish meal in Russia. The demand in fish meal has been growing in
Russia along with attempts to develop the domestic aquaculture industry based on feeding fish meal.
However, statistical data on fish catch and exports are not reliable, because significant volumes of fish
are shipped abroad and are not reported. Thus, FAS/Moscow forecasts a slight increase in production of
fish meal in MY 2017/18 to 150,000 MT. Imports are forecast to remain the same as in MY 2016/17,
while exports are forecast to increase to 60,000 MT.
Feed Consumption
FAS/Moscow forecasts Feed Waste Domestic Consumption of oilseed meals at 6.38 MMT in MY
2017/18, compared to the FAS/Moscow estimate of 6.14 MMT in MY 2016/17, and USDA’s estimate
of oilseed meal consumption in MY 2016/17 at 6.32 MMT. The difference between the Post estimate
and the USDA estimate is due to the adjustment to the imports of soybean meal. FAS/Moscow’s
estimates of soybean meal imports are based on Customs data for the period from September 2016 to
January 2017, and estimates for the MY 2016/17 are 100,000 MT compared with the USDA’s estimate
of 450,000 MT.
Chart 18 shows the change in the domestic consumption of major meals in Russia in the last ten years
and the forecast for MY 2017/18. The data are in actual volumes for different meals.

34
Source
: FAS/Moscow based on PSD data
Table 9 presents the aggregated view on feed consumption in Russia in MY 2015/16, MY 2016/17
(estimate) and forecast for MY 2017/18 in soybean meal equivalent (SME). The estimates and forecasts
are based on the assumption that Feed Domestic Consumption category equals the Feed Waste Domestic
Consumption. Data for grains consumption (Feed and Residual) are for marketing years 2015/16 and
2016/17, because FAS/Moscow’s forecast for grains for MY 2017/17 will be available only in April
2017.
Table 9. Russia: Domestic Feeds Consumption in MYs 2015/16, 2016/17, and Forecast for 2017/18,
TMT, Actual and in Soybean Meal Equivalent Feeds Domestic Consumption (actual) Feeds Domestic
Consumption in SME
MY
2015/16
MY
2016/
17
(est)
MY
2017/18
(forecast)
MY
2015
/16
MY
2016
/17
(est)
MY
2017/
18
(forec
ast)
Soybe
an
Meal
Conve
rsion
Factor
Meals
Sunflowersee
d Meal
2,250 2,510 2,600 2,12
4
2,37
0
2,455 0.944
2
Soybean
Meal
3,150 3,150 3,300 3,15
0
3,15
0
3,300 1.000
0
Rapeseed
Meal
420 480 480 299 342 342 0.711
5

35
Fish Meal 90 110 120 130 159 173 1.445
0
TOTAL 5,70
3
6,02
0
6,270
Seeds
Sunflowerse
ed
300 340 300 156 177 156 0.519
3
Soybeans 500 500 550 400 400 440 0.800
0
Rapeseed 25 25 25 10 10 10 0.409
1
TOTAL 566 587 606
Grain
Corn 7,800 8,100 1,28
4
1,33
3
0.164
6
Wheat 14,00
0
16,00
0
3,17
9
3,63
4
0.227
1
Barley 8,900 9,200 2,13
2
2,20
4
0.239
6
Rye 225 300 56 75 0.250
0
Oats 3,000 3,050 875 890 0.291
7
Millet 320 330 73 76 0.229
2
TOTAL 7,60
0
8,21
2
FAS/Moscow estimates that consumption of meal in SME in Russia increased in MY 2016/17, and
forecasts that this consumption will continue growing in 2017/18. Consumption of grain, as a source of
energy also increased. However, there are no official data on the balance between protein meal and
energy in feeding different types of animal and livestock. According to the recent FAS/Moscow report
on poultry production,21
on average, Russian poultry producers in 2015 and 2016 increased the portion
of grain in mixed feeds. However, leaders in the poultry industry continue using feeds according to the
best feeding practices, but most of them have their own feed mills and produce feeds from raw materials
that they grow themselves. According to Rosstat, 14 MMT of compound feeds were produced
specifically for the poultry industry in 2015, and the lion’s share, approximately 10 MMT, were
produced by companies from the list of the top 20 broiler producers.
There are no official data on the average composition of feeds for different industries. In 2016,
development of the poultry industry slowed and consumer demand for poultry stabilized. For some
poultry producers, the price of ingredients became the major factor in choosing feeding formulas. In
MY 2015/16 and 2016/17, the supply of fodder grains increased and prices decreased. However, the
21
https://gain.fas.usda.gov/Recent%20GAIN%20Publications/Poultry%20and%20Products%20Semi-
annual_Moscow_Russian%20Federation_2-16-2017.pdf
36
expenses for other ingredients, such as soy, vitamins and minerals, as well as the cost of production of
compound feeds may increase in MY 2017/18, and poultry producers may continue using more grain in
feeds than required by optimal feeding formulas.
Some big Russian meat companies that have poultry, swine and cattle operations support development
of domestic production of feed ingredients. Thus, two lysine plants were recently opened in Belgorod22
and in Volgograd.23
The two new plants have enough capacity to cover the needs of the whole broiler
industry.24
According to industry contacts however, problems with the quality of lysine from one of the
new plants reportedly hurt the performance of its clients in the first half of 2016. Regardless of this
hurdle, if production costs of compound feeds grow due to prices of imported ingredients, the
expectation for 2017 is that low prices for local grain, oilseeds and other ingredients can improve
margins for some poultry producers.
The absence of highly efficient competitors in the market allows local companies to maintain a
relatively high ratio of low priced domestic forage grains in feeds, even at the expense of operational
efficiency. The average feed conversion ratio (FCR), 1.85-1.87,25
allows the domestic industry to win
market share over current importers. As internal competition becomes more intensive, broiler
companies that have a feed production component in their business structure (so called “vertically
integrated agricultural corporations”) will take the most advantage of the situation in the feeds market.
If prices for proteins increase, this will contribute to faster consolidation in the broiler production
sector.26
Trade
Imports
FAS/Moscow forecasts imports of the three major oilseed meals (sunflowerseed, soybeans, and
rapeseed) in MY 2017/18 at 315 TMT, a slight recovery from the estimated 125 TMT’s import of
oilseed meal in 2016/17, which was the lowest in the last five years. In MY 2017/18, most of imported
oilseed meal, as forecast, will be soybean meal. Imports of sunflower meal and rapeseed meal are
sporadic and very small. In addition FAS/Moscow forecast imports of 0.15 MMT of fish meal in MY
2017/18, the same level as in MY 2016/17.
In MY 2016/17, soybean meal imports were influenced primarily by the Russian anti-GE policy.
Despite high demand in soybean meal, and removal of import duties in 2012 as a result of WTO
accession, soymeal imports in MY 2016/17 dropped significantly. FAS/Moscow estimates MY 2016/17
soybean meal imports at 100 TMT, 350 TMT lower than the USDA’s official estimate. The weak Ruble
at the beginning of MY 2016 played some role in the decrease of imports. However, the main role in
cutting soybean meal imports belongs to non-market factors, such as the tightened registration
requirements for GE lines that may occur in feeds, and registration of feeds that may contain GE
22
Leading Poultry producer "Prioskolye" invested in lysine production plant in Belgorod Region. The plant started operations
in September 2015. 23
LLC “Megamix” http://megamix.ru/contacts/ 24
Article in Russian : Amino Acids Market in Russia Outlook http://www.agritimes.ru/articles/1913/tendencii-rossijskogo-
rynka-aminokislot/ 25
FCR Sources: Ministry of Agriculture; Rosptitsesouz. 26
Soure: FAS/Moscow GAIN report on poultry

37
ingredients.27
Russia requires that soybean meal includes only registered lines of GE soybeans, and at
the same time tightened requirements for registration of GE lines and GE feeds, and significantly
improved mechanisms and equipment for testing presence of GE ingredients in feeds.28
These strict
requirements, coupled with a good domestic crop of feed quality grains and oilseeds, including
soybeans, and continued imports of soybeans for crushing, caused a significant decrease in imports of
soybean meal in MY 2016/17. Production of poultry and swine slowed down in 2016, and
FAS/Moscow forecast that this trend will continue through 2017.29
Due to the above mentioned factors
imports of soybean meal drastically decreased in the first half of MY 2016/17, and is unlikely to be
restored by the end of MY 2016/17. FAS/Moscow estimates soybean meal imports in MY 2016/17 at
100 TMT. From September 2016 through January 2017, Russia imported 29 TMT of soybean meal.
This is only 27 percent of the volume of imports during the same period in MY 2015/16. The small
quantities of soybean meal imports during this period came primarily from the EU countries: Spain,
Latvia, Norway, and Germany.
Some restoration of imports of soybean meal in MY 2017/18 is possible if Russia eases the registration
of GE lines, especially stacked lines, if production of grain and oilseeds in Russia decreases, or if
demand for high quality and efficient protein feeds from Russia’s poultry industry increases. Given
these factors, FAS/Moscow forecasted imports of soybean meal in MY 2017/18 to triple from an
estimated level of 100 TMT in 2016/17 to 300 TMT, although these imports still will be lower than
imports in MY 2015/16.
Exports
Russia increased sunflowerseed production in 2016, and increased crushing. Meanwhile, domestic
demand for sunflowerseed meal was flat, and Russia increased exports of sunflowerseed meal from 1.2
MMT in MY 2015/16 to the estimated 1.6 MMT in MY 2016/17 (the same as USDA estimate).
FAS/Moscow forecasted exports of sunflowerseed meal in MY 2017/18 at the same level as in MY
2017/18 – 1.6 MMT. From September 2016 through January 2017, Russia exported 726 TMT of
sunflowerseed meal that is 24 percent more than in the same period last year. The main customers of
Russian sunflowerseed meal in this period were Turkey (299 TMT), Latvia (200 TMT), Denmark (51
TMT), Italy (40 TMT), Cyprus (19 TMT) and Azerbaijan (14 TMT). Smaller shipments (from 1 TMT
to 6 TMT were sent to over 15 countries. FAS/Moscow forecast sunflowerseed meal exports to increase
in MY 2017/18 to 1.7 MMT.
Considering that Russia’s domestic production of soybeans will continue increasing, and that Russia will
ease terms of imports of soybeans for crushing, FAS/Moscow forecasts that soybean meal exports will
slightly increase to 0.4 MMT in MY 2017/18. FAS/Moscow estimates soybean meal exports in MY
2016/17 at 350 TMT, 28 percent less than in MY 2015/16. Post assumes that the sharp increase of
soybean meal exports in MY 2015/16 was primarily due to the weak Ruble and significant imports of
27
For more information see FAS/Moscow GAIN report
https://gain.fas.usda.gov/Recent%20GAIN%20Publications/Agricultural%20Biotechnology%20Annual_Moscow_Russian%
20Federation_12-9-2016.pdf 28
For more information on Russia’s requirements see FAS/Moscow GAIN report https://gain.fas.usda.gov/Recent%20GAIN%20Publications/Agricultural%20Biotechnology%20Annual_Moscow_Russian%20Federation_12-9-2016.pdf 29
For more information see FAS/Moscow GAIN reports: https://gain.fas.usda.gov/Recent%20GAIN%20Publications/Poultry%20and%20Products%20Semi-annual_Moscow_Russian%20Federation_2-16-2017.pdf and

38
soybean. The major crusher of imported soybeans is a company located in Kaliningrad Oblast, and this
company not only supplies soybean meal domestically, but also exports soybean meal. From September
2016 through January 2017 (5 months of MY 2016/17), Russia exported 126 TMT of soybean meal that
is 28 percent less than in the same period last year. The main importers of Russia’s soybean meal during
this period were Netherlands (24 TMT), Poland (22 TMT), Norway (20 TMT), Uzbekistan (14 TMT),
and Denmark (12 TMT).
Russia also exports rapeseed meal. In MY 2016/17, rapeseed meal exports slowed down due to
decreased production of rapeseed. From July 2016 through January 2017, Russia exported 84 TMT of
rapeseed meal that is 32 percent less than in the same period last year. Most exports went to EU
countries. Assuming that this trend continues through the rest of MY 2016/17, FAS/Moscow estimated
Russia’s rapeseed meal exports in MY 2016/17 at approximately 130 TMT. FAS/Moscow forecast that
rapeseed production will recover in 2017, and Russia will restore rapeseed meal exports to 150 TMT.
Source
: FAS/Moscow calculated based on PSD data.
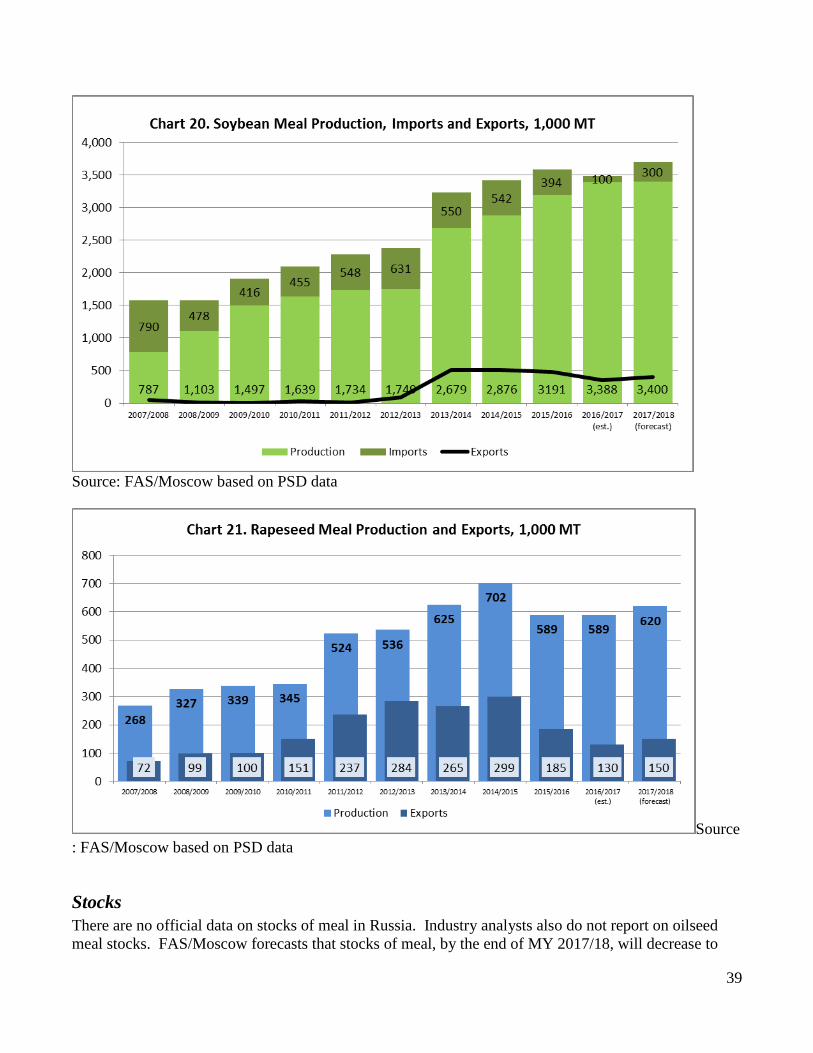
39
Source: FAS/Moscow based on PSD data
Source
: FAS/Moscow based on PSD data
Stocks
There are no official data on stocks of meal in Russia. Industry analysts also do not report on oilseed
meal stocks. FAS/Moscow forecasts that stocks of meal, by the end of MY 2017/18, will decrease to

40
348 TMT from the estimated stocks of meal at 373 TMT at the end of MY 2016/17. The forecasted
stocks of meal at the end of MY 2017/18 will include 269 TMT of sunflowerseed meal, 65 TMT of
soybean meal, 10 TMT of rapeseed meal and 4 TMT of fish meal.
PSD Tables for Meal
Meal, Sunflowerseed 2015/2016 2016/2017 2017/2018 Market Begin Year Sep 2015 Sep 2016 Sep 2017
Russia USDA Official New Post USDA Official New Post USDA Official New Post
Crush 8550 8550 9850 10100 0 10400
Extr. Rate, 999.9999 0.4105 0.4105 0.4106 0.4109 0 0.4106
Beginning Stocks 193 193 249 249 0 294
Production 3510 3510 4044 4150 0 4270
MY Imports 7 7 5 5 0 5
MY Imp. from U.S. 0 0 0 0 0 0
MY Imp. from EU 5 5 5 5 0 5
Total Supply 3710 3710 4298 4404 0 4569
MY Exports 1211 1211 1600 1600 0 1700
MY Exp. to EU 675 675 800 700 0 800
Industrial Dom. Cons. 0 0 0 0 0 0
Food Use Dom. Cons. 0 0 0 0 0 0
Feed Waste Dom. Cons. 2250 2250 2500 2510 0 2600
Total Dom. Cons. 2250 2250 2500 2510 0 2600
Ending Stocks 249 249 198 294 0 269
Total Distribution 3710 3710 4298 4404 0 4569
(1000 MT) ,(PERCENT)
Meal, Soybean 2015/2016 2016/2017 2017/2018 Market Begin Year Sep 2015 Sep 2016 Sep 2017
Russia USDA Official New Post USDA Official New Post USDA Official New Post
Crush 4050 4050 4300 4300 0 4350
Extr. Rate, 999.9999 0.7879 0.7879 0.7879 0.7879 0 0.7816
Beginning Stocks 121 121 77 77 0 65
Production 3191 3191 3388 3388 0 3400
MY Imports 394 394 450 100 0 300
MY Imp. from U.S. 10 10 10 10 0 10
MY Imp. from EU 150 150 150 80 0 150
Total Supply 3706 3706 3915 3565 0 3765
MY Exports 479 479 450 350 0 400
MY Exp. to EU 100 100 100 100 0 100
Industrial Dom. Cons. 0 0 0 0 0 0
Food Use Dom. Cons. 0 0 0 0 0 0
Feed Waste Dom. Cons. 3150 3150 3360 3150 0 3300
Total Dom. Cons. 3150 3150 3360 3150 0 3300
Ending Stocks 77 77 105 65 0 65
Total Distribution 3706 3706 3915 3565 0 3765
(1000 MT) ,(PERCENT)
Meal, Rapeseed 2015/2016 2016/2017 2017/2018 Market Begin Year Jul 2015 Jul 2016 Jul 2017
Russia USDA Official New Post USDA Official New Post USDA Official New Post
Crush 990 990 990 990 0 1050

41
Extr. Rate, 999.9999 0.5949 0.5949 0.5949 0.5949 0 0.5905
Beginning Stocks 6 6 11 11 0 10
Production 589 589 589 589 0 620
MY Imports 21 21 20 20 0 10
MY Imp. from U.S. 0 0 0 0 0 0
MY Imp. from EU 1 1 1 1 0 0
Total Supply 616 616 620 620 0 640
MY Exports 185 185 150 130 0 150
MY Exp. to EU 150 150 150 120 0 150
Industrial Dom. Cons. 0 0 0 0 0 0
Food Use Dom. Cons. 0 0 0 0 0 0
Feed Waste Dom. Cons. 420 420 460 480 0 480
Total Dom. Cons. 420 420 460 480 0 480
Ending Stocks 11 11 10 10 0 10
Total Distribution 616 616 620 620 0 640
(1000 MT) ,(PERCENT)
Meal, Fish 2015/2016 2016/2017 2017/2018 Market Begin Year Oct 2015 Oct 2016 Oct 2017
Russia USDA Official New Post USDA Official New Post USDA Official New Post
Catch For Reduction 550 550 550 550 0 570
Extr. Rate, 999.9999 0.2636 0.2636 0.2636 0.2636 0 0.2632
Beginning Stocks 2 2 4 4 0 4
Production 145 145 145 145 0 150
MY Imports 12 12 20 20 0 20
MY Imp. from U.S. 0 0 0 0 0 0
MY Imp. from EU 0 0 0 0 0 0
Total Supply 159 159 169 169 0 174
MY Exports 65 65 55 55 0 50
MY Exp. to EU 0 0 0 0 0 0
Industrial Dom. Cons. 0 0 0 0 0 0
Food Use Dom. Cons. 0 0 0 0 0 0
Feed Waste Dom. Cons. 90 90 110 110 0 120
Total Dom. Cons. 90 90 110 110 0 120
Ending Stocks 4 4 4 4 0 4
Total Distribution 159 159 169 169 0 174
(1000 MT) ,(PERCENT)
OILS - Oil, Sunflowerseed
- Oil, Soybean,
- Oil, Rapeseed
- Oil, Palm
Production
Sunflowerseed remains the primary oilseed crop in Russia, and the main product for crushers is still
vegetable oil, while meal remains a secondary product. Sunflowerseed oil dominates domestic human
consumption of vegetable oils. FAS/Moscow forecasts Russia’s total vegetable oil production in MY
2017/18 at 5.49 MMT MMT, 2.4 percent, or 0.13 MMT, more than in MY 2016/17. The increase is due
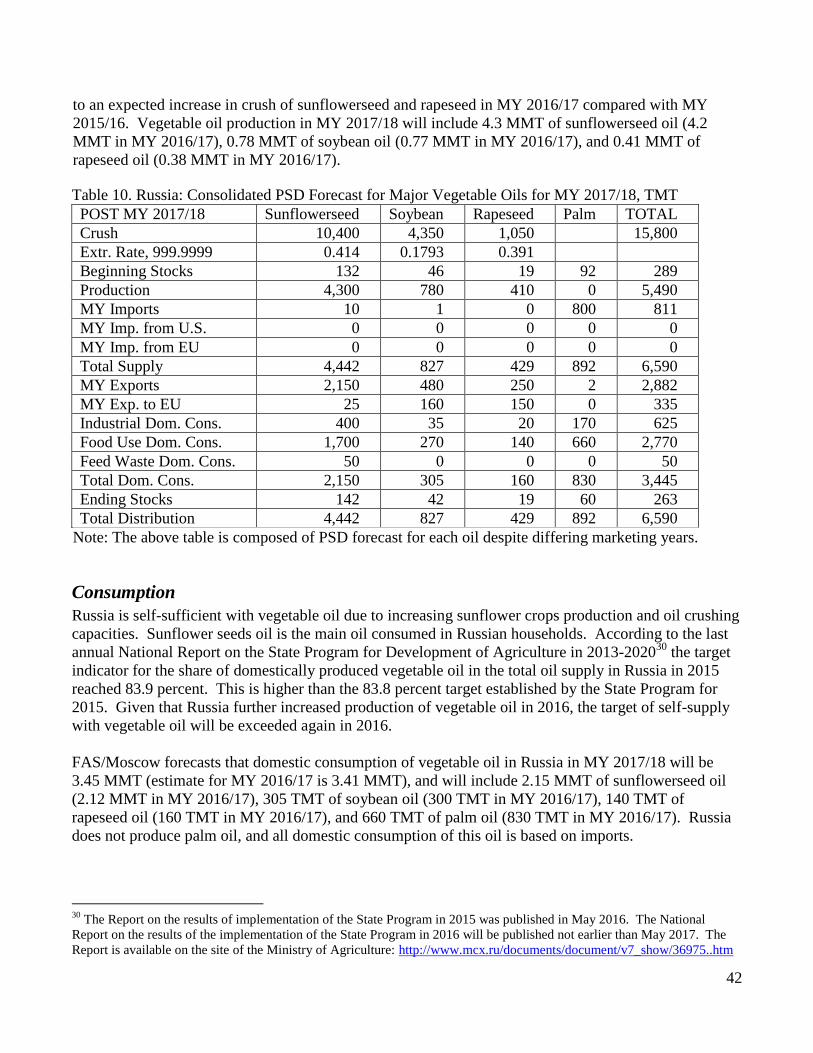
42
to an expected increase in crush of sunflowerseed and rapeseed in MY 2016/17 compared with MY
2015/16. Vegetable oil production in MY 2017/18 will include 4.3 MMT of sunflowerseed oil (4.2
MMT in MY 2016/17), 0.78 MMT of soybean oil (0.77 MMT in MY 2016/17), and 0.41 MMT of
rapeseed oil (0.38 MMT in MY 2016/17).
Table 10. Russia: Consolidated PSD Forecast for Major Vegetable Oils for MY 2017/18, TMT
POST MY 2017/18 Sunflowerseed Soybean Rapeseed Palm TOTAL
Crush 10,400 4,350 1,050 15,800
Extr. Rate, 999.9999 0.414 0.1793 0.391
Beginning Stocks 132 46 19 92 289
Production 4,300 780 410 0 5,490
MY Imports 10 1 0 800 811
MY Imp. from U.S. 0 0 0 0 0
MY Imp. from EU 0 0 0 0 0
Total Supply 4,442 827 429 892 6,590
MY Exports 2,150 480 250 2 2,882
MY Exp. to EU 25 160 150 0 335
Industrial Dom. Cons. 400 35 20 170 625
Food Use Dom. Cons. 1,700 270 140 660 2,770
Feed Waste Dom. Cons. 50 0 0 0 50
Total Dom. Cons. 2,150 305 160 830 3,445
Ending Stocks 142 42 19 60 263
Total Distribution 4,442 827 429 892 6,590
Note: The above table is composed of PSD forecast for each oil despite differing marketing years.
Consumption
Russia is self-sufficient with vegetable oil due to increasing sunflower crops production and oil crushing
capacities. Sunflower seeds oil is the main oil consumed in Russian households. According to the last
annual National Report on the State Program for Development of Agriculture in 2013-202030
the target
indicator for the share of domestically produced vegetable oil in the total oil supply in Russia in 2015
reached 83.9 percent. This is higher than the 83.8 percent target established by the State Program for
2015. Given that Russia further increased production of vegetable oil in 2016, the target of self-supply
with vegetable oil will be exceeded again in 2016.
FAS/Moscow forecasts that domestic consumption of vegetable oil in Russia in MY 2017/18 will be
3.45 MMT (estimate for MY 2016/17 is 3.41 MMT), and will include 2.15 MMT of sunflowerseed oil
(2.12 MMT in MY 2016/17), 305 TMT of soybean oil (300 TMT in MY 2016/17), 140 TMT of
rapeseed oil (160 TMT in MY 2016/17), and 660 TMT of palm oil (830 TMT in MY 2016/17). Russia
does not produce palm oil, and all domestic consumption of this oil is based on imports.
30
The Report on the results of implementation of the State Program in 2015 was published in May 2016. The National
Report on the results of the implementation of the State Program in 2016 will be published not earlier than May 2017. The
Report is available on the site of the Ministry of Agriculture: http://www.mcx.ru/documents/document/v7_show/36975..htm

43
The supply of vegetable oils (imports and production) in Russia has been growing since MY 2010/11
(Chart 21). Along with the growth of supply of vegetable oils, Russia increased exports of these oils.
Source: FAS/Moscow based on PSD data
Trade
FAS/Moscow forecasts further increases in Russia’s exports of vegetable oils, to 2.88 MMT in MY
2017/18 from an estimated 2.75 MMT in MY 2016/17. Sunflowerseed oil exports are forecast at 2.15
MMT (up 0.1 MMT from the estimate for MY 2016/17). Soybean oil exports are forecast at 480,000
MT (up 10 TMT y-o-y), and rapeseed oil exports are forecast at 0.25 MMT (up from 0.23 MMT in MY
2016/17). Exports of sunflowerseed oil and rapeseed oil have increased in MY 2016/17 from MY
2015/16 due to the soft Ruble. However, in MY 2017/18 this factor may not play such a significant
role, and crushers may decrease prices of these oils in order to compete in the world markets. Soybean
oil exports will depend primarily on imports of soybeans, because the major Russian importer of
soybeans, located in Kaliningrad, sells most of its meal to the domestic market and sells the soybean oil
to foreign markets. Thus, exports of soybean oil may be affected by non-market limitations on imports
of soybeans (see Section on OILSEEDS).
Sunflowerseed oil
FAS/Moscow forecasts exports of sunflowerseed oil at 2.15 MMT in MY 2017/18 that is 5 percent more
than the estimated 2.05 MMT exports in MY 2016/17. FAS/Moscow’s estimate for MY 2016/17 is 0.1
MMT higher than the official USDA estimate, and is based on the active exports of sunflowerseed oil
from September 2016 through January 2017. During this period Russia exported 866 TMT of
sunflowerseed oil, or 45 percent more than in the same period y-o-y. Exports was stimulated both by an
increased crush of sunflowerseed and by the weak Ruble. However, with a stronger Ruble the stimuli

44
for exports may decrease, and Post assumes that in the next seven months of MY 2016/17, exports of
sunflowerseed oil will slow.
Source: FAS/Moscow based on PSD data
Soybean oil
Russia almost does not import soybean oil. Domestic consumption of soybean oil is lower than
consumption of sunflowerseed oil. A significant portion of soybean oil is exported, and a large portion
of these exports originate from Kaliningrad, where crushing is based on imported beans and
significantly depends on imports of soybeans. Given the problems with soybean imports, FAS/Moscow
forecasts that exports of soybean oil from Russia will be 480 TMT, only 2 percent higher than the
estimated exports of soybean oil in MY 2016/17. FAS/Moscow estimates these exports in MY 2016/17
at 470 TMT (in MY 2016/17 these exports were 431 TMT). From September 2016 through January
2017, Russia exported 210 TMT of soybean oil, 18 percent more y-o-y. The main destinations of these
exports were Algeria (104.1 TMT), Tunisia (32.9 TMT), Venezuela (15 TMT), Cuba (14.9 TMT), and
Denmark (10.5 TMT).

45
Source: FAS/Moscow based on PSD data
Rapeseed oil
FAS/Moscow forecasts rapeseed oil exports in MY 2017/18 at 250 TMT, 20 TMT increase from the
estimated exports in MY 2016/17. In MY 2016/17, rapeseed oil exports were lower than in MY
2015/16, because of decreased production and crush of rapeseed. From July 2016 through January
2017, Russia exported only 84 TMT of rapeseed oil compared with 124 TMT in the same period last
year. The main destinations for rapeseed oil exports in this period in MY 2016/17 were Norway (95
TMT), Lithuania (23 TMT), and Latvia (13 TMT).
Source: FAS/Moscow based on PSD data
Palm oil

46
Russia continues to be a significant importer of palm oil. FAS/Moscow estimates Russia’s palm oil
imports in MY 2016/17 at 0.8 MMT, and forecasts the same volume of imports for MY 2017/18.
Imports of palm oil decreased in MY 2016/17 compared with MY 2015/16 by 14 percent, primarily due
to the weak Ruble and increased domestic production of vegetable oils. The anti-palm oil campaign
launched in the Russian media in 2015 and throughout 2016 also negatively impacted demand for palm
oil, but actually was not the major factor for decreased imports.
Indonesia increase export duties on palm oil beginning February 2017 to $18 per 1 MT compared with
$3 per 1 MT in January 2017. Prices on palm oil may increase, and these increases may affect Russia’s
imports of palm oil.31
Stocks
FAS/Moscow forecasts end of MY 2017/18 stocks of vegetable oil to decrease by 26 TMT y-o-y to 263
TMT, and these stocks will include 142 TMT of sunflowerseed oil (132 TMT by the end of MY
2016/17), 42 TMT of soybean oil (46 TMT in MY 2016/17), 19 TMT of rapeseed oil (the same as last
year), and 60 TMT of palm oil (92 TMT by the end of MY 2016/17).
PSD Tables for Oils
Oil, Sunflowerseed 2015/2016 2016/2017 2017/2018 Market Begin Year Sep 2015 Sep 2016 Sep 2017
Russia USDA Official New Post USDA Official New Post USDA Official New Post
Crush 8550 8550 9850 10100 0 10400
Extr. Rate, 999.9999 0.4129 0.4129 0.413 0.4158 0 0.4135
Beginning Stocks 49 49 92 92 0 132
Production 3530 3530 4068 4200 0 4300
MY Imports 3 3 10 10 0 10
MY Imp. from U.S. 0 0 0 0 0 0
MY Imp. from EU 0 0 0 0 0 0
Total Supply 3582 3582 4170 4302 0 4442
MY Exports 1540 1540 1950 2050 0 2150
MY Exp. to EU 22 22 25 25 0 25
Industrial Dom. Cons. 370 370 380 380 0 400
Food Use Dom. Cons. 1550 1550 1680 1710 0 1700
Feed Waste Dom. Cons. 30 30 30 30 0 50
Total Dom. Cons. 1950 1950 2090 2120 0 2150
Ending Stocks 92 92 130 132 0 142
Total Distribution 3582 3582 4170 4302 0 4442
(1000 MT) ,(PERCENT)
Oil, Soybean 2015/2016 2016/2017 2017/2018 Market Begin Year Sep 2015 Sep 2016 Sep 2017
Russia USDA Official New Post USDA Official New Post USDA Official New Post
Crush 4050 4050 4300 4300 0 4350
Extr. Rate, 999.9999 0.1793 0.1793 0.1793 0.1793 0 0.1793
Beginning Stocks 18 18 44 44 0 46
Production 726 726 771 771 0 780
31
http://kvedomosti.ru/news/indoneziya-podnyala-eksportnye-poshliny-na-palmovoe-maslo-v-6-raz-iz-za-rosta-cen.html.

47
MY Imports 1 1 1 1 0 1
MY Imp. from U.S. 0 0 0 0 0 0
MY Imp. from EU 0 0 0 0 0 0
Total Supply 745 745 816 816 0 827
MY Exports 431 431 470 470 0 480
MY Exp. to EU 160 160 160 160 0 160
Industrial Dom. Cons. 30 30 30 30 0 35
Food Use Dom. Cons. 240 240 270 270 0 270
Feed Waste Dom. Cons. 0 0 0 0 0 0
Total Dom. Cons. 270 270 300 300 0 305
Ending Stocks 44 44 46 46 0 42
Total Distribution 745 745 816 816 0 827
(1000 MT) ,(PERCENT)
Oil, Rapeseed 2015/2016 2016/2017 2017/2018 Market Begin Year Jul 2015 Jul 2016 Jul 2017
Russia USDA Official New Post USDA Official New Post USDA Official New Post
Crush 990 990 990 990 0 1050
Extr. Rate, 999.9999 0.3919 0.3919 0.3919 0.3919 0 0.3905
Beginning Stocks 9 9 19 19 0 19
Production 388 388 388 388 0 410
MY Imports 2 2 2 2 0 0
MY Imp. from U.S. 0 0 0 0 0 0
MY Imp. from EU 1 1 1 1 0 0
Total Supply 399 399 409 409 0 429
MY Exports 240 240 230 230 0 250
MY Exp. to EU 150 150 150 150 0 150
Industrial Dom. Cons. 20 20 20 20 0 20
Food Use Dom. Cons. 120 120 140 140 0 140
Feed Waste Dom. Cons. 0 0 0 0 0 0
Total Dom. Cons. 140 140 160 160 0 160
Ending Stocks 19 19 19 19 0 19
Total Distribution 399 399 409 409 0 429
(1000 MT) ,(PERCENT)
Oil, Palm 2015/2016 2016/2017 2017/2018 Market Begin Year Oct 2015 Oct 2016 Oct 2017
Russia USDA Official New Post USDA Official New Post USDA Official New Post
Area Planted 0 0 0 0 0 0
Area Harvested 0 0 0 0 0 0
Trees 0 0 0 0 0 0
Beginning Stocks 91 91 124 124 0 92
Production 0 0 0 0 0 0
MY Imports 933 933 800 800 0 800
MY Imp. from U.S. 0 0 0 0 0 0
MY Imp. from EU 0 0 0 0 0 0
Total Supply 1024 1024 924 924 0 892
MY Exports 20 20 2 2 0 2
MY Exp. to EU 0 0 0 0 0 0
Industrial Dom. Cons. 170 170 170 170 0 170
Food Use Dom. Cons. 710 710 660 660 0 660
Feed Waste Dom. Cons. 0 0 0 0 0 0
Total Dom. Cons. 880 880 830 830 0 830
Ending Stocks 124 124 92 92 0 60
Total Distribution 1024 1024 924 924 0 892

48
(1000 HA) ,(1000 TREES) ,(1000 MT)


