
Project Funded by the European Commission under the Horizon 2020 Framework Programme. Grant Agreement No 689515
Report on characterization of primary and secondary raw
materials (initial)
D1.1
© Copyright 2016 The INTMET Consortium
CHARACTERIZATION OF PRIMARY AND SECONDARY MATERIALS D1.1
2 | 43
PROGRAMME H2020 – Environment and Resources
GRANT AGREEMENT NUMBER 689515
PROJECT ACRONYM INTMET
DOCUMENT Deliverable number
TYPE (DISTRIBUTION LEVEL) ☒ Public
☐ Confidential
☐ Restricted
DUE DELIVERY DATE 31-07-2016
DATE OF DELIVERY 11-07-2017
STATUS AND VERSION 1.0
NUMBER OF PAGES 43
WP / TASK RELATED 1.1
WP / TASK RESPONSIBLE KGHM
AUTHOR (S) KGHM Polska Miedź S.A.
PARTNER(S) CONTRIBUTING KGHM, IMN, CLC, Somincor, BOR Inst, IMNR, BRGM
FILE NAME INTMET_Deliverable_1.1
DOCUMENT HISTORY
VERS ISSUE DATE CONTENT AND CHANGES
1.0 11-07-2017 First version
DOCUMENT APPROVERS
PARTNER APPROVER
KGHM Polska Miedź S.A. CLC

CHARACTERIZATION OF PRIMARY AND SECONDARY MATERIALS D1.1
3 | 43
TABLE OF CONTENTS
1. PURPOSE ............................................................................................................................................................................................... 7 1.1 EXECUTIVE SUMMARY .............................................................................................................................................................................. 7
2. ROM CHARACTERIZATION...................................................................................................................................................................... 8 2.1 CLC ORE..................................................................................................................................................................................................... 8
2.2 KGHM ORE .............................................................................................................................................................................................. 11
2.3 SOMINCOR ORE ...................................................................................................................................................................................... 13
3. CONCENTRATES CHARACTERIZATION .................................................................................................................................................. 14 3.1 CLC POLYMETALLIC CONCENTRATE ........................................................................................................................................................ 14
3.2 BOR POLYMETALLIC MATERIAL .............................................................................................................................................................. 18
3.3 KGHM POLYMETALLIC CONCENTRATE .................................................................................................................................................... 23
3.4 SOMINCOR POLYMETALLIC CONCENTRATE ............................................................................................................................................ 28
3.5 BOR PYRITE CONCENTRATE .................................................................................................................................................................... 32
3.6 CLC PYRITE TAILINGS ............................................................................................................................................................................... 35
3.7 SOMINCOR PYRITE CONCENTRATE ......................................................................................................................................................... 38
4. SUMMARY ........................................................................................................................................................................................... 42

CHARACTERIZATION OF PRIMARY AND SECONDARY MATERIALS D1.1
4 | 43
LIST OF FIGURES
Fig. 1. The overview of CLC deposit and sample collection.
Fig. 2. Images of metallographic microscope of CLC ore.
Fig. 3. Images of metallographic microscope of KGHM low grade ore.
Fig. 4. XRD pattern of CLC polymetallic concentrate (IMNR).
Fig. 5. Images of metallographic microscope of CLC polymetallic concentrate.
Fig. 6. Images of metallographic microscope of CLC bulk concentrate.
Fig. 7. Particle size distribution of CLC polymetallic concentrate.
Fig. 8. The overview of Bobija mine and sampling method that was used.
Fig. 9. Mechanical tests of the polymetallic ore from BOR: a – drilling sample; b –press analysis.
Fig. 10. XRD pattern of BOR polymetallic material.
Fig. 11. Images of metallographic microscope of BOR polymetallic ore.
Fig. 12. Particle size distribution obtained using laser particle size analyzer.
Fig. 13. XRD pattern for KGHM low grade concentrate.
Fig. 14. Images of metallographic microscope of KGHM low grade concentrate.
Fig. 15. Images of metallographic microscope of KGHM low grade concentrate.
Fig. 16. Particle size distribution of KGHM low grade concentrate.
Fig. 17. XRD pattern of SOMINCOR polymetallic concentrate.
Fig. 18. Images of metallographic microscope of SOMINCOR polymetallic concentrate.
Fig. 19. Images of metallographic microscope of Somincor sample.
Fig. 20. Particle size distribution of SOMINCOR polymetallic concentrate.
Fig. 21. XRD pattern of BOR pyrite concentrate (BOR INST).
Fig. 22. Images of metallographic microscope of BOR pyrite concentrate.
Fig. 23. Grain size distribution obtained using laser particle analyzer.
Fig. 24. XRD pattern of CLC pyrite concentrate.
Fig. 25. Images of metallographic microscope of CLC pyrite tailings.
Fig. 26. Particle size distribution of CLC pyrite tailings.
Fig. 27. XRD pattern of Somincor pyrite tailings.
Fig. 28. Elements distribution within selected area using magnification 400x.
Fig. 29. Quantitative analysis using EDS method for previously selected points.
Fig. 30. Particle size distribution of Somincor pyrite tailings.

CHARACTERIZATION OF PRIMARY AND SECONDARY MATERIALS D1.1
5 | 43
LIST OF TABLES
Table 1. ELEMENTAL COMPOSITION OF CLC ORE, [%]
Table 2. MINERALOGY OF CLC ORE, [%]
Table 3. ELEMENTAL COMPOSITION OF KGHM LOW GRADE ORE, [%]
Table 4. MINERALOGY OF KGHM LOW GRADE ORE
Table 5. MINERALOGY OF KGHM LOW GRADE ORE, [%]
Table 6. ELEMENTAL SOMINCOR POLYMETALLIC ORE, [%]
Table 7. ELEMENTAL COMPOSITION OF CLC POLYMETALLIC CONCENTRATE, [%]
Table 8. XRD RESULTS OF CLC POLYMETALLIC CONCENTRATE
Table 9. MINERALOGY OF CLC POLYMETALLIC CONCENTRATE, [%]
Table 10. GRAIN SIZE DISTRIBUTION OF CLC POLYMETALLIC CONCENTRATE
Table 11. ELEMENTAL COMPOSITION OF BOR POLYMETALLIC MATERIAL, [%]
Table 12. MECHANICAL CHARACTERISTIC OF BOR POLYMETALLIC MATERIAL
Table 13. XRD RESULTS OF BOR POLYMETALLIC MATERIAL
Table 14. MINERALOGY OF BOR POLYMETALLIC MATERIAL, [%]
Table 15. GRAIN SIZE DISTRIBUTION OF BOR POLYMETALLIC MATERIAL
Table 16. ELEMENTAL COMPOSITION OF KGHM LOW GRADE CONCENTRATE, [%]
Table 17. XRD RESULTS OF KGHM LOW GRADE CONCENTRATE
Table 18. MINERALOGY OF KGHM LOW GRADE CONCENTRATE, [%]
Table 19. GRAIN SIZE DISTRIBUTION OF KGHM LOW GRADE CONCENTRATE
Table 20. ELEMENTAL COMPOSITION OF SOMINCOR POLYMETALLIC CONCENTRATE, [%]
Table 21. XRD RESULTS OF SOMINCOR POLYMETALLIC CONCENTRATE
Table 22. MINERALOGY OF SOMINCOR POLYMETALLIC CONCENTRATE, [%]
Table 23. GRAIN SIZE DISTRIBUTION OF SOMINCOR POLYMETALLIC CONCENTRATE
Table 24. ELEMENTAL COMPOSITION OF BOR PYRITE CONCENTRATE, [%]
Table 25. XRD RESULTS OF BOR PYRITE CONCENTRATE
Table 26. MINERALOGY OF BOR PYRITE CONCENTRATE, [%]
Table 27. GRAIN SIZE DISTRIBUTION OF BOR PIRYTE CONCENTRATE
Table 28. ELEMENTAL COMPOSITION OF CLC PYRITE CONCENTRATE, [%]
Table 29. XRD RESULTS OF CLC PYRITE CONCENTRATE
Table 30. MINERALOGY OF CLC PYRITE CONCENTRATE, [%]
Table 31. GRAIN SIZE DISTRIBUTION OF CLC PYRITE TAILINGS
Table 32. ELEMENTAL COMPOSITION OF SOMINCOR PYRITE TAILINGS, [%]

CHARACTERIZATION OF PRIMARY AND SECONDARY MATERIALS D1.1
6 | 43
ABBREVIATIONS AND ACRONYMS
XRF X-ray Fluorescence
ICP-OES Inductively Coupled Plasma - Optical Emission Spectrometer
ICP-MS inductively coupled plasma – mass spectrometry
FAAS Flame Atomic Absorption Spectroscopy
py Pyrite
sl Sphalerite
cp Chalcopyrite
cv Covellite
gn Galena
td Tetrahedrite
eng Enargite
cc Chalcocite
bn Bornite
arp Arsenopyrite
CRM Critical Raw Materials
SME Small Medium Enterprise
RIR Reference Intensity Ratio
ROM Run Of Mine

CHARACTERIZATION OF PRIMARY AND SECONDARY MATERIALS D1.1
7 | 43
1. PURPOSE
1.1 EXECUTIVE SUMMARY
The WP 1 is the first part of the IntMet project with an objective to collect and characterize primary and
secondary raw materials to be studied and tested. The primary raw materials include ores, concentrates and
middlings and these were provided by mining partners i.e. (i) polymetallic ores and concentrates by SOMINCOR,
CLC and BOR INST; (ii) complex or low-grade ores, concentrates and middlings by KGHM and BOR INST. The
secondary raw materials include flotation tailings and metallurgical wastes that will be supplied by the mining
partners. This work package was divided into four tasks concerning the following objectives:
– definition, collection and characterization of primary raw materials,
– definition, collection and characterization of secondary raw materials such as flotation tailings and metallurgical
wastes,
– collection and characterization of materials and intermediate by-products or final products generated in the
various technology developments,
– control and management of the package and delivery of primary and secondary raw materials samples to be
provided for testing under WP2, 3, 4, 5 and 6.
Task 1.1 deals with ores, concentrates and middlings samples collection and characterisation”. It was assumed to
select, collect and characterize primary and secondary raw materials samples, provided for laboratory and pilot
plant test works by mining companies. The following materials are considered:
polymetallic ores, concentrates and tailings: SOMINCOR, CLC, BOR INST
complex or low-grade copper ores, concentrates, middlings: KGHM, BOR INST.
Physical, chemical, mineralogical and microscopic analysis, which were chosen to fully characterize investigated
materials, allowed to review the existing geological information and flotation plants databases. It was suggested
in the project proposal to use the following methods analyzing the chemistry of primary materials:
chemical analysis of major and minor metals - carried out using various techniques including: XRF, ICP-OES, ICP-
MS, fire-assay; XRD, optical microscopy, optical mineralogy, automated quantitative mineralogy, electron
microprobe analysis (EMPA) and metallographic microscopy - used to determine ore texture and quantitatively
evaluate particular minerals amount as well as to investigate mineral geochemistry and compositional maps.
CHARACTERIZATION OF PRIMARY AND SECONDARY MATERIALS D1.1
8 | 43
2. ROM CHARACTERIZATION
2.1 CLC ORE
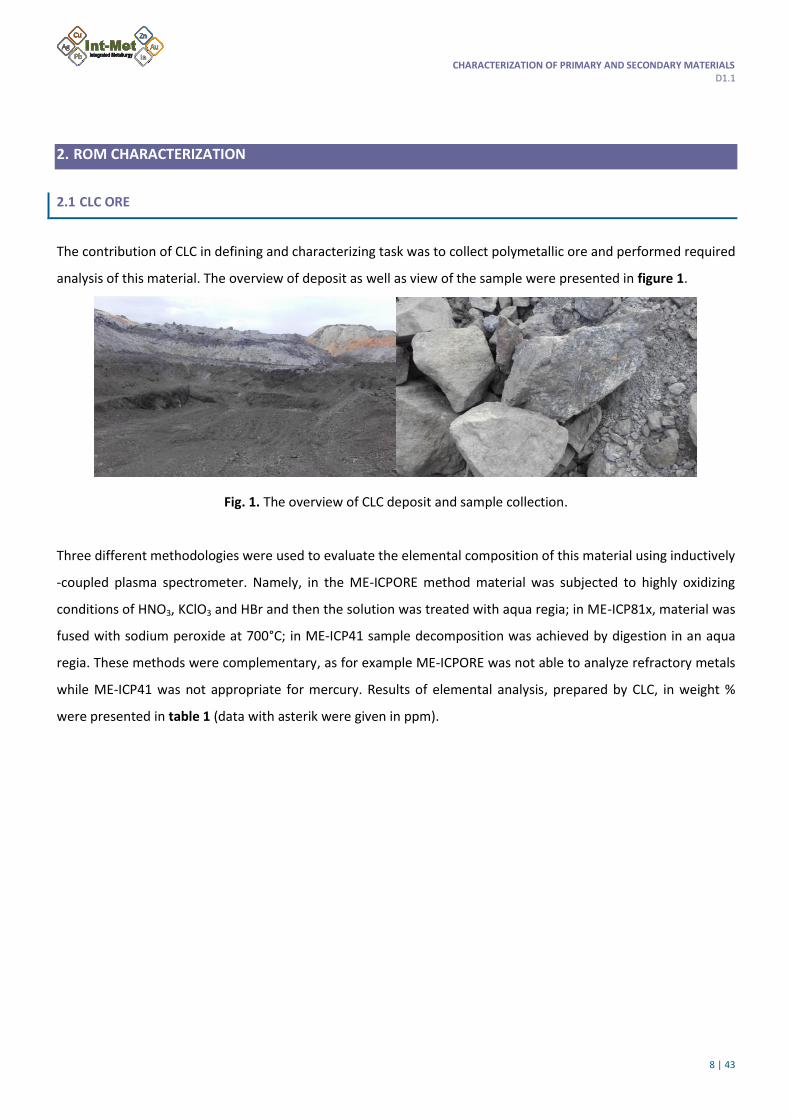
The contribution of CLC in defining and characterizing task was to collect polymetallic ore and performed required
analysis of this material. The overview of deposit as well as view of the sample were presented in figure 1.
Fig. 1. The overview of CLC deposit and sample collection.
Three different methodologies were used to evaluate the elemental composition of this material using inductively
-coupled plasma spectrometer. Namely, in the ME-ICPORE method material was subjected to highly oxidizing
conditions of HNO3, KClO3 and HBr and then the solution was treated with aqua regia; in ME-ICP81x, material was
fused with sodium peroxide at 700°C; in ME-ICP41 sample decomposition was achieved by digestion in an aqua
regia. These methods were complementary, as for example ME-ICPORE was not able to analyze refractory metals
while ME-ICP41 was not appropriate for mercury. Results of elemental analysis, prepared by CLC, in weight %
were presented in table 1 (data with asterik were given in ppm).
CHARACTERIZATION OF PRIMARY AND SECONDARY MATERIALS D1.1
9 | 43
Table 1. ELEMENTAL COMPOSITION OF CLC ORE, [%]
Method Cu Fe Ca Pb Zn As Mn Bi Cd Hg Mo S Ag Sb Co
ME-
ICPORE 0.989 39.5 0.59 2.42 3.35 0.444 0.046 0.029 0.006 79* <0.001 47.6 57* 0.086 0.031
ME-
ICP81x 0.98 40.9 0.58 2.37 2.97 0.45 0.04 – – – – 48.9 – – 0.036
ME-
ICP41 8970* 26.2 0.57 >10000* >10000 2960* 289* 214* 55.6* 66* 8* >10
49.7
* 546* 301*
Method Al B Ba Be Cr Ga K La Mg Na Ni P Sc Se Sr
ME-
ICPORE – – – – – – – – – – – – – – –
ME-
ICP81x 0.14 – – – – – – – – – – – – – –
ME-
ICP41 0.01 10* 20* <0.5* 3* <10* <0.01 <10* 0.01 0.02 29* <10* <1* <10* 16*
Method Th Ti Tl U V W – – – – – – – – –
ME-
ICPORE – – – – – – – – – – – – – – –
ME-
ICP81x – – – – – – – – – – – – – – –
ME-
ICP41 <20* <0.01 60* 10* 3* 10*
* – values in ppm
These results showed that precision of elements detection was very high. Some rarely analyzed elements were
also placed in the table to show completeness of used techniques. The mineralogical examination combined with
quantitative analysis showed that material was composed mainly of pyrite and primary sulfides, present in
polymineral fragments associated with each other and pyrite, while minor sulfides were observed in lesser extent.
The precised data were presented in table 2.
Table 2. MINERALOGY OF CLC ORE, [%]
MINERAL
Sample Pyrite Sphalerite Galena Chalcocite Chalcopyrite Covellite Bornite Tetrahedrite Enargite
HPP<2mm 84.67 11.1 2.41 0 1 0.35 0 0.35 0.12
Particular minerals were identified in samples using metallographic microscope. Images were presented in
figure 2.

CHARACTERIZATION OF PRIMARY AND SECONDARY MATERIALS D1.1
10 | 43
Fig. 2. Images of metallographic microscope of CLC ore: a – big particle size of pyrite (py) with subhedral-anhedral
and primary-secondary sulphides; b – primary sulphide with pyrite (py), sphalerite (sl) and chalcopyrite (cp) in
a minor presence of galena (gn); c – polymetallic particle with pyrite (py), tetrahedrite (td) and chalcopyrite (cp);
d – polymineralic fragment of primary mineralization composed of galena (gn) and sphalerite (sl), with
chalcopyrite relics/residues; e – detail of polymineral fragment composed of pyrite (py) and covellite (cv); f –
detail of fragment composed of tetrahedrite (td) that has been massively replaced by enargite (eng).
a b
c d
e f f

CHARACTERIZATION OF PRIMARY AND SECONDARY MATERIALS D1.1
11 | 43
Summarizing, the CLC ore was composed mainly of pyrite and primary sulphides. Sulphides were associated with
each other in polymineral grains and then with pyrite. The particle size was lower than 2mm. There were
apparent signs of corrosion observed within samples.
2.2 KGHM ORE
KGHM ore was collected from ”Lubin-Małomice” deposit, which is located in the north-west part of the Lower
Silesian Voivodeship, Poland. It is a stratoidal type deposit with copper-bearing materials present in sandstone of
rotliegend and thill part of Zechstein. It is a seam (layered) deposit, locally discontinuous.
KGHM “Lubin-Małomice” ore consists of sulfide minerals with the following coexisting metals: silver, lead, zinc,
cobalt, molybdenum, nickel and vanadium. These are present as their own minerals or isomorphic additives to
copper-bearing minerals. In case of lead its content within carbonate-shale ore can be higher than for copper.
The average concentration of lead is 0.12%, it is located mainly in galena as well as in copper-containing minerals.
An increased amount of zinc is rarely observed and actually ranges from 0.00 to 0.05 %. Zinc is mostly present as
sphalerite. Cobalt is represented by cobaltite and smaltite. These minerals are present in form of grains, which
can be found in bornite and chalcosine or separately in shales. Molybdenum is located as isomorphic additive in
pyrite, chalcopyrite and bornite, sometimes can be found in its own minerals. Vanadium can be found in shales
and carbonates that are not making their own minerals and its main concentrations are combined with organic
matter.
The elemental composition of KGHM low grade ore was presented in a table 3.
Table 3. ELEMENTAL COMPOSITION OF KGHM LOW GRADE ORE, [%]
Sample Cu Pb Zn As Ni V Bi Cd Hg Mo Re Ag Sb Co
KGHM 1.19 0.16 <0.05 0.11 0.004 0.0056 0.0008 0.0026 0.0002 0.011 0.00015 0.0057 0.0046 0.011
The density of the material was separately determined for three fractions i.e. carbonate ore, shale ore and
sandstone ore, resulting in 2.6 t/m3, 2.5 t/m3 and 2.3 t/m3, respectively. It should be emphasized that the
sandstone ore is dominating within the investigated area with a content ca. 58%, while for carbonate ore and
shale ore this is about and 27% and 15.2%, respectively.
Qualitative and quantitative evaluation of minerals identified within the ore were presented in table 4 and 5.

CHARACTERIZATION OF PRIMARY AND SECONDARY MATERIALS D1.1
12 | 43
The full mineralogical analysis performed by KGHM is composed of 60 minerals. Because of table transparency,
only the 11 most common were presented. The presence of tetrahedrite, barite, sanidine, andalusite and rutile
was found in much lower amount.
Microscopic images of the investigated ore were presented in figure 3.
Table 4. MINERALOGY OF KGHM LOW GRADE ORE
MINERAL
Sample Pyrite Quartz Sphalerite Chalcocite Chalcopyrite Galena Bornite Enargite Dolomite Calcite Shale
KGHM FeS2 SiO2 ZnS Cu2S CuFeS2 PbS Cu5Fe2S4 Cu3AsS4 CaMg
(CO3)2 CaCO3 KAlSiCaMgO
Table 5. MINERALOGY OF KGHM LOW GRADE ORE, [%]
MINERAL
Sample Pyrite Quartz Sphalerite Chalcocite Chalcopyrite Galena Bornite Enargite Dolomite Calcite Shale
KGHM 0.46 34.21 0.27 0.26 0.85 0.73 0.61 0.08 36.25 7.00 15.26
a b

CHARACTERIZATION OF PRIMARY AND SECONDARY MATERIALS D1.1
13 | 43
Fig. 3. Images of metallographic microscope of KGHM low grade ore, in reflected light: a – chalcopyrite (yellow) in
a dolomite; b – combination of sphalerite (bluish) with chalcopyrite (yellow) and bornite (grey); c – native silver
(white) with stromeyerite (grey), jalpaite (pink-olive) and bornite (dark lilac); d – agglomeration of hypidomorphic
castaingite (creamy) within epigenetic veins.
2.3 SOMINCOR ORE
Elemental composition of Somincor ROM was presented in table 6.
The mineralogy of the sample is very common from Iberian Pyritic Belt:
Pyrite Dominant mineral. Abundant anhedral, subhedral and angular grains. Liberated and locked with
(primarily) sphalerite, chalcopyrite and galena.
Sphalerite Locked with (primarily) pyrite, to a lesser extent gangue and rarely galena and chalcopyrite.
Not seen as fully liberated grains, more as pseudomorphic intergrowths and infill within pyrite grain
fractures. Subhedral and anhedral grain shapes.
Chalcopyrite Locked and liberated grains with (primarily) pyrite, occasionally sphalerite and galena.
Anhedral grains shapes with interstitial infilling of pyrite and gangue.
Galena Locked within pyrite, usually in association with sphalerite and to a lesser extent chalcopyrite. Not
seen as fully liberated grains, more as pseudomorphic intergrowths and infill within pyrite grain fractures
Table 6. ELEMENTAL COMPOSITION OF SOMINCOR POLYMETALLIC ORE, [%]
Method Cu Fe Pb Zn As Bi Cd Hg Mo Ni Cr V Ag Sb Co
Somincor 0.64 - 1.517 6.59 0.347 0.005 0.016 - 0.002 0.002 0.002 0.005 0.006 0.052 0.021
c d

CHARACTERIZATION OF PRIMARY AND SECONDARY MATERIALS D1.1
14 | 43
3. CONCENTRATES CHARACTERIZATION
3.1 CLC POLYMETALLIC CONCENTRATE
Material labeled as Bulk PMS4 was a CLC polymetallic concentrate that was analyzed within this task (CLC).
Material was produced in a batch mode from a CLC ore. The elemental analysis was done for this sample
according to the previously suggested ME-ICPORE methodology (CLC). Data were presented in table 7. The results
were confirmed by IMNR studies, but with some differences due to IMNR sample correspond to obtained pilot
plant bulk concentrate sample.
Table 7. ELEMENTAL COMPOSITION OF CLC POLYMETALLIC CONCENTRATE, [%]
Sample Cu Fe Ca Pb Zn As Mn Bi Cd Hg Mo S Ag Sb Co
CLC 1.8 37.9 0.2 3.6 5.8 0.1 0.036 0.025 0.004 101* 0.002 47 85* <0.01 0.055
* – values in ppm
Density of CLC polymetallic concentrate evaluated by IMNR using pycnometric analysis was 4.6295 t/m3.
Qualitative analysis was performed using XRD method with XRD pattern presented in figure 4, while list of
detected minerals with their structures was presented in table 8 – data were listed in two rows for analysis
obtained from CLC (lab sample) and IMNR (pilot plant sample) .
Fig. 4. XRD pattern of CLC polymetallic concentrate (IMNR).
Macphersonite
Gypsum
Galena
Quartz
Bassanite
Anglesite
Chalcopyrite
Sphalerite
Pyrite
CCCO-concentrat polimetalic
Inte
nsi
ty (
cps)
0
1000
2Theta (deg)
10 20 30 40 50 60 70

CHARACTERIZATION OF PRIMARY AND SECONDARY MATERIALS D1.1
15 | 43
Quantitative evaluation of identified minerals, obtained by CLC and IMNR – by means of RIR (Reference Intensity
Ratio) method, was presented in table 9.
Microscopic study in reflected light of the analysed sample highlighted the following minerals (listed in order of
frequency): pyrite – FeS2; sphalerite – ZnS; galena – PbS; chalcopyrite – CuFeS2 and covellite CuS.
Sample examined in reflected light was mainly composed of pyrite as grains with dimensions from less than 1
micrometer up to hundreds of micrometers. Pyrite occurred mostly as individual crystals, but also was associated
with other minerals present in the sample. Sphalerite and galena were present as associated, while chalcopyrite
was observed as independent crystals or associated with the sphalerite and pyrite.
Table 8. XRD RESULTS OF CLC POLYMETALLIC CONCENTRATE
MINERAL
Sample Pyrite Quartz Sphalerite Gypsum Chalcopyrite Galena Anglesite Bassanite Macphersonite
CLC
(CLC) FeS2 SiO2 ZnS
Ca(SO4)
(H2O)2 CuFeS2 PbS PbSO4 MoS2
Pb4(SO4)(CO3)2
(OH)2
Sample Pyrite Bornite Sphalerite Chalcocite Chalcopyrite Galena Covellite Enargite Tetrahedrite
CLC
(IMNR) FeS2 Cu5FeS4 ZnS Cu2S CuFeS2 PbS CuS Cu3AsS4
(Cu,Fe)12
Sb4S13
Table 9. MINERALOGY OF CLC POLYMETALLIC CONCENTRATE, [%]
MINERAL
Sample Pyrite Quartz Sphalerite Gypsum Chalcopyrite Galena Anglesite Bassanite Macphersonite
CLC
(CLC) 78 2 8 1 5 2 2 2 <1
Sample Pyrite Bornite Sphalerite Chalcocite Chalcopyrite Galena Covellite Enargite Tetrahedrite
CLC
(IMNR) 82.59 0 6.46 0.54 6.28 1.08 0.72 1.08 1.26

CHARACTERIZATION OF PRIMARY AND SECONDARY MATERIALS D1.1
16 | 43
Fig. 5. Images of metallographic microscope of CLC polymetallic concentrate, in reflected light: a – with pyrite
(py), sphalerite (sph), chalcopyrite (cpy) and covellite (cv) and in transmitted light: b – with pyrite (py), sphalerite
(sph), galena (gl), chalcopyrite (cpy) and covellite (cv).
Comparatively, images obtained from metallographic microscope by CLC were presented in figure 6.
e
a b
c d
a b

CHARACTERIZATION OF PRIMARY AND SECONDARY MATERIALS D1.1
17 | 43
Fig. 6. Images of metallographic microscope of CLC bulk concentrate PMS4: a – general apperance of the sample
consisting mainly of pyrite (py) enhedral-anhedral and both primary and secondary sulphides; b – various mono-
and polymineralic grains located within specimen in the following combinations: pyrite (py)–chalcopyrite (cp) –
sphalerite (sl), pyrite (py)–tetrahedrite (td)–chalcopyrite(cp), pyrite (py)–covellite (cv), galena (gn), chalcopyrite
(cp), sphalerite (sl); c – mixed fragments composed of chalcopyrite (cp) partially replaced by bornite (bn) and
covellite (cv); d – polymineralic fragments in form of: pyrite (py)–chalcopyrite (cp) and pyrite (py)–galena (gn) –
sphalerite (sl); e – monomineral fragments of covellite (cv), galena (gn), tetrahedrite (td), chalcocite (cc), enargite
(eng) and sphalerite (sl).
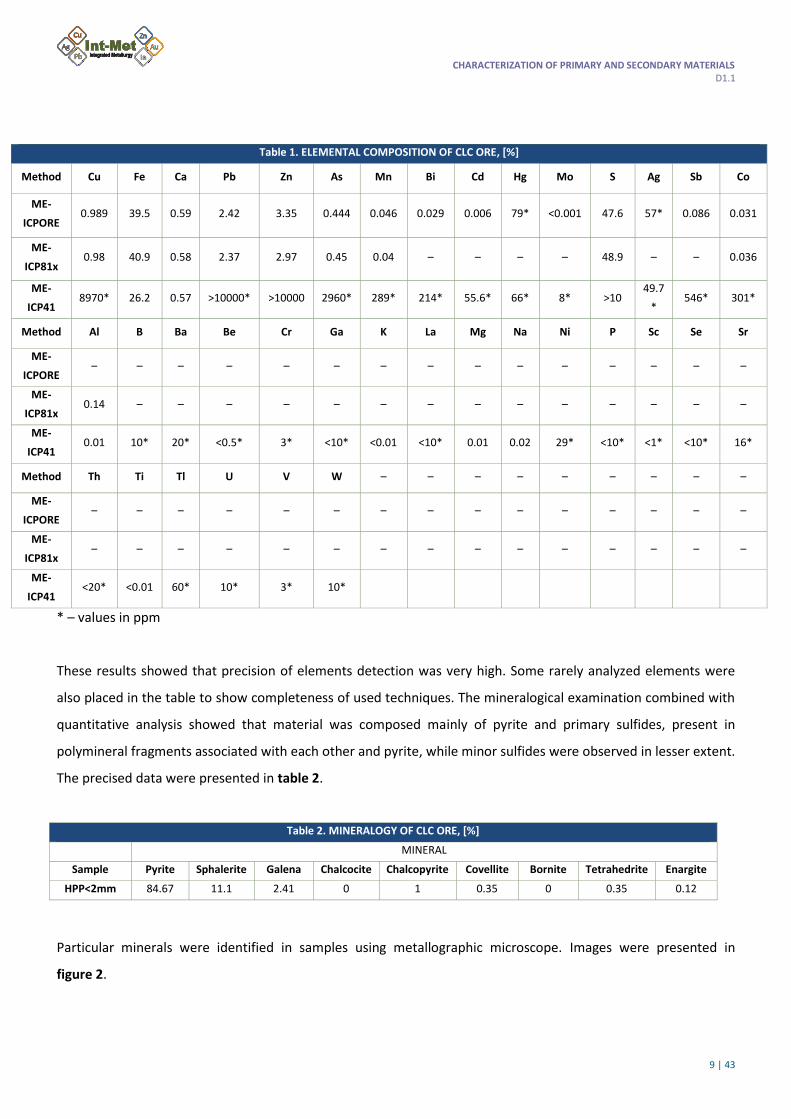
Results of grain size analysis performed by IMNR were presented in table 10 and in figure 7.
Table 10. GRAIN SIZE DISTRIBUTION OF CLC POLYMETALLIC CONCENTRATE
Size class, mm m, % Undersize, % Oversize, %
d > 0.150 1.80 100.00 1.80
0.100 < d < 0.150 1.43 98.20 3.23
0.090 < d < 0.100 0.80 96.77 4.02
0.071 < d < 0.090 1.80 95.98 5.82
0.063 < d < 0.071 0.78 94.18 6.60
0.040 < d < 0.063 7.63 93.40 14.23
0.032 < d < 0.040 6.54 85.77 20.77
0.025 < d < 0.032 14.05 79,23 34.82
d < 0.025 65.18 65.18 100.00
e
CHARACTERIZATION OF PRIMARY AND SECONDARY MATERIALS D1.1
18 | 43
Fig. 7. Particle size distribution of CLC polymetallic concentrate.
3.2 BOR POLYMETALLIC MATERIAL
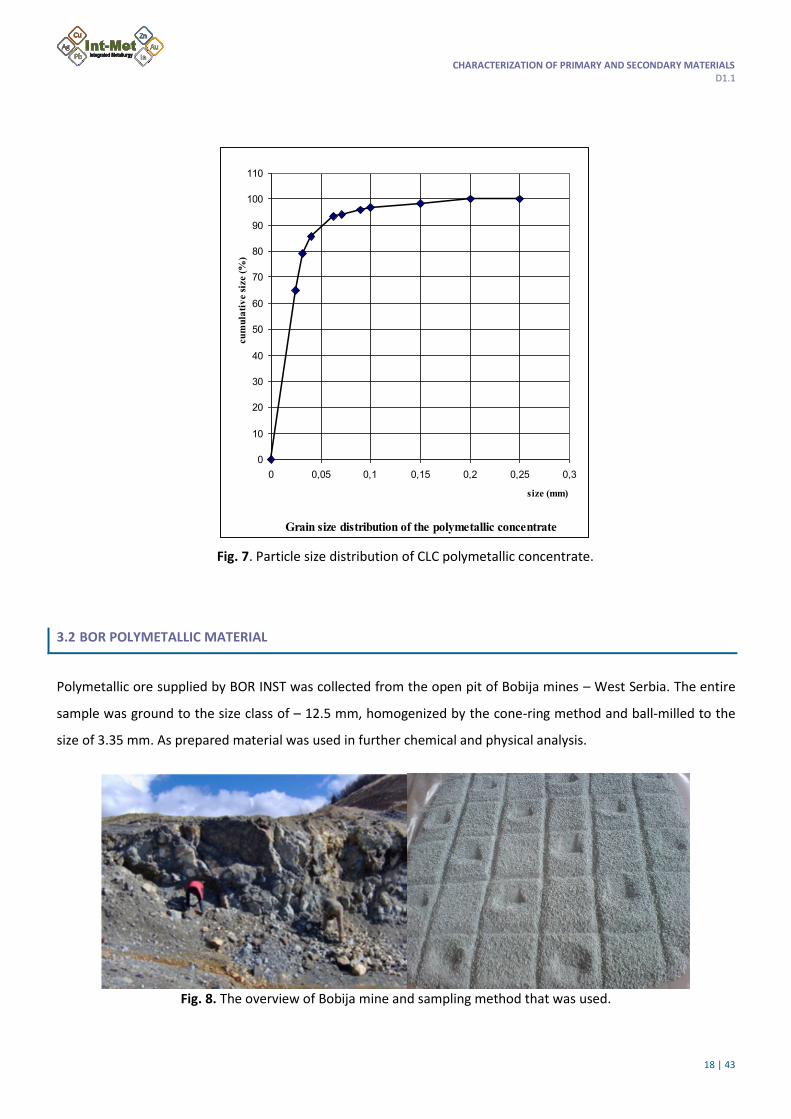
Polymetallic ore supplied by BOR INST was collected from the open pit of Bobija mines – West Serbia. The entire
sample was ground to the size class of – 12.5 mm, homogenized by the cone-ring method and ball-milled to the
size of 3.35 mm. As prepared material was used in further chemical and physical analysis.
Fig. 8. The overview of Bobija mine and sampling method that was used.
Grain size distribution of the polymetallic concentrate
0
10
20
30
40
50
60
70
80
90
100
110
0 0,05 0,1 0,15 0,2 0,25 0,3
size (mm)
cu
mu
lati
ve s
ize (
%)

CHARACTERIZATION OF PRIMARY AND SECONDARY MATERIALS D1.1
19 | 43
Table 11. ELEMENTAL COMPOSITION OF BOR POLYMETALLIC MATERIAL, [%]
Sample Cu Fe Ca Pb Zn As Mn Bi Cd Hg Mo S Ag Sb Co
BOR
material 1.77 23.8 0.08 4.62 4.92 0.309 0.037 0.006 0.01 587* 0.007 31.9 120* 0.169 0.001
Results of elemental composition analyzed using unified ME-ICPORE methodology (CLC) were consistent with BOR
INST analysis performed using combination of ICP-AES, FAAS (Flame Atomic Absorption Spectroscopy), XRF (X-ray
Fluorescence), gravimetry, fire assay and carbon and sulfur analysis as well as with IMNR results obtained for this
material. Analysis performed by BOR INST also allowed to estimate ppm of Mo, Ni, Se, Sn and Ti.
Additionally, starting material was drilled for mechanical investigation. This part was performed in
a Laboratory for Mechanical Rocks at the Mining and Metallurgy Institute Bor (figure 9). These experiments were
performed according to the national standards, given in brackets:
determination of the bulk density with pores and cavities (SRPS B.B7.113)
determination of the uniaxial compressive strength (SRPS B.B7.126)
determination of the moisture content (SRPS B.B7.111)
determination of the bulk density without pores and cavities (SRPS B.B7.112)
determination of the tensile strength by indirect method (SRPS B.B7.127)
Results were presented in table 12.
Fig. 9. Mechanical tests of the polymetallic ore from BOR: a – drilling sample; b –press analysis.
a b
CHARACTERIZATION OF PRIMARY AND SECONDARY MATERIALS D1.1
20 | 43
Density presented by BOR INST was in accordance with IMNR results that obtained 4.547 t/m3 using pycnometer
method. On the contrary, the bulk density of ore of size -12.7mm was calculated to 2.531 t/m3 while for class 3.35
mm it was 2.619 t/m3.
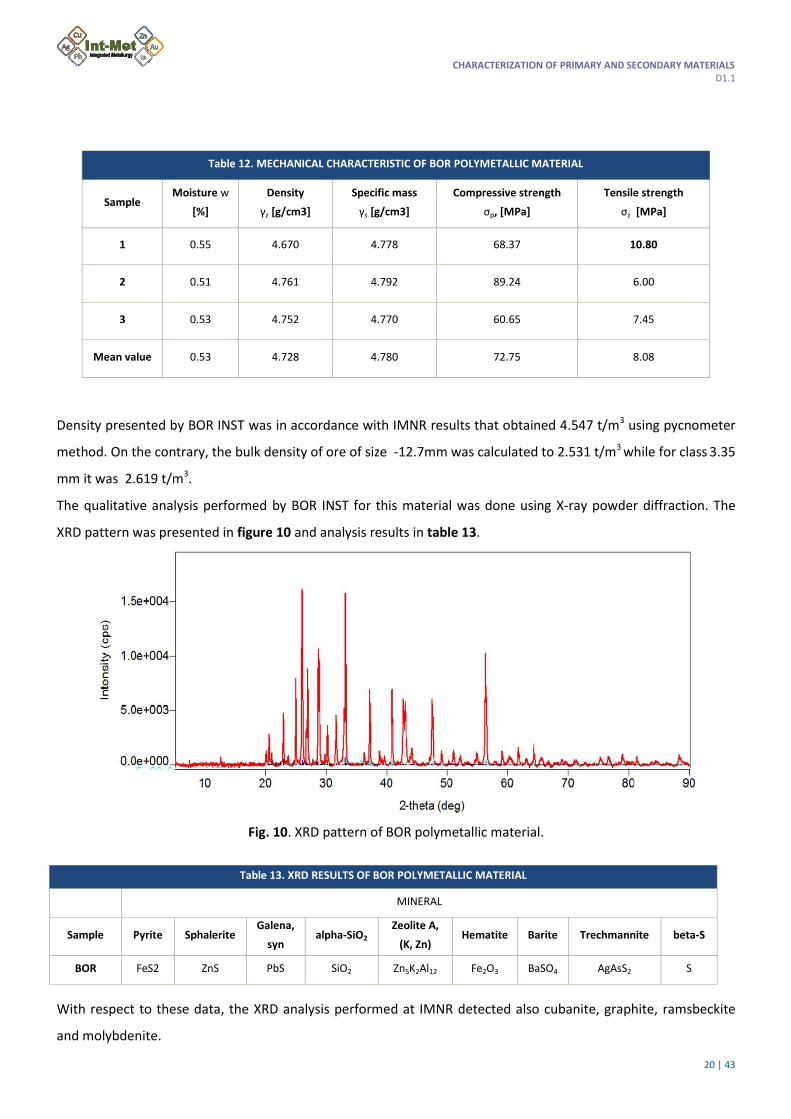
The qualitative analysis performed by BOR INST for this material was done using X-ray powder diffraction. The
XRD pattern was presented in figure 10 and analysis results in table 13.
Fig. 10. XRD pattern of BOR polymetallic material.
Table 13. XRD RESULTS OF BOR POLYMETALLIC MATERIAL
MINERAL
Sample Pyrite Sphalerite Galena,
syn alpha-SiO2
Zeolite A,
(K, Zn) Hematite Barite Trechmannite beta-S
BOR FeS2 ZnS PbS SiO2 Zn5K2Al12 Fe2O3 BaSO4 AgAsS2 S
With respect to these data, the XRD analysis performed at IMNR detected also cubanite, graphite, ramsbeckite
and molybdenite.
Table 12. MECHANICAL CHARACTERISTIC OF BOR POLYMETALLIC MATERIAL
Sample Moisture w
[%]
Density
γz [g/cm3]
Specific mass
γs [g/cm3]
Compressive strength
σp, [MPa]
Tensile strength
σz [MPa]
1 0.55 4.670 4.778 68.37 10.80
2 0.51 4.761 4.792 89.24 6.00
3 0.53 4.752 4.770 60.65 7.45
Mean value 0.53 4.728 4.780 72.75 8.08

CHARACTERIZATION OF PRIMARY AND SECONDARY MATERIALS D1.1
21 | 43
The qualitative mineralogical analysis was performed using polarizing microscope for reflected and transmitted
light brand "JENAPOL-U", company Carl Zeiss-Jena. The material was composed of pyrite, sphalerite, galena,
tetrahedrite, chalcopyrite, covellite, arsenopyrite and gangue minerals, which were quartz, silicates and
secondary minerals of Pb and Cu (anglesite, malachite, etc.). The content of barite was separated and obtained on
the basis of chemical analysis. The quantitative mineralogical analysis allowed to evaluate the content of each
mineralogical phase in the ore (table 14). The surfaces of tested aggregates were determined using the software
package OZARIA v2.5 and system for photomicrography. The RIR (Reference Intensity Ratio) method for minerals
analysis, which was performed by the IMNR, showed also presence of cubanite, graphite, ramsbeckite and
molybdenite in amount of 3.9 %, 2.4 %, 1.7 % and 0.3 %, respectively.
Table 14. MINERALOGY OF BOR POLYMETALLIC MATERIAL, [%]
MINERAL
Sample Pyrite Sphalerite Galena Chalcopyrite Covellite Arsenopyrite Barite Tetrahedrite Waste
BOR 45.15 7.71 7.57 0.04 0.04 <0.01 25.26 3.11 11.13
Based on the mineral microscopic analysis it was showed that polymetallic Bobija deposit was comprised of the
following minerals: sulphides (pyrite, sphalerite, wurtzite, galena, arsenopyrite, marcasite, pyrhotite, chalcopyrite,
covellite, chalcocite), sulphosalts (tetrahedrite, tennantite), metals (native silver), non-metallic minerals (barite)
and gangue minerals (quartz, chalcedony, carbonates).
Material examined in reflected light showed prevalence of pyrite in form of crystalline aggregates with a size
between 1 and hundreds of micrometers. Other minerals usually occured inside the crystalline aggregates of
pyrite, localized within cracks. Sphalerite and galena occured as independent grains or intercrystalline grains
inside of pyrite grains forming domains with dimensions between microns and tens of microns. Covellite
appeared as micron size granules, most often associated with sphalerite inside the pyrite granules or
independently. Chalcocite and chalcopyrite occured most often as crystals with sizes below one micrometer up to
micrometers, disseminated within crystalline aggregates of pyrite. Micronic crystals of tennantite-tetrahedrite
were sometimes observed with chalcocite. Transmitted light of sample immersed in nitrobenzene revealed the
abundant presence of barite as crystals with sizes between microns to tens microns.

CHARACTERIZATION OF PRIMARY AND SECONDARY MATERIALS D1.1
22 | 43
Fig. 11. Images of metallographic microscope of BOR polymetallic ore, in reflected light: a – with pyrite (py),
sphalerite (sl), covellite (cv), galena (gn), and in transmitted light: b – with barite (brt) and opaque minerals (op).
Grain size distribution was analyzed using laser particle size analyzer as well as a series of standard sieves (BOR
INST). Results of sieving was presented in table 15 and laser analysis schematically in figure 12. Results obtained
using both techniques were the same. The average particle diameter obtained by IMNR was as high as 41.82
microns.
Table 15. GRAIN SIZE DISTRIBUTION OF BOR POLYMETALLIC MATERIAL
Size class, mm m, % Undersize, % Oversize, %
-0.500+0.425 1.20 100.00 1.20
-0.425+.0300 1.80 98.80 3.00
-0.300+0.212 2.20 97.00 5.20
-0.212+0.150 5.40 94.80 10.60
-0.150+0.106 8.40 89.40 19.00
-0.106+0.075 10.30 81.00 29.30
-0.075+0.053 5.30 70.70 34.60
-0.053+0.038 6.70 65.40 41.30
-0.038 58.70 58.70 100.00
a b

CHARACTERIZATION OF PRIMARY AND SECONDARY MATERIALS D1.1
23 | 43
Fig. 12. Particle size distribution obtained using laser particle size analyzer.
3.3 KGHM POLYMETALLIC CONCENTRATE
Elemental composition of KGHM material was determined using previously described ME-ICPORE methodology
(CLC), additionally similar results were obtained by IMNR. Data were presented in table 16.
Table 16. ELEMENTAL COMPOSITION OF KGHM LOW GRADE CONCENTRATE, [%]
Sample Cu Fe Ca Pb Zn As Mn Bi Cd Hg Si S Ag Sb Co
KGHM 12,9 8.24 4 4.67 1.12 0.53 0.11 <0.005 0.006 <8* 6,5 13 642* 0.012 0.142
* value in ppm
Density of the material was established by pycnometer method to level 2.8138 t/m3 (IMNR).
Qualitative analysis of minerals using XRD method and semiquantitative using RIR method, performed at IMNR,
were presented in figure 13 and table 17 and 18.

CHARACTERIZATION OF PRIMARY AND SECONDARY MATERIALS D1.1
24 | 43
Fig. 13. XRD pattern for KGHM low grade concentrate.
The semiquantitaive analysis obtained using RIR method resulted in content evaluation for identified minerals
(table 18) – IMNR.
Microscopic study in reflected and transmitted light highlighted the following minerals (listed in order of
frequency): chalcopyrite – CuFeS2; carbonaceous matter – C; quartz –SiO2; bornite – Cu5FeS4; rhombic chalcocite -
Cu2S; pyrite – FeS2; carbonate (Ca,Mg)CO3; sphalerite – ZnS; cubic digenite - Cu2S; galenite– PbS and covellite.
Material examined in reflected light was mainly composed of chalcopyrite in form of granules with dimensions
from less than 1 micrometer up to hundreds of micrometers. Chalcopyrite was associated with pyrite, bornite and
digenite. Apart from its associations with chalcopyrite, bornite appeared independently or was associated with
digenite. Chalcocite appeared as independent granules or was associated with digenite and bornite. Apart from
Rectorite
Dolomite
Sphalerite
Biotite
Galena
Pyrite
Chalcopyrite
Quartz
Bornite
CCK0
Inte
nsi
ty (
cps)
0
1000
2000
2Theta (deg)
4 10 20 30 40 50 60 70
Table 17. XRD RESULTS OF KGHM LOW GRADE CONCENTRATE
MINERAL
Sample Pyrite Galena Sphalerite Chalcopyrite Bornite Dolomite Rectorite Biotite Quartz
KGHM FeS2 PbS ZnS CuFeS2 Cu5FeS4 CaMg(CO3)2 K1.2Al4Si8O20
(OH)4·4H2O
KFeMg2(Al
Si3O10)(OH)2 SiO2
Table 18. MINERALOGY OF KGHM LOW GRADE CONCENTRATE, [%]
MINERAL
Sample Pyrite Galena Sphalerite Chalcopyrite Bornite Dolomite Rectorite Biotite Quartz
KGHM 10 5 2 7 19 19 9 5 14
CHARACTERIZATION OF PRIMARY AND SECONDARY MATERIALS D1.1
25 | 43
the above combinations, digenite occured rarely in the form of independent granules. Sphalerite and galena were
present as independent or associated granules. Sometimes, in the structure of sphalerite chalcopyrite appeared.
Covellite, as seperated or associated with bornite, was rarely observed. Carbonaceous matter occured as
aggregates, layered, with dimensions of the order of hundreds of microns. These aggregates included micronized
sulphur granules. The microscopic study carried out in transmitted light on a sample immersed in nitrobenzene
showed the presence of some quartz and carbonate granules, of tens of microns, most often associated with
opaque minerals (sulphides).
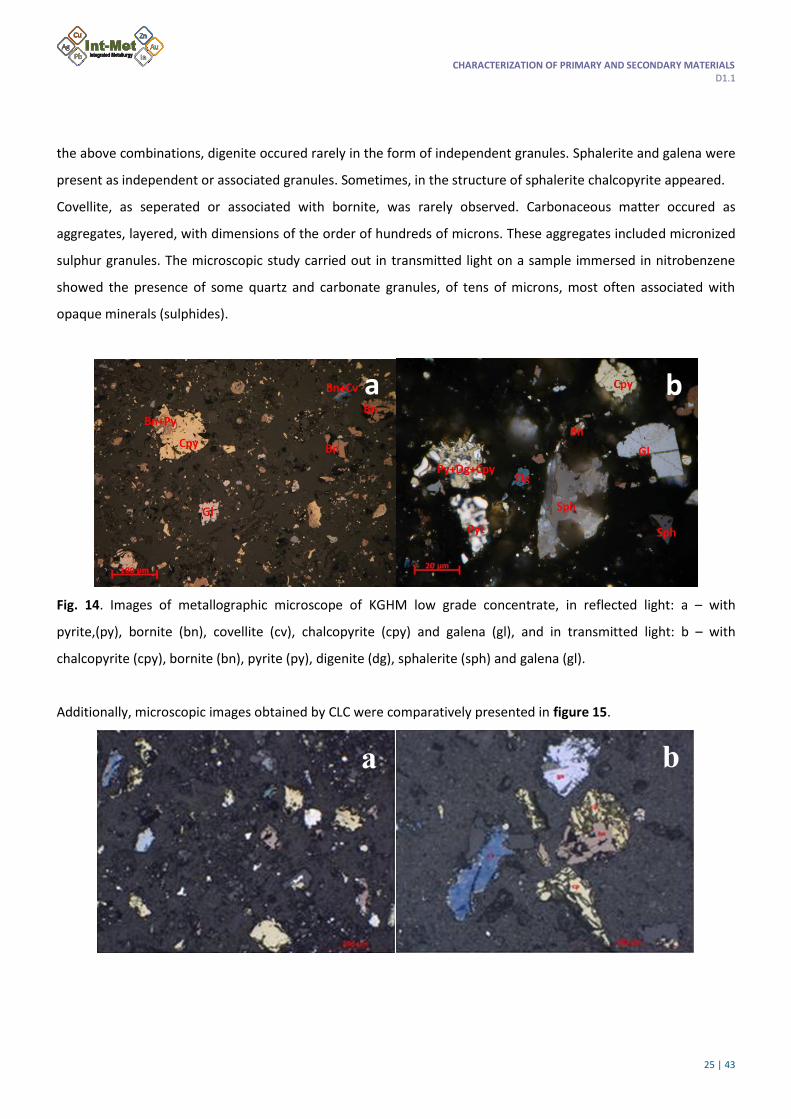
Fig. 14. Images of metallographic microscope of KGHM low grade concentrate, in reflected light: a – with
pyrite,(py), bornite (bn), covellite (cv), chalcopyrite (cpy) and galena (gl), and in transmitted light: b – with
chalcopyrite (cpy), bornite (bn), pyrite (py), digenite (dg), sphalerite (sph) and galena (gl).
Additionally, microscopic images obtained by CLC were comparatively presented in figure 15.
a b
a b

CHARACTERIZATION OF PRIMARY AND SECONDARY MATERIALS D1.1
26 | 43
Fig. 15. Images of metallographic microscope of KGHM low grade concentrate: a – heterogenous grain size with
low pyrite (py) content, primary and secondary copper sulphides present; b – free species of galena (gn),
chalcopyrite (cp), covellite (cv) and associated species chalcopyrite (cp)-bornite (bn); c – primary mineralization
composed of tetrahedrite (td) and chalcopyrite (cp); d – primary mineralization composed of sphalerite (sl) and
chalcopyrite (cp) with bornite inclusions (bn); e – primary mineralization composed of pyrite (py), chalcopyrite
(cp) and arsenopyrite (arp); f – Cu particles: covellite (cv) and chalcopyrite (cp).
Results of particle size distribution determination obtained for KGHM concentrate at IMNR were presented in
table 19 and laser analysis plot in figure 16.
c d
e f

CHARACTERIZATION OF PRIMARY AND SECONDARY MATERIALS D1.1
27 | 43
Table 19. GRAIN SIZE DISTRIBUTION OF KGHM LOW GRADE CONCENTRATE
Size class, mm m, % Undersize, % Oversize, %
d > 0.150 0.99 100.00 0.99
0.100 < d < 0.150 2.98 99.01 3.96
0.090 < d < 0.100 6.08 96.04 10.04
0.071 < d < 0.090 10.00 89.96 20.04
0.063 < d < 0.071 4.21 79.96 24.25
0.040 < d < 0.063 20.15 75.75 44.40
0.032 < d < 0.040 16.18 55.60 60.58
0.025 < d < 0.032 19.37 39.42 79.95
d < 0.025 20.05 20.05 100.00
Fig. 16. Particle size distribution of KGHM low grade concentrate
Grain size distribution of the polymetallic concentrate
0
10
20
30
40
50
60
70
80
90
100
110
0 0,05 0,1 0,15 0,2 0,25
size (mm)
cu
mu
lati
ve s
ize (
%)

CHARACTERIZATION OF PRIMARY AND SECONDARY MATERIALS D1.1
28 | 43
3.4 SOMINCOR POLYMETALLIC CONCENTRATE
Elemental composition of Somincor material was determined using previously described ME-ICPORE
methodology. Results, both obtained by CLC and IMNR were very similar, data were presented in table 20.
Table 20. ELEMENTAL COMPOSITION OF SOMINCOR POLYMETALLIC CONCENTRATE, [%]
Sample Cu Fe Ca Pb Zn As Mn Bi Cd Hg Si S Ag Sb Co
SOMINCOR
concentrate 5.20 29.9 0.025 14.8 9.10 0.28 0.011 0.015 0.022 0.0081 0.5 40.4 0.0267 0.14 0.011
Density of this material was estimated at 4.7028 t/m3 (IMNR).
Qualitative analysis was done by X-ray powder diffraction method (IMNR). The obtained XRD pattern was
presented in figure 17, while qualitative evaluation of possible structures in table 21.
Fig. 17. XRD pattern of SOMINCOR polymetallic concentrate.
Quartz
Biotite
Ramsbeckite
Covellite
Chalcopyrite
Sphalerite
Galena
Pyrite
CCS0
Inte
nsi
ty (
cps)
0
1000
2Theta (deg)
10 20 30 40 50 60
Table 21. XRD RESULTS OF SOMINCOR POLYMETALLIC CONCENTRATE
MINERAL
Sample Pyrite Galena Sphalerite Chalcopyrite Covellite Ramsbeckite Biotite Quartz
SOMINCOR FeS2 PbS ZnS CuFeS2 CuS Cu15(OH)22
(SO4)4(H2O)6
KFeMg2(AlSi3O10)(O
H)2 SiO2

CHARACTERIZATION OF PRIMARY AND SECONDARY MATERIALS D1.1
29 | 43
The semiquantitaive analysis obtained using RIR method resulted in content evaluation for identified minerals
(table 22) – IMNR.
Microscopic study (IMNR and CLC) in reflected and transmitted light highlighted the following minerals (in order
of frequency): pyrite – FeS2; chalcopyrite – CuFeS2; galena – PbS; sphalerite – ZnS; cubanite– CuFe2S3 and
undetermined transparent minerals (possibly quartz). Sample examined in reflected light was mainly composed of
pyrite as grains with dimensions from less than 1 micrometer up to hundreds of micrometers. Pyrite graines
similarly to other minerals, were of micrometer dimension – less than micrometer. The other minerals occured as
independent or associated with pyrite. Pyrite grains with low anisotropy were highlighted, characteristic for
arseno-pyrite. The study carried out in transmitted light for material immersed in nitrobenzene showed the
presence of transparent grains, micrometric – undermicrometric, microscopically indeterminable. Microscopic
images were presented in figure 18.
Fig. 18. Images of metallographic microscope of SOMINCOR polymetallic concentrate, in reflected light: a – with
pyrite (py), sphalerite (sph), galena (gl), chalcopyrite (cpy) and cubanite (cb), and in transmitted light: b – with
pyrite (py), chalcopyrite (cpy), galena (gl) and sphalerite (sph) with yellow-brown internal reflections.
Table 22. MINERALOGY OF SOMINCOR POLYMETALLIC CONCENTRATE, [%]
MINERAL
Sample Pyrite Galena Sphalerite Chalcopyrite Covellite Ramsbeckite Biotite Quartz
SOMINCOR 54 15.4 13.4 13 1.2 1.1 1.0 0.9
a b

CHARACTERIZATION OF PRIMARY AND SECONDARY MATERIALS D1.1
30 | 43
Mineralogical analysis was performed using metallographic microscope. Images obtained from the microscope
were presented in figure 19.
Fig. 19. Images of metallographic microscope of Somincor sample: a – heterogenous grain size, pyrite (py) as
a main species, high level of primary sulphides associated to pyrite (py); b – pyrite (py) detail with primary
sulphides, sphalerite (sl), galena (gn) and tetrahedrite (td); c – pyrite (py) particle with sphalerite (sl); d – primary
sulphide particle containing pyrite (py), galena (gn) and chalcopyrite (cp).
Results of grain size analysis performed by IMNR were presented in table 23 and in figure 20.
a b
c d

CHARACTERIZATION OF PRIMARY AND SECONDARY MATERIALS D1.1
31 | 43
Table 23. GRAIN SIZE DISTRIBUTION OF SOMINCOR POLYMETALLIC CONCENTRATE
Size class, mm m, % Undersize, % Oversize, %
d > 0.150 0.57 100.00 0.57
0.100 < d < 0.150 0.57 99.43 1.14
0.090 < d < 0.100 0.37 98.86 1.52
0.071 < d < 0.090 0.62 98.48 2.13
0.063 < d < 0.071 0.60 97.87 2.73
0.040 < d < 0.063 4.76 97.27 7,50
0.032 < d < 0.040 4.46 92.50 11.95
0.025 < d < 0.032 23.36 88,05 35.31
d < 0.025 64.69 64.69 100.00
Fig. 20. Particle size distribution of SOMINCOR polymetallic concentrate.
Grain size distribution of the polymetallic concentrate
0
10
20
30
40
50
60
70
80
90
100
110
0 0,05 0,1 0,15 0,2 0,25
size (mm)
cu
mu
lati
ve s
ize (
%)

CHARACTERIZATION OF PRIMARY AND SECONDARY MATERIALS D1.1
32 | 43
3.5 BOR PYRITE CONCENTRATE
The BOR pyrite concentrate was analyzed according to the similar methodology. At first elemental composition
was determined using combination of ICP-AES, FAAS, XRF, gravimetry, fire assay and carbon and sulfur analysis.
Results obtained by BOR INST and IMNR were similar and were presented in table 24.
Table 24. ELEMENTAL COMPOSITION OF BOR PYRITE CONCENTRATE, [%]
SAMPLE Cu Fe CaO Pb Zn As Hg S Si Ag Al2O3 C
BOR pyrite 1.77 39.29 0.83 0.014 0.009 0.011 0.0001 44.04 4.11 0.0008 1.75 0.7
SAMPLE MgO Se SiO2 Ti
BOR pyrite 0.07 0.009 7.96 0.027
Additionally, Ba, Cd, Ga, La, Te and Zr were found at levels lower than 0.001 % , while Cr, Ge and V at levels lower
than 0.005 %.
BOR pyrite concentrate density evaluated by IMNR using pycnometric analysis was 4.3225 t/m3.
Qualitative analysis performed at BOR INST using XRD method (figure 21) revealed 4 structures i.e. pyrite (FeS2),
quartz (SiO2), calcite (Ca(CO)3) and potassium in form of Cu8K3S6.
Fig. 21. XRD pattern of BOR pyrite concentrate (BOR INST).
The same type of analysis prepared by IMNR demonstrated 14 different minerals, and 8 most common were
presented in table 25.

CHARACTERIZATION OF PRIMARY AND SECONDARY MATERIALS D1.1
33 | 43
The other possible structures include: hydronium jarosite – (K,H3O)Fe3(SO4)2(OH)6, wroewolfeite –
Cu4(OH)6(SO4)(H2O)2, alunite – KAl3(SO4)2(OH)6, pyrophyllite – (Al4Si8O20(OH)4).3333, diaspore – AlOOH and biotite –
KFeMg2(AlSi3O10)(OH)2.
Quantitative analysis of pyrite concentrate performed by IMNR was presented in table 26. Content of sulfide
mass in the whole sample was as high as 84.4%.
Table 26. MINERALOGY OF BOR PYRITE CONCENTRATE, [%]
MINERAL
Sample Pyrite Quartz Wroewolfeite Hydronium
jarosite Sphalerite Gypsum Chalcopyrite Covellite Alunite
BOR
pyrite 79.6 10.4 2.3 1.6 0.01 1.3 0.8 0.6 1.3
Microscopic study (IMNR) in reflected light and in transmitted light of the analysed sample highlighted the
following minerals (in order of frequency): pyrite – FeS2; sphalerite – ZnS; covellite – CuS; chalcopyrite – CuFeS2;
bornite – Cu5FeS4; magnetite – Fe3O4; carbonaceous material (coke, charcoal) and quartz – SiO2.
Sample examined in reflected light was mainly composed of pyrite in a form of grains with size between 1
micrometer to hundreds of micrometers. Other minerals were usually associated with pyrite. Sphalerite appeared
as independent grains or was associated with pyrite and covellite. Covellite appeared as having dimensions from 1
micron up to hundreds of microns, most often associated with pyrite, or in the form of globular particles with
dendritic structure. Covellite was present on the cracks into bornite granules or as bornite exclusions.
Chalcopyrite was observed as grains with dimensions of up to hundreds of microns, independent or associated
with pyrite. Bornite occured as crystals with under-micron dimension, with dendritic structure embedded into
globular covellite. In addition, bornite was found as granules with dimension up to hundreds of microns,
independent or associated with covellite. Magnetite was accidentally found in globular glass particles, perhaps
fayalitic glass or as microcrystals in bornite. Carbonaceous matter was accidentally detected as charcoal and coke.
The study carried out in transmitted light on a sample immersed in nitrobenzene showed the abundant presence
of quartz as crystals with sizes from microns up to hundreds of microns.
Table 25. XRD RESULTS OF BOR PYRITE CONCENTRATE
MINERAL
Sample Pyrite Quartz Sphalerite Gypsum Chalcopyrite Rutile Covellite Molybdenite
BOR
pyrite FeS2 SiO2 ZnS Ca(SO4)(H2O)2 CuFeS2 TiO2 CuS MoS2

CHARACTERIZATION OF PRIMARY AND SECONDARY MATERIALS D1.1
34 | 43
Fig. 22. Images of metallographic microscope of BOR pyrite concentrate, in reflected light: a – with pyrite (py),
sphalerite (sph), covellite (cv), chalcopyrite (cpy), and in transmitted light: b – with quartz (qtz).
Particle size distribution was determined using laser particle size analyzer as well as a series of standard sieves.
Results of sieving was presented in table 27 and laser analysis in figure 23.
Table 27. GRAIN SIZE DISTRIBUTION OF BOR PIRYTE CONCENTRATE
Size class, mm m, % Undersize, % Oversize, %
-0.300+0.212 5.00 100.00 5.00
-0.212+0.150 2.50 95.00 7.50
-0.150+0.106 6.00 92.50 13.50
-0.106+0.075 16.00 86.50 29.50
-0.075+0.053 10.50 70.50 40.00
-0.053+0.038 11.50 60.00 51.50
-0.038 48.50 48.50 100.00
Fig. 23. Grain size distribution obtained using laser particle analyzer.
These data were in accordance with results presented by IMNR.
a b

CHARACTERIZATION OF PRIMARY AND SECONDARY MATERIALS D1.1
35 | 43
3.6 CLC PYRITE TAILINGS
Residual pyrite was characterized by IMNR. The elemental composition was obtained according to the methods
presented above.
Table 28. ELEMENTAL COMPOSITION OF CLC PYRITE CONCENTRATE, [%]
Sample Cu Fe Ca Pb Zn As Mn Bi Cd Hg Si S Ag Sb Co
CLC
pyrite 0.75 38.20 0.70 1.7 1.4 0.36 0.021 0.012 0.012 - 2.09 51.58 - 0.048 -
Density of this material was estimated at 4.6353 t/m3 (IMNR).
Qualitative analysis was performed using XRD method with a pattern presented in figure 24, while list of detected
minerals with their structures was presented in table 29.
Fig. 24. XRD pattern of CLC pyrite concentrate.
Macphersonite
Gypsum
Galena
Quartz
Bassanite
Anglesite
Chalcopyrite
Sphalerite
Pyrite
CCCO-concentrat polimetalic
Inte
nsi
ty (
cps)
0
1000
2Theta (deg)
10 20 30 40 50 60 70
Table 29. XRD RESULTS OF CLC PYRITE CONCENTRATE
MINERAL
Sample Pyrite Quartz Sphalerite Gypsum Chalcopyrite Galena Anglesite Bassanite Macphersonite
CLC
pyrite FeS2 SiO2 ZnS
Ca(SO4)·
(H2O)2 CuFeS2 PbS PbSO4 MoS2
Pb4(SO4)(CO3)2
(OH)2

CHARACTERIZATION OF PRIMARY AND SECONDARY MATERIALS D1.1
36 | 43
Quantitative evaluation of identified minerals, obtained by IMNR – using RIR (Reference Intensity Ratio) method,
was presented in table 30.
Microscopic study in reflected light highlighted the following minerals (in order of frequency): pyrite – FeS2;
sphalerite – ZnS; chalcopyrite – CuFeS2; galena – PbS; bornite – Cu5FeS4; chalcocite – Cu2S and covellite – CuS.
Sample examined in reflected light was composed mainly of pyrite as grains with dimensions from less than 1
micrometer up to hundreds of micrometers. Pyrite occured mostly as individual crystals, and associated with
other minerals present in the sample. Sphalerite occurred as associated with pyrite, galena, chalcopyrite.
Chalcopyrite occured individually as well as was associated with pyrite, bornite. Galena occured individually and
associated with pyrite. Bornite was present as individual and associated with chalcocite and pyrite. Covellite was
associated with pyrite.
Fig. 25. Images of metallographic microscope of CLC pyrite tailings, in reflected light: a – with pyrite (py),
sphalerite (sph), chalcocite (chc), bornite (bn) and covellite (cv), and in transmitted light: b – with pyrite (py),
and galena (gl).
Table 30. MINERALOGY OF CLC PYRITE CONCENTRATE, [%]
MINERAL
Sample Pyrite Quartz Sphalerite Gypsum Chalcopyrite Galena Anglesite Bassanite Macphersonite
CLC
pyrite 78 2 8 1 5 2 2 2 <1
a b

CHARACTERIZATION OF PRIMARY AND SECONDARY MATERIALS D1.1
37 | 43
Results of grain size analysis performed by IMNR were presented in table 31 and in figure 26.
Table 31. GRAIN SIZE DISTRIBUTION OF CLC PYRITE TAILINGS
Size class, mm m, % Undersize, % Oversize, %
d > 0.150 2.32 100.00 2.32
0.100 < d < 0.150 4.22 97.68 6.55
0.090 < d < 0.100 3.55 93.45 10.09
0.071 < d < 0.090 6.12 89.91 16.21
0.063 < d < 0.071 3.21 83.79 19.42
0.040 < d < 0.063 18.59 80.58 38.01
0.032 < d < 0.040 13.67 61.99 51.68
0.025 < d < 0.032 10.13 48.32 61.82
d < 0.025 38.18 38.18 100.00
Fig. 26. Particle size distribution of CLC pyrite tailings.
Grain size distribution of the residual pyrite
0
10
20
30
40
50
60
70
80
90
100
110
0 0,05 0,1 0,15 0,2 0,25
size (mm)
cu
mu
lati
ve s
ize (
%)

CHARACTERIZATION OF PRIMARY AND SECONDARY MATERIALS D1.1
38 | 43
3.7 SOMINCOR PYRITE CONCENTRATE
Material deliverd by Somincor was thoroughly analyzed at IMN with respect to elements composition, particle
size distribution and qualitatively with respect to its content of minerals.
Table 32. ELEMENTAL COMPOSITION OF SOMINCOR PYRITE TAILINGS, [%]
Sample Cu Fe Ca Pb Zn As Mn Bi Si S Ag Sb Co
Somincor
pyrite 0.42 42.4 – 0.98 2.06 – – – – 46.05 0.0045 0.049 0.012
Qualitative analysis was performed using XRD method, the resulting pattern was presented in figure 27.
Fig. 27. XRD pattern of Somincor pyrite tailings.

CHARACTERIZATION OF PRIMARY AND SECONDARY MATERIALS D1.1
39 | 43
Material contained mostly pyrite – FeS2, but also sfalerite – ZnS and quartz – SiO2. In very tiny amount basanite
CaSO4(H2O)0.5 was present and probably in trace amount aluminosilicate of kaolinite structure Al4(OH)8Si4O10 or
minerals such as serafinite (Mg,Fe)6(Si,Al)4O10(OH)8. However, diffraction lines intensity from these minerals were
too weak to define it perfectly.
Structural analysis using X-ray microanalyzer JXA 8230, JEOL was performed (IMN). Samples were sputtered with
thin gold layer to avoid charge agglomeration. This produced a signal in recorded spectra due to Mα Au line.
This technique allowed to prepare elements distribution and perform qualitative and quantitative point analysis
using EDS mode. Maps of elements were presented in figure 28.
Fig. 28. Elements distribution within selected area using magnification 400x.
Qualitative and quantitative analyses were performed for selected points – presented in figure 29.
Zn K50 µm Cu K50 µm Fe K50 µm Ca K50 µm
K K100 µm S K100 µm Si K50 µm Al K50 µm
Mg K50 µm O K100 µm COMPO50 µm

CHARACTERIZATION OF PRIMARY AND SECONDARY MATERIALS D1.1
40 | 43
Spectra for points 1, 2, 3 and 4, where points 1 and 4 were attributed to iron in form of FeS2.
Point 1
mass% atom%
O 6.0 13.8
Mg 0.8 1.2
Al 0.5 0.7
Si 0.9 1.2
S 45.0 52.0
Ca 0.8 0.7
Fe 43.8 29.1
Zn 2.3 1.3
Point 2
mass% atom%
Si 0.6 0.9
S 51.0 64.2
Fe 48.4 34.9
Point 3
mass% atom%
O 1.3 3.2
Si 0.5 0.7
S 50.2 62.0
Ca 0.3 0.3
Fe 47.7 33.9
keV
0.00 1.00 2.00 3.00 4.00 5.00 6.00 7.00 8.00 9.00 10.00
CP
S
0.0
10.0
20.0
30.0
40.0
50.0
60.0
70.0
80.0
90.0
100.0001
O
Fe
ZnMg
Al
Si
SS
CaCa
Fe
Fe
Zn Zn
keV
0.00 1.00 2.00 3.00 4.00 5.00 6.00 7.00 8.00 9.00 10.00
CP
S
0.0
20.0
40.0
60.0
80.0
100.0
120.0
140.0
160.0
180.0
200.0002
Fe
Si
S
S
Fe
Fe
keV
0.00 1.00 2.00 3.00 4.00 5.00 6.00 7.00 8.00 9.00 10.00
CP
S
0.0
20.0
40.0
60.0
80.0
100.0
120.0
140.0
160.0
180.0
200.0003
O
Fe
Si
S
S
Ca Ca
Fe
Fe

CHARACTERIZATION OF PRIMARY AND SECONDARY MATERIALS D1.1
41 | 43
Point 4
mass% atom%
O 1.6 4.0
Mg 0.2 0.3
Al 0.3 0.4
Si 0.5 0.6
S 49.4 60.8
Fe 48.0 33.9
Fig. 29. Quantitative analysis using EDS method for previously selected points.
Additionally particle size analysis, using laser particle analyzer, was performed (IMN).
Fig. 30. Particle size distribution of Somincor pyrite tailings.
keV
0.00 1.00 2.00 3.00 4.00 5.00 6.00 7.00 8.00 9.00 10.00
CP
S
0.0
20.0
40.0
60.0
80.0
100.0
120.0
140.0
160.0
180.0
200.0004
O
Fe
Mg Al Si
S
S
Fe
Fe

CHARACTERIZATION OF PRIMARY AND SECONDARY MATERIALS D1.1
42 | 43
4. SUMMARY
Within the scope of the study materials delivered by CLC, KGHM, BOR and Somincor were characterized.
These included polymetallic ores and concentrates and complex or low grade copper ores and concentrates and
pyrite concentrates.
The complete elemental analysis was done for every material using the best available methodology (ICP).
Additionaly, some samples were treated by different techniques like XRF, FAAS, carbon and sulphur analysis and
gravimetry to entirely show the composition of the materials.
Real density of materials was determined using pycnometer method. In several cases also bulk density was
determined.
XRD method was used for qualitative analysis of all materials. Except XRD patterns the obtained results
were collected in tables showing the determined structure of the mineral.
Microscopy analysis with additional equipment setups was used to supplement XRD results i.e. the
qualitative results as well as to perform quantitative evaluation of the particular minerals within each sample.
This allowed to establish association between minerals within analyzed materials.
Particle size distribution was determined for every material either using laser particle analyzer or by set of
sieves, or using both these methods.
Although similar level of copper can be found in CLC ROM (~1%) and KGHM ROM (~1.2%) the amount of
other metals is varied. Lead content in CLC material is ca. 15 time higher (2.4% instead of 0.16% for KGHM), zinc
content is 3.35% and lower than 0.05% for CLC and KGHM, respectively. Almost 20 times higher antimony content
can be observed in CLC material and only 3 times bigger value of cobalt. In both materials the same silver amount
was observed i.e. 0.0057%.
All concentrates, i.e. the polymetallic from CLC, Somincor and BOR as well as low grade from KGHM, were
thoroughly analyzed to determine their elemental composition. Mostly, 15 elements were analyzed, which was
sufficient for further research. In one case analysis covered more than 30 elements to show the precision of
assumed methodologies. X-ray powder diffraction with microscopic techniques allowed to evaluate differences
between materials with respect to their mineralogy. BOR and CLC have very similar Cu content (~1.8%), tripled
value was obtained for Somincor (5.2%), while the highest (13%) for material from KGHM. The highest Fe content
was found in CLC (38%), also in Somincor (29%) and BOR concentrate (23%) these value were high. On the
contrary KGHM concentrate has about 8% Fe. Zn and Pb content were as follows: 5.8% and 3.6%; 4.6% and 4.6%;
9.1% and 14.8%; 1.1% and 4.6%, respectively for CLC, BOR, Somincor and KGHM. The highest Ag content was
found in KGHM material circa 640 ppm and only 85 ppm in the CLC one.
CLC material was mainly composed of pyrite (80%) with some sphalerite and chalcopyrite. BOR consisted of 45%
pyrite, 25% barite and also sphalerite, galena and waste (11%). Somincor cointained 54% pyrite and almost equal

CHARACTERIZATION OF PRIMARY AND SECONDARY MATERIALS D1.1
43 | 43
(~15%) galena, sphalerite and chalcopyrite. Analysis of KGHM material showed 10% pyrite, ~20% bornite,
~20%dolomite, 9% rectorite and 14% quartz.
Additionally, BOR pyrite concentrate was taken into consideration in this report.


