i
PRODUCT DIVERSIFICATION AND PROFITABILITY
A CASE STUDY: VESTEL A.Ş.
A THESIS SUBMITTED TO
THE GRADUATE SCHOOL OF SOCIAL SCIENCES
OF
MIDDLE EAST TECHNICAL UNIVERSITY
BY
BANU AKGÜL
IN PARTIAL FULFILLMENT OF THE REQUIREMENTS
FOR
THE DEGREE OF MASTER OF SCIENCE
IN
THE DEPARTMENT OF ECONOMICS
MARCH 2015

ii
Approval of the Graduate School of Social Sciences
Prof. Dr. Meliha Altunışık
Director
I certify that this thesis satisfies all the requirements as a thesis for the degree of
Master of Science.
Prof. Dr. Nadir Öcal
Head of Department
This is to certify that we have read this thesis and that in our opinion it is fully
adequate, in scope and quality, as a thesis for the degree of Master of Science.
Assoc. Prof. Dr. Kutsal Doğan Prof. Dr. Erkan Erdil
Co-Advisor Supervisor
Examining Committee Members
Prof. Dr. Erkan Erdil (METU, ECON)
Assoc. Prof. Dr. Kutsal Doğan (OZU, ECON)
Prof. Dr. Teoman Pamukçu (METU, STPS)
Assoc. Prof. Dr. Bedri Kamil Onur Taş (TOBB ETU, ECON)
Assistant Prof. Serkan Küçükşenel (METU, ECON)

iii
I hereby declare that all information in this document has been obtained and
presented in accordance with academic rules and ethical conduct. I also declare
that, as required by these rules and conduct, I have fully cited and referenced all
material and results that are not original to this work.
Name, Last name: Banu Akgül
Signature :
iv
ABSTRACT
PRODUCT DIVERSIFICATION AND PROFITABILITY
A CASE STUDY: VESTEL A.Ş.
Akgül, Banu
M.Sc. Department of Economics
Supervisor: Prof. Erkan Erdil
Co-Advisor: Assoc. Prof. Kutsal Doğan
March 2015, 71 pages
The aim of this study is to examine the effect of diversification on the profitability of a
firm. To this end, Vestel Co. is examined by conducting an econometric analysis with
panel data gathered from different departments of the firm. Importance and the most
significant contribution of this study to the literature is that it analyzes a single firm in
contrast to the studies including lots of firms operating in the same sector; and this
allows us to examine the effect of diversification over time, through the firm’s
lifetime. Data used in this study have been compiled from different sources within
Vestel: Budget and Planning, Research and Strategic Analysis, Finance, and Law
Departments starting from the first quarter of 1994 to second quarter of 2014. As the
results show, there exists u-shape relationship between diversification and the firm’s
profitability; i.e., with an increase in the level of diversification profitability also
increases in the long run in case of related diversification. Although, the effect of
intangible assets is negative on profitability in the short-run, its effect reverse and turn
to positive in the long run. The most important result of this study is that, with related
diversification, the firm gains profitability and enjoys its intangible assets in the long
run.
Keywords: Product Diversification, Panel Data Analysis
v
ÖZ
ÜRÜN ÇEŞİTLİLİĞİ VE KARLILIK
DURUM ÇALIŞMASI: VESTEL TİC. A.Ş.
Akgül, Banu
Yüksek Lisans, İktisat Bölümü
Tez Yöneticisi: Prof. Dr. Erkan Erdil
Yardımcı Tez Danışmanı: Doç. Dr. Kutsal Doğan
Mart 2015, 71 Sayfa
Bu çalışmanın amacı, ürün çeşitliliğinin firmanın karlılığı üzerindeki etkisini
incelemektir. Bu amaç için Vestel Ticaret A.Ş., panel data ekonometrik analizi ile
incelenmiştir. Çalışmanın önemi ve literature olan anlamlı katkısı, aynı sektördeki pek
çok firmayı inceleyen diğer çalışmaların aksine bir firmanın incelenmesi ile o
firmanın zaman içerisinde ve tüm hayatı boyunca ürün çeşitliliğinden nasıl
etkilendiğinin gözlenebilmesidir. Sektörler için 1994 yılının birinci çeyreğinden 2014
yılının ikinci çeyreğine kadar olan data Vestel Planlama ve Bütçe, Hukuk, Araştırma
ve Stratejik Geliştirme ve Finans Departmanlarından temin edilmiştir. Sonuçlar
firmanın karlılığı ve ürün çeşitliliği arasında u-formunda bir ilişki olduğunu
göstermektedir; yani uzun vadede ürün çeşitliliği seviyesinin artışı ile karlılık
artmaktadır. Gayri maddi varlıklar uzun vadede karlılığın artmasını sağlarken kısa
vadede karlılığı olumsuz etkilemektedir. Çalışmanın en önemli sonucu bize şunu
göstermektedir: ilişkili ürün çeşitliliği ile firma karlılığını arttırmakta ve uzun vadede
gayri maddi varlıklarından faydalanmaktadır.
Anahtar Kelimeler: Ürün çeşitliliği, Panel Data Analizi

vi
To my family..

vii
ACKNOWLEDGMENTS
I would like to express my deepest gratitude to my supervisor, Prof. Dr. Erkan Erdil
and co-advisor Assoc. Prof. Dr. Kutsal Doğan for their guidance, advice and insights
throughout the research. I also tender my thanks to examining committee members,
Prof. Dr. Teoman Pamukçu, Assoc. Prof. Dr. Bedri Kamil Onur Taş and Assist. Prof.
Dr. Serkan Küçükşenel
I would also like to thank my friends Rengin Ayhan, Sıla Akçay, Hakan Güneş,
Hakan Güney, Dilek Karasoy and Xelef Botanzadeh for their valuable comments and
advice during this research.
I am grateful to my family for their endless support and trust in me.
Finally, I would also like to express my appreciation to TÜBİTAK for the financial
support I have received throughout my MSc. degree education.
viii
TABLE OF CONTENTS
PLAGIARISM ............................................................................................................ iii
ABSTRACT ................................................................................................................ iv
ÖZ ................................................................................................................................. v
DEDICATION ............................................................................................................ vi
ACKNOWLEDGMENTS .......................................................................................... vii
TABLE OF CONTENTS .......................................................................................... viii
LIST OF TABLES ...................................................................................................... ix
LIST OF FIGURES ...................................................................................................... x
CHAPTER
1. INTRODUCTION .................................................................................................... 1
2. HISTORY OF DIVERSIFICATION: LITERATURE SURVEY ........................... 4
2.1. Financial Economics Approach ....................................................................... 4
2.1.1. Diversification Premium Model ............................................................... 5
2.1.2. Diversification Discount Model ............................................................... 8
2.2. Strategic Management Approach .................................................................... 11
2.3. Institutional Economic Approach ................................................................... 16
2.4. Concluding Remarks ....................................................................................... 18
3. THE CASE STUDY: VESTEL A.Ş. ..................................................................... 20
4. METHODOLOGY AND EMPRICAL RESULTS................................................ 30
4.1. Methodology ................................................................................................... 30
4.2. Data Analysis .................................................................................................. 31
4.3. Econometric Analysis ..................................................................................... 37
5. CONCLUSION ...................................................................................................... 44
REFERENCES ........................................................................................................... 46
APPENDICES
A.ECONOMETRIC RESULTS ............................................................................. 54
B.TURKISH SUMMARY ..................................................................................... 60
C. TEZ FOTOKOPİ İZİN FORMU ...................................................................... 71
ix
LIST OF TABLES
TABLES
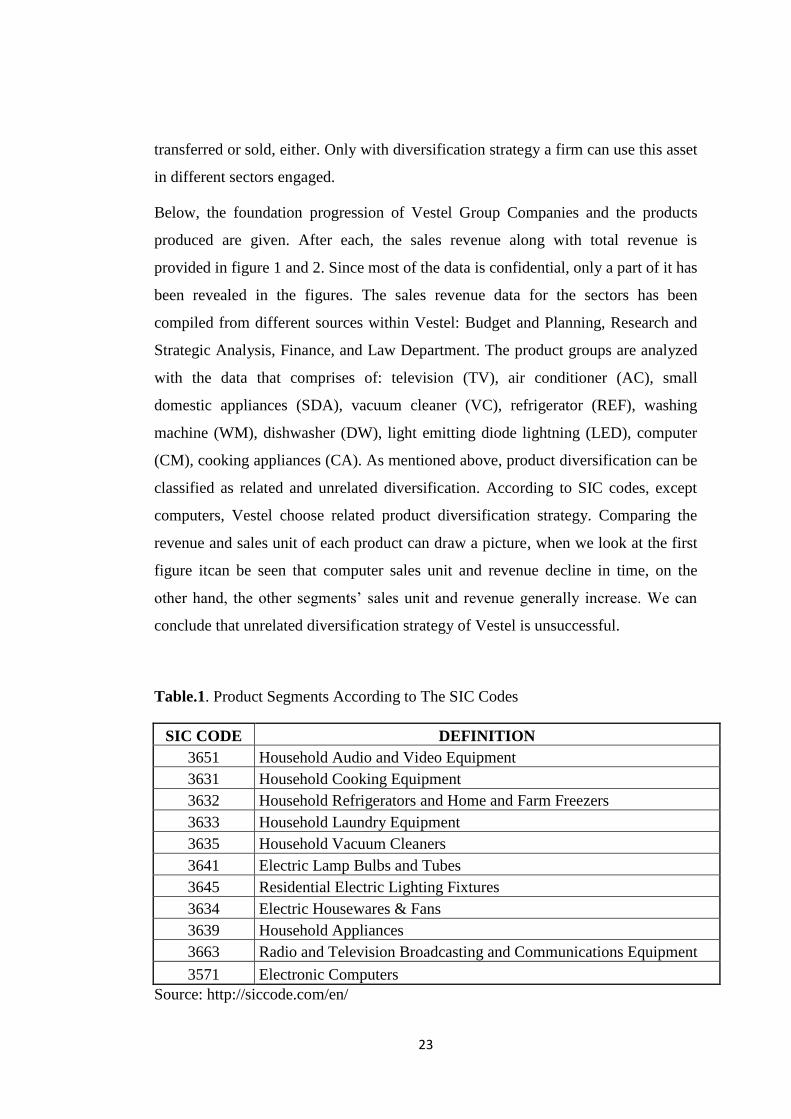
Table 1: Product Segments According to The SIC Codes .................................................... 23
Table 2: Describtion of the Variables .......................................................................... …….34
Table 3: Summary of the Fixed Effect Estimation Results (Model 1: Dependent Variable:
ROA) .................................................................................................................... …….38
Table 4: Summary of the Fixed Effect Estimation Results (Model 2: Dependent Variable:
ROS) ..................................................................................................................... ……39
Table 5: Summary of the Estimation Results (Model 1: Dependent Variable: ROA) .......... 54
Table 6: Summary of the Estimation Results (Model 2: Dependent Variable: ROA) .......... 55
Table 7: Summary of the Estimation Results (Model 3: Dependent Variable: ROA) .......... 56
Table 8: Summary of the Estimation Results (Model 1: Dependent Variable: ROS) ........... 57
Table 9: Summary of the Estimation Results (Model 2: Dependent Variable: ROS) ........... 58
Table 10: Summary of the Estimation Results (Model 3: Dependent Variable: ROS) ......... 59
Table 10: Değişkenlerin Tanımları………………………….………………………………68

x
LIST OF FIGURES
FIGURES
Figure 1: Total Revenue of All Products .................................................................. 24
Figure 2: Total Revenue Share of All Products ........................................................ 25
Figure 3: Total Sales Unit Share of All Products ...................................................... 26
Figure 4: Panel Data Modelling Process ................................................................... 31

1
CHAPTER 1
INTRODUCTION
Increasing productivity and using factors of production effectively have been always
crucial and important discussion topics for economists in both micro and macro
level to explain the dynamics from interpersonal to international relations/affairs.
Economists are in general divided into two groups: one suggesting specialization,
and the other suggesting diversification. In late 18th century, for example, the key to
productivity was specialization. While Adam Smith has suggested the idea of
specialization of labor with the example of a pin factory, i.e. dividing work into a set
of simple tasks to be performed by specialized workers can increase the number of
pins to be produced by the same number of workers in “An Inquiry into the Nature
and Causes of the Wealth of Nations” (Smith, 1776), David Ricardo has come up
with the idea of specialization at the country level; and explained this by using the
concept of opportunity cost. However, the expression “don’t put all your eggs into
one basket” is a layman’s word and it well describes the act of diversification. Not
just for nations, specialization or portfolio investment, act of diversification on the
other hand, has been also a popular discussion for firms to decide on their strategy.
Product diversification versus focusing on one product are the major strategies in
which firms decide and engage for increasing profitability, market value, revenue or
both of them. However, there is a paradox about which strategy is the best one for
firms in realizing the ends.
The idea of diversification emerged rather late than specialization, which was in
1950, in 1950s, and the aim was to reduce risks by not sticking into one sector, to
decrease volatility under uncertain economic conditions. During 1960s,
diversification has been seen as a value - creating strategy, but this trend has
reversed since 1980 (Osorio et al., 2012). On the other hand, after 1980’s there are
many studies showing that diversification destroys value of a firm (Lang and Stulz,
1994; Berger and Ofek, 1995 and Servaes, 1996). In spite of the trends in the
2
literature, there are no clear results about the effect of diversification on firm
performance. Economic conditions of the home country, political environment,
sector that the firm belongs to diversification type and levels are some of the factors
affecting the firm performance through diversification strategy (Osorio et al., 2012).
This study aims to analyze the effects of product diversification on the profitability
of a firm; To conduct this study, Turkish company with diversified product portfolio
has been analyzed. Due to the size and potential impact on the Turkish market
Vestel Company (Vestel Co.) has been selected. Vestel Co. is one of the leading
domestic consumer electronics company in Turkey, the others are Arçelik and
Samsung, LG, Bosh in the world. The firm engages in designing, manufacturing and
marketing of televisions, refrigerators, air conditioners, washing machines, dish
washers, cooking appliances, computers, small domestic appliances (SDA), vacuum
cleaners and LED lightening. In 2014, Vestel Co. continues to expand its product
range with tablet and smart phones. Through its smartphones Vestel Co. became the
first domestic smartphone brand in Turkey. With this wide product range and a
reputable brand, Vestel Co. is a very important player in domestic markets. Another
reason for selecting Vestel Co. is, in general, global manufacturing firms in the area
of durable consumer goods and consumer electronics such as BSH Group (Bosh,
Siemens, Profilo), Samsung, LG, Indesit, Electrolux and Phillips are considered, we
can see that they all choose to diversify. In domestic level, Arçelik and Vestel Co.
are the examples of the firms making product diversification in the area of consumer
electronics. In light of the literature; this study shows that Vestel Co. engages in
related diversification and investigates the question that: Is diversification a good
strategy for Vestel Co. in increasing the firm performance and value like the global
and domestic competitors, or should it come to a halt and Vestel Co. focus on only
one product? If diversification is a good strategy what should be the extent of it?
Contributions of this study to the existing literature can be summarized as following:
firstly, contrary to the examples in existing literature examining a group of firms,
only a single firm is analyzed in this study beginning from the early stages of
production -when the firm producing and marketing only one product. In addition
ample studies in literature find the “inverted-u” relationship between diversification
3
level and firm performance. In our study for Vestel Co., profitability decreases to a
certain level but increases thereafter, and it can be described as a u-shaped curve.
The study outlined as follows: Chapter 1, is an introduction to the study ass being
discussed. Chapter 2 reviews the existing literature for the link between product
diversification and firm profitability. The prior studies have been examined in time
dimension, according to their points of view, and according to the results. Chapter 3
gives us a summary of the diversification strategy of Vestel Co., the relative
revenues of each product compared to total revenue, etc.
Chapter 4 presents the methodology, how we analyze the panel data. Chapter 5
introduces the data used in empirical analysis, the variables to be used in
econometric analysis are identified; and the results of this study are examined.
Finally, Chapter 6 summarizes and concludes the study.
4
CHAPTER 2
HISTORY OF DIVERSIFICATION: LITERATURE SURVEY AND
EMPIRICAL STUDIES
This chapter aims to show main views about the linkage between product
diversification and firm performance. The assumptions of each view are classified
according to chronological order. This chapter is organized as follows: firstly the
“Financial Economics Approach” will be discussed –analyzing diversification
premium model and diversification discount model that present positive and
negative theoretical views about product diversification strategy on firm value-,
respectively. Then, “Strategic Management Approach” is mentioned –analyzing
types and levels of diversification and the linkage with the firm performance-.
Finally, “Institutional Economics Approach” comes -investigating the effects of
diversification on firm performance under different institutional frameworks-.
2.1. Financial Economics Approach
There is considerable interest in economics and finance literature to explore the
effects of product diversification on a firm’s performance. There are many reasons
for choosing diversification strategy, to name a few: increasing growth and
productivity, utilizing internal resources efficiently, reducing the bankruptcy risk
through allocation of the risks among different business segments, etc. (Osorio et al.,
2012; Palich et al. 2000; Zhao, 2008). Economics and finance literature generally
analyze the effects of diversification on a firm’s value by comparing performance
differences between diversified and specialized firms. However, one could conclude
based on the empirical studies that results differ as to whether or not diversification
would benefit improving a firm’s performance. Basu (2009) summarizes the
historical development of the diversification strategy: Until 1980s the general view
is optimistic about product diversification, but after 1980s refocusing becomes the
main strategy, from 1980 to 1997, in line with these results, the ratio of firms
5
adopting strategy of diversification declines from 40% to 17%. The following two
chapters tell us about the types of financial economic approach.
2.1.1. Diversification Premium Model
Although there may be studies written before these dates, the oldest study about
diversification dates to 1960s. Most of the studies in the literature written during the
1960s and 1970s find positive and linear relationship between diversification and
firm performance; these findings can also be generalized as “premium
diversification model” which can be identified in the studies of Osorio et al. (2012)
and Palich et al. (2000). Most of the studies compare return on asset (ROA),
indicator of profitability of a company relative to its total assets; profitability;
market to book ratio, measurement of how much a company is worth in
comparison with its capital investments -sum of market value of equity and book
value of debt divided by the book value of assets- ;and, excess value -measured by
dividing a firm’s actual value to its imputed value (value of each segment of a firm
is calculated as single segment) - (Campa and Cedia, 2002 and Berger and
Ofek,1995) of the diversified and focused firms in order to analyze firm
performance (Osorio et al., 2012; Zhao, 2008 and Galvan, 2007). From the
perspectives of the industrial organization economics, transaction cost economics
and traditional financial theory, diversification and firm performance are linearly
and positively related based on some assumptions. Moreover, firms applying
diversification in their production strategy are equipped by some advantages as will
be explained below.
According to industrial organization view, diversified firms gain “market power
advantage” by using a different type of mechanism from their rivals in their
production (Scherer, 1980, and Wan et al., 2011). Although there is little evidence of
“predatory pricing mechanism” in some of the studies (Geroski, 1995), one of the
advantages that diversification brings to the firms is predatory pricing mechanism
(Osorio et al., 2012; and Palich et al. 2000). This can be explained by cross
subsidization policy and cost advantages of firms. Diversified firms can subsidize
less profitable segments by more profitable segments (Weston, 1977). Last but not
least, by using cost and cross subsidization advantage, diversified firms can follow
6
lower pricing strategy and avoid higher production costs (startup costs) which new
entrants to the sector face (Scherer, 1980).
According to the financial view, there are some other crucial advantages of
diversification. First of all, firms can reduce the risk of bankruptcy, and diversify
other risks by having different business portfolios and this coinsurance give a firm
greater debt capacity than a single segment firm (Galvan and De La Torre, 2007 and
Myers, 1977). Advantages of diversified product portfolio while borrowing can be
grouped under two. First, the cost of borrowing will be lower due to greater debt
capacity and lower risk of bankruptcy. Second, since interest payments are tax
deductible; with greater debt capacity a firm can enjoy lower tax advantages (Palich
et al., 2000; Berger and Ofek, 1995 and Servaes, 1996). The studies conducted with
a financial point of view also discuss the advantages of diversification in capability
of acquiring external and internal funds. With internal funds a firm uses its profit as
the new investment capital, while external funds refer to financial derivatives from
outside the firm such as initial public offering (IPO), loans, etc. Since internal funds
have lower transaction costs, it is less costly for a firm to fund its activities with
internal funds than external funds. Lower cost of the use of internal source of capital
ensures that firm has a financial advantage (Palich et al., 2000). Transaction cost
model states that by using external funds, higher transaction cost occurs like interest
payments. Diversified firms have cost advantage due to the use of the internal
sources and transferring the capital between businesses (Gunduz, L. and Tataoğlu,
E., 2003). According to the institution base view, transaction costs depend on
financial market framework (Zhao, 2008). Wan and Hoskisson (2003) state that
since the financial markets are inefficient and there is insufficiency in external
product, labor and product markets in developing countries, it is more costly to use
external funds, on the other hand in developed countries specialized markets can
provide efficient external funds. As a result, one can say that in developing countries
diversified firms have an advantage of using internal funds, while in developed
countries the advantage benefit from using more external funds. Besides the cost of
using capital, accessing the capital itself is a substantial issue. Meyer et al. (1992)
state that diversified firms can utilize the advantage of having easy access to external
7
capital when compared to single segment firms in developed countries due to
diversified business portfolio and lower bankruptcy risk.
Based on these assumptions researchers generally compare diversified and single
segment firms for understanding the effect of diversification on firm performance.
Villalonga (2004) analyzes this issue with assuming that a firm either can diversify
or not. He uses the natural logarithm of the ratio of the actual to imputed market
value that is called excess value for comparing the single segment firms and
diversified firms based on data conducted from Compustat Industry Segment
database -which provides the data of financial statistical and market information
through the world- for all sectors except the financial sector for the time between
1978 to 1997 and find diversification premium. The study of Miller (2006) has a
different approach; he analyzes the effect of technological diversification on firm
performance. He uses patent stocks of a firm as the technological diversity for single
and multibusiness firms. In this study, Miller (2006) shows that diversified firms
increase profitability from technological diversification more than single segment
firms do, and with increase in technological diversification, there will be
diversification premium.
In the early stages of the research -until 1980s when superior performances of
diversified firms are analyzed- all these factors are seen as the advantages of the
diversification strategy; however, after 1980s most of the studies show that
diversification destroys value (Osorio et al., 2012). On the other hand, some
researchers point out endogeneity problem. According to Campa and Kedia (2002)
and Gomes and Livdan (2004) most of the studies do not take into account context
and financial environment of the firm before diversification. They claim that reasons
of firms diversification decisions cause endogeneity. Firms past performance should
be taken into account because firms’ performance before diversification affect the
result of diversification. In the study of Campa and Kedia (2002) which uses
Compustat Industry Segment database from 1978 to 1996 by excluding firms in the
financial sectors to examine the diversification effect; excess value is used and
diversification discount is found without taking into account endogeneity. Although
they control endogeneity by modelling the reasons of firms’ diversification as a
8
function of industry, firm and macroeconomic conditions. They find that
diversification discount turns into diversification premium. Like Campa and Kedia
(2002), Villalonga (2004) also analyses firms’ propensity to diversify and estimates
firms’ propensity to diversify as a function of feature of the firm, macroeconomic
conditions and firms’ industry. Villalonga (2004) claims that profitability of firm has
negative effect on diversification decision, on the other hand attractiveness and
profitability of new segments have positive and significant effect on firms’
diversification decisions. His findings support the idea that the reason of
diversification decision affects the performance of the firm.
After 1980s most of the research advocates that diversification strategy destroys firm
value. Next subsection analyzes diversification discount model.
2.1.2. Diversification Discount Model
Throughout the 1980s, studies concentrate on the negative effects of the
diversification; and they find the “diversification discount” effect which shows the
value loss of a firm due to diversification decision (Osorio et al., 2012; Zhao, 2008).
Finance and economics literature focuses on linear discount model, which shows the
negative relationship between the level of diversification and the firm value (Osorio
et al., 2012). The notion of diversification discount can be found in several financial
economics studies (Berger and Ofek, 1995; Denis, Denis and Sarin, 1997; Lang and
Stulz, 1994 and Rajan et al., 2000). Some of the cross sectional studies in the
diversification discount model use Tobin’s q -the present value of future cash flows
in capital markets divided by replacement costs of tangible assets-. Lang and Stulz
(1994) and Gomes and Livdan(2004) set models and found that diversified firms
have lower Tobin’s q. These claims tell that diversification does not mean a lot in
increasing the market value of installed capital compared to replacement cost of
capital.
The main arguments behind the diversification discount model are cross
subsidization among different sectors resulting in investment in low-performing
sectors, higher agency costs, and higher management costs due to information
asymmetries (Osorio et al.,2012).
9
Theoretical arguments state that subsidization of the less profitable segments by
more profitable segments and overinvestment in the low performing sectors; namely
“cross subsidization”, is one of the reasons for the value loss of diversified firms
(Weston, 1977; Berger and Ofek, 1995; Palich et al. 2000 and Stulz, 1990). Myer et
al. (1992) state that investing in unprofitable segments causes greater value loss and
inefficiency in diversified firms than investing in just one segment by single
segment firms. Berger and Ofek (1995) state that there are many cases which show
that many diversified companies subsidize less profitable segments by more
profitable segments and mostly this can be understood during company transfer
process.
Denis et al. (1997) ask that if the diversification causes value loss, then, why a firm
in the world, insists on a diversification strategy. The agency cost hypothesis can
explain this paradox. This hypothesis states that managers seek their interest, i.e.
managing larger firms equip them with more power and prestige (Denis et al., 1997).
Furthermore, managers allocate the risk among various business portfolios by
making diversification (Stulz, 1990). Denis et al. (1997) and Scharfstein and Jeremy
(2000) show that diversification level and managerial equity ownership have a
strong negative relationship with managerial ownership to reduce the inefficient
investments and additionally, if there is an external control mechanism the
diversification level decreases. These findings prove the inefficient investments
made by managers. Scharfstein and Jeremy (2000) state that managers tend to
overinvest in inefficient business segments in order to increase their private benefits.
However there are flaws of the model according to some of the studies, decisive
factors on the performance of diversification such as past experiences and financial
environment are not taken into account: Campa and Kedia (2002), and Colak (2010)
justify the premium model against the discount model by supporting endogeneity:
Firm diversification decision and firm values are endogenous variables so that one
should analyze underlying reasons lying behind diversification decision (Campa and
Kedia, 2002). If an entity has lower firm value at the beginning, by diversified
business portfolio it faces diversification discount; and generally the firms with poor
performance choose to diversify (Lang and Stulz, 1994). Not only does the initial
10
firm value affect the firm decision, but also industry conditions affect diversification
decision. However, refocusing strategy only depends on the firm value (Çolak,
2010). Campa and Kedia (2002) control this endogeneity in their study and find that
there is no diversification discount, and even in some cases they find diversification
premium by controlling endogeneity. Villalonga (2004) finds that most of the
studies -which defend the diversification discount-, have biased samples and by
eliminating this problem he finds that diversification does not destroy firm value.
Whited (2001) states that using Tobin’s q – market value of the firm divided by
replacement value of the tangible assets- as a proxy for investment opportunities
cause measurement error. In intertemporal studies marginal q should be taken into
account in order to measure unobservable quantity which is present discounted value
of the future marginal product of capital (Hayashi, 1982).
In empirical studies researchers use generally Tobin’s q for value measurement and
empirical evidence, during the 1980s and 1990s show that it is hard to achieve
diversification premium (Osorio et al., 2012). Lang and Stulz (1994); Berger and
Ofek (1995); Shin and Stulz (1998) compare diversified firms and single segment
firms in their studies based on the firms’ Tobin’s q values and the result is
diversified firms trade at a discount compared to single segment firms. In their study
Berger and Ofek (1995) measure Tobin’s q values for diversified firm’s all
segments by treating them different firms by using the data from Compustat Industry
Segment between 1986 -1991 and compare the total value of the firm and they find
that diversification causes 13% to 15% average value loss during 1986 – 1991.
Previous studies analyze the agency cost hypothesis and provide mix evidence.
Denis et al. (1997) in their study constitute negative relationship between managerial
equity ownership and diversification level. Using the fiscal year from 1985 to 1989
Compustat Industry Segment (CIS) data they analyze the firms with sales are of least
$20 million except the financial service firms. They also reveal that corporate
diversification decrease from 1985 to 1989. Lins and Servaes (1999) analyse
publicly traded firms from Germany, Japan and the UK and use the natural
logarithm of the ratio of the actual to imputed market value called excess value and
they estimate two regression models for determining whether diversified firms are
11
trading at a discount or premium. They find out that there are diversification
discount at 10 percent in Japan and 15 percent in UK but there is no discount in
Germany. They argue that ownership structure can affect the results, insider
ownership is dominant in Germany and this factor may prevent the problems of
agency cost hypothesis.
Berger and Ofek’s (1995) study show that diversified firms generally over invest in
low Tobin’s q industries. They also find that cross subsidization is one way of
allocating internal resources to unprofitable or underperforming sectors. Firms
should use resources for more efficient segments. Lang and Stulz (1994)’s study
show that diversification degree will affect firms’ market valuation, with increase in
diversification level market value of the firm will depreciate. Rajan et al. (2000) use
influence cost model based on the agency cost problem and they find that with
increase in segment, it is difficult to give resource allocation decision based on the
segment performance. Managers have lobbying power and it is the most important
factor for the investment decision. Harris et al. (1982) stress information asymmetry
problem they claim that only managers know the most productive resource
allocation.
After 1980s diversification discount model dominates in the studies but financial
economics approach do not take into account level and types of diversification. Next
section analyzes the effect of level and types of diversification on firm performance.
2. 2. Strategic Management Approach
Strategic management literature has been interested in types and levels of
diversification and its effect on firm performance. It is important to emphasize that
strategic management literature generally handles resource-based theory, which
focuses on the relatedness in diversification (Wan et al., 2011). According to
strategic management approach firms can apply two types of product diversification
basically: related and unrelated diversification. These two types of diversification
differentiate in the activities that are being involved. In related diversification the
firms allocate factors of production in activities requiring similar know-how or
similar resources; while the unrelated diversification pushes the firms to engage in
12
different kinds of products or services that diverge from each other in the resources
or know-how used (Galvan, Pindado and Torre; 2007).
While determining the advantages and disadvantages of diversification, resource-
based theory takes two assumptions into consideration: firms’ strategic resources
can be heterogeneous within the industry, and these resources may not be
transferable across firms (Barney, 1991 and Wan et al., 2011). Strategic resources
can be classified as tangible and intangible resources. Example of intangible and
tangible resources can be counted as: brand name, consumer loyalty, technological
know-how, skilled employee, physical and financial assets, etc. (Wernerfelt, 1984).
Different resource allocation across the firms, especially of rare resources is the
reason that creates performance differences within the industry (Barney, 1991 and
Wan et al., 2011). Based on above assumptions; difficulty of imitating, transferring
or selling strategic resources leads firms to diversify in search of excessive resources
(Wan et al., 2011 and Montgomery and Wernerfelt, 1988). If we go into detail about
the firms’ resources: like brand reputation, customer loyalty and the like, some
intangible assets give advantage to the firm in entering to a new product market.
Additionally sales team can sell different segment products, this leads the firm to
have a cost advantage; otherwise these idle resources may result in inefficient
investment for the firm (Palich et al., 2000). Wan et al. (2011) states that
diversification can minimize the transaction costs by utilizing already existing
internal resources more productively. Flexibility of factors of production (capital and
labor) allows the firm to use afore-mentioned reasons more optimally. Besides that,
if the resources are to be used in the production of only one product, diversification
is not a wise strategy since the factors of production are hard to adapt and marginal
utility will be very small (Montgomery and Wernerfelt, 2008; Chatterjee, S. and
Wernerfelt, B., 1991).
The comparison of the related and unrelated diversification is generally made in
resource-based studies (Berger and Ofek, 1995; Bettis, 1981; Hoskisson, 1987;
Markides and Williamson, 1996). In the literature, two methods are used in order to
measure the relatedness of diversification. The first method finds the relatedness of
diversification by using SIC (Standard Industrial Classification) codes. The SIC
13
codes classify industries based on a four-digit code. The first two digits represent the
major group the industry belongs. Adding one digit to these number results in the
industry group number. Finally, the last digit represents the product group. It can be
defined as reaching the new segments which first two digits SIC codes are the same
with the existing ones (Zhao, 2008). The other measurement is based on the
commonality of skill, resources, market or purpose of different sectors (Markides,
1994). The advantage of related diversification comes from the economies of scope
resulted by sharing the common resources (Berger and Ofek, 1995; Helfat and
Einshardt, 2003); on the other hand, a firm can transfer capital and physical
resources from internal markets by unrelated diversification (Galvan and De La
Torre, 2007).
Studies conducted with a strategic management approach generally concentrates on
which type of diversification benefits more to the firm performance rather than
discussing whether diversification in overall benefits the value of the firm. Most of
the studies defend the advantages of the related diversification over unrelated ones
(Barney, 1991; Wernerfelt, 1984; Osorio et al., 2012; and Wan et al., 2011). To
repeat again, the relatedly diversified firms can take advantage of the economies of
scope by allocating common flexible factors of production (tangible and intangible
assets along with financial resources) and know-how among different sectors
(Berger and Ofek, 1995; Helfat and Eisenhardt, 2003). In contrast with the agency
theory, the managerial resources are the critical measure of the firm value in
resource-based theory (Wan et al., 2011).
Most of the studies in the literature try to find the different outcomes between
related and unrelated diversification. Generally researchers measure the relatedness
according to the SIC codes (Osorio, 2012). Markides and Williamson (1996)
measure relatedness according to the firms’ nontradable, nonsubstitutable and hard
to accumulate assets in different market environment. They call valuable,
imperfectly tradable and costly to imitate as strategic assets and strategic asset level
determine the relatedness. Markides and Williamson (1996) provides a potentially
powerful explanation for the importance of strategic assets and show that related
diversification ensures an increase in profitability if firm can share and transfer
14
strategic resources to its new segments. However, the study of Tanrıverdi and
Venkatraman (2005) has different implications. They argue that relatedness of
product knowledge, managerial knowledge or customer knowledge do not increase
firm performance. On the other hand complementarity of the resources of the
segments leads to increase in profitability.
All these are the advantages of related diversification pointed out by resource-based
theory; however, in order to use resources efficiently, one should apply and allocate
the new assets more quickly and cheaply than its rivals would (Wernerfelt, 1984 and
Markides and Williamson, 1994). From the point of view of Nayyar (1992) and
Jones and Hill (1988) using internal resources causes some problems between the
units and become more costly and inefficient. Palich et al. (2000) and Helfat and
Eisenhard (2003) claim that unrelated diversification can provide financial synergies
and reduce the risk. Seth (1990) points out that by reducing risk one can decrease
bankruptcy risk and increase debt capacity. According to intermediate model, with
the increase of diversification level, one faces with positive but diminishing
marginal returns and unrelated diversification can be more advantageous strategy for
the firms (Palich et al., 2000). As far resource-based view, unrelated diversification
can lead to financial synergies but the costs of managing diversified business
portfolio may neutralize the advantage or will weigh more than the advantages.
Gomes and Livdan (2004) state that if a firm’s existing business declines or does not
ensure growth opportunities then the firm should seek new business segments.
Zhao’s (2008) findings support this idea, he categorizes firms in two groups below
and above the industry average based on the firms’ pre-diversification situations and
he finds out that below industry median firms’ values increase with unrelated
diversification.
Besides the type of diversification, another important factor in resource-based theory
is diversification level. Markides and Williamson 1994; Palich et al. (2000);
Markides (1992) and Braakman et al. (2011) mention that marginal cost of
diversification increases as the level of diversification increases. Palich et al. (2000)
and Galvan and De La Torre (2007) found the “inverted u” relationship between the
diversification level and firm performance which is called “curvilinearity”. Galvan
15
and De La Torre (2007) and Markides (1992) have used the square of diversification
index for explaining curvilinear relationship. According to this model, there are two
types of relationships. Firstly, inverted-u relationship can be explained as: there is an
optimal level of diversification which maximizes the firm value, but after that point,
with increase in the diversification level, firm value decreases. The assumption
under this theory takes into consideration that it is always better to have diversified
business segments than being a single segment firm (Palich et al., 2000). On the
other hand a few number of studies find the u-relationship between diversification
level and firm performance (Park and Jang, 2012 and Tang and Jang, 2010). Park
and Jang (2012) in their study analyze U.S. restaurant industry from 1980 to 2008
and use entropy measure for related and unrelated diversified firms. They calculate
the square of the entropy measure for explaining curvilinear relationship.
Entropy measure =∑ PJ x ln (1/ Pj ), where the Pj is the share of the jth industry
groups’ sales out of the total sales of the firm.
They find that related diversification firstly decease profitability, after a certain
point with high level of diversification profitability become to increases. They claim
that with high level related diversification firms enjoy scale and scope economies.
On the other hand, Park and Jang (2012) find that unrelated diversification has an
opposite effect on firm performance. Their results show that profitability increases
up to a certain point, with high level of unrelated diversification profitability
decreases with increasing internal transaction cost and loss of control with irrelevant
business segment with the primary business
In summary, general view of the resource-based theory is that the benefits of related
diversification outweigh unrelated diversification (Hoskisson, 1987; Markides and
Williamson,1996 and Bettis,1981). Next section analyzes the effect of institutional
framework on diversification strategy and firm performance.
16
2.3. Institutional Economics Approach
Throughout the 1990s researchers focused on the different home country
environment’s effect on diversification strategy. The assumption behind the studies
is that emerging and developed countries have different institutional frameworks
which affect the firms’ diversification or refocusing decisions (Osorio, 2012).
Studies, in this field are generally based on the cross country comparisons according
to world bank classification (Wan and Hoskisson, 2003 and Wan et al.,2011). World
Bank classifies countries according to their GNI per capita: emerging countries
which have between $1.045 and $12.746 GNI per capita, and developed countries
which have more than $12.746 GNI per capita are classified1. Hoskisson et al.
(2010-a) also separate emerging countries as developing countries and transition
economies.
General idea of institutional view is that transaction costs are higher in the
institutionally weaker countries than in the stronger ones (Osorio et al., 2012).
Hoskisson et al. (2010-a) states that institutional weakness causes market
imperfections in external capital, labor and product markets and using external
resources become more costly than using the internal ones. Through the
diversification -in emerging countries- a firm can use internal source of capital more
efficiently and less costly, on the other hand, in developed countries external
markets are more efficient and diversification strategy is not advantageous. From the
point of this view, for the countries that have weaker home country environment, the
best strategy is diversification. Hoskisson et al. (2010-b) emphasizes that in
developing countries smaller firms have limited funding options and growth
opportunities are restricted, diversification strategy can be beneficial in accessing
capital.
From the point of view of Berger and Ofek (1995), Lang and Stulz (1994), Palich et
al. (2000), there is diversification discount and, furthermore, unrelated
diversification causes more value loss in developed countries. Some studies analyze
firms in developing countries -like India, South Korea, Indonesia- and find
diversification premium (Khanna and Palepu,2000; Chang and Hong, 2000;
Mursitama,2006). Khanna and Palepu (2000) analyze Indian firms, with using
17
Tobin’s q and ROA for the measurement of firm performance. They compare
diversified and stand-alone firms and state that there are serious agency and
information problems in Indian market because of the poor institutional framework.
By using both Tobin’s q and ROA; they conclude that diversified firms initially lose
value but after a certain point their profitability increases. Khanna and Palepu
(2000) and Gunduz and Tatoğlu (2003) constitute a model which separate firms
according to their ownership and as domestic and with foreign partner and find that
having foreign partner ensures to increase Tobin’s q and ROA for diversified firms.
Khanna and Palepu (2000) conclude that having foreign partner can provide access
to international capital market, and this provides potentially powerful explanation
that insufficient product, labor and capital markets make new investment costly. Lee
et al. (2008) analyzed the impact of the change in institutional framework in South
Korea between 1984 and 1996. Firstly, they find diversification premium but by
institutional transition diversification premium turns into value loss. Leibeskind
(2000) states that before 1980s developed countries have less specialized capital
market and inefficiency in allocating external capital causes diversification
premium.
On the other hand, Gunduz and Tatoğlu (2003) have different implications and show
that there is no diversification premium in emerging countries. Gunduz and Tatoğlu
(2003) analyze 202 non-financial corporations which are listed on the Istanbul Stock
Exchange. They separate firms as diversified and stand-alone firms and compare
them based on their accounting and stock market and Tobin’s q values by using
ANOVA. They find out that there is no significant difference between diversified
and stand-alone firms. In addition Lins and Servaes (1999) analyze three developed
countries’ firms: German, Japan and UK firms and could not find diversification
discount in German firms. They claim that not only institutional framework affects
firm performance, but also firm structure is vital. German firms generally have
insider ownership, which can prevent agency cost problem.
All of the studies above show us that institutional framework determines the impact
of the diversification strategy, but firm structure plays an important role on firm
performance.

18
2.4. Concluding Remarks
The net effect of the diversification on the firm performance is ambiguous, our study
analyses numerous studies, as a result four models ensue:
Diversification discount model (Montgomery and Wernerfelt,1988; Lang
and Stulz, 1994; Berger and Ofek, 1995; Denis et al., 1997 and Lins and
Servaes,1999)
Diversification premium model (Campa and Kedia, 2002; Zhao,2008 and
Park and Jang, 2012)
U relationship (Park and Jang, 2012; Tang and Jang, 2010 and Khanna &
Palepu, 2000).
Inverted U relationship (Galvan et al.,2007, Palich et al. 2000)
One cannot say that which view is better for demonstrating the product
diversification’s impact on firm performance but resource-based view is dominating
in the most of the studies (Villalonga and Mcgahan, 2005; Wernerfelt, 1984 and
Zhao, 2008). Resource-based view justify production, marketing, managerial,
distribution skills are valuable sources of companies and can be transferred across
products (Zhao, 2008).
Vestel Co. is the best example of companies having both related and unrelated
diversification strategy in Turkey and transfer its resources via different sectors and
produces television, air conditioner, small domestic appliances, vacuum cleaner,
refrigerator, washing machine, dishwasher, light emitting diode lightning, computer,
cooking appliances. According to the SIC codes Vestel’s related diversification
strategy is dominating; only computer can be classified as unrelated diversification.
We analyze Vestel Co. as a case study since the firms in consumer electronics sector
and other sectors can benefit from close investigation of Vestel’s diversification
experience. Using single firm gives us the chance of investigating a firm’s lifecycle
over a long period of time.
Helfat and Eisenhardt (2003) states that according to the resource-based view
dynamic capabilities, which the firms’ ability to build internal and external
competences, are important source for the firms. Over time Vestel Co.’s intangible

19
assets become specialized and due to importance of dynamic capabilities of Vestel
Co., next chapter analyzes Vestel Co.’s historical development is analyzed mostly
based on the resource based view.
20
CHAPTER 3
THE CASE STUDY: VESTEL A.Ş.
In this chapter we will analyze Vestel Co. and its diversification strategy based on
the strategic management approach. In order to understand Vestel’s strategy better,
we will briefly summarize its history. Zorlu Holding, which Vestel is a part of, has
sprung in Denizli at 1950s. Beginning with textile first, its activities have expanded
basically to four sectors: home textile, and spun thread; consumer electronics,
information technology and durable consumer goods; real estate; and finally energy.
Beginning with home textile and focusing only on this sector until 1980s, Zorlu
Holding acquired Vestel at 1994. Then the holding entered into real estate business
and energy sector by diversifying financial portfolio. Among different businesses of
Zorlu Holding, Vestel is called as “the admiral ship” and “the shining star”
constituting an important part of its portfolio.
Vestel produces several goods ranging from LCD TVs, dishwashers, washing
machines, refrigerators, cooking appliances, set-top boxes to sound systems and
LEDs. Choosing to diversify as a group strategy, Zorlu Group also decided to
diversify within Vestel. Television is the most important product group of Vestel
brand, and makes the firm an important player in both world and domestic TV
markets. According to the data acquired by Electronic Goods Exporters Association
(ECID – Elektronik Cihazlar İhracatçıları Derneği), in 2014 TV production of Vestel
constitutes about 82% of total production in Turkey.
Vestel had started its production in 1983 and its acquisition was realized in 1994 by
Zorlu Group. The first three years under Zorlu Group passed by acquiring and
applying the know-how from abroad. The firm had concentrated on only one
product: TV. The production was mostly made for foreign companies, Vestel
worked as an OEM/ODM manufacturer. Focusing on TV, the brand diversified the
models addressing the tiny differences between consumer segments and specialized
on this product.
21
In 1997, Vestel started to make both application and development with application
engineering still constitutes an important place. As a result, the first step was been
taken for product diversification, and Vestel started to produce white goods
(refrigerator, washing machine, dishwasher, oven, air conditioner). Moreover, the
entrance to digital consumer goods production came nearly these years. We can infer
that Vestel started to utilize its equipment and know-how in other goods production.
We conclude that this diversification is a related diversification and the factors of
production can be transferred are used to easily among production of different goods
by looking at the Standard Industrial Classification codes. Explained above, SIC
codes are used to classify industry areas and easily release meaningful and
standardized data by government agencies in the way that others can understand.
Under this classification, Vestel Co. falls into the “Division D: Manufacturing” and
“Major Group 36: Electronic and Other Electrical Equipment and Components,
Except Computer Equipment”. Industry codes of the goods produced by Vestel
Company are summarized in Table 1, and also it is shown below that which product
falls into which group:
Industry Group 363: Household Appliances
o 3631: Household Cooking Equipment: Convection ovens
including portable ones, and microwave ovens
o 3632: Household Refrigerators and Home and Farm Freezers:
Refrigerators and freezers
o 3633: Household Laundry Equipment: Washing machines, dryer-
washing machines
o 3634: Electric Housewares and Fans: Blenders, coffee makers,
curling irons, driers, fans, food mixers, irons, juice extractors,
portable ovens, tea kettles, toasters (most of the goods under SDA
fall into this group)
o 3635: Household Vacuum Cleaners: Vacuum cleaners
o 3639: Household Appliances, Not Elsewhere Classified:
Dishwashers
Industry Group 364: Electric Lighting And Wiring Equipment
o 3641: Electric Lamp Bulbs and Tubes: Light Bulbs

22
o 3645: Residential Electric Lighting Figures: lighting fixtures,
residential
Industry Group 365: Household Audio and Video Equipment, and Audio
o 3651: Household Audio and Video Equipment: Television
receiving sets, speaker systems
Industry Group 366: Communications Equipment
o 3663: Radio and Television Broadcasting and Communications
Equipment: Television monitors, television transmitting antennas
and ground equipment, cable television equipment
As it has been noted before, computers belong to a different major group –though
the same division – Major Group 35: Industrial and Commercial Machinery and
Computer Equipment.
Industry Group 357: Computer and Office Equipment
o 3571: Electronic Computers: Personal computers, computers:
digital, analog and hybrid
This classification shows us that all products produced and/or sold by Vestel is in
the same division and major group except computers. While white goods and small
domestic appliances fall into the same industry group, television and set-top boxes
are classified in another industry group under the same major group. LEDs are also
in a different industry group though the same division and major group. As we have
mentioned before, computers are an example of unrelated diversification and
classified under a totally different major group – but again the same division.
Vestel, starting by TV production only, applied its flexible production strategy, wide
distribution network, and efficient cost management strategy to expand into other
sectors. Another most important reason enabling Vestel to diversify is the advantage
in buying components – since all the sectors are related to each other as shown
above. Along with these reasons, know-how acquired by application engineering
first and, then, development engineering have brought diversification capabilities.
One more reason in diversifying the goods produced is the reputation with “Vestel”
brand. Brand reputation is a valuable intangible asset of a firm and cannot be
23
transferred or sold, either. Only with diversification strategy a firm can use this asset
in different sectors engaged.
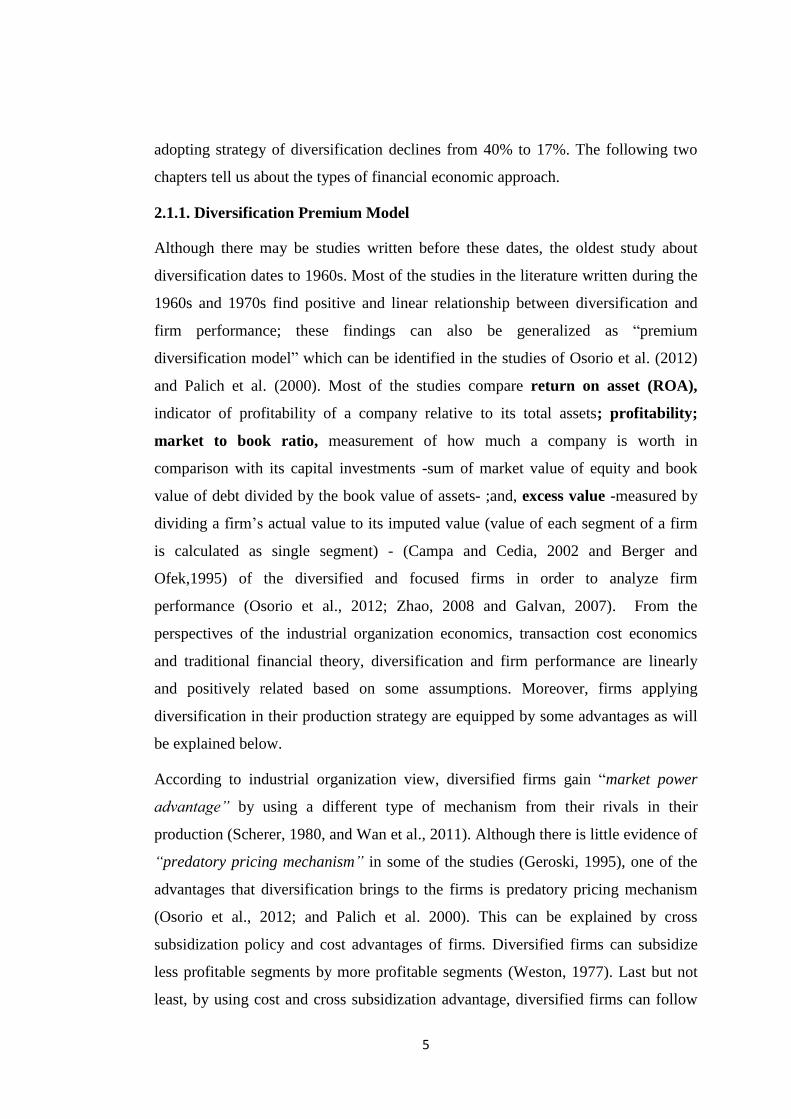
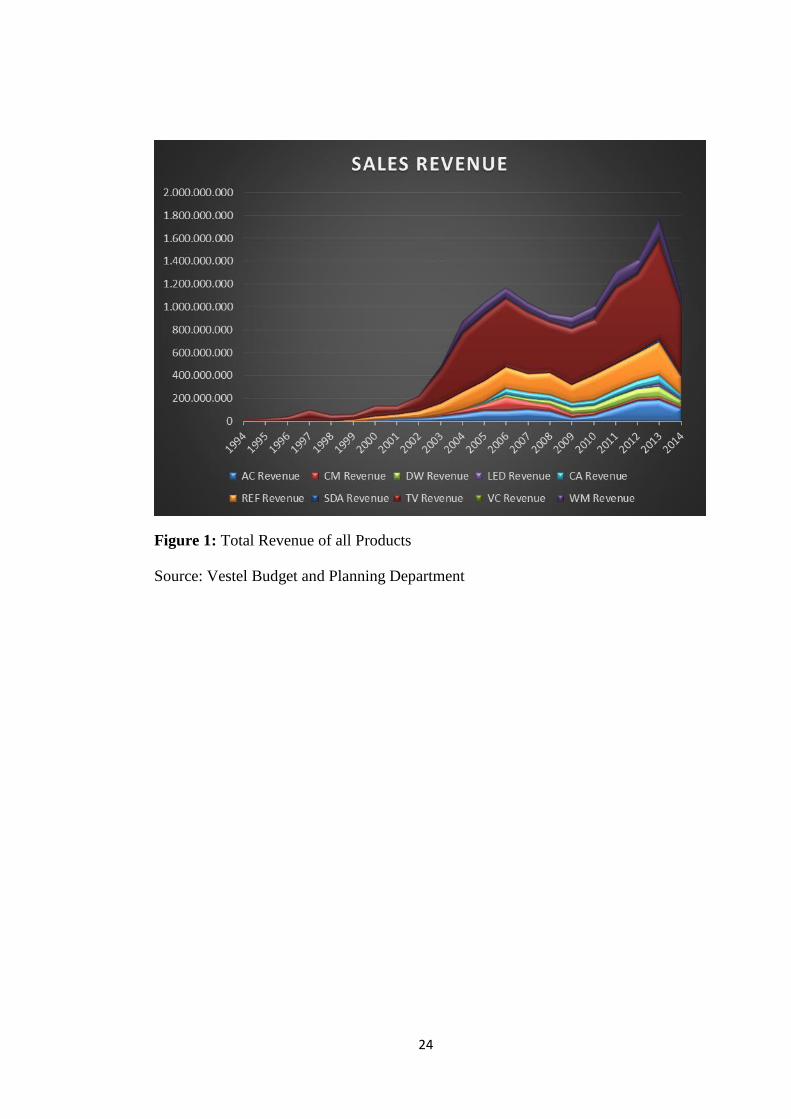
Below, the foundation progression of Vestel Group Companies and the products
produced are given. After each, the sales revenue along with total revenue is
provided in figure 1 and 2. Since most of the data is confidential, only a part of it has
been revealed in the figures. The sales revenue data for the sectors has been
compiled from different sources within Vestel: Budget and Planning, Research and
Strategic Analysis, Finance, and Law Department. The product groups are analyzed
with the data that comprises of: television (TV), air conditioner (AC), small
domestic appliances (SDA), vacuum cleaner (VC), refrigerator (REF), washing
machine (WM), dishwasher (DW), light emitting diode lightning (LED), computer
(CM), cooking appliances (CA). As mentioned above, product diversification can be
classified as related and unrelated diversification. According to SIC codes, except
computers, Vestel choose related product diversification strategy. Comparing the
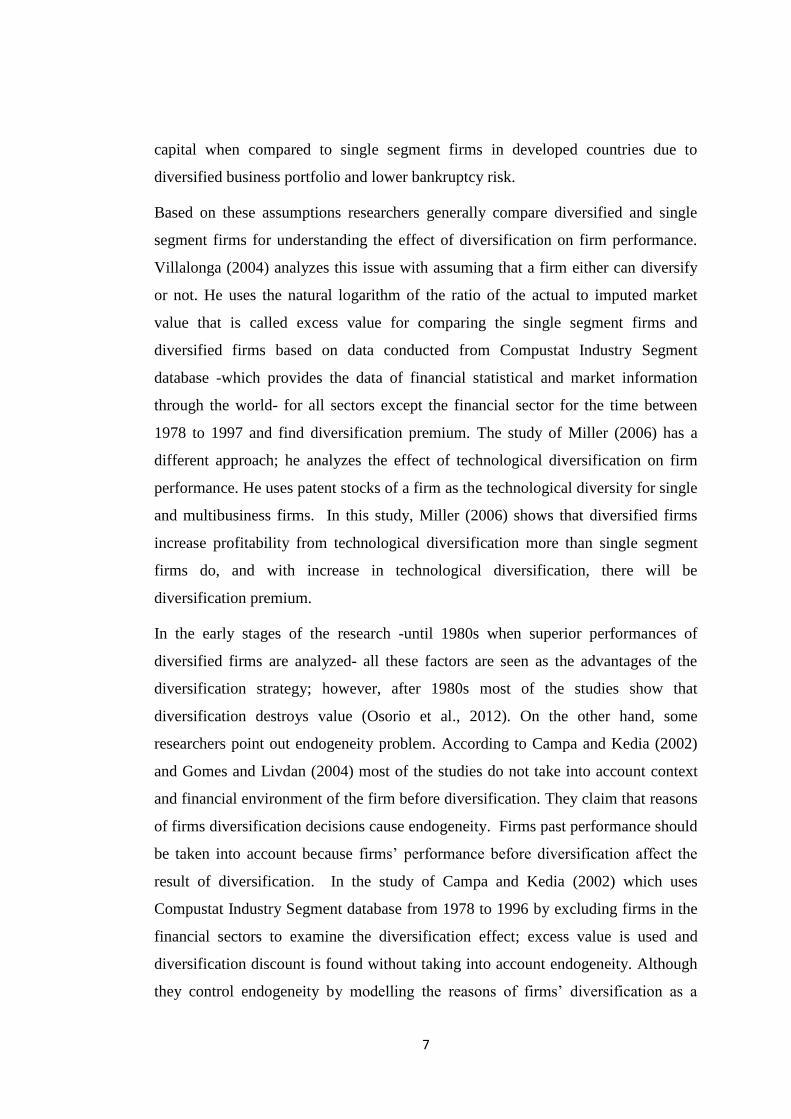
revenue and sales unit of each product can draw a picture, when we look at the first
figure itcan be seen that computer sales unit and revenue decline in time, on the
other hand, the other segments’ sales unit and revenue generally increase. We can
conclude that unrelated diversification strategy of Vestel is unsuccessful.
Table.1. Product Segments According to The SIC Codes
SIC CODE DEFINITION
3651 Household Audio and Video Equipment
3631 Household Cooking Equipment
3632 Household Refrigerators and Home and Farm Freezers
3633 Household Laundry Equipment
3635 Household Vacuum Cleaners
3641 Electric Lamp Bulbs and Tubes
3645 Residential Electric Lighting Fixtures
3634 Electric Housewares & Fans
3639 Household Appliances
3663 Radio and Television Broadcasting and Communications Equipment
3571 Electronic Computers
Source: http://siccode.com/en/
24
Figure 1: Total Revenue of all Products
Source: Vestel Budget and Planning Department
25
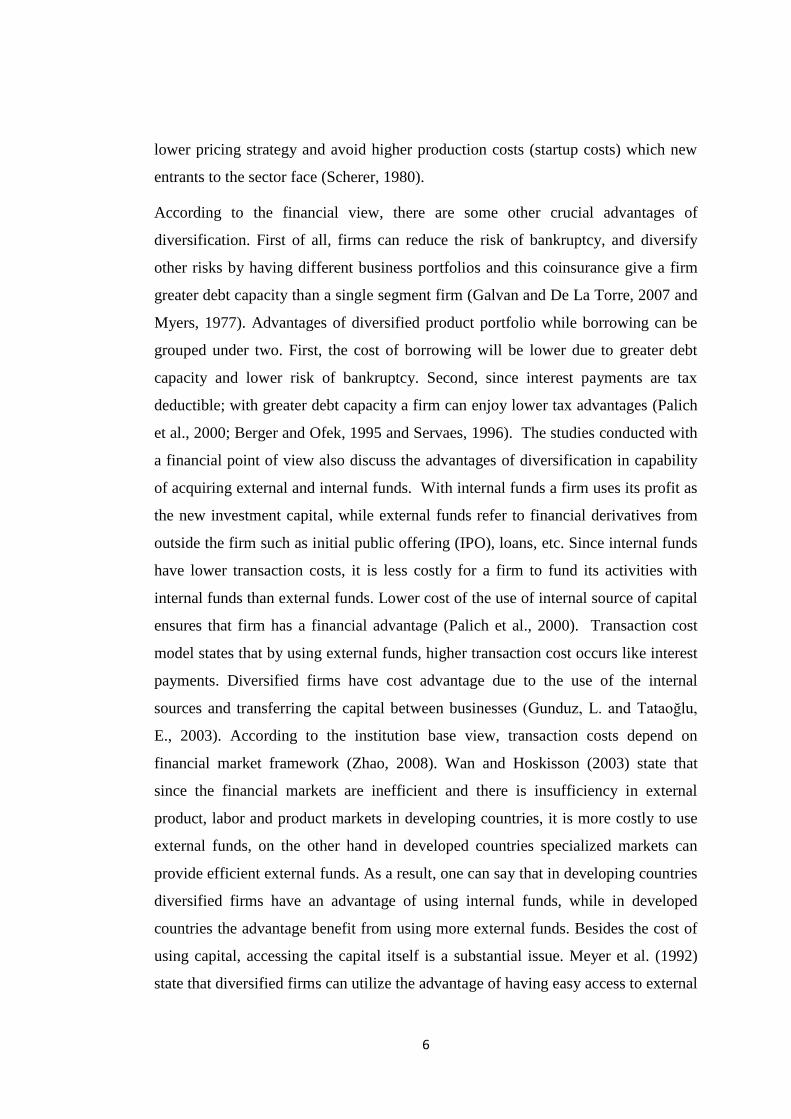
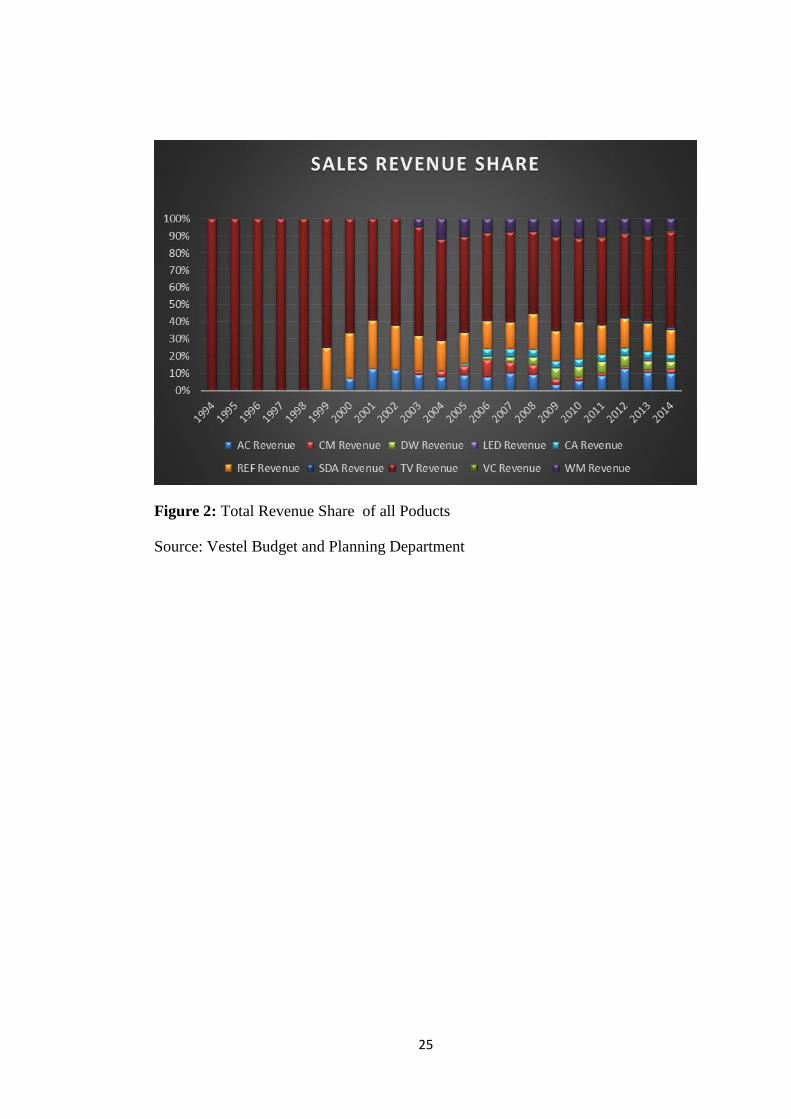
Figure 2: Total Revenue Share of all Poducts
Source: Vestel Budget and Planning Department

26
Figure 3: Total Sales Share of all Products
Source: Vestel Budget and Planning Department
Vestel Electronics
Vestel Electronics, the leading television producer of Turkey, was acquired by Zorlu
Group in 1994. TV is the first and probably the most important product produced by
Vestel since the foundation of the brand (1984). As we have explained before, the
factory started by producing CRT TV’s with the utilization of application
engineering –the know-how was imported from abroad. After gaining knowledge
about the technical hardware of TV, Vestel had changed policy and shifted from
application engineering to development engineering. The engineers in Research and
Development Center tried to make CRT TV’s more efficient and more equipped at
the same time with a cost advantage when compared to its rivals. Vestel took
advantage of low costs by making production in mass quantities but with a specified
quality. The cost advantage and a standard quality enable Vestel to export its goods
to 145 countries. It is one of the leaders among OEM/ODM manufacturers in Europe
besides the important position in the domestic TV sector.

27
From early 2000s on, the world trend has switched from CRT TV’s to plasma and
then to LCD TV’s. Due to its flexible production system, which is based on labor
force rather than machines and resulting reduction in fixed costs, Vestel was not late
in adopting the world trend to its production strategy and made a quick switch to
LCD TV’s as a fast follower. Although there is a decrease at the first months of
switch from CRT to LCD ones, due to the decline in exports, it continued to expand
after that. By cumulating the know-how both in software issues as well as the
hardware issues, Vestel also caught the world trend in terms of software related
elements in TV and had a cost advantage also in software.
From figure.2 it can be seen that until 1999 –the year that the first production of
refrigerators were realized- total revenue equals to TV revenue, since TV is the sole
product manufactured in the plant. Then, after 1999, the production of refrigerators
and the other products; air conditioners in 2000, washing machines in 2003, cooking
appliances in 2005 and dishwashers in 2007, the share of TV revenue in total
revenue decreases. However, it is still above 50% for all of these years. It can be
concluded that TV is the most important product and the source of revenue. All in
all, it does not mean that TV is a high profitable sector. Due to confidentiality issues
the source of data could not be shown, but as of the general dynamics because of the
competition in TV sector, in spite of the high revenues, TV has the smallest profit
margin when compared to other goods in consumer electronics.
Vestel White Goods
Vestel White Goods Company was founded in 1997 and joined to Vestel Group
Companies. The white goods factory comprised of several products and it was the
second one built after television factory in 1997. The company started its production
first with refrigerators in 1999. The firm continued the investments with air
conditioners in 2000, washing machines in 2003, cooking appliances in 2005 and
finally dishwashers in 2007. In producing various products within the company,
Vestel White Goods has used its logistics advantage due to geographical location,
product differentiation ability, flexible production system that is easily transferrable
among production of different goods, and low costs of labor that is already inherited
from TV production. Probably the most important element that makes Vestel
28
powerful OEM/ODM manufacturer was the ability to easily differentiate products.
This, in turn, increased the demand for the products.
When we look at the figures, it can be seen that among the white goods group, the
share of refrigerator revenue in total revenue is the highest, while washing machine
and air conditioner comes after respectively. Dishwasher and cooking appliances
remain marginal. Refrigerator takes the advantage of being the first product among
white goods. With the know-how cumulated since 1997, competitive prices and the
brand value enable Vestel to be an important player in the market.
In the air conditioners, Vestel keeps the competitive pricing strategy by addressing
both lower and upper segment consumers. It is also the second product group to be
manufactured in white goods plant; this might be another advantage in higher total
revenue share. The last two groups, the cooking appliances and dishwashers have
the smallest share in total revenue.
Vestel Communication
Founded in 1975 in order to produce first remote controller and tuner in Turkey, the
firm has joined to Vestel Companies. Today, the factory is producing goods in
“consumer electronics” and the leading company in Turkey. The product range
includes set-top boxes, DVD players, DivX players, AV receivers, DVD recorder,
digital TV receivers, wireless display and sound transmitters in compliance with
digital home concept.
Vestel Digital
One of the most recent companies founded by Vestel Group Companies is Vestel
Digital. It had started its activities in 2005 in Vestel City. By using the know-how
and technological infrastructure of the Vestel Group Companies, it has become a
leading technology center. The company maintains its business basically in two
sectors: digital media and personal computer products.
In the recent years, since 2011, Vestel has started to use its knowledge in the area of
electronics in LED lighting sector. Although it’s a novel area for Vestel, the projects
29
show that it is promising. Some of the projects contracted by Vestel LED are
lightning of Istanbul subways, public and private hospitals, reputed
telecommunication stores, Istanbul and Izmir airports, hydroelectric plants, hotels,
universities, etc. Due to these projects, the revenue of the product group LED is
expected to get higher, even though it is very small for now.
Since the small domestic appliances and vacuum cleaners are produced abroad and
imported, the figures belonging to these goods could not be grouped under any of
these companies, instead, they are given here separately.
As can be seen in figure 1 above, the revenue of computer shows an upward
movement for the first three years; however, until then the revenue falls and the
share in total revenue remains very marginal. Keeping in mind that the computers
belong to a totally different major group compared to the other goods produced by
Vestel, this may be counted as an unsuccessful example of unrelated diversification.
Revenue and sales data of Vestel seems to indicate that Vestel so far failed with
unrelated diversification strategy. Vestel continues unrelated diversification strategy
with smartphones and tablets. We could not share tablet and smartphone sales data
due to privacy issues, in light of past experiences with unrelated diversification it is
hard to achieve profitability; however, depending on three months sales data we can
conclude that Vestel can achieve to increase profitability and revenue with unrelated
diversification strategy. On the other hand, white goods - which can be considered as
related products - revenue and sales shares increase in time. The most distinct result
according to the sales and revenue data is if profitability increase with new product,
related diversification strategy is the best strategy for Vestel. For understanding
whether profitability increases or does not we use panel data analysis in the next
chapter.

30
CHAPTER 4
METHODOLOGY and EMPIRICAL RESULTS
4.1. Methodology
Panel data models are used when analyzing the cross sectional time series data.
Panel data enable one to control variables that cannot be controlled or measured, and
changing over time. Panel data can be distinguished in two categories: balanced
panel data and unbalanced panel data. In balanced panel data, the number of time
periods is the same for all groups, i.e. the data exists for all objects in same time
periods. In unbalanced panel data, observations are missing for some cross sectional
units randomly or nonrandomly. Our data fits into nonrandom unbalanced panel data
since the data do not exist for all product groups in the same time periods.
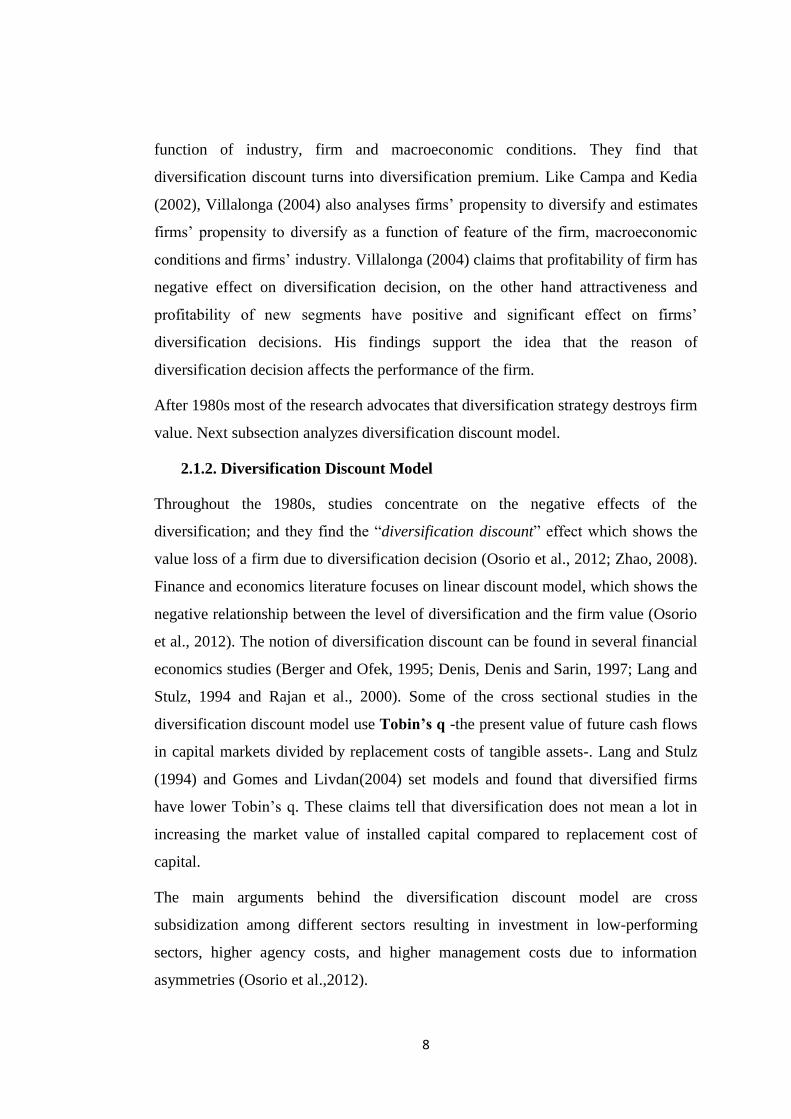
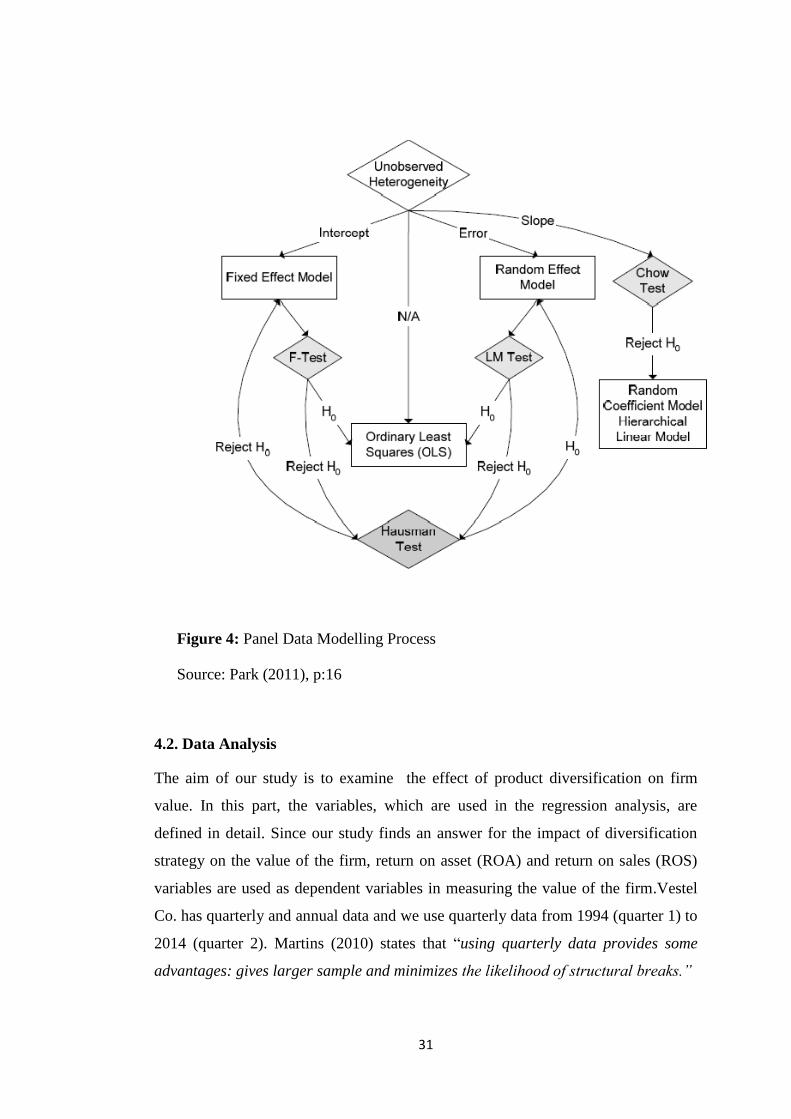
In order to analyze panel data there are three techniques that can be used: OLS,
random effects model and fixed effects model. In our study, firstly we test the
seasonality and use X-12 Arima method for obtaining seasonal adjustment data. In
the modelling stage of estimation procedure, we begin by using pooled OLS
regression. According to Park (2011), in order to determine the most appropriate
model, one should test for four possible outcomes: F-test in order to decide between
the pooled OLS and the fixed effect, and LM test for deciding among the pooled
OLS and the random effect. If one fails to reject the null hypotesis of F and LM
tests, then pooled OLS will be the best fit model. If F test is rejected and LM is not,
then fixed effect model is the best model and in an exactly opposite case, random
effect model is the case. On the other hand, if both F and LM test are rejected, then
with Haussman test one should compare fixed and random effect models. Null
hypotesis of Haussman test will be:
H0= difference in coefficients are not systematic.
If the null hypotesis of Hausman test is rejected, then one should choose fixed effect
model, otherwise random effect model will be preferred. Figure 4 summarises the
modelling process.
31
Figure 4: Panel Data Modelling Process
Source: Park (2011), p:16
4.2. Data Analysis
The aim of our study is to examine the effect of product diversification on firm
value. In this part, the variables, which are used in the regression analysis, are
defined in detail. Since our study finds an answer for the impact of diversification
strategy on the value of the firm, return on asset (ROA) and return on sales (ROS)
variables are used as dependent variables in measuring the value of the firm.Vestel
Co. has quarterly and annual data and we use quarterly data from 1994 (quarter 1) to
2014 (quarter 2). Martins (2010) states that “using quarterly data provides some
advantages: gives larger sample and minimizes the likelihood of structural breaks.”
32
Under the resource-based view, intangible assets are the unique resources and by
making product diversification firm will benefit the use of resources through the
economies of scale (Zhao, 2008 and Morck and Yeung, 1991). When forming the
data, R&D and advertising expenditures over total assets are used as proxy for
intangible assets; and from the perspective of resource-based view we expect
positive relationship between the higher level of intangible assets and firm value.
According to the resource - based view technological assets and marketing assets are
intangible assets of the firm. Technological assets is R&D expenditure over total
assets and marketing assets is marketing and advertising expenditure over total
assets. We expect that with the increase in the level of intangible assets, firm value
and profitability will also increase. We expect increase in R&D expenditure in the
long run, and also intangible assets profibility will increase. In order to understand
long term effects of intangible assets we use first, fourth and eight lags of
technological and marketing assets.
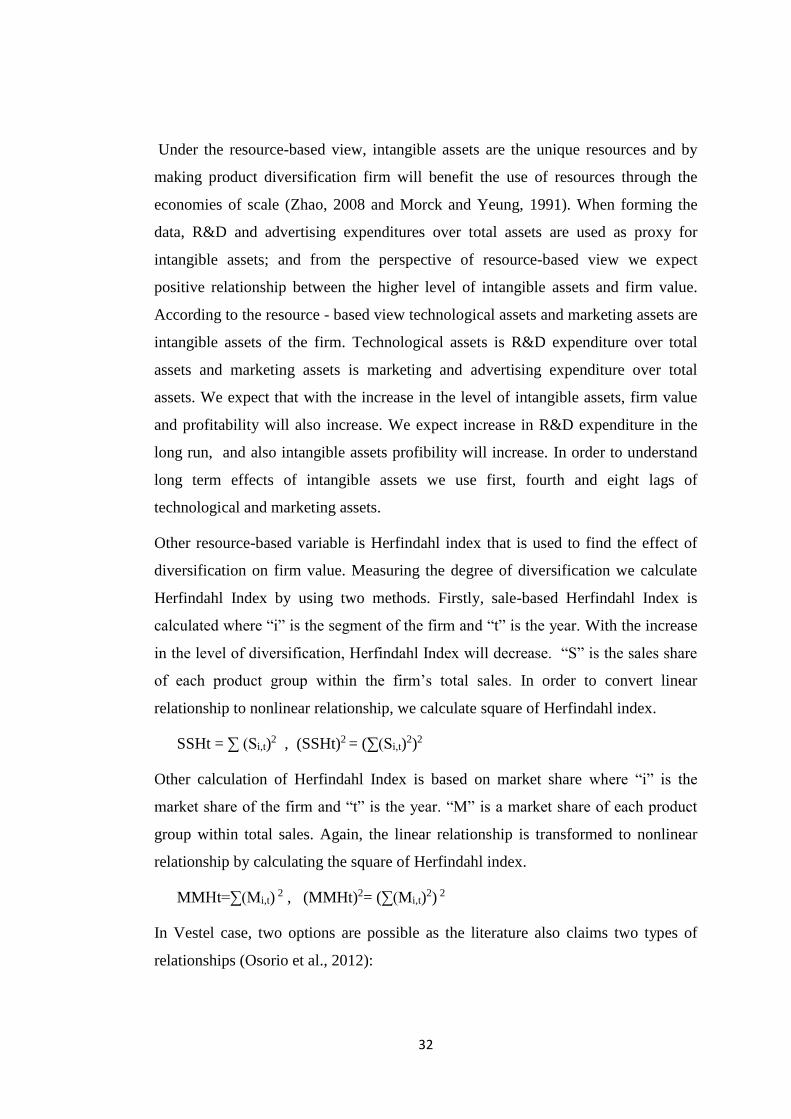
Other resource-based variable is Herfindahl index that is used to find the effect of
diversification on firm value. Measuring the degree of diversification we calculate
Herfindahl Index by using two methods. Firstly, sale-based Herfindahl Index is
calculated where “i” is the segment of the firm and “t” is the year. With the increase
in the level of diversification, Herfindahl Index will decrease. “S” is the sales share
of each product group within the firm’s total sales. In order to convert linear
relationship to nonlinear relationship, we calculate square of Herfindahl index.
SSHt = ∑ (Si,t)2 , (SSHt)2 = (∑(Si,t)
2)2
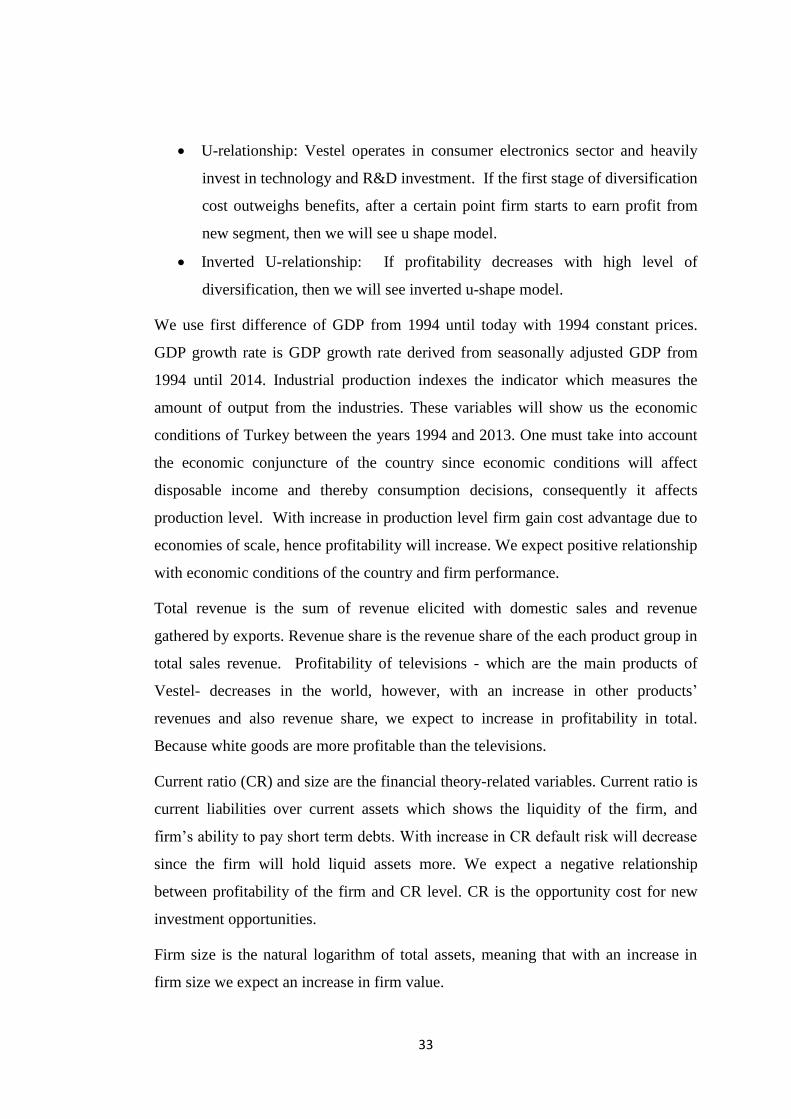
Other calculation of Herfindahl Index is based on market share where “i” is the
market share of the firm and “t” is the year. “M” is a market share of each product
group within total sales. Again, the linear relationship is transformed to nonlinear
relationship by calculating the square of Herfindahl index.
MMHt=∑(Mi,t) 2 , (MMHt)2= (∑(Mi,t)
2) 2
In Vestel case, two options are possible as the literature also claims two types of
relationships (Osorio et al., 2012):
33
U-relationship: Vestel operates in consumer electronics sector and heavily
invest in technology and R&D investment. If the first stage of diversification
cost outweighs benefits, after a certain point firm starts to earn profit from
new segment, then we will see u shape model.
Inverted U-relationship: If profitability decreases with high level of
diversification, then we will see inverted u-shape model.
We use first difference of GDP from 1994 until today with 1994 constant prices.
GDP growth rate is GDP growth rate derived from seasonally adjusted GDP from
1994 until 2014. Industrial production indexes the indicator which measures the
amount of output from the industries. These variables will show us the economic
conditions of Turkey between the years 1994 and 2013. One must take into account
the economic conjuncture of the country since economic conditions will affect
disposable income and thereby consumption decisions, consequently it affects
production level. With increase in production level firm gain cost advantage due to
economies of scale, hence profitability will increase. We expect positive relationship
with economic conditions of the country and firm performance.
Total revenue is the sum of revenue elicited with domestic sales and revenue
gathered by exports. Revenue share is the revenue share of the each product group in
total sales revenue. Profitability of televisions - which are the main products of
Vestel- decreases in the world, however, with an increase in other products’
revenues and also revenue share, we expect to increase in profitability in total.
Because white goods are more profitable than the televisions.
Current ratio (CR) and size are the financial theory-related variables. Current ratio is
current liabilities over current assets which shows the liquidity of the firm, and
firm’s ability to pay short term debts. With increase in CR default risk will decrease
since the firm will hold liquid assets more. We expect a negative relationship
between profitability of the firm and CR level. CR is the opportunity cost for new
investment opportunities.
Firm size is the natural logarithm of total assets, meaning that with an increase in
firm size we expect an increase in firm value.
34
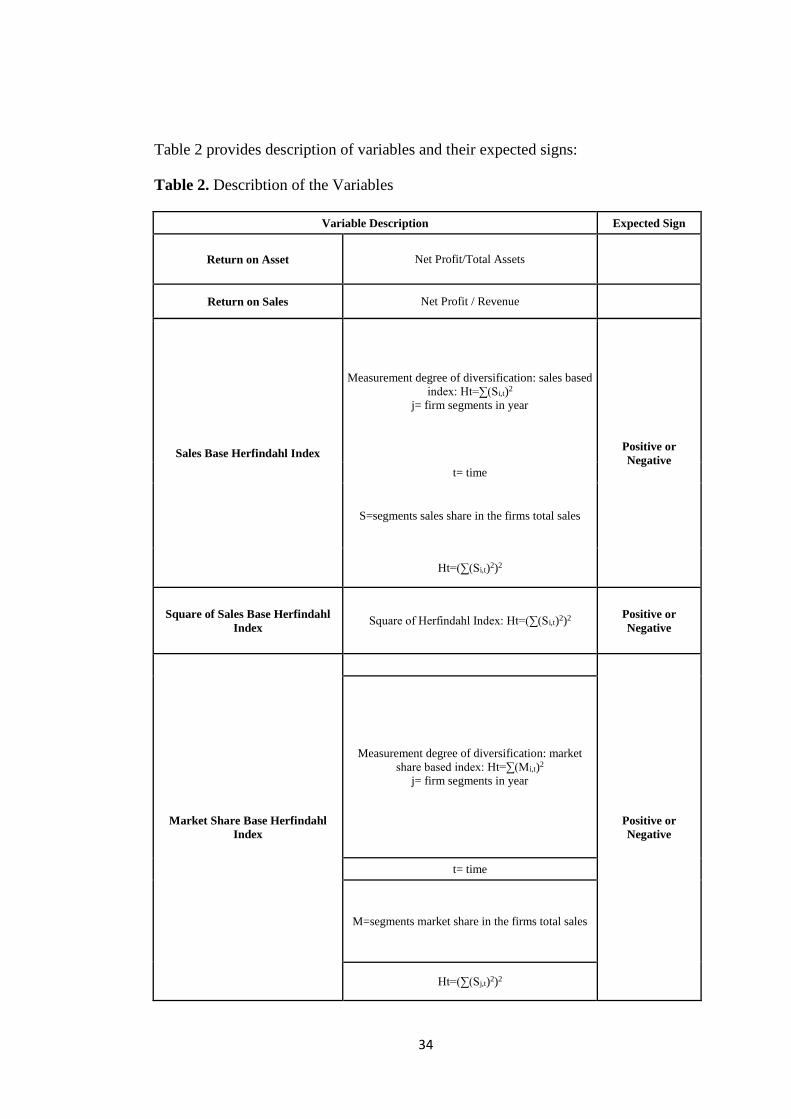
Table 2 provides description of variables and their expected signs:
Table 2. Describtion of the Variables
Variable Description Expected Sign
Return on Asset Net Profit/Total Assets
Return on Sales Net Profit / Revenue
Sales Base Herfindahl Index
Positive or
Negative
Measurement degree of diversification: sales based
index: Ht=∑(Si,t)2
j= firm segments in year
t= time
S=segments sales share in the firms total sales
Ht=(∑(Si,t)2)2
Square of Sales Base Herfindahl
Index Square of Herfindahl Index: Ht=(∑(Si,t)2)2
Positive or
Negative
Market Share Base Herfindahl
Index
Positive or
Negative
Measurement degree of diversification: market
share based index: Ht=∑(Mi,t)2
j= firm segments in year
t= time
M=segments market share in the firms total sales
Ht=(∑(Sj,t)2)2
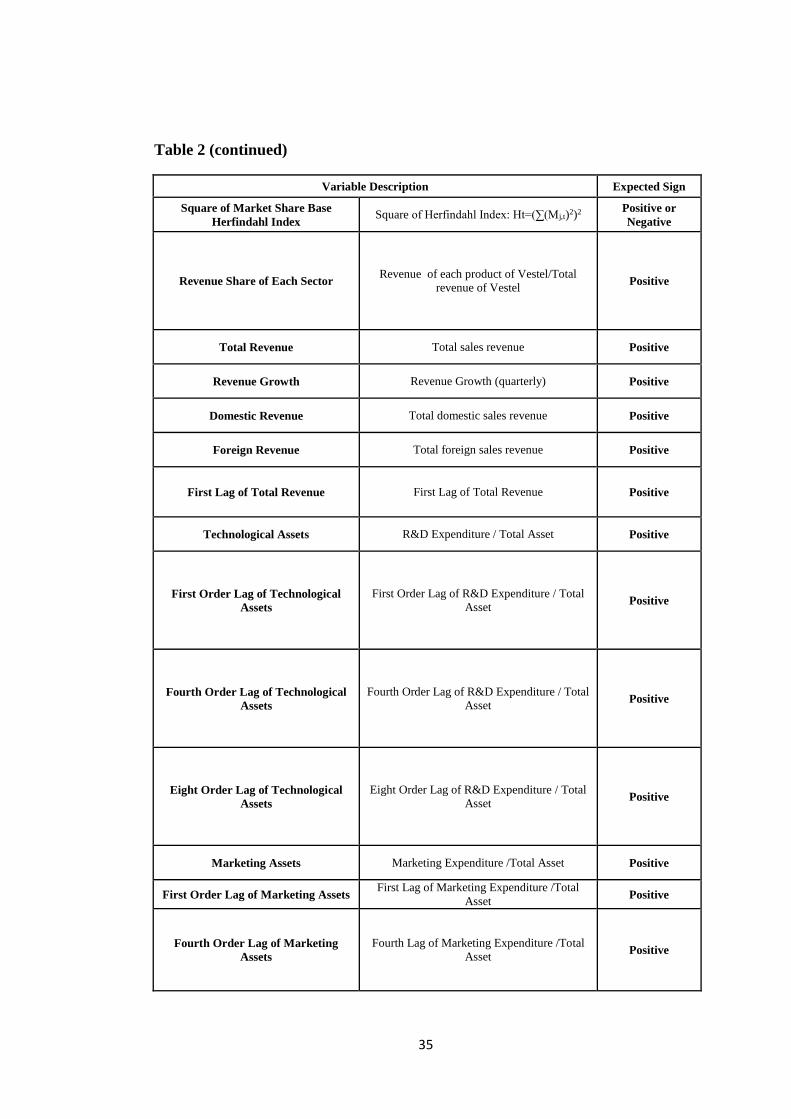
35
Table 2 (continued)
Variable Description Expected Sign
Square of Market Share Base
Herfindahl Index Square of Herfindahl Index: Ht=(∑(Mj,t)2)2
Positive or
Negative
Revenue Share of Each Sector Revenue of each product of Vestel/Total
revenue of Vestel Positive
Total Revenue Total sales revenue Positive
Revenue Growth Revenue Growth (quarterly) Positive
Domestic Revenue Total domestic sales revenue Positive
Foreign Revenue Total foreign sales revenue Positive
First Lag of Total Revenue First Lag of Total Revenue Positive
Technological Assets R&D Expenditure / Total Asset Positive
First Order Lag of Technological
Assets
First Order Lag of R&D Expenditure / Total
Asset Positive
Fourth Order Lag of Technological
Assets
Fourth Order Lag of R&D Expenditure / Total
Asset Positive
Eight Order Lag of Technological
Assets
Eight Order Lag of R&D Expenditure / Total
Asset Positive
Marketing Assets Marketing Expenditure /Total Asset Positive
First Order Lag of Marketing Assets First Lag of Marketing Expenditure /Total
Asset Positive
Fourth Order Lag of Marketing
Assets
Fourth Lag of Marketing Expenditure /Total
Asset Positive
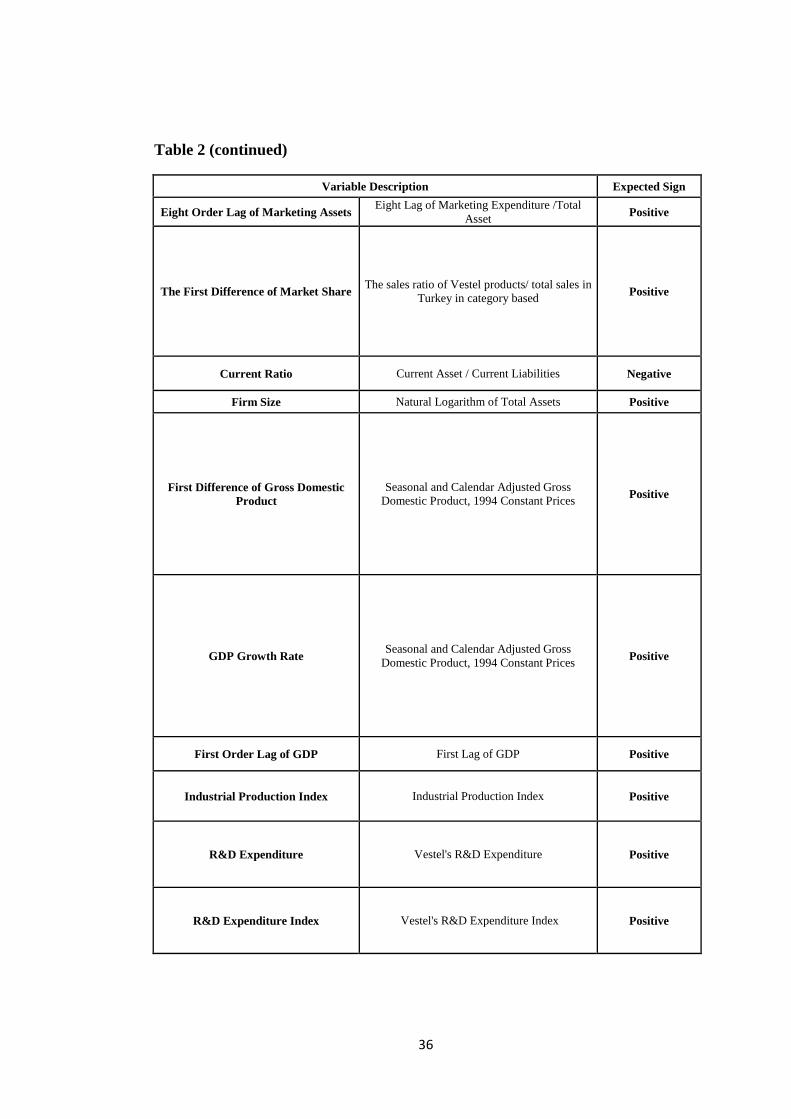
36
Table 2 (continued)
Variable Description Expected Sign
Eight Order Lag of Marketing Assets Eight Lag of Marketing Expenditure /Total
Asset Positive
The First Difference of Market Share The sales ratio of Vestel products/ total sales in
Turkey in category based Positive
Current Ratio Current Asset / Current Liabilities Negative
Firm Size Natural Logarithm of Total Assets Positive
First Difference of Gross Domestic
Product
Seasonal and Calendar Adjusted Gross
Domestic Product, 1994 Constant Prices Positive
GDP Growth Rate Seasonal and Calendar Adjusted Gross
Domestic Product, 1994 Constant Prices Positive
First Order Lag of GDP First Lag of GDP Positive
Industrial Production Index Industrial Production Index Positive
R&D Expenditure Vestel's R&D Expenditure Positive
R&D Expenditure Index Vestel's R&D Expenditure Index Positive
37
4.3. Econometric Analysis
In order to explain the relationship between product diversification and firm
performance based on product diversification, two dependent variables are used for
the best data fit: ROA and ROS. For each case four models are estimated. Our
models are estimated by using unbalanced panel data method. In the first three set of
estimations ROA is used as the dependent variable while ROS is used in the last
three sets of estimations. Heteroscedasticity and autocorrelation are the data
problems which must be eliminated before analyzing the coefficients belonging to
variables. Firstly, in order to test for heteroscedasticity Breusch-Pagan / Cook-
Weisberg test is utilized for all models. The null hypothesis is:
H0: There is no heteroscedasticity.
In all of the models we face with heteroscedasticity problem. The estimations are
corrected for heteroscedasticity and robust standard errors are found.
In testing for autocorrelation LM test is used with the null hypothesis:
H0: no first-order autocorrelation.
In the first three sets of estimations using ROA as the dependent variable, the second
model has autocorrelation problem. In the latter sets of estimations all models have
autocorrelation problem. The autocorrelation problem is eliminated by using
autocorrelation corrected standard errors.
Park (2011) also states that if each individual has its own initial capacity then fixed
effect model will be the best model that fits the data. In our models when we look at
the F tests the null hypotesis is rejected in favor of fixed effect model. According to
Hausman test, results we reject the null hypotesis, results are in favor of fixed effect
model.
The estimation results of Fixed Effect Model, with dependent variable “ROA” is
shown in the table.3. OLS, fixed effect model and random effect model are shown at
the appendix.
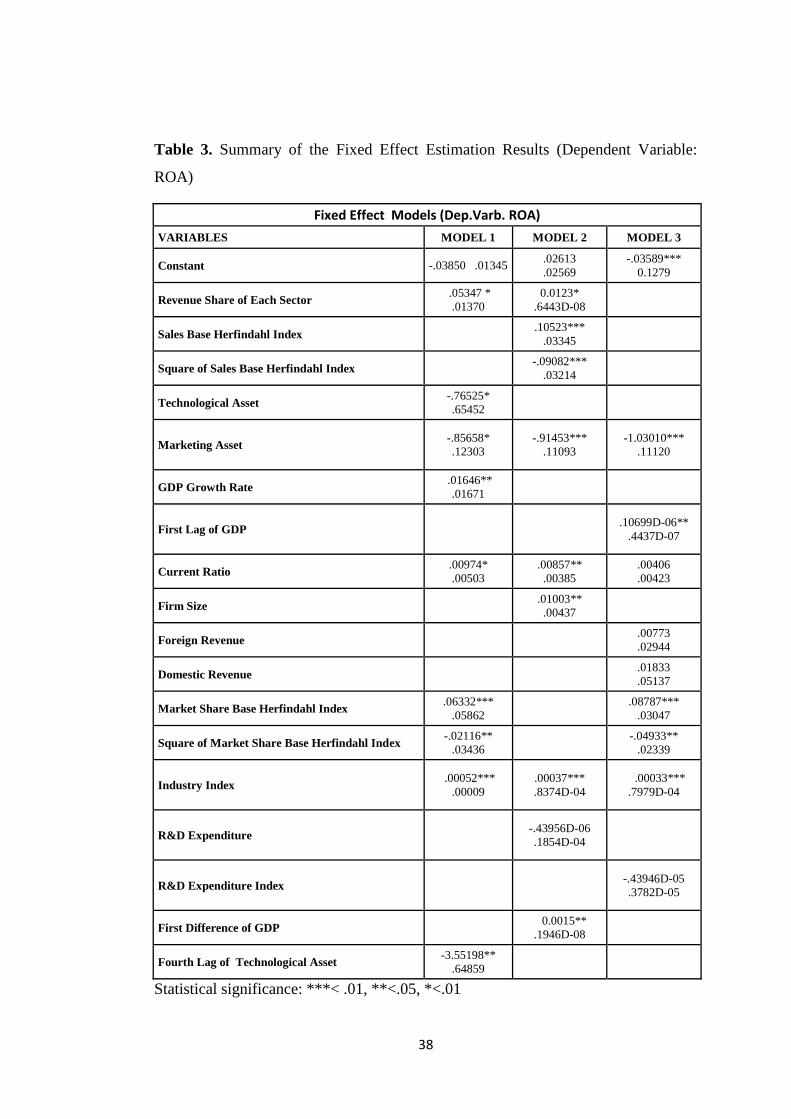
38
Table 3. Summary of the Fixed Effect Estimation Results (Dependent Variable:
ROA)
Fixed Effect Models (Dep.Varb. ROA)
VARIABLES MODEL 1 MODEL 2 MODEL 3
Constant -.03850 .01345 .02613
.02569
-.03589***
0.1279
Revenue Share of Each Sector .05347 *
.01370
0.0123*
.6443D-08
Sales Base Herfindahl Index .10523***
.03345
Square of Sales Base Herfindahl Index -.09082***
.03214
Technological Asset -.76525*
.65452
Marketing Asset -.85658*
.12303
-.91453***
.11093
-1.03010***
.11120
GDP Growth Rate .01646**
.01671
First Lag of GDP .10699D-06**
.4437D-07
Current Ratio .00974*
.00503
.00857**
.00385
.00406
.00423
Firm Size .01003**
.00437
Foreign Revenue .00773
.02944
Domestic Revenue .01833
.05137
Market Share Base Herfindahl Index .06332***
.05862
.08787***
.03047
Square of Market Share Base Herfindahl Index -.02116**
.03436
-.04933**
.02339
Industry Index .00052***
.00009
.00037***
.8374D-04
.00033***
.7979D-04
R&D Expenditure -.43956D-06
.1854D-04
R&D Expenditure Index -.43946D-05
.3782D-05
First Difference of GDP 0.0015**
.1946D-08
Fourth Lag of Technological Asset -3.55198**
.64859
Statistical significance: ***< .01, **<.05, *<.01
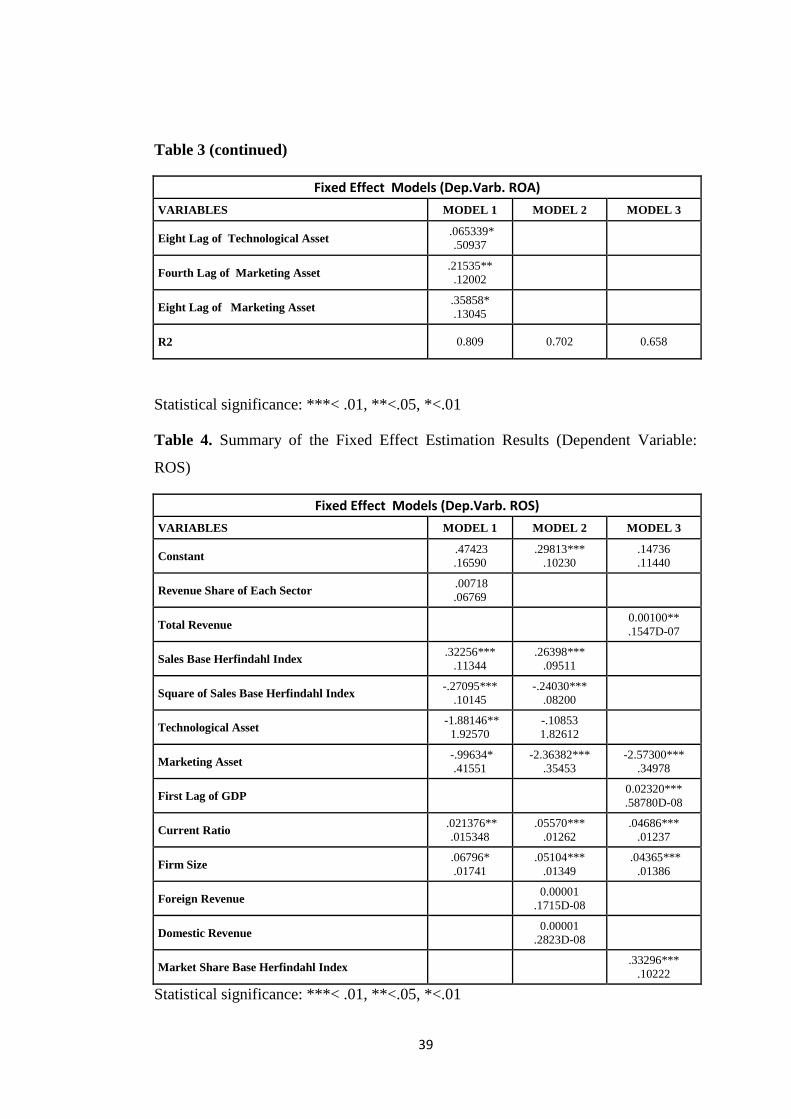
39
Table 3 (continued)
Fixed Effect Models (Dep.Varb. ROA)
VARIABLES MODEL 1 MODEL 2 MODEL 3
Eight Lag of Technological Asset .065339*
.50937
Fourth Lag of Marketing Asset .21535**
.12002
Eight Lag of Marketing Asset .35858*
.13045
R2 0.809 0.702 0.658
Statistical significance: ***< .01, **<.05, *<.01
Table 4. Summary of the Fixed Effect Estimation Results (Dependent Variable:
ROS)
Fixed Effect Models (Dep.Varb. ROS)
VARIABLES MODEL 1 MODEL 2 MODEL 3
Constant .47423
.16590
.29813***
.10230
.14736
.11440
Revenue Share of Each Sector .00718
.06769
Total Revenue 0.00100**
.1547D-07
Sales Base Herfindahl Index .32256***
.11344
.26398***
.09511
Square of Sales Base Herfindahl Index -.27095***
.10145
-.24030***
.08200
Technological Asset -1.88146**
1.92570
-.10853
1.82612
Marketing Asset -.99634*
.41551
-2.36382***
.35453
-2.57300***
.34978
First Lag of GDP 0.02320***
.58780D-08
Current Ratio .021376**
.015348
.05570***
.01262
.04686***
.01237
Firm Size .06796*
.01741
.05104***
.01349
.04365***
.01386
Foreign Revenue 0.00001
.1715D-08
Domestic Revenue 0.00001
.2823D-08
Market Share Base Herfindahl Index .33296***
.10222
Statistical significance: ***< .01, **<.05, *<.01
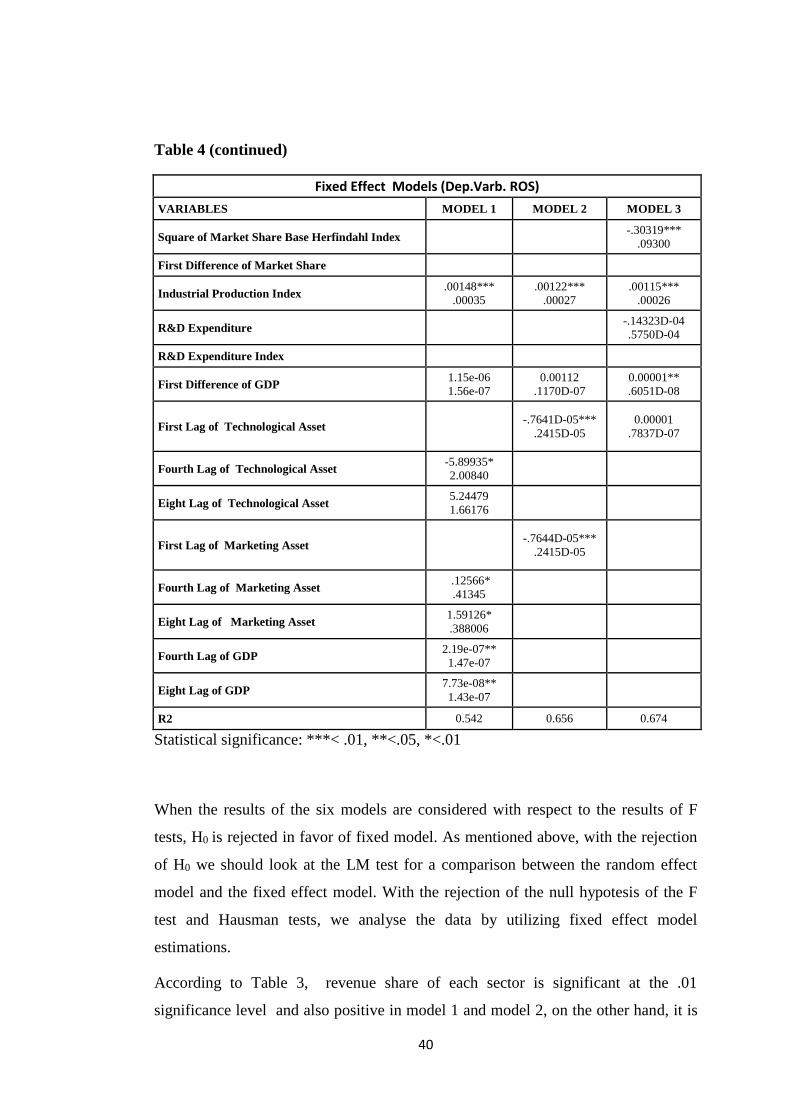
40
Table 4 (continued)
Fixed Effect Models (Dep.Varb. ROS)
VARIABLES MODEL 1 MODEL 2 MODEL 3
Square of Market Share Base Herfindahl Index -.30319***
.09300
First Difference of Market Share
Industrial Production Index .00148***
.00035
.00122***
.00027
.00115***
.00026
R&D Expenditure -.14323D-04
.5750D-04
R&D Expenditure Index
First Difference of GDP 1.15e-06
1.56e-07
0.00112
.1170D-07
0.00001**
.6051D-08
First Lag of Technological Asset -.7641D-05***
.2415D-05
0.00001
.7837D-07
Fourth Lag of Technological Asset -5.89935*
2.00840
Eight Lag of Technological Asset 5.24479
1.66176
First Lag of Marketing Asset -.7644D-05***
.2415D-05
Fourth Lag of Marketing Asset .12566*
.41345
Eight Lag of Marketing Asset 1.59126*
.388006
Fourth Lag of GDP 2.19e-07**
1.47e-07
Eight Lag of GDP 7.73e-08**
1.43e-07
R2 0.542 0.656 0.674
Statistical significance: ***< .01, **<.05, *<.01
When the results of the six models are considered with respect to the results of F
tests, H0 is rejected in favor of fixed model. As mentioned above, with the rejection
of H0 we should look at the LM test for a comparison between the random effect
model and the fixed effect model. With the rejection of the null hypotesis of the F
test and Hausman tests, we analyse the data by utilizing fixed effect model
estimations.
According to Table 3, revenue share of each sector is significant at the .01
significance level and also positive in model 1 and model 2, on the other hand, it is
41
not significant at Table 4. With an increase in revenue for each sector, profitability
increases. According to Vestel Planning and Budget Department data, television is
the most unprofitable product in Vestel and it is reasonable that increase in revenue
of other products will lead to increase in profitability, this reveals that new segment
products are profitable for the firm. In addition, according to the Table 4 - model 3;
profitability increase with an increase in total revenue. Vestel has related
diversification strategy and based on the theory, increase in total revenue shows that
production volume increases. In Park and Jang’s (2012) study they find that with
high levels of related diversification, profitability increases due to economies of
scale and scope, these findings can be applied to our results.
As mentioned before, technological assets and marketing assets are intangible assets
of the firm. Technological assets in the first models; marketing assets in the first,
second and third models at Table 3 and Table 4; they are significant and have
negative coefficients. When we look at the first lags of technological assets and
marketing assets - at Table 3, model 1 and Table 4, model 1- we see that
technological asset is statistically significant and has a negative coefficient. In
addition, first and fourth lags of technological asset have negative and significant
coefficients at table 3 - model 1, table 4 model 1 and 2, unexpectedly. Eight lag of
technological asset has positive and significant coefficient at the 1% of significance
from 3- model 1. Marketing asset is statistically significant and has negative
coefficient at all models. First lag of marketing asset has negative and statistically
significant coefficient at 0.01 level at table 4-model 2. Fourth and eight lags of
marketing asset has positive coefficient and statistically significantat. Table 3 –
model 1 and Table 4 – model 1. These findings support the idea of Mork and Yeung
(1991) that R&D and advertising related intangibles increase the firm value in the
long run. Firstly the cost of intangible assets outweigh the benefits, but in time the
benefits of intangible assets surpass the costs due to economies of scale. Zhao
(2008) states that intangible assets are the sunk costs that are made in order to
develop and introduce new products. The cost or benefit of these expenditures
appears in time. Our findings prove Park and Jang (2012)’s findings that firstly the
effect of these expenditure on ROA is negative; however, as we can see in the lag

42
variables of intangible assets, in the long run their effect turns into positive as
expected.
We use R&D expenditure and R&D expenditure index but we could not get
meaningful results, unexpectedly.
In order to see the difference between the effects of domestic and foreign sales we
use domestic revenue and foreign revenue but they are statistically insignificant.
First difference of gross domestic product and GDP growth rate are the variables
that explain the good index for consumption level. With the increase in the GDP
disposable income, consumption increase and consequently production level
increase. Industrial production index is the economic indicator which measures the
amount of output from different industries. Our findings show that ROA and ROS
are positively correlated with the economic conditions and statistically significant.
Smilar to Chatterjee and Wernerfelt (1991)’s findings, in our model coefficient of
current ratio is positive and statistically significant unexpectedly. This variable
shows the lower default risk and we can conclude that holding capital as cash affect
firm’s profitability positively.
Firm size has a positive coefficient and it is significant. These findings show that as
the firm grows, its profibility is affected positively.
When we look at diversification level, “market share base Herfindahl indices” have
positive coefficients and the coefficients of “square of market share base Herfindahl
indices” are negative and significant. The results reveal that there is u-shaped curve
relationship between profitability and the diversification which shows that at the low
levels of diversification, profits will decrease but with a high level of diversification
firm value will increase. When we look at the “sales based Herfindahl indexes” and
“square of sales base Herfindahl indexes, we see that they are statistically significant
and positive. Our findings are consistent with Park and Jang (2012)’s. With low
level of diversification, its costs will outweigh the benefits, but with the high levels
of diversification the benefits - stemming from economies of scale, scope and
synergy- exceed the costs (Park and Jang, 2012). These results contradict with the
findings of Galvan and De La Torre (2007), Markides (1992) and Khanna, T., and

43
Palepu, K. (2000). Contrast to our models, their model shows that there is inverted-u
relationship between the firm value and diversification level. There is also an
optimal point, after this breaking point, firm value will decrease with the increase in
diversification.
44
CHAPTER 5
CONCLUSION
All in all, this study aims to find the effect of diversification as a strategy on the firm
value of Vestel Co. To this end, the financial data from 1994 quarter 1 to 2014
quarter 2 in quarterly basis is acquired from different sources, and it included
variables such as ROA, ROS, marketing asset, technological asset, GDP etc. The
data is analyzed econometrically by using STATA and LIMDEP. Our results show
some similarities and differences with the existing views and literature as will be
explained below. First of all, as in resource-based view, we have grouped the
products manufactured within Vestel according to the SIC codes and found that
Vestel follows related product diversification strategy, except computers. On the
other hand, the sales revenue figures show us that Vestel failed in unrelated
diversification strategy. Computer sales revenue has declined in time, while other
segments increase their revenue.
Resource based view analyses two types of diversification: related and unrelated,
namely. Resource-based theory is dominating in most of the studies. Among them, a
major number of the researches find that related diversification leads superior
performance for the firms (Wernerfelt and Montgomery, 1986; Hoskisson, 1987;
Berger and Ofek, 1995; Markides and Williamson, 1996 and Colpan, 2003).
Economics and finance literature have found diversification premium model which
shows positive and linear relationship between the diversification and firm
profitability (Campa and Kedia, 2002; Chang and Hong and Zhao, 2008) and
diversification discount model as the reverse of the former one (Lang and Stulz,
1994; Berger and Ofek, 1995 and Lins and Servaes, 1999). Our result does not fit
any of them. We have found an U-shaped relationship between diversification and
firm level as in the resource-based theory. Resource-based view focuses on level of
diversification.
45
Park and Jang, (2012) and Tang and Jang, (2010)’s studies in favor of u shape
relationship argue that at the early stages of the investment in R&D and advertising,
firm faces costs that outweigh the benefits. The benefits of the investment reveals in
time. The most important result of our study is diversification level and firm
performance has an u-shape relationship. We find that in the long run- after a certain
point- with increase in diversification level, profitability increase but this hypothesis
is for the related diversification.
According to resource-based view, intangible assets of the firm are historically
accumulated endowments. Vestel has been successful by using transferrable
resources among the related sectors and the firm continues its diversification
strategy with tablets and smart phones. According to the SIC codes, these sectors are
counted as unrelated diversification strategy. Based on Vestel’s history, one can say
that Vestel will fail at unrelated diversification strategy with smart phones and
tablets. On the other hand, among the world manufacturing firms in the area of
durable consumer goods and consumer electronics such as LG and Samsung are
successful in related and unrelated diversification. Beginning with 1990’s, Korean
government has the target industries and with strong government support Samsung
and LG have applied diversification strategy successfully. According to our results
at the beginning stage of diversification, costs outweigh benefits and at this stage the
support is vital for the firms. For the long-run industrial targets, government support
has an important role. Turkish government should take an example of Korean
government and specify the target industries by focusing on technologies and
thematic areas of importance through technology roadmaps. The public incentives
should be provided via technology roadmaps and in accordance with national targets
specified in these roadmaps.

46
REFERENCES
Baltagi,B.,H., (2001) Econometric Analysis of Panel Data, Wiley, John &Sons
Barney,J. (1991) Firm Resources and Sustained Competitive Advantage, Journal of
Management , Vol.17, pp.99-120
Basu, N. (2009). Trends In Corporate Diversification, Financ Mark Protf Manag,
Vol.24, pp:87-102
Berger, P.G. and Ofek, E. (1995), Diversification’s Effect on Firm Value, Journal of
Financial Economics, Vol. 37 No.1, pp. 39-65
Bettis, A.R., (1981). Performance Differences in Related and Unrelated Diversified
Firms, Strategic Management Journal, Vol.2, No:4, pp.379-393
Braakman, N., Tyne, N.U. and Lueneburg, W. ( 2011). Product Diversification and
Profibility in German Manufacturing Firms, Vol. 231/3, pp.326-335
Campa,J.,M. and Kedia,S. (2002). Explaining the Diversification Discount. The
Journal of Finance, Vol.57, No:4,pp.1731-1762
Caves,R.E. (1981). Diversification and Seller Concentration: Evidence From
Change. Review of Economics and Statistics, Vol.63, pp
Chang, S.-J., and Hong, J. (2000). Economic Performance of Group Affiliated
Companies in Korea: Intra-Group Resource Sharing and Internal Business
Transactions, Academy of Management Journal, 43(3): 429–448.
Chatterjee, S. and Wernerfelt, B. (1991). The Link Between Resources and Type of
Diversification: Theory and Evidence, Strategic Management Journal, Vol.12,
pp.33-48
47
Colak,G.(2008). Diversification, Refocusing and Firm Value, European Financial
Management, Vol.16, No:3,pp.422-448
Colpan,A.,M., Hikino, T., Shimotani,M. and Yokoyama,A. (2003). Product
diversification and financial performance of Japanese textile firms: An econometric
appraisal. The Kyoto Economic Review, Vol.72 No.1/2
Denis, D.J., Denis, D.K. and Sarın, A. (1997). Agency Problems, Equity Ownership
and Corporate Diversification, The Journal of Finance, Vol. 52(1), pp.135- 160
Fukui, Y. and Ushijima, T. (2006). Corporate Diversification, Performance and
Resutructuring in the Largest Japanese Manufacturers, Journal Of The Japanese and
Internationa Economies, vol.21, pp.303-323
Galvan, A., Pindado, J. and De La Torre, C. (2007). Diversification value-creating
or value destroying strategy? Evidence from Using Panel Data. Working Paper No:
DT 04/07
Geroski, P.A., (1995). What Do We Know About Entry?, International Journal of
Industrial Organization, Vol 13, pp. 421-440
Gomes, J. and Livdan, D.(2004). Optimal Diversification Reconciling Theory and
Evidence. Journal of Science, Vol. 2, p.507-510
Gunduz and Tatoğlu (2003).A Comparison of the Financial Characteristics of
Group Affiliated and Independent Firms in Turkey, European Business Review,
Vol.15(1), pp.48-54
Harris, M., Kriebel, C H., and Raviv, R. (1982). Asymmetric Information, Incentives
and Intra-Firm Resource Allocation. Management Science, Vol. 28(6), 604-620.

48
Hayashi, F. (1982). Tobin’s Marginal Q and Average Q: A Neoclassical
Interpretation, Ecometrica, Vol.50, pp.215-224
Helfat, C.,E. and Eisenhardt, K.,M. (2003). Inter-Temporal Economies of Scope,
Organizational Modularity, and the Dynamics of Diversification. Strategic
Management Journal, Vol.25, pp.1217-1232
Hoskisson, R.E. (1987). Multidivisional Structure and Performance: The
contingency of Diversification Strategy, Vol.30, No.4, pp.625-644
Hoskisson, R.E., Eden, L., Lau, C.M. and Wright, M. (2010-a). Strategy in
Emerging Economies, Academy of Management Journal, Vol.43, No.3, pp. 249-267
Hoskisson, R.,E., Johnson, R.,A., Tihanyi, L. and White, R.E. (2010-b). Diversified
Business Group and Corporate Refocusing in Emerging Economies. Journal of
Management, Vol. 31, No.6, pp. 941-965
Jones, G.,R. and Hill, C.,W.,L (1988). Transaction Cost Analysis of Strategy
Structure Choice, Strategic Management Journal, Vol:9, No:2, pp: 159-172
Khanna, T., and Palepu, K. (2000). Is Group Affiliation Profitable in Emerging
Markets? An Analysis of Diversified Indian Business Groups. Journal of Finance,
Vol:55, No:2, pp. 867–891.
Lang, H.P and Stulz, R. (1994). Tobin’s q, Corporate Diversification and Firm
Performance, Journal of Political Economy, Vol.102, pp. 1248-1280
Lee, K., Peng, M.,W. and Lee, K. (2008). From Diversification Premium to
Diversification Discount during Institutional Transitions. Journal of World
Business, Vol.43, No.1, pp.47-65

49
Leibeskind, J. (2000). Internal Capital Markets: Benefits, Costs, and Organizational
Arrangements, Organization Science, Vol:11, No:1,pp. 58–76.
Lins, K. and Servaes, H. (1999), International Evidence on the Value of Corporate
Diversification, The Journal of Finance, Vol.104, No6, pp.2215-2239
Maksimovic,V. and Phillips,G. (2002). Do Conglomerate Firms Allocate Resources
Inefficiently Across Industries? Theory and Evidence, The Journal of Finance,
Vol.57, No.2, pp.721-767
Markides, C. C. (1992). Consequence of corporate refocusing: Ex ante evidence,
Academy of Management Journal, 35: 398–412
Markides, C.C.,Williamson, P.J. (1994). Related Diversification, Core Competences
and Corporate Performance, Strategic Management Journal, Vol 15, pp. 149-165
Markides, C.C.,Williamson, P.J. (1996). Corporate Diversification and
Organizational Structure: A Resourced Based View, Academy of Management
Journal, Vol.39, No:2, pp.340-367
Martins,P.,M.,G. (2010). Fyscal Dynamics in Ethiopia The Cointegrated VAR Model
with Quarterly Data. Centre for Research in Economic Development and
International Trade, working paper.
Meyer, M., P., Milgrom,P. and J. Roberts (1992). Organizational Prospects,
Influence Costs, and Ownership Changes, Journal of Economics and Management
Strategy, 1: 9–35.
Miller, D.J. (2006). Technological Diversity, Related Diversification and Firm
Performance, Strategic Management Journal, Vol.27, pp. 601-619

50
Montgomery, C.A. and Wernerfelt, B. (1988) Diversification, Ricardian Rents and
Tobin’s q, The Rand Journal of Economics, Vol.19, No.4, pp.623-632
Morck, R., and Yeung, B. (1991). Why investors value multinationality?, Journal of
Business, 64(2), 165-187.
Mursitama, T. N. (2006). Creating Relational Rents: The Effect of Business Groups
on Affiliated Firms’ Performance in Indonesia, Asia Pacific Journal of Management,
23: 537–557.
Myers, S.C. (1977). The Determinants of Corporate Borrowing, Journal of Financial
Economics, Vol.5, pp.147-175.
Nayyar, P. (1992). On the Measurement of Corporate Diversification Strategy
Evidence From Large US Service Firms, Strategic Management Journal, Vol:13,
No: 3, pp:219-235
Osorio, D.B., Martin, L.A.G., Vicente, J.A.Z. (2012). Four Decades of Research on
Product Diversification: A Literature Review, Management Decision, vol 50,
p.p:325-344.
Palich, L.E., Cardinal,L.B., Miller,C.C. (2000). Curvilinearity in the Dversification
Performance Linkage an Examination of Over Three Decades of Research. Strategic
Management Journal, Vol.21 No.2 p.p. 155-174.
Park, H., M., (2011). Practical Guides to Panel Data Modeling: A Step-by-step
Analysis Using Stata, Tutorial Working Paper, Graduate School of International
Relations, International University of Japan.
51
Park, K. and Jang, S.,S. (2012). Effect of Diversification on Firm Performance:
Application of the Entropy Measure, International Journal of Hospitality
Management, Vol:31, pp: 218-228
Purkayastha, S., Manolova, T.S. and Edelman, L.F. (2012). Diversification and
Performance in Developed and Emerging Market Contexts: A Review of the
Literature, International Journal of Management Reviews, Vol. 14, pp.18-38
Rajan, R., Servaes, H., Zingales, L. (2000), The Cost of Diversity: The
Diversification Discount and Inefficient Investment, Journal of Finance, Vol.55,
pp.35-80
Scherer, F.M. (1980), Industrial Market Structure and Economic Performance.
Rand McNally, Chicago,IL. pp. 584-586
Servaes, H. (1996). The Value of Diversification During the Conglomerate Merger
Wave, Journal of Finance, Vol.51, pp.1201–1225.
Seth, A. (1990). Value Creation in Acquisition: A Re-examination of Performance
Issues, Strategic Management Journal, Vol:11, No:2, pp:99-115
Scharfstein, D. and Jeremy S. (2000). The Dark Side of Internal Capital Markets:
Divisional Rent-Seeking and Inefficient Investment. Journal of Finance, Vol.55,
pp.2537-2567
Smith, A. (1776). An Inquiry Into the Nature and Causes of the Wealth of Nations,
The Glasgow Edition of the Works and Correspondence of Adam Smith, edited by
W.B. Todd, Oxford
Stulz, R. (1990). Managerial Discretion and Optimal Financing Policies, Journal of
Financial Economics, Vol.26, pp. 3–27.

52
Tang, C. and Jang, S. (2010). Does International Diversification Discount Exist in
the Hotel Industry?, Academy of Management Journal, Vol:39, pp.179-196
Tanrıverdi H., and Venkatraman, N.,(2005). Knowledge Relatedness and the
Performance of Multibusiness, Strategic Managemen Journal, vol: 26, pp. 97-119
Weston, J.F., (1970). The Nature and Significance of Conglomerate Firms, St.
John’s Law Review 44, p.p.66-80
Wan, W.P. and Hoskisson, R.E. (2003), Home Country Environments, Corporate
Diversification Strategies and Firm Performance, Academy of Management
Journal, Vol.46, No.1, pp.27-45
Wan,W.P., Hoskisson, R.E., Short, J.C. and Yiu, D.W. (2011). Resource-Based
Theory and Corporate Diversification: Accomplishments and Opportunities, Journal
of Management, Vol.37, No.5, pp. 1335-1368
Wernerfelt, B. (1984). A Resource-Based View of the Firm, Strategic Management
Journal, Vol.5, pp.171-180
Whited, T., M. (2001). Is It Inefficient Investment That Causes the Diversification
Discount? The Journal of Finance, Vol: 56, No:5,pp.1667- 1691
Villalonga, B. (2004). Does Diversification Cause the "Diversification Discount"?,
Financial Management, p.p.5-27.
Villalonga, B. and Mcgahan, A., M. (2005) The Choice Among Acquisition Alliances
and Divestitures, Strategic Management Journal, Vol. 26, pp.1183-1208
Zhao, A. (2008). Diversification Effects: A Real Options Approach, Doctoral
Dissertation, Kent State University, Kent, OH.

53
http://www.tuik.gov.tr/UstMenu.do?metod=temelist
http://www.zorlu.com.tr/TR/GRUP/ves_vestel.asp
http://siccode.com/en/
http://data.worldbank.org/about/country-and-lending-groups
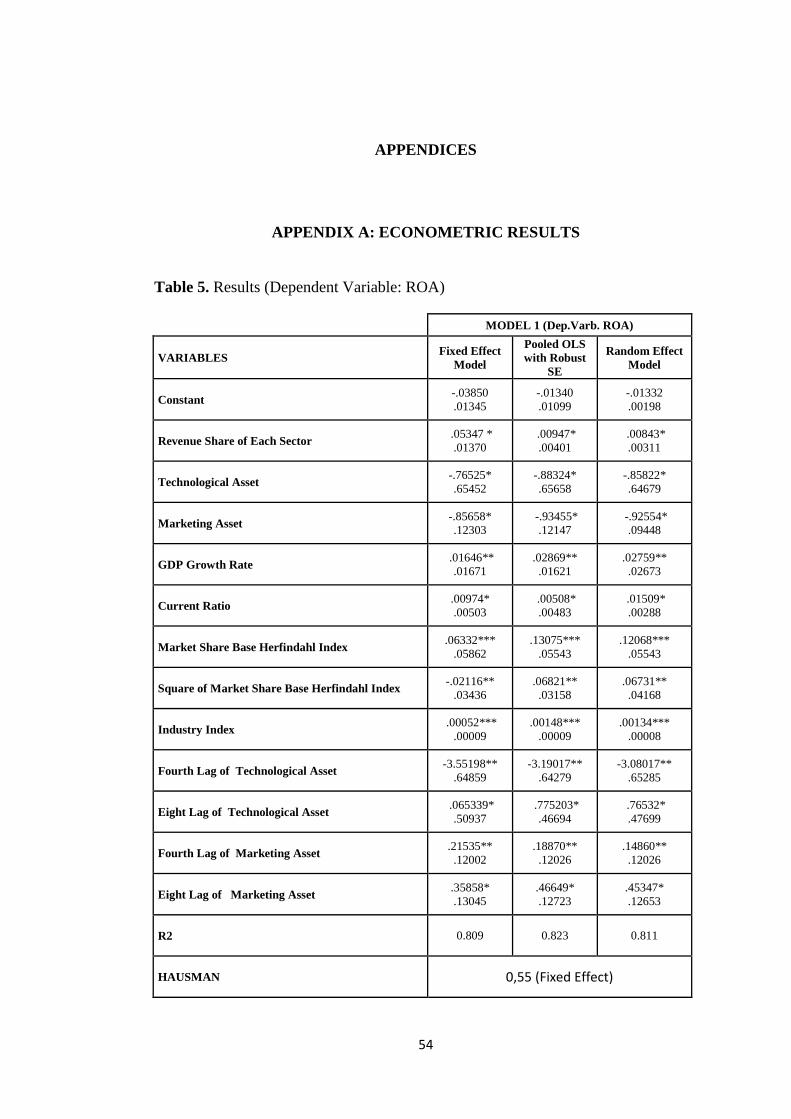
54
APPENDICES
APPENDIX A: ECONOMETRIC RESULTS
Table 5. Results (Dependent Variable: ROA)
MODEL 1 (Dep.Varb. ROA)
VARIABLES Fixed Effect
Model
Pooled OLS
with Robust
SE
Random Effect
Model
Constant -.03850
.01345
-.01340
.01099
-.01332
.00198
Revenue Share of Each Sector .05347 *
.01370
.00947*
.00401
.00843*
.00311
Technological Asset -.76525*
.65452
-.88324*
.65658
-.85822*
.64679
Marketing Asset -.85658*
.12303
-.93455*
.12147
-.92554*
.09448
GDP Growth Rate .01646**
.01671
.02869**
.01621
.02759**
.02673
Current Ratio .00974*
.00503
.00508*
.00483
.01509*
.00288
Market Share Base Herfindahl Index .06332***
.05862
.13075***
.05543
.12068***
.05543
Square of Market Share Base Herfindahl Index -.02116**
.03436
.06821**
.03158
.06731**
.04168
Industry Index .00052***
.00009
.00148***
.00009
.00134***
.00008
Fourth Lag of Technological Asset -3.55198**
.64859
-3.19017**
.64279
-3.08017**
.65285
Eight Lag of Technological Asset .065339*
.50937
.775203*
.46694
.76532*
.47699
Fourth Lag of Marketing Asset .21535**
.12002
.18870**
.12026
.14860**
.12026
Eight Lag of Marketing Asset .35858*
.13045
.46649*
.12723
.45347*
.12653
R2 0.809 0.823 0.811
HAUSMAN 0,55 (Fixed Effect)
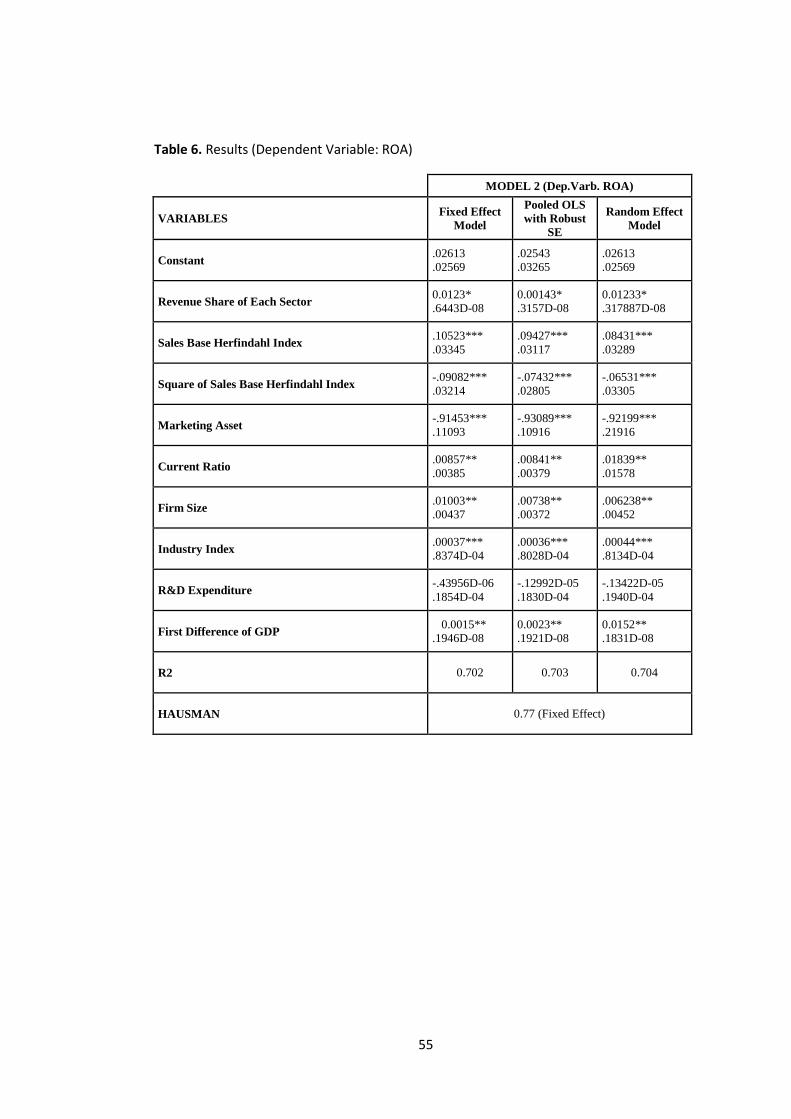
55
Table 6. Results (Dependent Variable: ROA)
MODEL 2 (Dep.Varb. ROA)
VARIABLES Fixed Effect
Model
Pooled OLS
with Robust
SE
Random Effect
Model
Constant .02613
.02569
.02543
.03265
.02613
.02569
Revenue Share of Each Sector 0.0123*
.6443D-08
0.00143*
.3157D-08
0.01233*
.317887D-08
Sales Base Herfindahl Index .10523***
.03345
.09427***
.03117
.08431***
.03289
Square of Sales Base Herfindahl Index -.09082***
.03214
-.07432***
.02805
-.06531***
.03305
Marketing Asset -.91453***
.11093
-.93089***
.10916
-.92199***
.21916
Current Ratio .00857**
.00385
.00841**
.00379
.01839**
.01578
Firm Size .01003**
.00437
.00738**
.00372
.006238**
.00452
Industry Index .00037***
.8374D-04
.00036***
.8028D-04
.00044***
.8134D-04
R&D Expenditure -.43956D-06
.1854D-04
-.12992D-05
.1830D-04
-.13422D-05
.1940D-04
First Difference of GDP 0.0015**
.1946D-08
0.0023**
.1921D-08
0.0152**
.1831D-08
R2 0.702 0.703 0.704
HAUSMAN 0.77 (Fixed Effect)
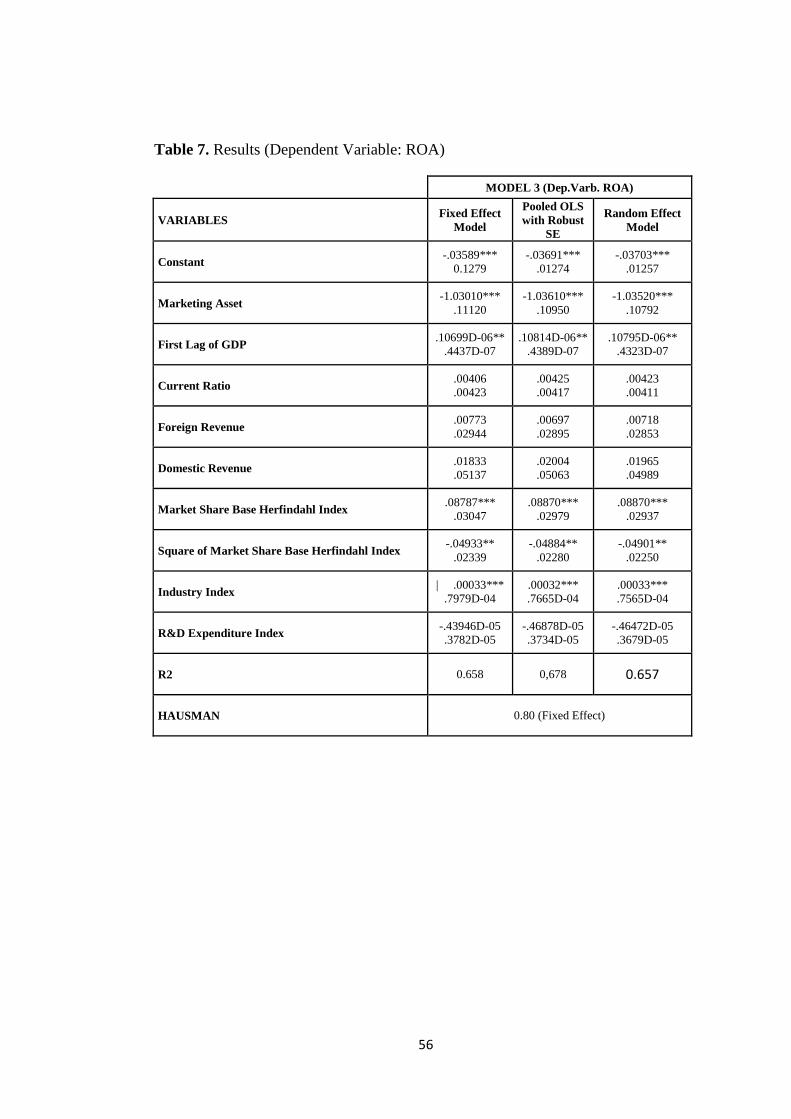
56
Table 7. Results (Dependent Variable: ROA)
MODEL 3 (Dep.Varb. ROA)
VARIABLES Fixed Effect
Model
Pooled OLS
with Robust
SE
Random Effect
Model
Constant -.03589***
0.1279
-.03691***
.01274
-.03703***
.01257
Marketing Asset -1.03010***
.11120
-1.03610***
.10950
-1.03520***
.10792
First Lag of GDP .10699D-06**
.4437D-07
.10814D-06**
.4389D-07
.10795D-06**
.4323D-07
Current Ratio .00406
.00423
.00425
.00417
.00423
.00411
Foreign Revenue .00773
.02944
.00697
.02895
.00718
.02853
Domestic Revenue .01833
.05137
.02004
.05063
.01965
.04989
Market Share Base Herfindahl Index .08787***
.03047
.08870***
.02979
.08870***
.02937
Square of Market Share Base Herfindahl Index -.04933**
.02339
-.04884**
.02280
-.04901**
.02250
Industry Index | .00033***
.7979D-04
.00032***
.7665D-04
.00033***
.7565D-04
R&D Expenditure Index -.43946D-05
.3782D-05
-.46878D-05
.3734D-05
-.46472D-05
.3679D-05
R2 0.658 0,678 0.657
HAUSMAN 0.80 (Fixed Effect)

57
Table 8. Results (Dependent Variable: ROS)
MODEL 1 (Dep.Varb. ROS)
VARIABLES Fixed Effect
Model
Pooled OLS
with Robust
SE
Random Effect
Model
Constant .47423
.16590
.48327
.14349
.83275
.14393
Revenue Share of Each Sector .00718
.06769
-.06095
.01356
-.07856
.01575
Sales Base Herfindahl Index .32256***
.11344
.32214***
.10061
.39174***
.11634
Square of Sales Base Herfindahl Index -.27095***
.10145
-.26193***
.08467
-.25814***
.07567
Technological Asset -1.88146**
1.92570
-1.80446**
2.86589
-1.83035**
2.95749
Marketing Asset -.99634*
.41551
-.99839*
.47175
-.98837*
.46731
Current Ratio .021376**
.015348
.021357**
.021145
.021947**
.023225
Firm Size .06796*
.01741
.06898*
.01671
.06791*
.01563
Industry Index .00148***
.00035
.00151***
.00033
.01141***
.00120
First Difference of GDP 1.15e-06
1.56e-07
1.14e-06
1.84e-07
1.13e-06
1.73e-07
Fourth Lag of Technological Asset -5.89935*
2.00840
-5.95964*
1.69164
-5.99659*
1.63679
Eight Lag of Technological Asset 5.24479
1.66176
5.16930
1.91902
5.15702
1.97038
Fourth Lag of Marketing Asset .12566*
.41345
.11200*
.35676
.11103*
.35765
Eight Lag of Marketing Asset 1.59126*
.388006
1.60756*
.550359
1.61453*
.513788
Fourth Lag of GDP 2.19e-07**
1.47e-07
2.21e-07**
9.31e-08
2.23e-07**
9.90e-02
Eight Lag of GDP 7.73e-08**
1.43e-07
7.85e-08**
1.04e-07
7.69e-08**
1.13e-07
R2 0.542 0.543 0.594
HAUSMAN 0.40 (Fixed Effect)
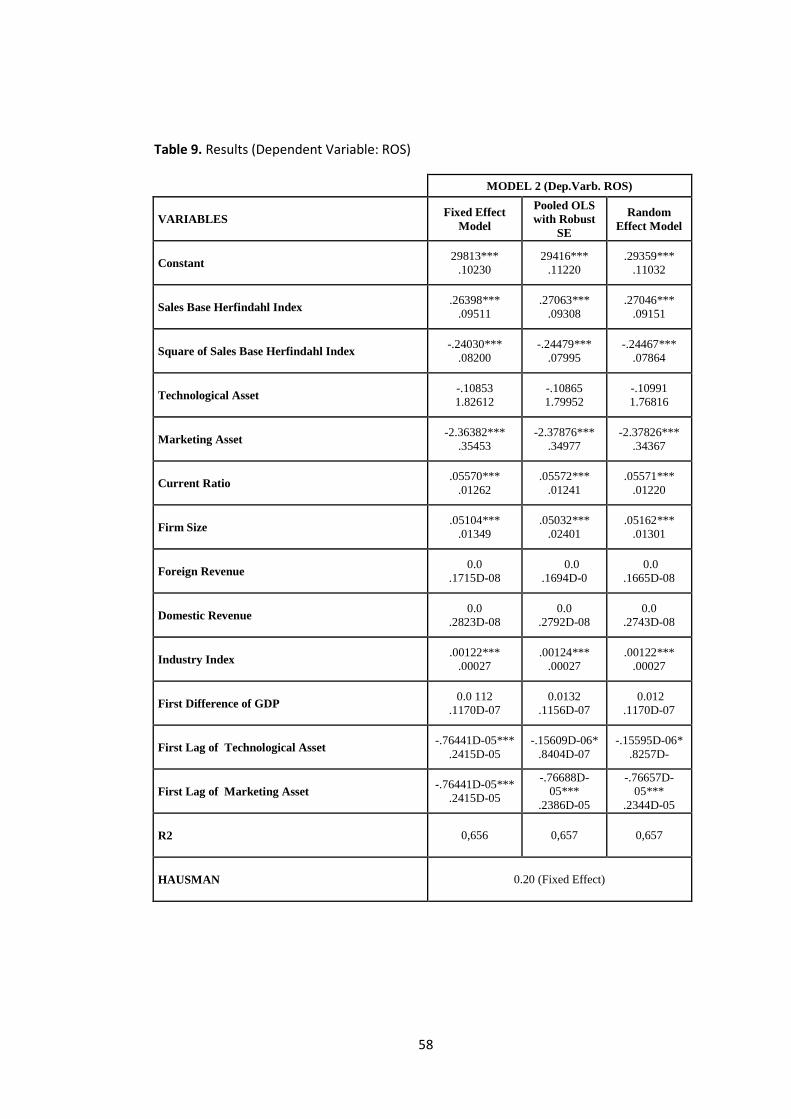
58
Table 9. Results (Dependent Variable: ROS)
MODEL 2 (Dep.Varb. ROS)
VARIABLES Fixed Effect
Model
Pooled OLS
with Robust
SE
Random
Effect Model
Constant 29813***
.10230
29416***
.11220
.29359***
.11032
Sales Base Herfindahl Index .26398***
.09511
.27063***
.09308
.27046***
.09151
Square of Sales Base Herfindahl Index -.24030***
.08200
-.24479***
.07995
-.24467***
.07864
Technological Asset -.10853
1.82612
-.10865
1.79952
-.10991
1.76816
Marketing Asset -2.36382***
.35453
-2.37876***
.34977
-2.37826***
.34367
Current Ratio .05570***
.01262
.05572***
.01241
.05571***
.01220
Firm Size .05104***
.01349
.05032***
.02401
.05162***
.01301
Foreign Revenue 0.0
.1715D-08
0.0
.1694D-0
0.0
.1665D-08
Domestic Revenue 0.0
.2823D-08
0.0
.2792D-08
0.0
.2743D-08
Industry Index .00122***
.00027
.00124***
.00027
.00122***
.00027
First Difference of GDP 0.0 112
.1170D-07
0.0132
.1156D-07
0.012
.1170D-07
First Lag of Technological Asset -.76441D-05***
.2415D-05
-.15609D-06*
.8404D-07
-.15595D-06*
.8257D-
First Lag of Marketing Asset -.76441D-05***
.2415D-05
-.76688D-
05***
.2386D-05
-.76657D-
05***
.2344D-05
R2 0,656 0,657 0,657
HAUSMAN 0.20 (Fixed Effect)
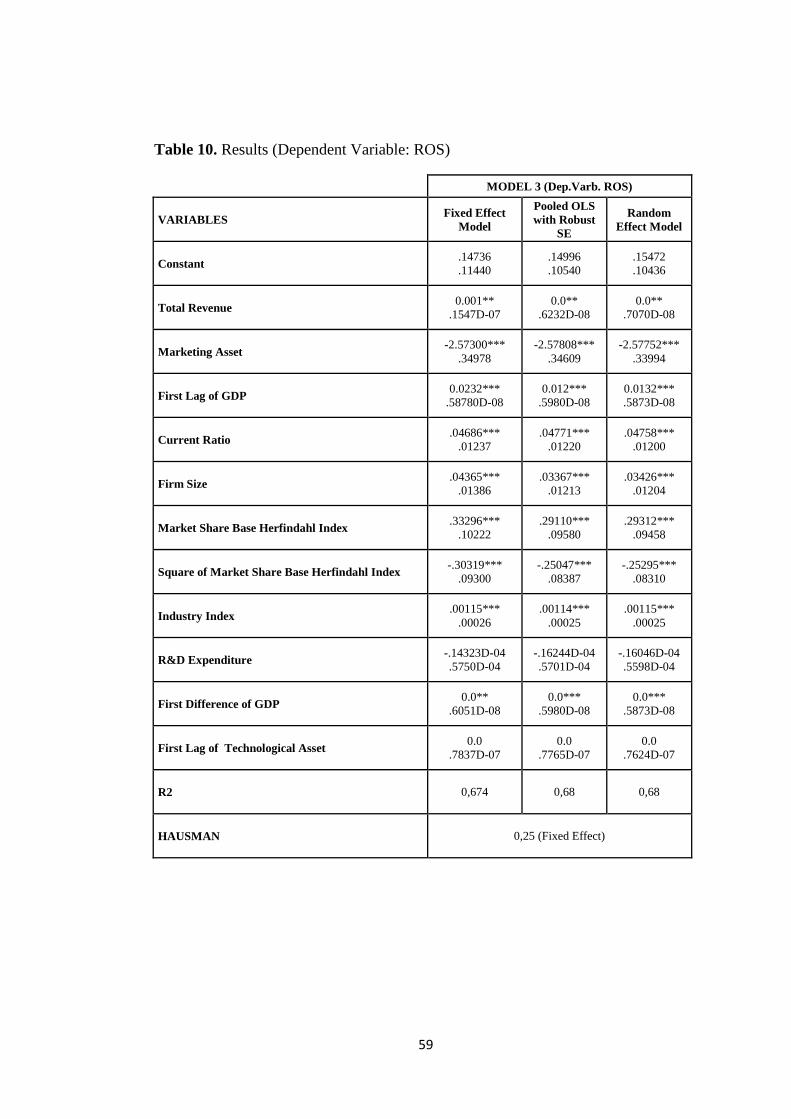
59
Table 10. Results (Dependent Variable: ROS)
MODEL 3 (Dep.Varb. ROS)
VARIABLES Fixed Effect
Model
Pooled OLS
with Robust
SE
Random
Effect Model
Constant .14736
.11440
.14996
.10540
.15472
.10436
Total Revenue 0.001**
.1547D-07
0.0**
.6232D-08
0.0**
.7070D-08
Marketing Asset -2.57300***
.34978
-2.57808***
.34609
-2.57752***
.33994
First Lag of GDP 0.0232***
.58780D-08
0.012***
.5980D-08
0.0132***
.5873D-08
Current Ratio .04686***
.01237
.04771***
.01220
.04758***
.01200
Firm Size .04365***
.01386
.03367***
.01213
.03426***
.01204
Market Share Base Herfindahl Index .33296***
.10222
.29110***
.09580
.29312***
.09458
Square of Market Share Base Herfindahl Index -.30319***
.09300
-.25047***
.08387
-.25295***
.08310
Industry Index .00115***
.00026
.00114***
.00025
.00115***
.00025
R&D Expenditure -.14323D-04
.5750D-04
-.16244D-04
.5701D-04
-.16046D-04
.5598D-04
First Difference of GDP 0.0**
.6051D-08
0.0***
.5980D-08
0.0***
.5873D-08
First Lag of Technological Asset 0.0
.7837D-07
0.0
.7765D-07
0.0
.7624D-07
R2 0,674 0,68 0,68
HAUSMAN 0,25 (Fixed Effect)
60
APPENDIX B : TURKISH SUMMARY
Verimliliğin arttırılması ve üretim faktörlerinin verimli bir şekilde kullanılması hem
mikro hem de makroekonominin konusu olmuştur. Ekonomistler verimli bir şekilde
büyümek için ürün çeşitliliği veya uzmanlaşma olmak üzere iki stratejiyi
incelemektedirler. Riski azaltma ihtiyacından dolayı 1950’li yıllarda ürün çeşitliliği
stratejisi gündeme gelmeye başlamıştır. 1980’li yıllara kadar ürün çeşitliliği stratejisi
verimliliği ve karlılığı arttıran aynı zamanda riski azaltan bir strateji olarak
görülmüştür. 1980’li yıllardan itibaren ise ürün çeşitliliği stratejisi yerine
uzmanlaşmanın karlılığı arttırdığı yönünde çalışmalar ağırlık kazanmıştır.
Literatürde ortak bir sonuç bulunamamaktadır. Bu çalışmanın amacı ürün
çeşitliliğinin firmanın karlılığı üzerindeki etkisini incelemektir. Bu amaç için Vestel
Ticaret A.Ş. panel veri ekonometrik analizi ile incelenmiştir. Çalışmanın önemi ve
anlamlı katkısı, diğer çalışmaların aksine bir firmanın incelenmesi ile zaman
içerisinde firmanın gelişiminin gözlenebilmesidir.
Ürün çeşitliliği üzerine yapılan çalışmalar incelendiğinde 1950’li yıllardan 1980’li
yıllara kadar ürün çeşitliliğini savunan çalışmalar öne çıkmaktadır (Osorio, 2012).
Özellikle finans literature ürün çeşitliliği ve karlılık üzerine çalışmalarında sadece
iki sonuç bulmaktadır. Yapılan ilk çalışmalara göre ürün çeşitliliği stratejisinin
karlılık üzerine pozitif etkisi bulunmaktadır, bunun sebepleri verimliliğin artması ve
büyümenin gerçekleşmesi, atıl iç kaynakların verimli bir şekilde kullanılması, farklı
ürün gamlarında faaliyet göstererek firmanın batma riskinin düşürülmesi
gösterilebilinir. (Osorio, 2012; Palich, 2000 ve Zhao, 2008). Finans literatüründe
birçok çalışma ürün çeşitliliği stratejisine sahip ve uzmanlaşmayı seçmiş firmaları
kıyaslamaktadır. Kıyaslarken karlılığı ölçmek için çoğunlukla aktif getiri oranını
karlılık göstergesi olarak kullanmaktadırlar; firmanın ürün çeşitliliği stratejisi ile ne
kadar değerlendiğini anlamak için ise değer fazlasını hesaplamaktadırlar.
Araştırmacılar ürün çeşitliliği stratejisini uygulayan firmaların pazar gücü elde
ederek, sert fiyat politikaları uyguladıklarını ve bu sayede rakiplerine karşı avantaj
elde ettiklerini savunmaktadırlar (Osorio,, 2012 ve Palich et al 2000). Rakiplere
karşı elde edilen avantaj çapraz sübvansiyon ile açıklanabilinir, ürün çeşitliliği
61
stratejisi ile farklı ürün segmenterine sahip firmalar az karlı ürün gruplarını karlı
ürünler ile sübvanse edebilir ve bu alanda rakiplerine karşı üstünlük sağlamış olurlar
(Weston, 1977). Ayrıca ürün çeşitliiği sayesinde firmalar başlangıç maliyetlerinden
muaf olurar veya rakiplerine göre minimum düzeyde başlangıç maliyeti ile
karşılaşırlar (Scherer, 1980). Finansal çalışmalar ayrıca ürün çeşitliliği stratejisi ile
firmaların batma riskini azalttıklarını ve farklı ürün grubuna sahip olmanın onlar için
sigorta niteliğini taşıdığını belirtmektedirler (Galvan ve De La Torre, 2007 and
Myers, 1977). Farklı ürün gamı portföyüne sahip olmak firmaların borçlanma
kapasitelerinin artmasını sağlar ve bu kapasitenin artışı vergi avantajı olarak firmaya
avantaj sağlamaktadır (Palich, 2000; Berger ve Ofek, 1995 ve Servaes, 1996).
Firmaların kullanabileceği kaynaklar iç ve dış kaynaklar olarak ikiye ayrılmaktadır.
Dış kaynaklar kredi ve halka arz gibi firma dışından kullanılan fonlardır. İç
kaynaklar ise faiz gibi işlem maliyeti olmadığından dolayı maliyet avantajına
sahiptir (Palich, 2000). Finans literatürü dış kaynak kullanımının verimliliği
düşürdüğünü belirterek ürün çeşitliliği stratejisi sayesinde iç kaynak kullanımının
firmalara maliyet avantajı sağlayarak karlılığını arttırdığını belirtmektedirler
(Gunduz, L. ve Tataoğlu, E., 2003).
1980’li yıllardan itibaren ise ürün çeşitliliği stratejisi karlılığı düşüren bir politika
olarak görülmeye başlamıştır. Finans ve ekonomi literatürünün çoğu, karlılık ve
ürün çeşitliliği arasında lineer ve negatif bir ilişki ortaya koymaktadır (Osorio,
2012). Birçok çalışmada firmaların ürün çeşitliliği stratejisinde kaybettikleri değeri
ölçmek için “Tobin’in q” oranı kullanılmıştır (Berger ve Ofek, 1995; Denis ve
Sarin, 1997; Lang ve Stulz, 1994 ve Rajan, 2000). Lang ve Stulz (1994) ve Gomes
ve Livdan (2004) çalışmalarında ürün çeşitliliği yapan firmaların düşük Tobin q
oranına sahip olduklarını kanıtlamışlardır. Ürün çeşitliliğinin karlılığı negatif yönde
etkilediğini savunanların temel argümanları; çapraz sübvansiyon ile düşük getirili
sektörlere yatırım yapmak, yüksek yönetici maliyeti ve bilgi eşitsizliğidir (Osorio,
2012). Yapılan çalışmalar verimsiz sektörlere yatırım yapmak yerine uzmanlaşarak
karlı yatırım yapmanın en doğru strateji olduğunu göstermektedir (Weston, 1977;
Berger ve Ofek, 1995; Palich, 2000 ve Stulz, 1990).
62
Denis (1997) ürün çeşitliliği stratejisi karlılığı düşürüyorsa neden firmalar hala bu
stratejiyi sürdürmektedir sorusundan yola çıkarak firmaların ürün çeşitliliği
stratejisini seçme sebeplerini incelemiştir. Campa ve Kedia (2002), ve Colak (2010)
firmaların ürün çeşitliliği stratejisini seçme sebeplerini de modele dahil ederek
çalışma yapmışlardır. Sonuç olarak bu sebepleri modele yerleştirdiklerinde ve
firmaları sebeplerine göre ayırdıklarında ürün çeşitliliği ve karlılık arasında pozitif
bir ilişki bulmuşlardır ancak; sebeplerini modelden çıkarttıklarında ürün çeşitliliği
stratejisinin karlılığı azalttığını ortaya çıkarmaktadırlar. Campa ve Kedia (2002), ve
Colak (2010)’a göre eğer bir firma bulunduğu alanda düşük karlılığa sahip ve
getirisi düşük bir sektörde faaliyet gösteriyor ve bu sebepten dolayı ürün çeşitliliği
stratejisini tercih ediyorsa sonuç olarak yeni ürün gruplarında da düşük performans
sergilemektedirler. Sonuç olarak firmaların ürün çeşitliliğine gitmeden önceki
durumlarının göz önüne alınması gerektiğini, başlangıçta düşük performansa sahip
firmalar ile yüksek performans sergileyen firmaların ayrı ayrı incelenmesi
gerektiğini savunmaktadırlar.
Finans ve ekonomi literatürü ürün çeşitliliği ve karlılık arasında lineer ilişkiyi
incelemiş fakat ürün çeşitliliği seviyesini ve çeşidini dikkate almamıştır. Stratejik
yönetim literatürü çalışmaları ürün çeşitliliğinin seviye ve çeşidine göre etkilerini
incelemektedir (Osorio, 2012). Stratejik yönetim çalışmaları kaynak temelli
yaklaşımı baz alarak ürün çeşitliliği stratejisini ilgili ve ilgisiz olmak üzere ikiye
ayırmaktadırlar (Wan, 2011). İlgisiz ve ilgili ürün çeşitliliğini ayırmak için
kullanılan en genel yöntem SIC kodlardır. SIC kodlara göre eğer ilk iki hanesi aynı
ise ürün grupları ilgili, değil ise ilgisizdir (Wan, 2011). İlgili ürün çeşitliliğinde
firma yeni ürün grubu üretiminde mevcut bilgi birikimi ve kaynaklarını
kullanabilmekte iken ilgisiz ürün gruplarında mevcut kaynaklar kullanılamamaktadır
(Galvan, Pindado ve Torre; 2007).
Stratejik yönetim literatürü ürün çeşitliliğinin avantaj ve dezavantajlarını incelerken
firmanın stratejik kaynaklarının heterojen olduğunu ve bu kaynakların transfer
edilemediğini varsaymaktadır (Barney, 1991 ve Wan et al, 2011). Stratejik yönetim
literatürü kaynakları maddi ve maddi olamayan olmak üzere ikiye ayırmaktadır.
Maddi olmayan varlıklara örnek marka ismi, müşteri bağlılığı, teknolojik bilgi
63
birikimi, yetenekli çalışanlar; maddi olmayan varlıklara ise fiziksel ve finansal
varlıklar örnek verilebilinir (Wernerfelt, 1984). Maddi olmayan varlıkların
transferinin zor ya da imkansız oluşu, firmaları ürün çeşitliliğine yönlendirmektedir,
burada fazla kaynakların verimli bir şekilde kullanıldığı varsayılmaktadır (Palich,
2000). Ancak eğer firmanın stratejik kaynakları ancak bir ürün grubu üretimi içinse
ürün çeşitliliği stratejisi verimsiz bir sonuç doğurmaktadır (Montgomery ve
Wernerfelt, 2008; Chatterjee, S. ve Wernerfelt, B., 1991).
İlgili ve ilgisiz ürün çeşitliliği karşılaştırmaları genelde kaynak temelli çalışmalarda
yapılmaktadır (Berger ve Ofek, 1995; Bettis, 1981; Hoskisson, 1987; Markides ve
Williamson, 1996). Çalışmaların çoğu ilgili ve ilgisiz ürün grubu ayrımını q SIC
kodlara göre yapmakta iken, bir kısmı da ortak kullanılan kaynaklara göre ayırım
yapmakta ve buna göre ilgili ve ilgisiz ürün çeşitliliğine giden firmaları
kıyaslamaktadırlar (Galvan ve De La Torre, 2007). İlgili ürün çeşitliliğinin
avantajları olarak üretim kaynaklarının verimli bir şekilde dağılması sayesinde ölçek
ekonomisinin verdiği avantajlar, farklı ürün gruplarından elde edilen ve ilgili ürün
gruplarında kullanılabilen bilgi birikimi gösterilmektedir (Berger ve Ofek, 1995;
Helfat ve Eisenhardt, 2003). İlgisiz ürün çeşitliliği stratejisinin avantajları olarak ise
farklı ürün gruplarında faaliyet göstererek firmaların riski dağıtıp, batma riskini
düşürmesi ve borçlanma kapasitelerinin artması gösterilmektedir (Palich, 2000).
Çalışmaların çoğu ilgili ürün çeşitliliği stratejisinin firmaların karlılığını arttırdığını
göstermektedir (Hoskisson, 1987; Markides ve Williamson,1996 ve Bettis,1981).
Kaynak temelli çalışmaların incelediği diğer konu ise ürün çeşitliliğinin seviyesidir.
Herfindahl Indeksi ve karesini kullanarak lineer olmayan ilişki de incelenmektedir
(Osorio, 2012). Yapılan çalışmalara göre ürün çeşitliliği ve karlılık arasında iki çeşit
sonuç ortaya çıkmaktadır:
U-şeklinde ilişki
Ters-U şeklinde ilişki
Ürün çeşitliliği ve karlılık arasında U- şeklinde ilişki bulan çalışmalara göre bunu
sebebi kısa vadede yatırım maliyetlerinin getiriden daha yüksek olması fakat uzun
vadede üretim hacminin, bilgi birikiminin artması ile firmanın karının artmasıdır
64
(Park ve Jang, 2012 ve Tang ve Jang, 2010). Ters-u şeklinde ilişki bulan çalışmalar
ise karlılığı arttıran maksimum noktanın bulunduğunu ve bu noktadan sonra ürün
çeşitliliğini arttırmanın kaynak yetersizliğine sebep olduğunu ve karlılığın
düştüğünü savunmaktadırlar (Galvan ve De La Torre, 2007 ve Markides, 1992).
Genel olarak bakıldığında kaynak temelli çalışmalara göre ilgili ürün stratejisi kısa
ve uzun vadede firmanın karlılığını arttırmakta iken ilgisiz ürün çeşitliliği stratejisi
uzun vadede karlılığı düşürmektedir (Zhao, 2008).
Kurumsal ekonomi çalışmaları ise ülke ekonomik koşullarının ürün çeşitliliği
stratejisini doğrudan etkilediğini belirtmektedirler. Yapılan çalışmalarda Dünya
Bankası’nın ülkeleri sınıflandırma sistemi kullanılarak ülkeler gelişmiş ve
gelişmekte olan olmak üzere ikiye ayrılmaktadır. Gelişmekte olan ülkelerin finansal
sistemlerinin gelişmediği veya az geliştiği varsayımı altında dış kaynak kullanımının
maliyetli olduğunu savunan çalışmalar, gelişmekte olan ülkelerde iç kaynak
kullanımının firmaların maliyetini azalttığını savunmaktadırlar. Ürün çeşitliliği
stratejisi ile iç kaynak kullanımına giden firmalar rakipler karşısında avantaj
kazanarak karlılığını arttıracaktır. Fakat; gelişmiş ülkelerin finansal piyasalarının da
gelişmiş olması kaynağa ulaşımı hem kolaylaştırmakta hem de maliyeti
ucuzlaştırmaktadır (Osorio, 2012). Berger ve Ofek (1995), Lang ve Stulz (1994),
Palich (2000) yaptıkları çalışmalarda ilgisiz ürün çeşitliliği stratejisinin gelişmiş
ülkelerde avantaj yaratmadığını, bu ülkelerde firmaların risk çeşitlendirme
ihtiyaçlarının bulunmadığını belirtmektedirler. Sonuç olarak gelişmekte olan
ülkelerde ürün çeşitliliği stratejisinin karlılığı arttırdığı ve ilgisiz ürün çeşitliliğinin
risk azaltarak firmalara avantaj sağladığı ortaya çıkmaktadır. Gelişmiş ülkelerde ise
bu durum tam tersi olmaktadır, ilgili ürün çeşitliliği stratejisi ile firmalar bilgi
birikimini kullanarak karlılığı arttırabilir ama gelişmiş ülkede bulunan firmaların
risk azaltma ihtiyacı bulunmaması ilgisiz ürün çeşitliliğinin avantajını ortadan
kaldırmaktadır (Osorio, 2012; Berger ve Ofek, 1995; Lang ve Stulz,1994 ve Palich,
2000).
Literatür incelendiğinde ürün çeşitliliğinin karlılık üzerine etkisi konusunda ortak bir
bulgu olmadığı ve çalışmaların çok farklı sonuçlar verdiği ortaya çıkmaktadır.
Yapılan çalışmaların çoğu birden fazla firmaların incelenmesi ile yapılmıştır. Bu
65
tezde ise Vestel Ticaret A.Ş.’nin üretimde çeşitlilik stratejisi incelenmiştir. Tek bir
firmanın incelenmesi firmanın gelişimini incelemek adına önemli bir kaynak
olmuştur. Vestel’in bu stratejisinin anlaşılabilmesi için, tarihinin özetine bakmak
gereklidir. Vestel’in bir parçası olduğu Zorlu Holding, 1950’lerde Denizli’de
kuruldu. Asıl olarak tekstil sektöründe iş yapan Holding zamanla dört ana alanda
daha iş yapmaya başlamıştır; ev tekstili ve polyester iplik; tüketici elektroniği,
bilişim teknolojisi ve dayanıklı tüketim malları; gayrimenkul; ve son olarak enerji.
1980’lerin sonlarına kadar sadece tekstil işinde yoğunlaşan Holding, 1994 yılında
Vestel’i satın alır. Sonrasında ise elindeki portfolyoyu çeşitlendirmek adına
gayrimenkul ve enerji sektörlerine de giriş yapar. Holding’in farklı alanlardaki
işlerinin içinde Vestel, büyük ve önemli bir yer kapsadığı için, “amiral gemisi” veya
“parlayan yıldız” olarak anılır.
Vestel, LCD TV, bulaşık makinesi, çamaşır makinesi, buzdolabı, fırın gibi
ürünlerden ses sistemlerine kadar birçok ürünü üretmektedir. Strateji olarak
üretimde çeşitliliği seçen Holding, Vestel’in içinde de bu stratejiyi uygulamaya karar
verir. Televizyon, Vestel’in ürettiği en önemli ve en büyük kalem olma özelliğine
sahip olmakla birlikte, şirketi hem dünya hem de yerel TV pazarında en önemli
oyuncular arasına sokmaktadır. Elektronik Cihazlar İhracatçıları Derneği’ne göre
2014 yılında Vestel’in üretimi tek başında Türkiye’deki TV üretiminin %82’sini
oluşturmaktadır.
1983 yılında üretime geçen Vestel, 1994 yılında Zorlu Grubu tarafından devralınır.
Devralınmasının sonrasındaki ilk üç sene, ülke dışından ‘know-how’ getirmek ve
bunu şirkete uygulamakla geçer. O zamana kadar şirket sadece bir ürüne
odaklanmıştı: TV. Bu ürün de daha çok yabancı markalar için üretilmekteydi, Vestel
bir OEM/ODM üreticisi konumundaydı. TV’ye odaklanıp, farklı müşteri
segmentleri ve farklı ihtiyaçlar için farklı ürünler geliştirilmeye başlandı.
1997’de Vestel hem uygulama hem de geliştirme kısımlarını yapmaya başladı, her
ne kadar uygulama mühendisliği hala önemli bir yer kaplıyor olsa da. Bunun
neticesinde üretimde çeşitlilik için ilk adım atılmış oldu ve Vestel Beyaz Eşya
üretimine geçti (buzdolabı, çamaşır makinesi, bulaşık makinesi, fırın ve klima).
Bunun yanı sıra, dijital tüketim malları üretimine de bu yıllarda başlandı. Bundan,
66
Vestel’in elde etmiş olduğu “know-how” bilgisini ve ekipmanını diğer malların
üretiminde kullanmaya başladığı anlaşılmaktadır. Standart Endüstriyel Sınıflandırma
Kodlarına (SIC) bakıldığında ilgili üretimde çeşitlilik stratejisinin izlenmiş olduğu
ve üretim araçlarının farklı ürünleri üretmek için de kolaylıkla kullanılabileceği
görülmüştür. SIC kodları endüstri alanlarını sınıflandırmak ve devlet kuruluşlarının
anlamlı ve standardize edilmiş data verebilmesini sağlar. Bu sınıflandırma altında,
Vestel A.Ş. “D Bölümü: İmalat” altında “Ana grup 36: Bilgisayar Ekipmanı Hariç,
Elektronik ve Diğer Elektronik Ekipman ve Parçaları” üreticisi kategorisinde yer
almaktadır. Vestel’in ürettiği ürünlerin endüstri kodları Tablo 1’de gösterilmiştir.
Aşağıda da hangi ürünün hangi kategori altında yer aldığı verilmektedir.
Endüstri Grubu 363: Ev Aletleri
o 3631: Ev Pişirme Ekipmanı: Konveksiyon fırını, portatif olanlar da dahil, ve
mikrodalga fırınlar.
o 3632: Ev Buzdolapları, Ev ve Çiftlik Dondurucuları: Buzdolapları ve
Dondurucular
o 3633: Ev Çamaşır Ekipmanı: Çamaşır Makineleri ve Kurutmalı-Çamaşır
Makineleri
o 3634: Elektrikli Ev Eşyaları ve Fanlar: Karıştırıcılar, Kahve Makineleri, Saç
Maşaları, Kurutucular, Fanlar, Yemek Mikserleri, Ütüler, Meyve Sıkacakları,
Portatif Fırınlar, Çay Kettleları, Tost Makineler, (KEA kategorisindeki ürünlerin
çoğu bu kategori altında yer almaktadır)
o 3635: Ev Elektrikli Süpürgeleri: Elektrikli Süpürgeleri
o 3639: Ev Aletleri, Sınıflandırılmamış: Bulaşık Makineleri
Endüstri Grubu 364: Elektrikli Aydınlatma ve Kablaj
o 3641: Elektrik Ampulleri ve Borular: Ampuller
o 3645: Meskun Yerler için Aydınlatma Araçları: Aydınlatma Aksesuarları
Endüstri Grubu 365: Ev içi Ses ve Görsel Ekipman Düzenekleri
o 3651: Ev içi Ses ve Görsel Ekipman Düzenekleri: Televizyon Reseptörleri, Ses
Sistemleri
Endüstri Grubu 366: İletişim Ekipmanı

67
o Radyo veTelevizyon Yayıncılığı ve İletişim Ekipmanları: Televizyon
Monitörleri, Televizyon Verici Antenleri ve Yer Teçhizatı, Kablolu Televizyon
Ekipmanları
Daha önce belirtildiği gibi bilgisayarlar farklı bir ana grup içine girmektedir- aynı
bölüm olsa –Ana Grup 35: Endüstriyel ve Ticari Makineler ve Bilgisayar
Ekipmanı.
Endüstri Grubu 357: Bilgisayar ve Ofi Ekipmanı
o 3571: Elektronik Bilgisayarlar: Kişisel Bilgisayarlar, Bilgisayarlar: Dijital,
Analog ve Hibrid
Bu sınıflandırma Vestel’in bütün üretiminin ve satışının, bilgisayarlar hariç, aynı
bölüm ve aynı ana grup kategorisinde olduğunu göstermektedir. Beyaz Eşya ve
Küçük Ev Aletleri aynı Endüstri Grubu içinde yer almaktayken, Televizyon ve Set-
Üstü Cihazları ise farklı bir Endüstri Grubu’nda yer almaktadır, fakat her iki grup da
aynı Ana Grup’ta altında yer almaktadır. LEDler de ayrı bir endüstri grubunda yer
almaktadır fakat LEDler de yine aynı bölüm ve ana grupta içerisindedir. Daha önce
belirttiğimiz gibi, bilgisayarlar ilgili olmayan ürün çeşitliliğinin bir örneği olup
tamamen ayrı bir ana grup altında sınıflandırılmaktadır – fakat yine de aynı bölüm
içerisindedir.
İşe sadece TV üretimiyle başlayan Vestel, esnek üretim stratejisini, geniş dağıtım
ağını ve verimli maliyet yönetimi stratejisini bir araya getirerek diğer sektörlere
girmeyi başarmıştır. 1994 yılında tv ile üretime başlayan Vestel 1999 yılında
buzdolabı üreterek beyaz eşya alanında faaliyet göstermeye devam etmiştir. Vestel
2000 yılında klima, 2003 yılında çamaşır makinesi, 2005 yılında fırın ve 2007
yılında bulaşık makinesi üretimine geçmiştir. Küçük ev aletleri, süpürge ve
bilgisayarları ise fabrikalarında üretmek yerine dışarıdan tedarik etmeyi seçmiştir.
Bilgisayar dışında bütün ürün grupları ilgili üründür. Tek ilgisiz ürün olan bilgisayar
grubu ise Vestel’İn başarısız olduğu sektör olmuştur. Vestel’in ürün çeşitliliğinin
karlılığı üzerine etkilerini incelemek adına bu çalışmada, 1994 birinci çeyrekten
2014 ikinci çeyreğe kadar olan veriler kullanılmıştır. Vestel’e ait olan data Vestel
Hukuk, Finans, Planlama ve Bütçe ve Stratejik Araştırma ve Geliştirme
departmanlarından toplanmış olup toplamda 82 çeyreğe ait data ile dengesiz panel
veri çalışması yapılmıştır. Tablo 10’da belirtilen veriler kullanılmış olup çalışmada
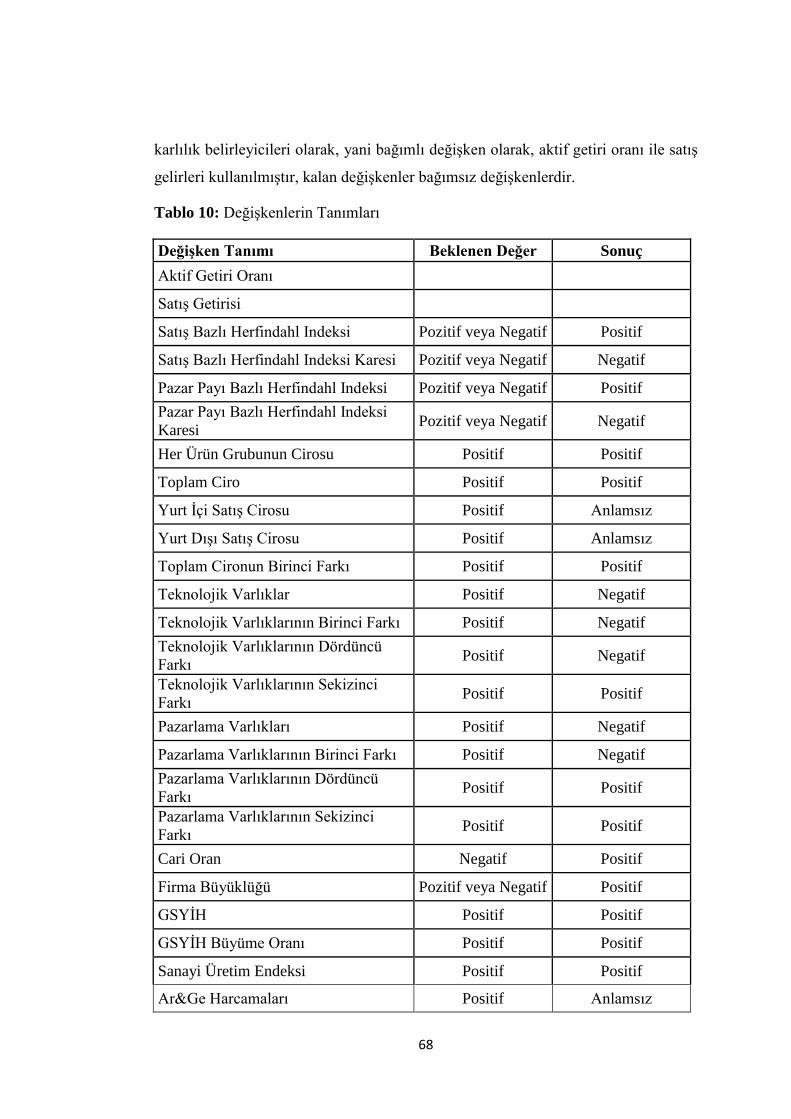
68
karlılık belirleyicileri olarak, yani bağımlı değişken olarak, aktif getiri oranı ile satış
gelirleri kullanılmıştır, kalan değişkenler bağımsız değişkenlerdir.
Tablo 10: Değişkenlerin Tanımları
Değişken Tanımı Beklenen Değer Sonuç
Aktif Getiri Oranı
Satış Getirisi
Satış Bazlı Herfindahl Indeksi Pozitif veya Negatif Positif
Satış Bazlı Herfindahl Indeksi Karesi Pozitif veya Negatif Negatif
Pazar Payı Bazlı Herfindahl Indeksi Pozitif veya Negatif Positif
Pazar Payı Bazlı Herfindahl Indeksi
Karesi Pozitif veya Negatif Negatif
Her Ürün Grubunun Cirosu Positif Positif
Toplam Ciro Positif Positif
Yurt İçi Satış Cirosu Positif Anlamsız
Yurt Dışı Satış Cirosu Positif Anlamsız
Toplam Cironun Birinci Farkı Positif Positif
Teknolojik Varlıklar Positif Negatif
Teknolojik Varlıklarının Birinci Farkı Positif Negatif
Teknolojik Varlıklarının Dördüncü
Farkı Positif Negatif
Teknolojik Varlıklarının Sekizinci
Farkı Positif Positif
Pazarlama Varlıkları Positif Negatif
Pazarlama Varlıklarının Birinci Farkı Positif Negatif
Pazarlama Varlıklarının Dördüncü
Farkı Positif Positif
Pazarlama Varlıklarının Sekizinci
Farkı Positif Positif
Cari Oran Negatif Positif
Firma Büyüklüğü Pozitif veya Negatif Positif
GSYİH Positif Positif
GSYİH Büyüme Oranı Positif Positif
Sanayi Üretim Endeksi Positif Positif
Ar&Ge Harcamaları Positif Anlamsız
69
Dengesiz panel veri analizi sonucunda toplam ciro artışı ve her bir ürün gamının ayrı
ayrı cirosunun da artması ile firmanın karlılığı artmaktadır. Tv ürün grubunun
karlılığının düşük olmasından yola çıkarak Vestel’in ürün gamlarında ciro
arttırmasının karlılığı arttırdığı ortaya çıkmaktadır. Yurt içi ve yurt dışı satışlar ayrı
ayrı analiz edildiğinde anlamlı bir sonuç elde edilmemiştir. Cari oran firmanın elinde
tuttuğu likiditeyi göstermektedir. Elinde likit tutmak yatırımın fırsat maliyeti
olduğundan cari oranın karlılık ile negatif bir ilişkiye sahip olması beklenmesine
rağmen cari oran ve karlılık arasındaki ilişki pozitif çıkmıştır. Beklenildiği gibi
firma büyüklüğünün artışı karlılığı pozitif yönde etkilemektedir. Bu sonuçlar
göstermektedir ki ürün çeşitliliği stratejisi ile Vestel büyümekte ve büyüyerek
karlılığını arttırmaktadır.
Teknolojik varlıklar (Ar&Ge yatırımlarının toplam varlıklara oranı) ve pazarlama
varlıkları (pazarlama yatırımlarının toplam varlıklara oranı) harca firmanın maddi
olmayan varlıklarıdır. Bu varlıklar uzun vadeli yatırımlar ve firmaların en önemli
kaynaklarıdır, kısa vadede karlılığı olumsuz etkilerken uzun vadede karlılığı
arttırmaktadır Mork and Yeung (1991). Panel veri analizine göre teknolojik
varlıklar, birinci ve dördüncü farkları firma karlılığı ile negatif ilişkiye sahipken,
teknolojik varlıkların sekizinci farkı karlılığı pozitif yönde etkilemektedir.
Pazarlama varlıkları ve birinci farkı karlılığı negatif yönde etkilerken, dördüncü ve
sekizinci farkı ile karlılık arasında pozitif bir ilişki bulunmuştur. Bu durum
göstermektedir ki firmanın maddi olmayan varlıklara yaptığı yatırımlar uzun vadede
pozitif getiri sağlamaktadır.
GSYİH ve sanayi üretim endeksleri ülke ekonomisinin göstergesi olup, sonuçlara
göre firmanın karlılığını pozitif yönde etkilemektedir, yani firma sadece ürün
çeşitliliği stratejisi ile büyümemekte aynı zamanda ülke ekonomisinden de
etkilenmektedir. Ülke ekonomisinin büyümesi firmanın karlılığını arttırmaktadır.
Satış bazlı Herfindahl İndeksi ve pazar payı bazlı Herfindahl İndeksi ürün
çeşitliliğinin seviyesini ölçmek için kullanılmış olup, non-lineer ilişkiyi görmek için
satış bazlı Herfindahl İndeksinin karesi ve pazar payı bazlı Herfindahl İndeksinin
karesi ise kullanılmıştır. Çıkan sonuçlara göre ürün çeşitliliği ve karlılık arasında U-
70
şeklinde bir ilişki tespit edilmiştir. Bu sonuca göre kısa vadede ürün çeşitliliği
arttıkça karlılık düşmekte ancak uzun vadede ürün çeşitliliği seviyesi arttıkça karlılık
artmaktadır. Bu sonuç önceki bulgularla da uyum sağlamaktadır. Firma ürün
çeşitliliğini arttırırken pazarlama ve teknolojik varlıklarına yatırımı arttırmak
zorundadır. Bu yatırımlar da uzun vadede firmaya karlılık artışı sağladıklarından
kısa vadede karlılığın düşmesi, öğrenme sürecinden ve başlangıç maliyetlerinin
yüksek olmasından kaynaklanmaktadır. Vestel firması incelendiğinde ilişkili ürün
stratejisini sürdürdüğü ortaya çıkmaktadır. İlgisiz ürün gamında sadece bilgisayar
bulunmakta olup, bilgisayar cirosu yıllar içerisinde düşüş göstermiştir. İlgili ürün
gamında bulunan ürünlerin cirosu ise yıllar içerisinde artış göstermekte olup,
cirolarındaki artış karlılığı pozitif yönde etkilemiştir.
Sonuç olarak Vestel ilgili ürün stratejisinde uzun vadede başarılı olup karlılığını
arttırmıştır. Kısa vadede ise, yatırım maliyetlerinin getiriden yüksek olması sebebi
ile yeni ürün gruplarında faaliyet göstermek firmanın karlılığını düşürmektedir.
Dünyada tüketici elektroniği alanında faaliyet gösteren LG, Samsung, Bosh ve
Türkiye’de faaliyet gösteren en büyük iki firma Vestel ve Arçelik ürün çeşitliliği
stratejisini seçmektedirler. Vestel 2015 yılında LG ve Samsung gibi cep telefonu ve
tablet ürün gamında da faaliyet göstermeye başlamıştır. Cep telefonu ve tabletler
ilgisiz ürün çeşitliliği sınıfına girmektedir. Geçmişte Vestel’in ilgisiz ürün olan
bilgisayar alanında başarısızlığı ve rakiplerin ilgisiz ürün stratejisindeki başarıları
göz önüne alındığında aradaki farkın yatırım konusunda gelen destekler olduğu
ortaya çıkmaktadır. Kore firmaları olan LG ve Samsung devlet desteği ile
yatırımlarını büyütmüş, ilgili ve ilgisiz ürün çeşitliliği stratejilerinde başarılı
olmuşlardır. Firmaların başlangıç maliyetleri ile baş edebilmeleri için Türk hükümeti
de Kore örneğinde olduğu gibi hedef sanayi belirlemeli, teknolojik yo haritası çizip
bu doğrultuda büyüyen firmaları ve sektörleri desteklemelidir.

71
APPENDIX C : TEZ FOTOKOPİSİ İZİN FORMU
ENSTİTÜ
Fen Bilimleri Enstitüsü
Sosyal Bilimler Enstitüsü
Uygulamalı Matematik Enstitüsü
Enformatik Enstitüsü
Deniz Bilimleri Enstitüsü
YAZARIN
Soyadı : Akgül
Adı : Banu
Bölümü : İktisat
TEZİN ADI (İngilizce) : Product Diversification and Profitability A Case Study:
Vestel A.Ş.
TEZİN TÜRÜ : Yüksek Lisans Doktora
1. Tezimin tamamından kaynak gösterilmek şartıyla fotokopi alınabilir.
2. Tezimin içindekiler sayfası, özet, indeks sayfalarından ve/veya bir
bölümünden kaynak gösterilmek şartıyla fotokopi alınabilir.
3. Tezimden bir (1) yıl süreyle fotokopi alınamaz.
TEZİN KÜTÜPHANEYE TESLİM TARİHİ:


