Presented by:
Capital SouthEast Connector Joint Powers Authority
Tom ZlotkowskiExecutive DirectorJuly 17, 2014
Presentation for Presentation for

Connector Update - July, 2014Connector Update - July, 2014
Location and General Information
Project Description and History
Project Implementation and Phasing
Recent Activity and Accomplishments
Anticipated Next Steps
Scheduled Segment Milestones
Opportunities and Challenges

Project LocationProject Location
Selection of General Alignment
Elk Grove
Folsom
El Dorado County
Rancho Cordova Sacramento
County
Alignment Kammerer/Grant Line/White Rock Roads
Kammerer
Gra
nt Lin
e
White Rock
Length: 33.41 miles
Width: 4 to 6 lanes
Signals: 25 + -
Interchanges: 10
Speed Limit: 40-55 MPH
Sidewalk/Trail: Continuous
JPA SouthEast Connector:
From I-5 south of Elk Grove (Hood Franklin Road) through Rancho Cordova to Highway 50 in El Dorado County, just east of El Dorado Hills (Silva Valley Parkway
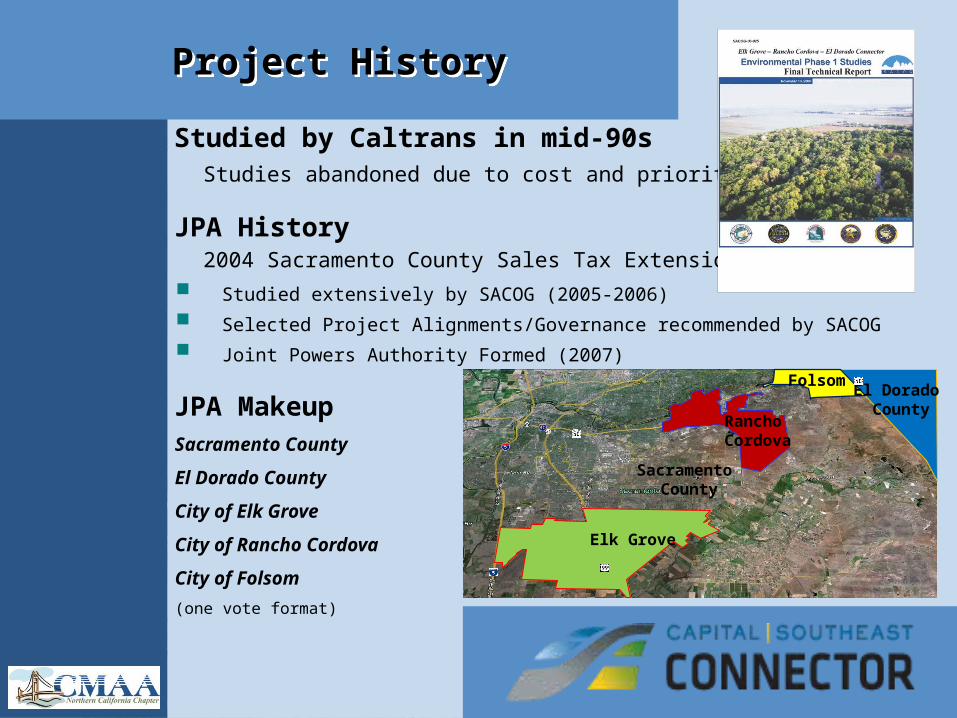
Project HistoryProject History
Studied by Caltrans in mid-90s Studies abandoned due to cost and priorities
JPA History 2004 Sacramento County Sales Tax Extension
Studied extensively by SACOG (2005-2006)
Selected Project Alignments/Governance recommended by SACOG
Joint Powers Authority Formed (2007)
JPA MakeupSacramento County
El Dorado County
City of Elk Grove
City of Rancho Cordova
City of Folsom
(one vote format)
Selection of General Alignment
Elk Grove
FolsomEl Dorado
CountyRancho Cordova
Sacramento County

Activities of Significance Activities of Significance
2011 Certification of PEIR and Selection of Preferred Alignment (Amended and Re-certified March, 2012)
2012 Economic Impact Analysis (December, 2012)
2012/2013 Design Guidelines and Committee Work (initial adoption, March, 2013; Rev. 3.0 Nov. 2013)
2013 Initial Draft Plan of Finance (Initial adoption, March, 2013; Rev. 2.0 Jan. 2014)
2013 Design-Build Legislation AB 401 (September 2013)
2014 Environmental Phasing Strategy (May 2014)
2014 Sacramento County General Plan Amendment (May 2014)
Programmatic Environmental Impact Report
Programmatic Environmental Impact Report

Programmatic Environmental Impact Report
Programmatic Environmental Impact Report
SACOG Phase 1 Study
(November 2006)
Pre-scoping (2008-2010)
Public Input Opportunity
Notice of Preparation (February 2010)
Public Input Opportunity
Scoping Meetings(February/March 2010)
Public Input Opportunity
Technical Studies
Draft EIR Circulated (March –May, 2011)
Public Input Opportunity
Final EIR/responses to comments (Minimum 10
days) (Aug/September 2011)
Public Input Opportunity
Final PEIR Public Hearings and
Certification (2011)
Public Input Opportunity
Board adoption of Corridor Alignment
Notice of Determination
JPA Member Agencies amend General Plans to
align with adopted corridor
Project Level Environmental Analysis
Begin
PEIR Certified March 2012 Selection of General Alignment Identification of Mitigation Measures Adoption of MMRP ECOS settlement agreement on legal
challenge Current Related Activities Explore
Mitigation Strategies through SSHCP
Complete General Plan Amendments
Project Level Environmental Documents
NEPA Determination

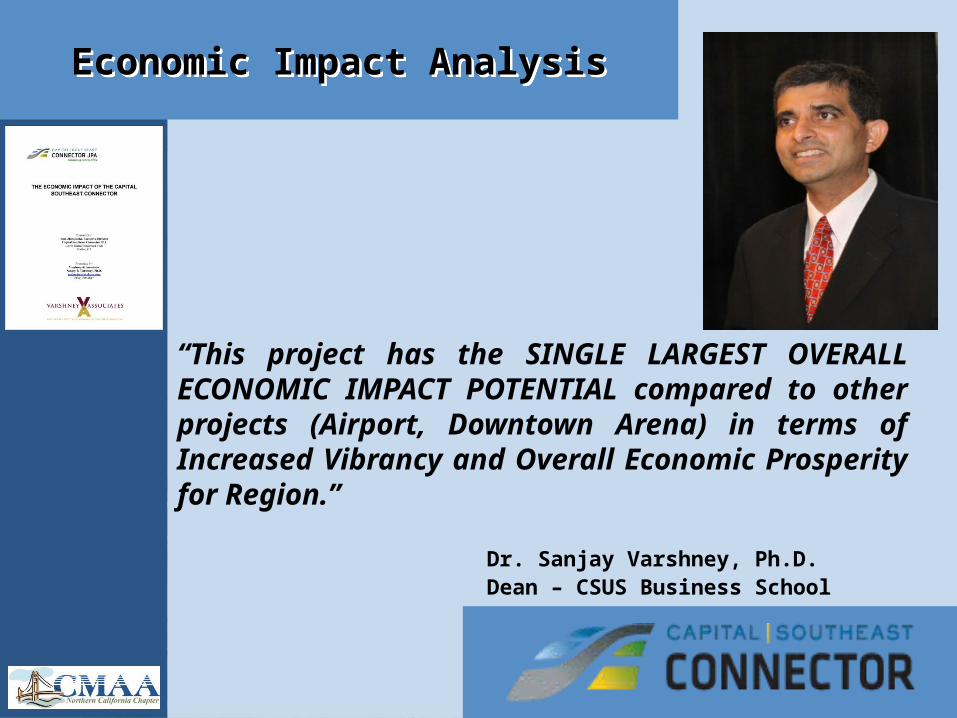
Economic Impact AnalysisEconomic Impact Analysis
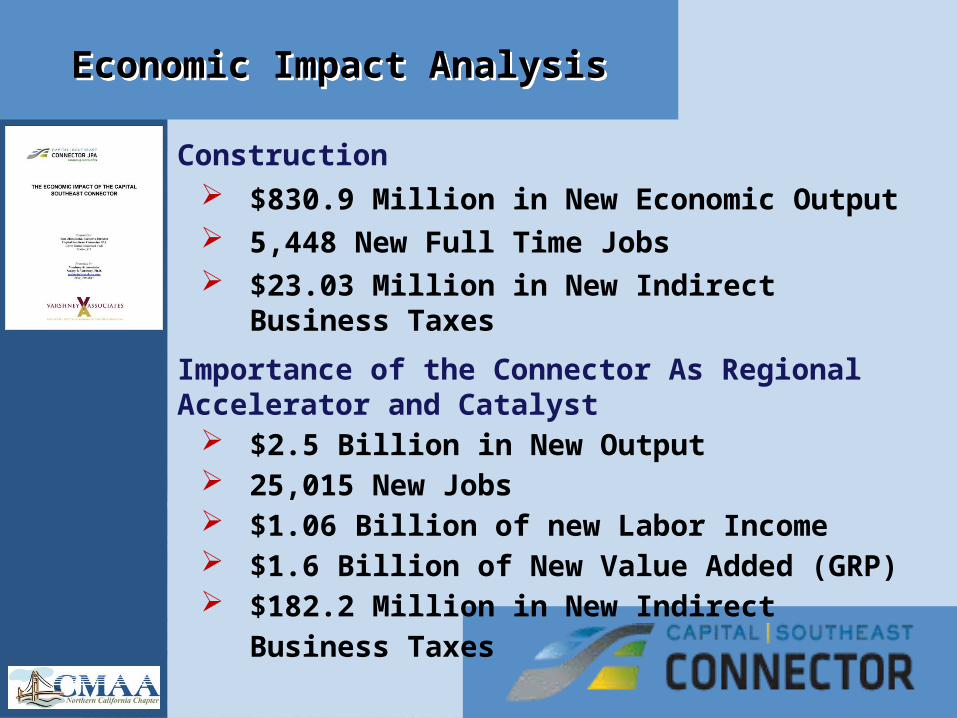
Economic Impact AnalysisEconomic Impact Analysis
Construction $830.9 Million in New Economic Output 5,448 New Full Time Jobs $23.03 Million in New Indirect Business
Taxes
Importance of the Connector As Regional Accelerator and Catalyst
$2.5 Billion in New Output 25,015 New Jobs $1.06 Billion of new Labor Income $1.6 Billion of New Value Added (GRP) $182.2 Million in New Indirect Business
Taxes
Economic Impact AnalysisEconomic Impact Analysis
“This project has the SINGLE LARGEST OVERALL ECONOMIC IMPACT POTENTIAL compared to other projects (Airport, Downtown Arena) in terms of Increased Vibrancy and Overall Economic Prosperity for Region.”
Dr. Sanjay Varshney, Ph.D. Dean – CSUS Business
School

Project Design GuidelinesProject Design Guidelines

12
JPA Board
PDTProject Team TAC
SCC
SAC
Inpu
t
Ensures the Connector has the following characteristics:
Uniform in character, appearance, and blends with communities
Effectively located access to maximize efficiency of the corridor
Integrated modes of travel Well-coordinated, efficient traffic operations Implements sustainable solutions Maintains integrity of regional transportation
systems Cost-effective implementation of the project
Project DesignGuidelines
Project DesignGuidelines
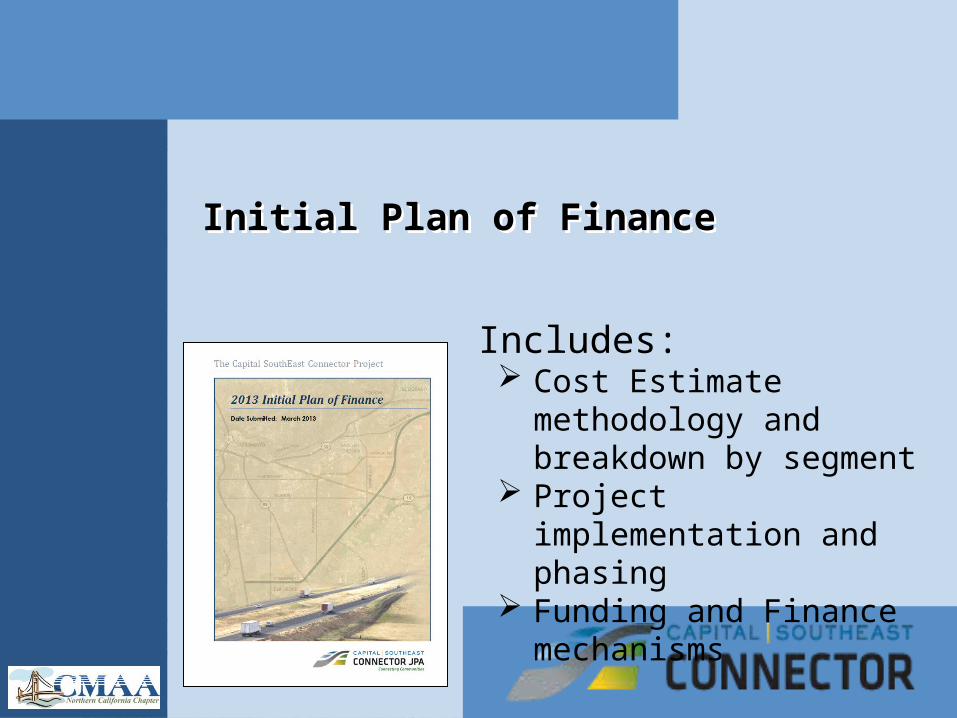
Initial Plan of FinanceInitial Plan of Finance
Includes: Cost Estimate
methodology and breakdown by segment
Project implementation and phasing
Funding and Finance mechanisms
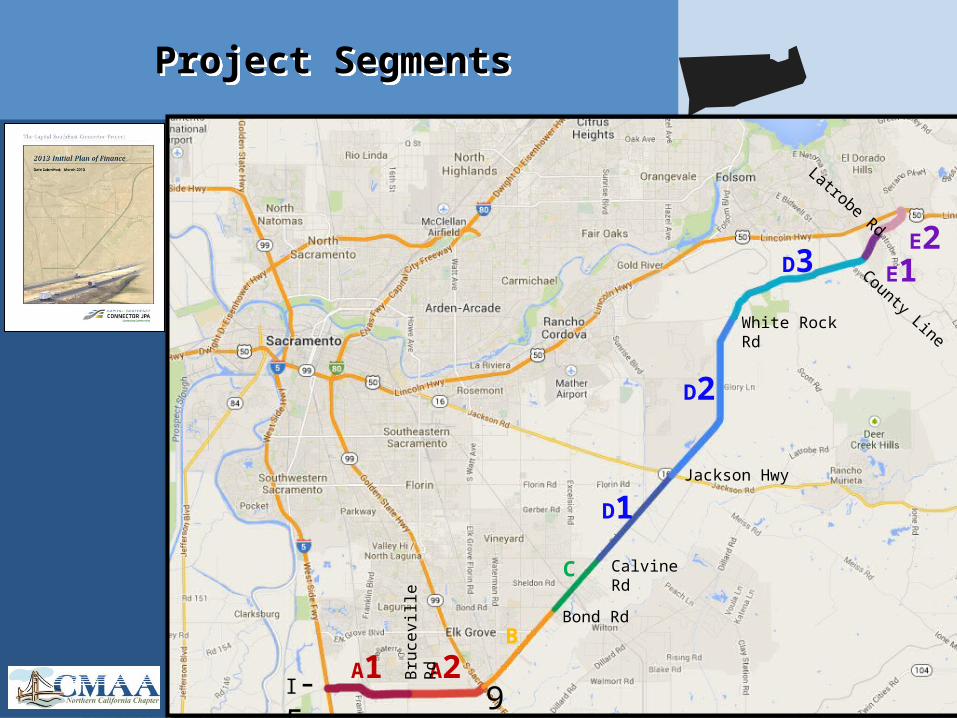
SEGMENT DESCRIPTION
A
4 laneexpressway, on Kammerer Rd from the I-5/Hood Franklin IC to Bruceville Rd & 6 lane Thoroughfare from Bruceville Rd to SR99
B4 to 6 lane thoroughfare, from SR 99 to Bond Rd
C4 lane roadway, on Grant Line Rd from Bond Rd to Calvine Rd (Sheldon Area)
D4 to 6 lane expressway, on Grant Line/White Rock Rd from Calvine Rd to the Sacramento‐El Dorado County line
E4 to 6 lane thoroughfare, on White Rock Rd from the County line to US 50/Silva Valley Pkwy IC
Project SegmentsProject Segments
A1 A2B
C
D1
D2
D3 E1E2
Bru
cevill
e
Rd
Bond Rd
Calvine Rd
Jackson Hwy
White Rock Rd
Latrobe Rd
99
I-5
County Line

5 Major Categories Used
(Project Delivery, ROW, ROW Administration, Environmental, Construction)
Project Cost EstimatesCost Estimate Methodology
Project Cost EstimatesCost Estimate Methodology
Major Segment Roadway Segment
Total Project Cost Estimate % of Total
A I-5 to State Route 99 $ 76,194,000 17%
B State Route 99 to Bond Road $ 56,746,000 12%
C Bond Road to Calvine Road $ 25,471,000 6%
D Calvine Road to El Dorado County Line $275,635,000 60%
EEl Dorado County Line to US-50/Silva Valley Parkway $ 22,354,000 5%
456,400,000$ 100%
Project Delivery Costs; 14%
Right-of-Way; 6%
Right-of-Way Administration;
1%
Environmental Mitigation; 5%
Construction (includes sus-
tainability), 62%
Construction Con-tingency; 12% Consistent with Project
PEIR
Project Delivery Method: Design-Build/CMGC/?
Broken Down by Segment

Project Segmentation: Smaller Sub-Segments for flexibility - A1, A2, B,
C, D1, D2…
Two–Phased Approach:Phase 1: Construct “Backbone Facility” - capacity for between five to fifteen years
Phase 2: Finish corridor for full buildout – six lane segments, interchange conversions
Project Implementation and Phasing
Project Implementation and Phasing
Major Segment Segment Roadway Segment
Phase 1 Cost Estimate
Phase 2 Cost Estimate Total Costs
A1 I-5 to Bruceville Road $ 44,444,304 $ 1,553,552 $ 45,997,856
A2 Bruceville Road to State Route 99 $ 24,099,838 $ 6,096,544 $ 30,196,382
B B State Route 99 to Bond Road $ 45,850,190 $ 10,896,296 $ 56,746,486
C C Bond Road to Calvine Road $ 24,810,822 $ 660,000 $ 25,470,822
D1 Calvine Road to Jackson Road $ 35,384,781 $ 15,336,192 $ 50,720,973
D2Jackson Road to White Rock/Grant Line Road $ 45,450,559 $ 61,139,733 $106,590,292
D3White Rock/Grant Line Road to Sacramento/El Dorado County Line $ 69,371,880 $ 48,951,704 $118,323,584
E1 El Dorado County Line to Latrobe $ 10,653,793 $ - $ 10,653,793
E2 Latrobe to US-50/Silva Valley Parkway $ 11,700,235 $ - $ 11,700,235
311,766,403$ 144,634,021$ 456,400,424$
A
D
E

Connector JPA Measure A Funds - $118.0M
Federal and State Regional Funds - $136.9M
Member Jurisdiction Developer Fees - $197.0M
Fair Share Contributions - $23.8M
Member Jurisdiction Direct Contributions - $2.3M
Potential Revenue Sources - $80M
Funding and Finance Mechanisms
Measure A; $118.00
Fed/State; $136.90
Dev. Fees; $197.00
Other Contribu-tions ; $23.80
Member Direct; $2.30
Potential; $80.00
Measure A Fed/State Dev. Fees
Other Contributions Member Direct Potential

Anticipated next stepsAnticipated next steps
Discussion, Development, and Execution of Reciprocal Use and Funding Agreements to Address: Funding contributions Timing and Sequencing of segment
construction Future access requests Overall JPA authority
Refine Alignment Right of Way Assessment and
Acquisition Further Technical Development

Schedule for segment milestones
Schedule for segment milestones
Segment
Segment A Kammerer Road
Segment D2Jackson to White Rock Road
Segment D3Prairie City to County Line
Segment ECounty Line to Latrobe
Schedule
Dec 2015 – certify NEPA document
Winter 2014 – Initiate PA/ED process: NEPA/CEQA
Fall 2014 – Initiate PA/ED process: CEQA
2014/2015 – Initiate PA/ED process w/ D3

Opportunities and ChallengesOpportunities and Challenges
Opportunities Stated project transportation benefits
Economic growth potential – Jobs!!
Provides opportunities for other necessary infrastructure
Single largest local road project in region will raise capabilities and capacities
Improved jurisdictional relations amongst members
Introduce design-build as procurement option

Opportunities and ChallengesOpportunities and Challenges
Challenges Stakeholder Outreach and education
Jurisdictional sovereignty and policy sensitivity
California enviro-political climate
Project “Champion” vacancy
Financing capacity and construction cash flow
Competing local government priorities
Lack of perceived “immediacy of need”
Advocacy deficiency
QuestionsQuestions
www.connectorjpa.net


