
Q2 Special Guest Contributor: David Arthur, Brookfield Asset Management
The Preqin Quarterly Update
Insight on the quarter from the leading provider of alternative assets data
alternative assets. intelligent data.
Private Equity
Plus, Special Guest Contributor: Clay Deniger, Capstone Partners
Q2 2013 JULY 2013
Content Includes....
FundraisingWe review the latest fundraising figures, including funds which exceeded their target size and the largest funds closed in the
quarter.
InvestorsWe look at investor appetite for private equity and the challenges investors are currently facing.
Buyout DealsWe analyze private equity buyout deals and exits in Q2 2013 and look at the largest deals in the quarter.
Venture Capital DealsWe examine venture capital deal activity in Q2 2013 by value, region and stage.
PerformanceWe provide the latest private equity performance data, including dry powder figures, IRRs and the PrEQIn Private Equity Quarterly Index.
SecondariesWe take a look at which institutions are looking to buy and sell fund interests on the secondary market.
2
The Preqin Quarterly Update: Private Equity, Q2 2013
© 2013 Preqin Ltd. / www.preqin.com
Download the data pack at:www.preqin.com/quarterlyupdate
All rights reserved. The entire contents of The Preqin Quarterly Update: Private Equity, Q2 2013 are the Copyright of Preqin Ltd. No part of this publication or any information contained in it may be copied, transmitted by any electronic means, or stored in any electronic or other data storage medium, or printed or published in any document, report or publication, without the express prior written approval of Preqin Ltd. The information presented in The Preqin Quarterly Update: Private Equity, Q2 2013 is for information purposes only and does not constitute and should not be construed as a solicitation or other offer, or recommendation to acquire or dispose of any investment or to engage in any other transaction, or as advice of any nature whatsoever. If the reader seeks advice rather than information then he should seek an independent fi nancial advisor and hereby agrees that he will not hold Preqin Ltd. responsible in law or equity for any decisions of whatever nature the reader makes or refrains from making following its use of The Preqin Quarterly Update: Private Equity, Q2 2013.
While reasonable efforts have been made to obtain information from sources that are believed to be accurate, and to confi rm the accuracy of such information wherever possible, Preqin Ltd. does not make any representation or warrantythat the information or opinions contained in The Preqin Quarterly Update: Private Equity, Q2 2013 are accurate, reliable, up-to-date or complete.
Although every reasonable effort has been made to ensure the accuracy of this publication Preqin Ltd. does not accept any responsibility for any errors or omissions within The Preqin Quarterly Update: Private Equity, Q2 2013 or for any expense or other loss alleged to have arisen in any way with a reader’s use of this publication.
Contents
Foreword
Q2 2013 was the strongest private equity fundraising quarter since Q4 2008, with an aggregate $124bn raised by 164 funds that held a fi nal close in the quarter. However, the actual number of funds closed in Q2 is the lowest quarterly number since 2005, which demonstrates that investors are committing capital to the more established fund managers that are raising larger funds. Investors have been active during H1 2013, with 57% of investors interviewed by Preqin indicating that they have already made new commitments to private equity funds so far in 2013, while a signifi cant 85% of LPs plan to increase or maintain their allocation to the asset class over the longer term.
Over H1 2013, the value of dry powder held by private equity funds increased to $991bn, following a decrease over 2012. Long-term performance continues to attract LPs to the asset class; private equity horizon IRR data shows that over the longer horizon periods of three, fi ve and 10 years, private equity outperforms the S&P 500, MSCI Europe and MSCI Emerging Markets Indices.
Private equity-backed buyout deal fl ow was down in the second quarter, with 622 deals announced globally totalling $62bn, compared to 678 deals in Q1 2013 valued at $86bn; however, there was an increase in the number and aggregate value of private equity-backed buyout exits compared to the previous quarter. Q2 2013 saw one of the highest quarterly aggregate exit values since 2006, with an aggregate value of $93bn. Venture capital fi nancings were at a high level, with 1,330 fi nancings announced globally at an aggregate $10.6bn, which is the highest quarterly value of fi nancings since Q2 2012.
Preqin’s Private Equity Online services generate the data points behind these reports, offering a wealth of individual fi rm and fund-level data, which is gathered through Preqin’s direct contact with industry professionals from across the globe. We hope you fi nd this report useful, and welcome any feedback you may have. For more information, please visit www.preqin.com or contact [email protected].
Interview with Clay Deniger - Capstone Partners
Fundraising in Q2 2013
p3.
p5.
Institutional Investors in Private Equity p7.
Buyout Deals p8.
Venture Capital Deals p9.
Fund Performance
Secondaries
p10.
p11.
2013 Preqin Investor Network Global Alternatives Report
The 2013 Preqin Investor Network Global Alternatives Report is the most comprehensive review of the alternatives industry aimed exclusively at institutional investors ever undertaken. The report covers a wide range of topics, including asset allocation, fund selection and due diligence.
The 105-page 2013 Preqin Investor Network Global Alternatives Report is freely accessible on Preqin’s website.
To download a digital copy of the Report, please visit:
www.preqin.com/PIN2013
3
The Preqin Quarterly Update: Private Equity, Q2 2013
© 2013 Preqin Ltd. / www.preqin.com
Download the data pack at:www.preqin.com/quarterlyupdate
Interview with Clay Deniger
Capstone Partners
What is your current perspective on the fundraising environment?
The fundraising market remains diffi cult, and I think for the near term it will continue to present challenges. There was a tremendous bottleneck of 2005, 2006 and 2007 vintage funds that otherwise would have been back in the market, but took longer to right their portfolios coming out of the fi nancial crisis. So 2012 was a particularly heavy re-up year, which has lightened in 2013. We would expect 2014 to be similar in terms of normalized re-up levels, which is obviously good news for GPs who should fi nd themselves in a less crowded market relative to 2012. That said, it remains tough and today we consistently see binary outcomes in the fundraising world. It is a tale of two timelines. Those GPs who are highly sought after, who have a compelling story, and who can generate momentum in their fundraising early, tend to be in market for three to six months. Those GPs who have to fi ght harder and scratch and claw to generate momentum fi nd themselves in market for 12-18 months or longer. This clearly puts focus and importance on coming to market at the right time with a clear strategy and portfolios in the best shape possible for generating fundraising momentum.
The fi rst half of 2013 has produced good fundraising numbers. Do you expect that to continue throughout the rest of the year?
We expect 2013 to be a strong year and even to carry over into 2014, which is positive news for those managers currently fundraising. While we expect the fl ow of dollars and commitments to be strong through the end of the year, many of those Q3/Q4 commitments are already spoken for today in re-ups or soft circles. A GP needs to keep that in mind when thinking about chasing commitments in the second half of this year or any calendar year.
What strategies are LPs viewing most favourably at present?
In general, LP portfolios in the US and Europe are mature and stable and not many LPs are looking to dramatically change how their portfolios are constructed, so it is much more about fi ne-tuning around the edges. Within the category of fi ne-tuning, we are seeing a few things. While large cap buyouts will always be a critical part of any portfolio, there is a general move of some dollars (or Euros) out of large cap and mega buyouts and into the middle market based on the belief that more ineffi ciencies exist at the smaller end of the buyout world. Geographically, for North American investors, we are seeing an opportunistic move into Europe, both through equity and credit strategies. In recent years, North American LPs have been largely on the sidelines in relation to Europe, waiting for things to settle a bit and to develop
their own strategies around playing the macro challenges in Europe. We are seeing the interest in European funds materialize into commitments this year and expect that trend to continue.
How do LPs view the asset class compared to prior years?
LPs’ macro view of the asset class largely comes from the success of the underlying portfolios and sponsors that they manage. The fact that GPs are returning capital means we are seeing more investments go cash-to-cash and LP commitments are being returned. LPs are enjoying gains on those commitments, which then primes the pump for them to make new commitments this year and in coming years. The liquidity that exists, particularly from North American managers, is helping to support continued enthusiasm for the asset class.
Competition for LP commitments is still tough. What is critical for a GP to do to be successful? The prerequisites for successful fundraising remain the same: strong and experienced teams; a repeatable, sustainable strategy; and a well-articulated, underlying track record that demonstrates successful execution of that strategy – in this respect, fundraising is no different than in prior years. We advise clients that the most important thing in driving a successful fundraise outside of these prerequisites is giving LPs a reason to act. Their allocations are so tight and their calendars so full that unless they have a reason to focus on the underwriting of your fund, as a GP, you just won’t be able to grab the mindshare that is required to obtain commitments. For the most successful GPs, that call to action comes from scarcity value and momentum during a fundraise. This is certainly the best case for a GP - having an LP focus on your fund because they run the risk of missing it. For many other managers that have some of the prerequisites but perhaps not the necessary momentum, we increasingly see the need to offer LPs a special reason to act. Whether that is preferred economics for committing early in a fundraise or access to co-investments on a reduced or no fee basis, offering motivation beyond the typical fundraising tools is an important part of what a GP needs to do to generate momentum that is essential to drive successful closes.
What do fi rst-time managers without a track record need to do to be successful in fundraising?
Without a track record, we advise GPs to fi nd some other connection point with an LP that makes them comfortable that a strategy will be successful. That connection usually comes from the manager’s existing relationships, whatever those may be - whether they are friends and family or investors that backed them at a previous fi rm. Both cold starts and developing new

4
The Preqin Quarterly Update: Private Equity, Q2 2013
© 2013 Preqin Ltd. / www.preqin.com
Download the data pack at:www.preqin.com/quarterlyupdate
relationships without a track record are extremely diffi cult to accomplish. Getting the backing of previous investors and close relationships or investing in deals with other managers to build out a track record is critical, so that when you do come to market you have a track record that offers some level of proof of concept for the stated strategy.
What benefi t have you seen in GPs informally talking to LPs between fundraises?
We regularly advocate to GPs that marketing between funds is no longer an option; it really is a prerequisite. Back to the crowded nature of an LP’s portfolio and the pressure on re-ups, if the only time you are having discussions with LPs is when you are asking for new commitments or attending an AGM, you have missed the opportunity to deepen the relationship and increase the likelihood of a re-up or new commitment. Re-ups are not automatic as they once were, so taking the time to both nurture existing LP relationships and advance discussions with targeted new LPs between fundraises is a critical function. This is true not just for large fi rms with IR departments but also for mid-market fi rms and for smaller funds as well. For some smaller funds it can be even more important, as they may have a less prominent position in the investor’s portfolio, so deepening existing LP relationships is particularly crucial. We also encourage GPs to see priority prospective investors several times a year to ensure they are on forward investment calendars so that the LP is tracking the sponsor as much as the sponsor is tracking the LP.
Has the way GPs communicate with LPs changed overall recently?
Yes, I think GPs are getting the message. They recognize that they need to nurture their investor base and give them the same focus and commitment as they do to deal sourcing. Both sides of the business are critical for their ongoing success. You cannot just focus on systematically making investments; you also need to be systematic about ensuring sources of capital are available for the long term, which means treating LPs like partners and communicating regularly.
Do you see any change in terms and conditions?
I wouldn’t say we have seen bright lines or binary changes in terms and conditions. Generally, we have seen downward pressure on fees particularly in the larger cap funds, which is translated as direct pressure on management fees. In smaller funds, fee pressure may be refl ected in LPs looking for alternative ways to deploy lower cost capital, as in reduced or no fee co-investments. Regarding specifi c terms, there remains pressure on deal-by-deal carry and transaction fees in particular, but I would characterize it as pressure, as opposed to “we will or will not support this type of fee structure.” Investors recognize that, even in this market, top GPs are rewarded with premium terms and those that drive scarcity value in a fundraising process continue to command premium fees. Those GPs who must fi ght harder to generate momentum fi nd themselves in a weaker negotiating position and can end up with terms that are less aggressive, particularly in those two areas - the sharing of transaction fees and deal-by-deal carry.
What impact are you seeing on the implementation of the AIFMD?
The main theme today on AIFMD is uncertainty. As the July 22nd deadline approaches, it is still unclear how offshore funds will be able to market to the bulk of European LPs. The cleanest answer is to work hard to close prospective European investors prior to July 22nd, but that advice only applies to cases where an investor is already in advanced diligence. For the broader universe post July 22nd, we advise GPs to be extremely careful and to work closely with counsel, based on the belief that the additional clarifi cation and regulatory infrastructure will start to unfold in the coming months.
Thank you for your time.
Clay Deniger is responsible for North American Operations including project management, transaction structuring, and fi rm operations.
Prior to Capstone, Clay was founder and CEO of Substrate Technologies, Inc. (STI), a venture-backed semiconductor component supplier. At STI, Clay raised capital from strategic and institutional investors on three continents, and ultimately deployed the proceeds for construction of a dedicated manufacturing facility in Shenzhen, China. In 2003, Clay negotiated the sale of STI to a group of China-based investors.
Prior to STI, Clay was founder and CEO of Customer Survey Technologies (CST) a boutique technology research fi rm operating in North America and Europe. Clay raised CST’s critical capital through strategic investors and foreign government backed fi nancings in the US and Europe. In 1998, he sold CST to a domestic competitor.
Clay has written extensively on the subject of technology and tech industry investment. He is a Magna Cum Laude graduate of Hamilton College.
www.capstonepartnerslp.com
5
The Preqin Quarterly Update: Private Equity, Q2 2013
© 2013 Preqin Ltd. / www.preqin.com
Download the data pack at:www.preqin.com/quarterlyupdate
Fundraising in Q2 2013
Fig. 1: Quarterly Global Private Equity Fundraising, Q1 2008 -
Q2 2013
Source: Preqin Funds in Market
307
375
288
438
205203185
328
182
223
189
314
214
253
195
319
211242
206
263
182164173
212
128
171
7895
5984 77 66
79 66 7795
6192 79 91 83
10680
124
0
50
100
150
200
250
300
350
400
450
500
Q1 Q2 Q3 Q4 Q1Q2 Q3 Q4Q1 Q2Q3 Q4 Q1Q2 Q3 Q4 Q1 Q2 Q3 Q4 Q1 Q2
2008 2009 2010 2011 2012 2013
No. of FundsClosed
AggregateCapitalRaised ($bn)
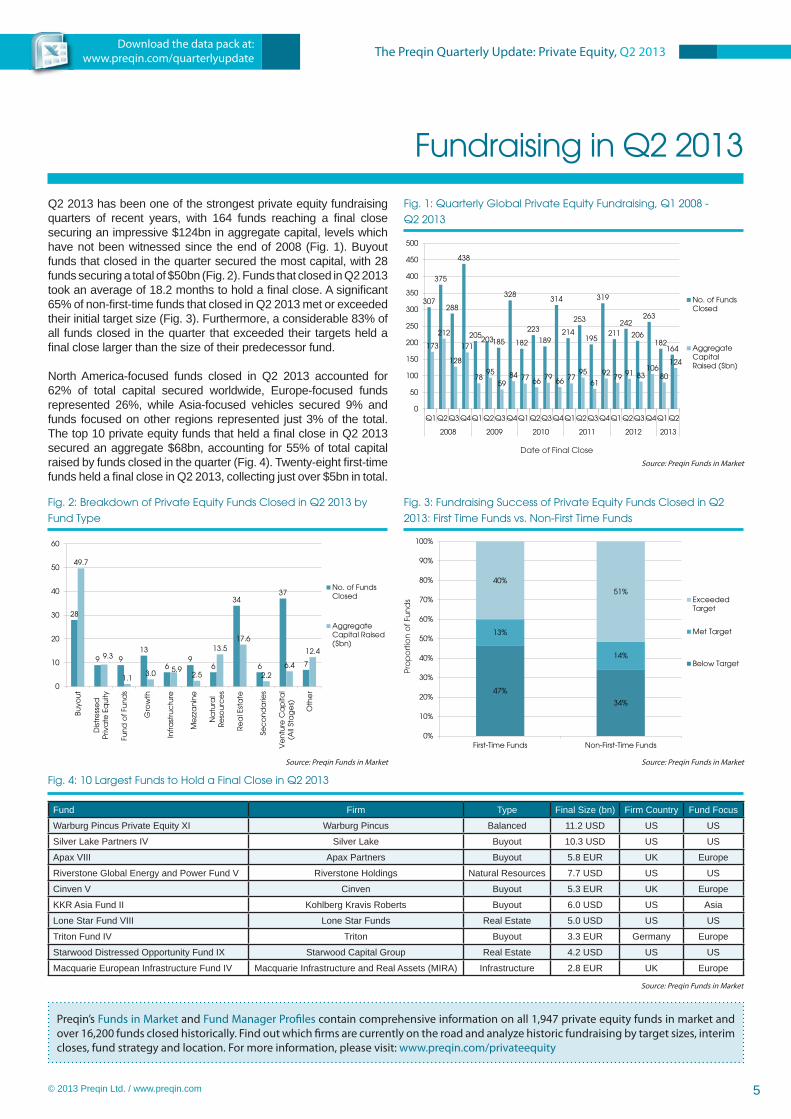
Q2 2013 has been one of the strongest private equity fundraising quarters of recent years, with 164 funds reaching a fi nal close securing an impressive $124bn in aggregate capital, levels which have not been witnessed since the end of 2008 (Fig. 1). Buyout funds that closed in the quarter secured the most capital, with 28 funds securing a total of $50bn (Fig. 2). Funds that closed in Q2 2013 took an average of 18.2 months to hold a fi nal close. A signifi cant 65% of non-fi rst-time funds that closed in Q2 2013 met or exceeded their initial target size (Fig. 3). Furthermore, a considerable 83% of all funds closed in the quarter that exceeded their targets held a fi nal close larger than the size of their predecessor fund.
North America-focused funds closed in Q2 2013 accounted for 62% of total capital secured worldwide, Europe-focused funds represented 26%, while Asia-focused vehicles secured 9% and funds focused on other regions represented just 3% of the total. The top 10 private equity funds that held a fi nal close in Q2 2013 secured an aggregate $68bn, accounting for 55% of total capital raised by funds closed in the quarter (Fig. 4). Twenty-eight fi rst-time funds held a fi nal close in Q2 2013, collecting just over $5bn in total.
Fig. 2: Breakdown of Private Equity Funds Closed in Q2 2013 by
Fund Type
Source: Preqin Funds in Market
28
9 913
69
6
34
6
37
7
49.7
9.3
1.13.0 5.9
2.5
13.517.6
2.26.4
12.4
0
10
20
30
40
50
60
Buyo
ut
Dis
tre
sse
dP
riva
te E
qu
ity
Fun
d o
f Fu
nd
s
Gro
wth
Infr
ast
ruc
ture
Me
zza
nin
e
Na
tura
lR
eso
urc
es
Re
al E
sta
te
Sec
on
da
ries
Ve
ntu
re C
ap
ital
(All
Sta
ge
s)
Oth
er
No. of FundsClosed
AggregateCapital Raised($bn)
Fig. 3: Fundraising Success of Private Equity Funds Closed in Q2
2013: First Time Funds vs. Non-First Time Funds
Source: Preqin Funds in Market
47%
34%
13%
14%
40%
51%
0%
10%
20%
30%
40%
50%
60%
70%
80%
90%
100%
First-Time Funds Non-First-Time Funds
ExceededTarget
Met Target
Below Target
Date of Final Close
Pro
po
rtio
n o
f Fu
nd
s
Fig. 4: 10 Largest Funds to Hold a Final Close in Q2 2013
Fund Firm Type Final Size (bn) Firm Country Fund Focus
Warburg Pincus Private Equity XI Warburg Pincus Balanced 11.2 USD US US
Silver Lake Partners IV Silver Lake Buyout 10.3 USD US US
Apax VIII Apax Partners Buyout 5.8 EUR UK Europe
Riverstone Global Energy and Power Fund V Riverstone Holdings Natural Resources 7.7 USD US US
Cinven V Cinven Buyout 5.3 EUR UK Europe
KKR Asia Fund II Kohlberg Kravis Roberts Buyout 6.0 USD US Asia
Lone Star Fund VIII Lone Star Funds Real Estate 5.0 USD US US
Triton Fund IV Triton Buyout 3.3 EUR Germany Europe
Starwood Distressed Opportunity Fund IX Starwood Capital Group Real Estate 4.2 USD US US
Macquarie European Infrastructure Fund IV Macquarie Infrastructure and Real Assets (MIRA) Infrastructure 2.8 EUR UK Europe
Source: Preqin Funds in Market
Preqin’s Funds in Market and Fund Manager Profi les contain comprehensive information on all 1,947 private equity funds in market and over 16,200 funds closed historically. Find out which fi rms are currently on the road and analyze historic fundraising by target sizes, interim closes, fund strategy and location. For more information, please visit: www.preqin.com/privateequity

7
The Preqin Quarterly Update: Private Equity, Q2 2013
© 2013 Preqin Ltd. / www.preqin.com
Download the data pack at:www.preqin.com/quarterlyupdate
Institutional Investors in Private Equity
Fig. 1: Proportion of LPs That Have Made New Private Equity
Commitments So Far in 2013
Source: Preqin Investor Interviews, June 2013
57%
43%Made NewPrivate EquityCommitments SoFar in 2013
Not Made NewCommitments SoFar in 2013
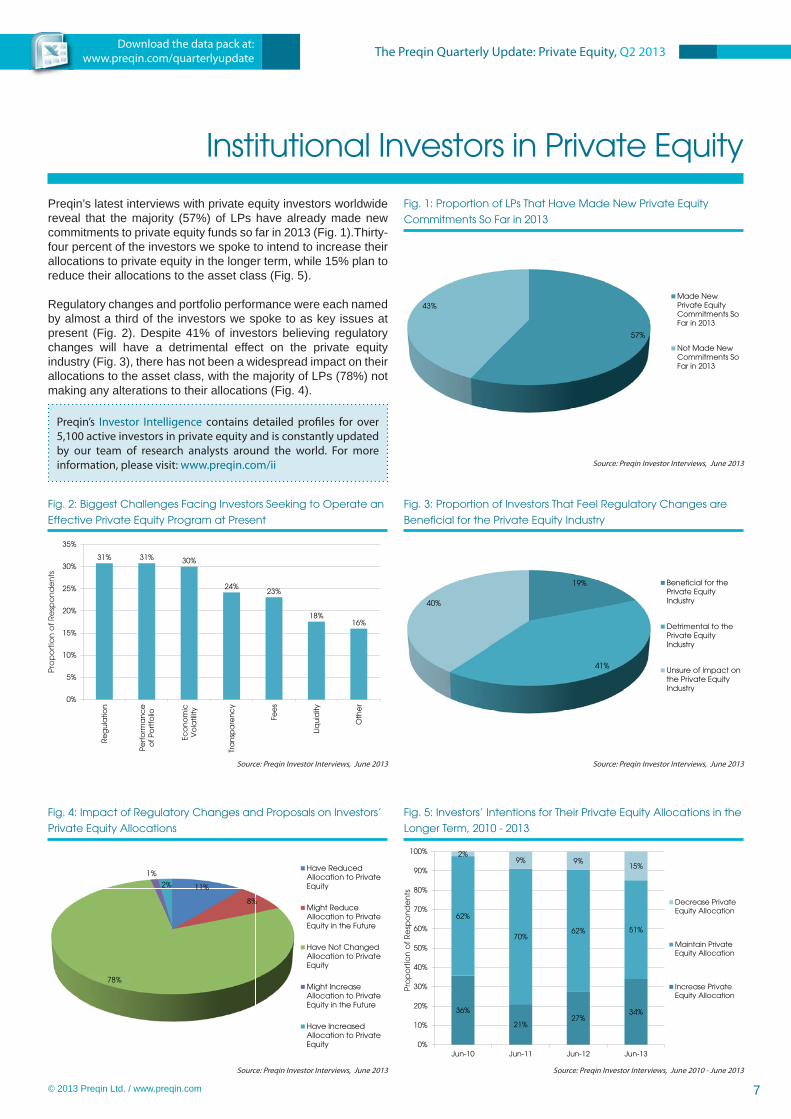
Preqin’s latest interviews with private equity investors worldwide reveal that the majority (57%) of LPs have already made new commitments to private equity funds so far in 2013 (Fig. 1).Thirty-four percent of the investors we spoke to intend to increase their allocations to private equity in the longer term, while 15% plan to reduce their allocations to the asset class (Fig. 5).
Regulatory changes and portfolio performance were each named by almost a third of the investors we spoke to as key issues at present (Fig. 2). Despite 41% of investors believing regulatory changes will have a detrimental effect on the private equity industry (Fig. 3), there has not been a widespread impact on their allocations to the asset class, with the majority of LPs (78%) not making any alterations to their allocations (Fig. 4).
Fig. 2: Biggest Challenges Facing Investors Seeking to Operate an
Effective Private Equity Program at Present
Source: Preqin Investor Interviews, June 2013
31% 31% 30%
24%23%
18%16%
0%
5%
10%
15%
20%
25%
30%
35%
Re
gu
latio
n
Pe
rfo
rma
nc
eo
f P
ort
folio
Eco
no
mic
Vo
latil
ity
Tra
nsp
are
nc
y
Fee
s
Liq
uid
ity
Oth
er
Fig. 3: Proportion of Investors That Feel Regulatory Changes are
Beneficial for the Private Equity Industry
Source: Preqin Investor Interviews, June 2013
19%
41%
40%
Beneficial for thePrivate EquityIndustry
Detrimental to thePrivate EquityIndustry
Unsure of Impact onthe Private EquityIndustry
Pro
po
rtio
n o
f R
esp
on
de
nts
Fig. 4: Impact of Regulatory Changes and Proposals on Investors’
Private Equity Allocations
Source: Preqin Investor Interviews, June 2013
11%
8%
78%
1%
2%
Have ReducedAllocation to PrivateEquity
Might ReduceAllocation to PrivateEquity in the Future
Have Not ChangedAllocation to PrivateEquity
Might IncreaseAllocation to PrivateEquity in the Future
Have IncreasedAllocation to PrivateEquity
Fig. 5: Investors’ Intentions for Their Private Equity Allocations in the
Longer Term, 2010 - 2013
Source: Preqin Investor Interviews, June 2010 - June 2013
36%
21%27%
34%
62%
70%62% 51%
2%9% 9%
15%
0%
10%
20%
30%
40%
50%
60%
70%
80%
90%
100%
Jun-10 Jun-11 Jun-12 Jun-13
Decrease PrivateEquity Allocation
Maintain PrivateEquity Allocation
Increase PrivateEquity Allocation
Preqin’s Investor Intelligence contains detailed profi les for over 5,100 active investors in private equity and is constantly updated by our team of research analysts around the world. For more information, please visit: www.preqin.com/ii
Pro
po
rtio
n o
f R
esp
on
de
nts

8
The Preqin Quarterly Update: Private Equity, Q2 2013
© 2013 Preqin Ltd. / www.preqin.com
Download the data pack at:www.preqin.com/quarterlyupdate
Buyout Deals
Fig. 1: Quarterly Number and Aggregate Value of Private Equity-
Backed Buyout Deals Globally, Q1 2006 - Q2 2013
Source: Preqin Buyout Deals Analyst
0
50
100
150
200
250
300
0
200
400
600
800
1,000
1,200
Q1
Q2
Q3
Q4
Q1
Q2
Q3
Q4
Q1
Q2
Q3
Q4
Q1
Q2
Q3
Q4
Q1
Q2
Q3
Q4
Q1
Q2
Q3
Q4
Q1
Q2
Q3
Q4
Q1
Q2
2006 2007 2008 2009 2010 2011 2012 2013
No. of Deals Aggregate Deal Value ($bn)
A total of 622 private equity-backed buyout deals were announced globally in Q2 2013, with an aggregate value of $62bn (Fig. 1). This represents a 28% decrease from the $86bn witnessed during Q1 2013. North American deals accounted for 46% of aggregate deal value in Q2 2013, while European deals accounted for 47% (Fig. 2). The largest deal announced in the quarter was the $6.9bn privatization of BMC Software (Fig. 4).
Three-hundred and thirty private equity-backed buyout exits were announced during Q2 2013, with an aggregate value of $93bn; this represents an 86% increase in the aggregate value of exits compared to Q1 2013 (Fig. 3). Q2 2013 witnessed one of the highest quarterly aggregate exit values in the period since 2006, second only to Q2 2011 where 364 exits were valued at $128bn.
No
. of
De
als
Fig. 2: Quarterly Aggregate Value of Private Equity-Backed Buyout
Deals by Region, Q1 2008 - Q2 2013
Source: Preqin Buyout Deals Analyst
0
10
20
30
40
50
60
70
80
Q1 Q2 Q3 Q4 Q1 Q2 Q3 Q4 Q1 Q2 Q3 Q4 Q1 Q2 Q3 Q4 Q1 Q2 Q3 Q4 Q1 Q2
2008 2009 2010 2011 2012 2013
North America Europe Asia Rest of World
Fig. 3: Global Number of Private Equity-Backed Buyout Exits by
Type and Aggregate Exit Value, Q1 2006 - Q2 2013
Source: Preqin Buyout Deals Analyst
0
20
40
60
80
100
120
140
0
50
100
150
200
250
300
350
400
Q1
Q2
Q3
Q4
Q1
Q2
Q3
Q4
Q1
Q2
Q3
Q4
Q1
Q2
Q3
Q4
Q1
Q2
Q3
Q4
Q1
Q2
Q3
Q4
Q1
Q2
Q3
Q4
Q1
Q2
2006 2007 2008 2009 2010 2011 2012 2013
IPO Restructuring Sale to GP Trade Sale Aggregate Exit Value ($bn)
Ag
gre
ga
te D
ea
l Va
lue
($b
n)
Ag
gre
ga
te D
ea
l Va
lue
($bn
)
No
. of
Exits
Ag
gre
ga
te Exit V
alu
e ($b
n)
Fig. 4: 10 Largest Private Equity-Backed Buyout Deals Announced in Q2 2013
Firm Deal Date Investment Type
Deal Size (mn) Deal Status Investors Bought From/Exiting Company Location Primary
Industry
BMC Software May-13 Public To Private 6,900 USD Announced Bain Capital, GIC Special Investments, Golden
Gate Capital, Insight Venture Partners - US Software
Springer SBM Jun-13 Buyout 3,300 EUR Announced BC Partners EQT Partners, Government of Singapore Investment Corporation (GIC) Germany Publishing
ista Apr-13 Buyout 3,100 EUR Announced CVC Capital Partners Charterhouse Capital Partners Germany Energy
CeramTec GmbH Jun-13 Buyout 1,490 EUR Announced Cinven Rockwood Holdings Germany Manufacturing
Vue Entertainment Jun-13 Buyout 935 GBP Announced Alberta Investment Management Corporation, OMERS Private Equity Doughty Hanson & Co UK Entertainment
CSC ServiceWorks Inc. May-13 Merger 1,440 USD Announced AIR-Serv Holding, LLC., Coinmach, Pamplona
Capital Management - US Industrial
Befesa Medio Ambiente Apr-13 Buyout 1,075 EUR Announced Triton Abengoa, Qualitas Equity Partners Spain Environmental
Services
Allfl ex May-13 Buyout 1,300 USD Announced BC Partners Electra Partners, Intermediate Capital Group France Manufacturing
National Financial Partners Corp. Apr-13 Public To
Private 1,300 USD Completed Madison Dearborn Partners - US Financial Services
PRA International Jun-13 Buyout 1,300 USD Announced Kohlberg Kravis Roberts Caisse de depot et placement du Quebec, Genstar Capital Partners US Medical
Technologies
Source: Preqin Buyout Deals Analyst
Analyze over 30,000 private equity buyout deals globally using Preqin’s Buyout Deals Analyst. For more information, please visit: www.preqin.com/buyoutdeals

9
The Preqin Quarterly Update: Private Equity, Q2 2013
© 2013 Preqin Ltd. / www.preqin.com
Download the data pack at:www.preqin.com/quarterlyupdate
Venture Capital Deals
Fig. 1: Number and Aggregate Value of Venture Capital Deals
Globally, Q1 2008 – Q2 2013
Source: Preqin Venture Deals Analyst
0
2
4
6
8
10
12
14
16
0
200
400
600
800
1,000
1,200
1,400
1,600
1,800
Q1 Q2 Q3 Q4 Q1 Q2 Q3 Q4 Q1 Q2 Q3 Q4 Q1 Q2 Q3 Q4 Q1 Q2 Q3 Q4 Q1 Q2
2008 2009 2010 2011 2012 2013
No. of Deals Aggregate Deal Value ($bn)
Q2 2013 saw 1,330 venture capital fi nancings announced globally, valued at an aggregate $10.6bn, which represents the highest quarterly aggregate value since Q2 2012 (Fig. 1). North America saw the highest number of venture capital deals announced, with 815 fi nancings in Q2 2013 (Fig. 2). The number of fi nancings in China fell to its lowest level in the period since 2008, with just 22 deals in the quarter. The $170mn fi nancing of internet company, Fanatics Inc., was the largest venture capital deal completed in Q2 2013 (Fig. 4).
The proportion of Angel/seed deals, Series A and Series B in Q2 2013 increased compared to last quarter (Fig. 3). Series A deals saw the most signifi cant increase, accounting for 17% of all venture capital deals in the quarter, up from 13% in Q1 2013.
No
. of
De
als
Fig. 2: Number of Venture Capital Deals by Region, Q1 2008 – Q2
2013
Source: Preqin Venture Deals Analyst
0
200
400
600
800
1,000
1,200
1,400
1,600
1,800
Q1 Q2 Q3 Q4 Q1 Q2 Q3 Q4 Q1 Q2 Q3 Q4 Q1 Q2 Q3 Q4 Q1 Q2 Q3 Q4 Q1 Q2
2008 2009 2010 2011 2012 2013
North America Europe China India Israel Other
Fig. 3: Proportion of Number of Venture Capital Deals by Stage,
Q2 2013
Source: Preqin Venture Deals Analyst
6%1%
2%1%
20%
17%
10%4%
3%
34%
3%
Add-on and Other
Grant
GrowthCapital/Expansion
PIPE
Angel/Seed
Series A/Round 1
Series B/Round 2
Series C/Round 3
Series D/Round 4and LaterUnspecified Round
Venture Debt
No
. of
De
als
Ag
gre
ga
te D
ea
l Va
lue
($bn
)
Fig. 4: 10 Largest Venture Capital Deals in Q2 2013
Portfolio Company Name
Deal Date Stage Deal Size
(mn) Investors Primary Industry Location
Fanatics, Inc. Jun-13 Unspecifi ed Round 170 USD Alibaba Group, Temasek Holdings Internet US
Fab.com Jun-13 Series D/Round 4 150 USDAndreessen Horowitz, Atomico, DOCOMO Capital, ITOCHU
Corporation, Menlo Ventures, Pinnacle Ventures, RTP Ventures, Tencent
Internet US
Intrexon Corporation May-13 Series F/Round 6 150 USD Third Security Biotechnology US
Lamoda Jun-13 Unspecifi ed Round 130 USD Access Industries, Summit Partners, Tengelmann Group Internet Russia
Bloom Energy May-13 Series G/Round 7 130 USD Credit Suisse Clean Technology US
ShanghaiMed Healthcare, Inc. Apr-13 Growth Capital/Expansion 100 USD Goldman Sachs Merchant Banking Division, Government of
Singapore Investment Corporation (GIC) Healthcare China
Lazada Jun-13 Unspecifi ed Round 100 USD Holtzbrinck Ventures, Kinnevik, Summit Partners, Tengelmann Group, Verlinvest Internet Indonesia
Zalora May-13 Unspecifi ed Round 100 USD Kinnevik, Rocket Internet, Summit Partners, Tengelmann Group, Verlinvest Internet Singapore
Acumen Brands, Inc. Apr-13 Growth Capital/Expansion 83 USD General Atlantic Internet US
Hyperoptic May-13 Unspecifi ed Round 50 GBP Quantum Strategic Partners Ltd. Telecoms UK
Source: Preqin Venture Deals Analyst
Examine details for over 44,000 venture capital deals globally using Preqin’s Venture Deals Analyst. For more information, please visit: www.preqin.com/vcdeals
10
The Preqin Quarterly Update: Private Equity, Q2 2013
© 2013 Preqin Ltd. / www.preqin.com
Download the data pack at:www.preqin.com/quarterlyupdate
Fund Performance
Fig. 1: Private Equity Dry Powder by Fund Type, 2003 - 2013
Source: Preqin Performance Analyst
0
200
400
600
800
1,000
1,200
De
c-0
3
De
c-0
4
De
c-0
5
De
c-0
6
De
c-0
7
De
c-0
8
De
c-0
9
De
c-1
0
De
c-1
1
De
c-1
2
Jul-1
3
Buyout
DistressedPrivate Equity
Growth
Mezzanine
Real Estate
Venture Capital
Other
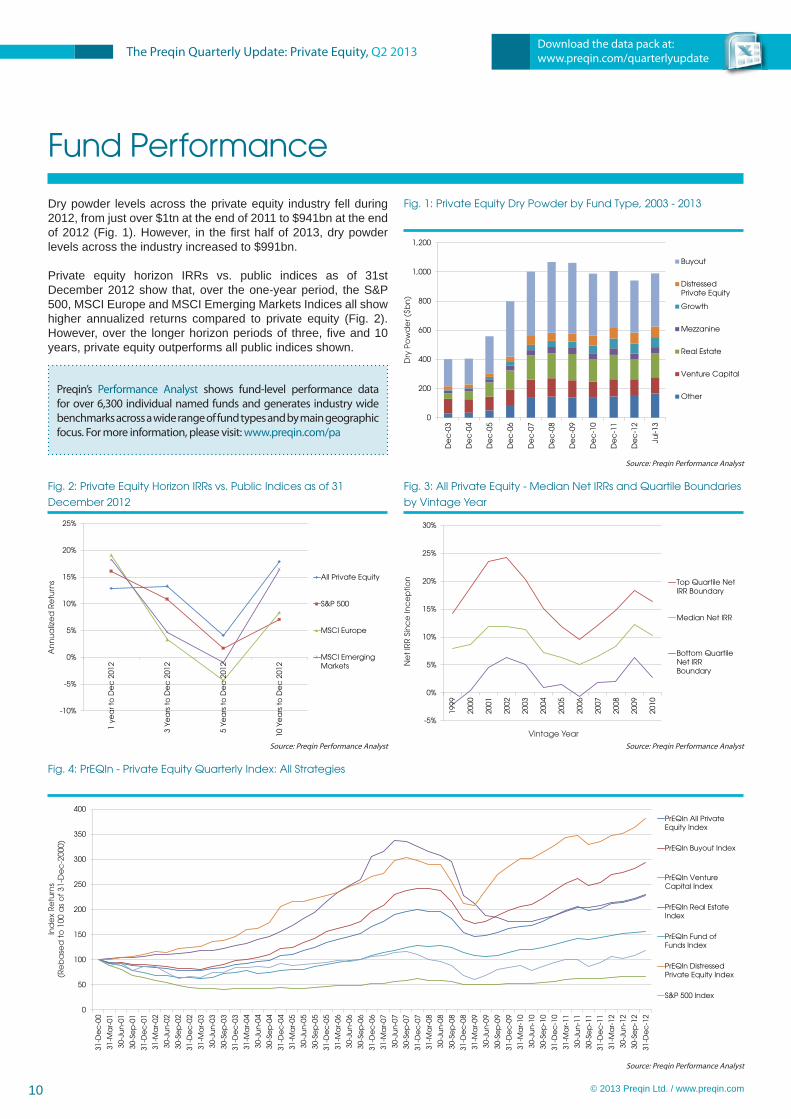
Dry powder levels across the private equity industry fell during 2012, from just over $1tn at the end of 2011 to $941bn at the end of 2012 (Fig. 1). However, in the fi rst half of 2013, dry powder levels across the industry increased to $991bn.
Private equity horizon IRRs vs. public indices as of 31st December 2012 show that, over the one-year period, the S&P 500, MSCI Europe and MSCI Emerging Markets Indices all show higher annualized returns compared to private equity (Fig. 2). However, over the longer horizon periods of three, fi ve and 10 years, private equity outperforms all public indices shown.
Preqin’s Performance Analyst shows fund-level performance data for over 6,300 individual named funds and generates industry wide benchmarks across a wide range of fund types and by main geographic focus. For more information, please visit: www.preqin.com/pa
Dry
Po
wd
er (
$bn
)
Fig. 2: Private Equity Horizon IRRs vs. Public Indices as of 31
December 2012
Source: Preqin Performance Analyst
-10%
-5%
0%
5%
10%
15%
20%
25%
1 ye
ar t
o D
ec
201
2
3 Ye
ars
to
De
c 2
012
5 Ye
ars
to
De
c 2
012
10 Y
ea
rs t
o D
ec
201
2
All Private Equity
S&P 500
MSCI Europe
MSCI EmergingMarkets
Fig. 3: All Private Equity - Median Net IRRs and Quartile Boundaries
by Vintage Year
Source: Preqin Performance Analyst
-5%
0%
5%
10%
15%
20%
25%
30%
1999
2000
2001
2002
2003
2004
2005
2006
2007
2008
2009
2010
Top Quartile NetIRR Boundary
Median Net IRR
Bottom QuartileNet IRRBoundary
An
nu
aliz
ed
Re
turn
s
Ne
t IR
R S
inc
e In
ce
ptio
n
Vintage Year
Fig. 4: PrEQIn - Private Equity Quarterly Index: All Strategies
Source: Preqin Performance Analyst
0
50
100
150
200
250
300
350
400
31-D
ec
-00
31-M
ar-
01
30-J
un
-01
30-S
ep
-01
31-D
ec
-01
31-M
ar-
02
30-J
un
-02
30-S
ep
-02
31-D
ec
-02
31-M
ar-
03
30-J
un
-03
30-S
ep
-03
31-D
ec
-03
31-M
ar-
04
30-J
un
-04
30-S
ep
-04
31-D
ec
-04
31-M
ar-
05
30-J
un
-05
30-S
ep
-05
31-D
ec
-05
31-M
ar-
06
30-J
un
-06
30-S
ep
-06
31-D
ec
-06
31-M
ar-
07
30-J
un
-07
30-S
ep
-07
31-D
ec
-07
31-M
ar-
08
30-J
un
-08
30-S
ep
-08
31-D
ec
-08
31-M
ar-
09
30-J
un
-09
30-S
ep
-09
31-D
ec
-09
31-M
ar-
10
30-J
un
-10
30-S
ep
-10
31-D
ec
-10
31-M
ar-
11
30-J
un
-11
30-S
ep
-11
31-D
ec
-11
31-M
ar-
12
30-J
un
-12
30-S
ep
-12
31-D
ec
-12
PrEQIn All PrivateEquity Index
PrEQIn Buyout Index
PrEQIn VentureCapital Index
PrEQIn Real EstateIndex
PrEQIn Fund ofFunds Index
PrEQIn DistressedPrivate Equity Index
S&P 500 Index
Ind
ex
Re
turn
s(R
eb
ase
d t
o 1
00 a
s o
f 31
-De
c-2
000)
11
The Preqin Quarterly Update: Private Equity, Q2 2013
© 2013 Preqin Ltd. / www.preqin.com
Download the data pack at:www.preqin.com/quarterlyupdate
Secondaries
Fig. 1: Likelihood of Investors Purchasing Private Equity Fund
Interests on the Secondary Market over the Next 24 Months
Source: Preqin Secondary Market Monitor
2%
7%
16%
75%
Highly Likely
Opportunistic
Possible
Unlikely
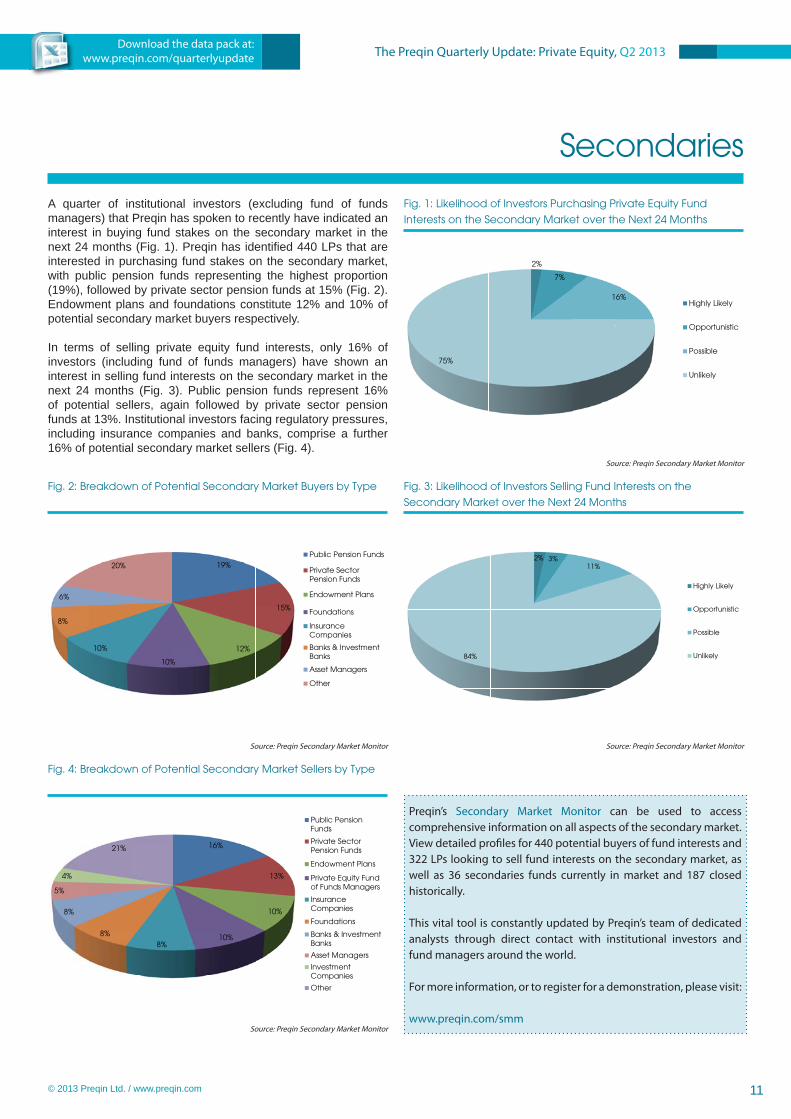
A quarter of institutional investors (excluding fund of funds managers) that Preqin has spoken to recently have indicated an interest in buying fund stakes on the secondary market in the next 24 months (Fig. 1). Preqin has identifi ed 440 LPs that are interested in purchasing fund stakes on the secondary market, with public pension funds representing the highest proportion (19%), followed by private sector pension funds at 15% (Fig. 2). Endowment plans and foundations constitute 12% and 10% of potential secondary market buyers respectively.
In terms of selling private equity fund interests, only 16% of investors (including fund of funds managers) have shown an interest in selling fund interests on the secondary market in the next 24 months (Fig. 3). Public pension funds represent 16% of potential sellers, again followed by private sector pension funds at 13%. Institutional investors facing regulatory pressures, including insurance companies and banks, comprise a further 16% of potential secondary market sellers (Fig. 4).
Fig. 2: Breakdown of Potential Secondary Market Buyers by Type
Source: Preqin Secondary Market Monitor
19%
15%
12%
10%
10%
8%
6%
20%
Public Pension Funds
Private SectorPension Funds
Endowment Plans
Foundations
InsuranceCompanies
Banks & InvestmentBanks
Asset Managers
Other
Fig. 3: Likelihood of Investors Selling Fund Interests on the
Secondary Market over the Next 24 Months
Source: Preqin Secondary Market Monitor
2% 3%11%
84%
Highly Likely
Opportunistic
Possible
Unlikely
Preqin’s Secondary Market Monitor can be used to access comprehensive information on all aspects of the secondary market. View detailed profi les for 440 potential buyers of fund interests and 322 LPs looking to sell fund interests on the secondary market, as well as 36 secondaries funds currently in market and 187 closed historically.
This vital tool is constantly updated by Preqin’s team of dedicated analysts through direct contact with institutional investors and fund managers around the world.
For more information, or to register for a demonstration, please visit:
www.preqin.com/smm
Fig. 4: Breakdown of Potential Secondary Market Sellers by Type
Source: Preqin Secondary Market Monitor
16%
13%
10%
10%8%
8%
8%
5%
4%
21%
Public PensionFunds
Private SectorPension Funds
Endowment Plans
Private Equity Fundof Funds Managers
InsuranceCompanies
Foundations
Banks & InvestmentBanks
Asset Managers
InvestmentCompanies
Other

The Preqin Quarterly Update:Private Equity, Q2 2013
alternative assets. intelligent data.
Preqin Private Equity Online
With global coverage and detailed information on all aspects of the private equity asset class, Preqin’s industry-leading Private Equity Online services keep you up to date on all the latest developments in the private equity universe.
Source new investors for funds and co-investments
Find the most relevant investors, with access to detailed profi les for over 5,100 institutional investors actively investing in private equity, including future fund searches and mandates, direct contact information and sample investments.
Identify potential investment opportunities
View in-depth profi les for over 1,900 unlisted private equity funds currently in the market, including information on investment strategy, geographic focus, key fundraising data, service providers used and sample investors.
Find active fund managers in private equity
Search for fi rms actively targeting private equity investments. View information on key contacts, fi rm fundraising and performance history, and applied strategies of the fi rm when investing in portfolio companies and assets.
Analyze the latest private equity fundraising activity
See which fi rms are currently on the road raising a private equity fund and which will be coming to market soon. Analyze fundraising over time by fund strategy, property type and location.
Benchmark performance
Identify which fund managers have the best track records, with performance benchmarks for private equity funds and performance details for over 6,300 individual named funds.
Examine fund terms
Use our unique Fund Terms Calculator to model fee changes and see: what are the typical terms that a private equity fund charges? What are the implications of making changes to different fees? How do these fees vary between fund types and geographies?
If you want any further information, or would like to apply for a demo of our
products, please contact us:
New York:
One Grand Central Place60 E 42nd Street
Suite 2544, New YorkNY 10165
Tel: +1 212 350 0100Fax: +1 440 445 9595
London:
Equitable House47 King William Street
LondonEC4R 9AF
Tel: +44 (0)20 7645 8888Fax: +44 (0)87 0330 5892
Singapore:
One Finlayson Green, #11-02 Singapore 049246
Tel: +65 6305 2200Fax: +65 6491 5365
San Francisco:
580 California StreetSuite 1638, San Francisco
CA 94104
Tel: +1 415 635 3580Fax: +1 440 445 9595
Email: [email protected]: www.preqin.com
Find out how Preqin’s range of products and services can help you:
www.preqin.com/privateequity


